Article

A Comparative Study on Blast-Resistant Performance of Steel and PVA Fiber-Reinforced Concrete: Experimental and Numerical Analyses

1
Department of Civil Engineering, Nanjing University of Science and Technology, Nanjing 210094, China
2
College of Mechanical and Vehicle Engineering, Taiyuan University of Technology, Taiyuan 030024, China
3
National Key Laboratory of Transient Physics, Nanjing University of Science and Technology, Nanjing 210094, China
*
Authors to whom correspondence should be addressed.
Crystals 2020, 10(8), 707; https://doi.org/10.3390/cryst10080707
Submission received: 15 July 2020 / Revised: 10 August 2020 / Accepted: 14 August 2020 / Published: 16 August 2020
(This article belongs to the Special Issue Numerical Study of Concrete)

Abstract

:
This paper deals with the blast-resistant performance of steel fiber-reinforced concrete (SFRC) and polyvinyl alcohol (PVA) fiber-reinforced concrete (PVA-FRC) panels with a contact detonation test both experimentally and numerically. With 2% fiber volumetric content, SFRC and PVA-FRC specimens were prepared and comparatively tested in comparison with plain concrete (PC). SFRC was found to exhibit better blast-resistant performance than PVA-FRC. The dynamic mechanical responses of FRC panels were numerically studied with Lattice Discrete Particle Model-Fiber (LDPM-F) which was recently developed to simulate the meso-structure of quasi-brittle materials. The effect of dispersed fibers was also introduced in this discrete model as a natural extension. Calibration of LDPM-F model parameters was achieved by fitting the compression and bending responses. A numerical model of FRC contact detonation was then validated against the blast test results in terms of damage modes and crater dimensions. Finally, FRC panels with different fiber volumetric fractions (e.g., 0.5%, 1.0% and 1.5%) under blast loadings were further investigated with the validated LDPM-F blast model. The numerical predictions shed some light on the fiber content effect on the FRC blast resistance performance.

1. Introduction

Recent terrorist attacks in Boston (2013), Moscow (2011), London (2005), Madrid (2004), New York (2001) and explosion accidents in Beirut (2020), Tianjin (2015) and San Juan Nico (1984) indicate great vulnerability of concrete material civil infrastructures to possible explosive loadings [1,2,3]. To protect civilian lives from these threats and casualties, civil infrastructures should provide good resistant performance against extreme loadings such as impact and blast. As the most widely used construction material, plain concrete exhibits high compressive strength but relatively low tensile strength, resulting in poor energy absorption capacity under extreme dynamic loadings. Incorporating randomly distributed fibers into the cementitious matrix is one effective way to overcome this defect [4,5,6]. The dispersed fibers in the matrix resist the crack initiation and delay its propagation, which attribute to the composite material ductility. Hence, fiber-reinforced concrete (FRC) shows novel tension and bending performance, leading to enhanced energy absorption capacity under blast loadings [7,8,9].
Many different types of fibers have been chosen as reinforcements added into the cementitious matrix [10]. Some are high strength fibers, including steel, carbon and glass fibers, which can effectively improve the strength of concrete. While others are low strength fibers like polyvinyl alcohol (PVA) and polypropylene fibers which are more effective in ductility improvement and cracking-resistance [11,12,13]. In recent literatures, it could be found that steel fibers and PVA fibers are the most widely investigated in the field of construction materials, mainly due to their good mechanical properties, perfect bond with cementitious matrix and relative low cost. Steel fiber-reinforced concrete (SFRC), consisting of cementitious matrix and steel fibers with high tensile strength in the range of 850–2000 MPa, usually exhibits greatly boosted mechanical performance (i.e., compressive strength, tensile strength, toughness, ductility) than normal plain concrete [14,15,16]. As a special type of SFRC, ultra-high performance fiber-reinforced concrete (UHPFRC) presents great compressive strength over 160 MPa [17]. Owing to its superior qualities, SFRC provides a perfect solution for construction material for infrastructure or protective shelter, where high strength and durability properties are required. On the other hand, PVA fiber-reinforced concrete (PVA-FRC), made of cementitious matrix and oiled PVA fibers [18], shows unique tensile strain-hardening mechanical behavior, i.e., high energy absorption capacity. Therefore, PVA-FRC is also believed to resist impact and blast loadings [19]. This work chooses to comparatively investigate the blast resistance of SFRC and PVA-FRC panels.
Previously, most fiber reinforcement researches have dealt with the concrete mechanical properties influenced by the fiber incorporation [20,21,22,23]. Naaman and Najm et al. have conducted extensive works on the mechanisms of physiochemical bonding and mechanical anchorage in SFRC, while Lee et al. focused on the pullout behavior of steel fiber in SFRC [24,25,26,27]. For PVA-FRC, many studies were been carried out by using cost-effective materials or improving the material strain-hardening behavior [18,28] to keep the balance between mechanical properties and cost. Since blast tests are highly costive and even dangerous, only few works handled the blast resistance performance of FRC by analyzing the effects of fiber content and fiber type [29,30,31]. It is widely acknowledged that numerical simulation method could greatly increase research efficiency and reduce research cost. For extreme loading tests, numerical simulation could also avoid the danger from the blast experiments. Consequently, numerical modeling has become the main method studying the concrete behavior under extreme dynamic loadings [32,33].
The recently developed Lattice Discrete Particle Model-Fiber (LDPM-F) was introduced herein to investigate blast-resistant performance of FRC with different types of fiber reinforcements. LDPM was designed to simulate the meso-structure of quasi-brittle materials through a three dimensional (3D) assemblage of sphere particles [34]. As a natural extension for this discrete model to add the effect of dispersed fibers to the meso-structure, LDPM-F incorporated this effect by modeling individual fiber, randomly placed within the matrix according to a given fiber volume fraction [35]. LDPM was good at simulating various features of the mesoscale material response, including strain softening in tension, strain hardening in compression, cohesive fracturing and material compaction caused by pore collapse. Material behaviors under extreme dynamic loadings could also be well predicted by LDPM, e.g., the deep penetration in concrete, thick panel projectile perforation and Hopkinson bar tests [36].
In this work, SFRC, PVA-FRC and control plain concrete (PC) specimens were prepared and tested with compression and bending. Sequent contact detonation tests were conducted to characterize the blast resistance of SFRC and PVA-FRC. The blast simulation model with LDPM-F was established with parameters calibrated by fitting the compression and bending responses. The model validation was achieved by predicting the blast damage on the front and rear surface. Finally, behavior of FRC panels with different fiber volume ratio (e.g., 0.5%, 1.0% and 1.5%) under blast loadings were numerically investigated.

2. Experimental Program

In this section, SFRC, PVA-FRC and control PC specimens were prepared and tested with compression, bending and blast loading. For material characterization purpose, compression specimens with a dimension of 40 mm × 40 mm × 40 mm and bending specimens with a dimension of 40 mm × 40 mm × 160 mm of both FRC and PC were prepared and tested. In sequence, anti-blast specimens of FRC and PC panels were also prepared with a dimension of 600 mm × 600 mm × 100 mm, then contact detonation tests were carried out to identify their blast-resistant performance.

2.1. FRC Preparation

According to previous work [31], the mix proportion used in this work was detailed listed in Table 1. Portland cement (P.I 42.5) was used herein as cementitious material and fly ash was added as mineral active fine admixture. Ground fine quartz sand worked as fine aggregate with average diameter of 40 μ m. To improve fluidity, high-performance water-reducing agent, polycarboxylate superplasticizer (DC-WR2), was also added. For both PVA-FRC and SFRC specimens, samples were prepared by incorporating 2% volume fraction steel or PVA fibers into the fresh cementitious matrix. The fiber volume content of 2% is believed to improve the tensile property with good fluidity [31] since higher fiber fraction usually causes flowability problem. The fibers used in this work were depicted in Figure 1, whose detailed geometric information and mechanical properties were listed in Table 2.
In the preparation process, the dispersion of fibers was an important step in the mixing process, which will directly affect the strengthening and toughening effect of the fiber on the cementitious matrix [37,38,39,40]. Uneven dispersion can easily lead to performance degradation. Therefore, the influence of mixing process on dispersibility was very important. The preparation process proposed in this work was as follows: (1) First, add half of the calculated amount of water and a certain amount of superplasticizer to the measuring cup, and stir manually until completely mixed solution is formed. (2) Add cement and fly ash to the mixing container, then pouring the solution into the container, followed by a stirring cycle of the automatic stirring for 240 s (first stirring at a low speed for 60 s, then stirring at a high speed for 30 s, then pausing for 90 s, and finally stirring at a high speed for 60 s), until the mixture appears in a clear slurry state. (3) Add the quartz sand to the slurry and stir a cycle. (4) After pre-dispersion, fibers should be added into the mixing container slowly. Stirring two or three cycles until the fibers are uniformly dispersed. (5) The mixed FRC was cast and compacted, sealed with transparent plastic film. The mold was removed after air curing for 2 days, and cured in the curing room for 25 days. The test was carried out after air curing for 1 day, and the surface treatment of the specimen should be carried out before testing.

2.2. Compression and Bending Tests

The quasi-static tests, including uniaxial compression (UC) and three-point bending test, were carried out herein to investigate the fiber reinforcement effect on the compressive strength and flexural strength of FRC specimens. Each specimen was cast with three samples with the average values of the experimental results recorded for further discussion.
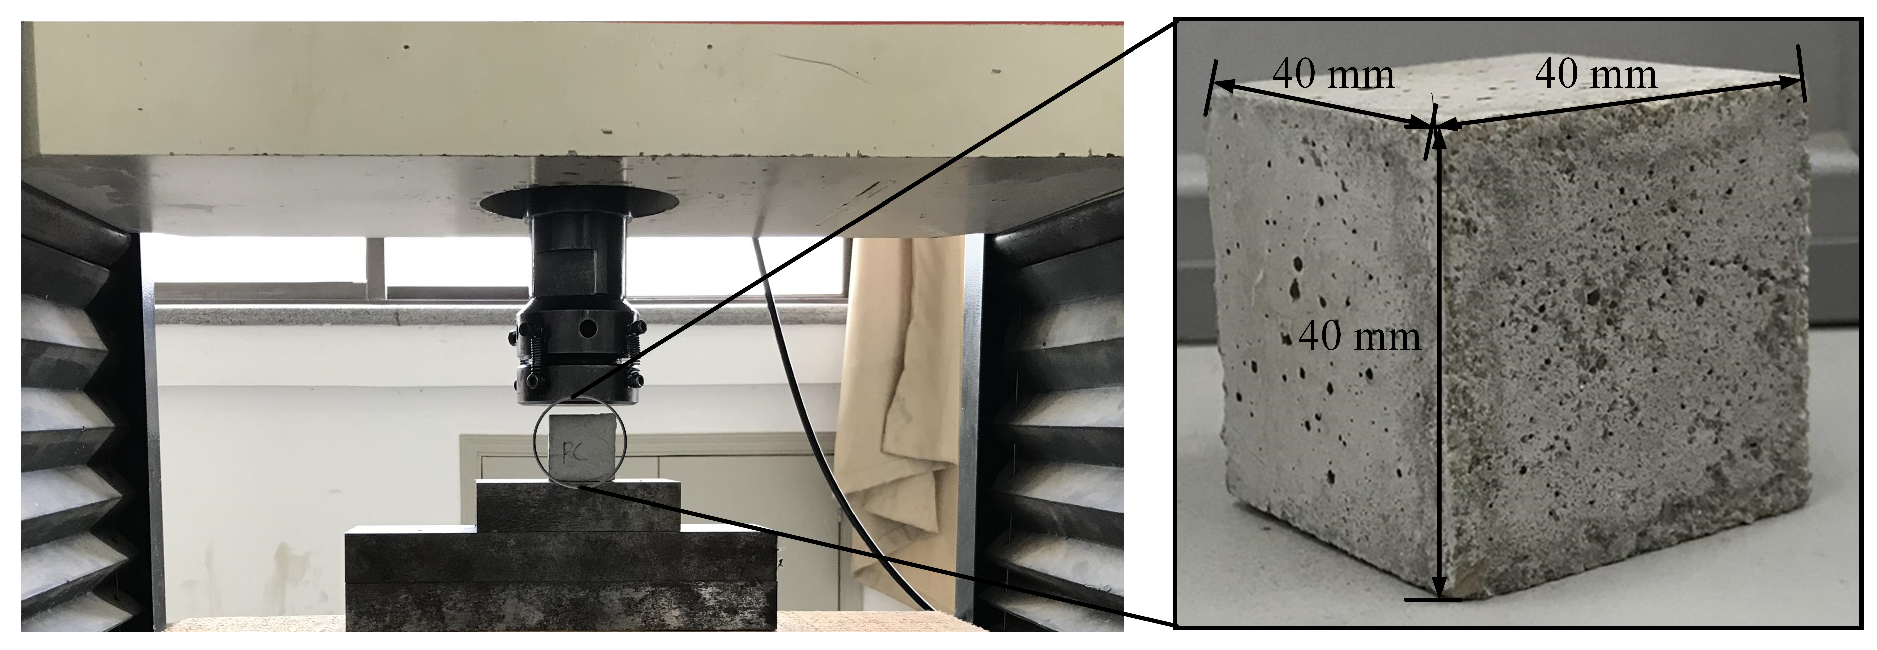
Uniaxial compressive tests were carried out with cubic specimens with 40 mm edge. The dimension of the specimen and the test setup were shown in Figure 2. The compression tests were conducted using MTS machine with controlled speed rate of 0.5 mm/min. Before testing, abrasive paper was used to smooth the surface of the specimen for the purpose of specimen complete contact with the loading plates. Thereafter, the average peak strength of the specimens was captured as listed in Table 3.
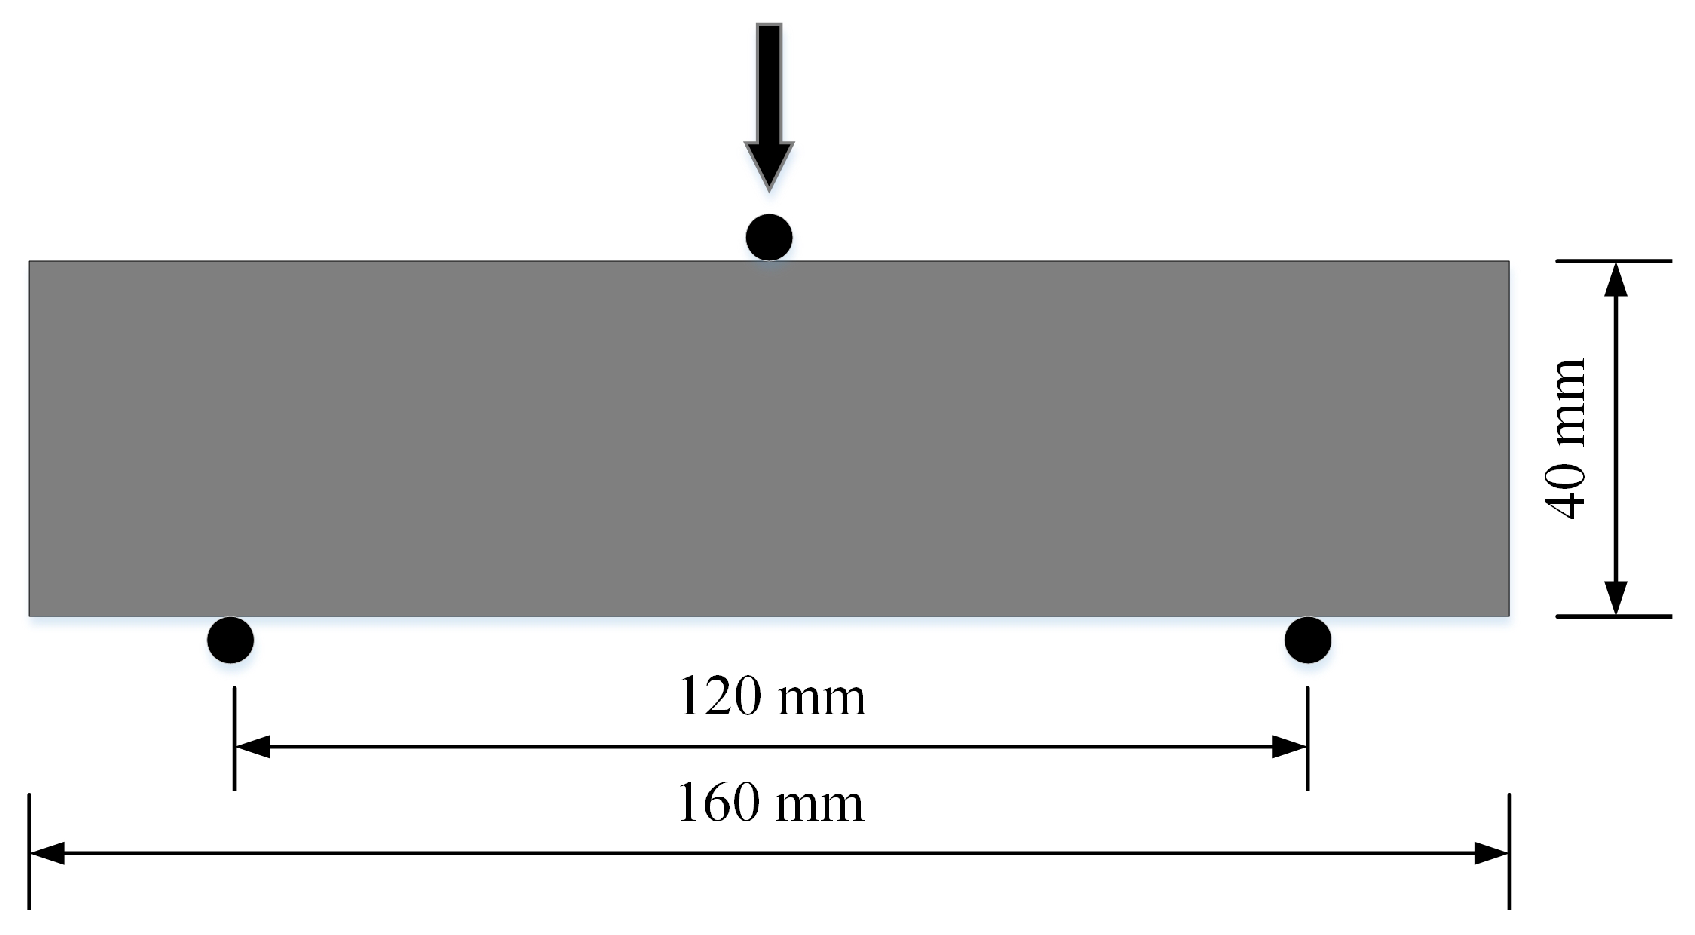
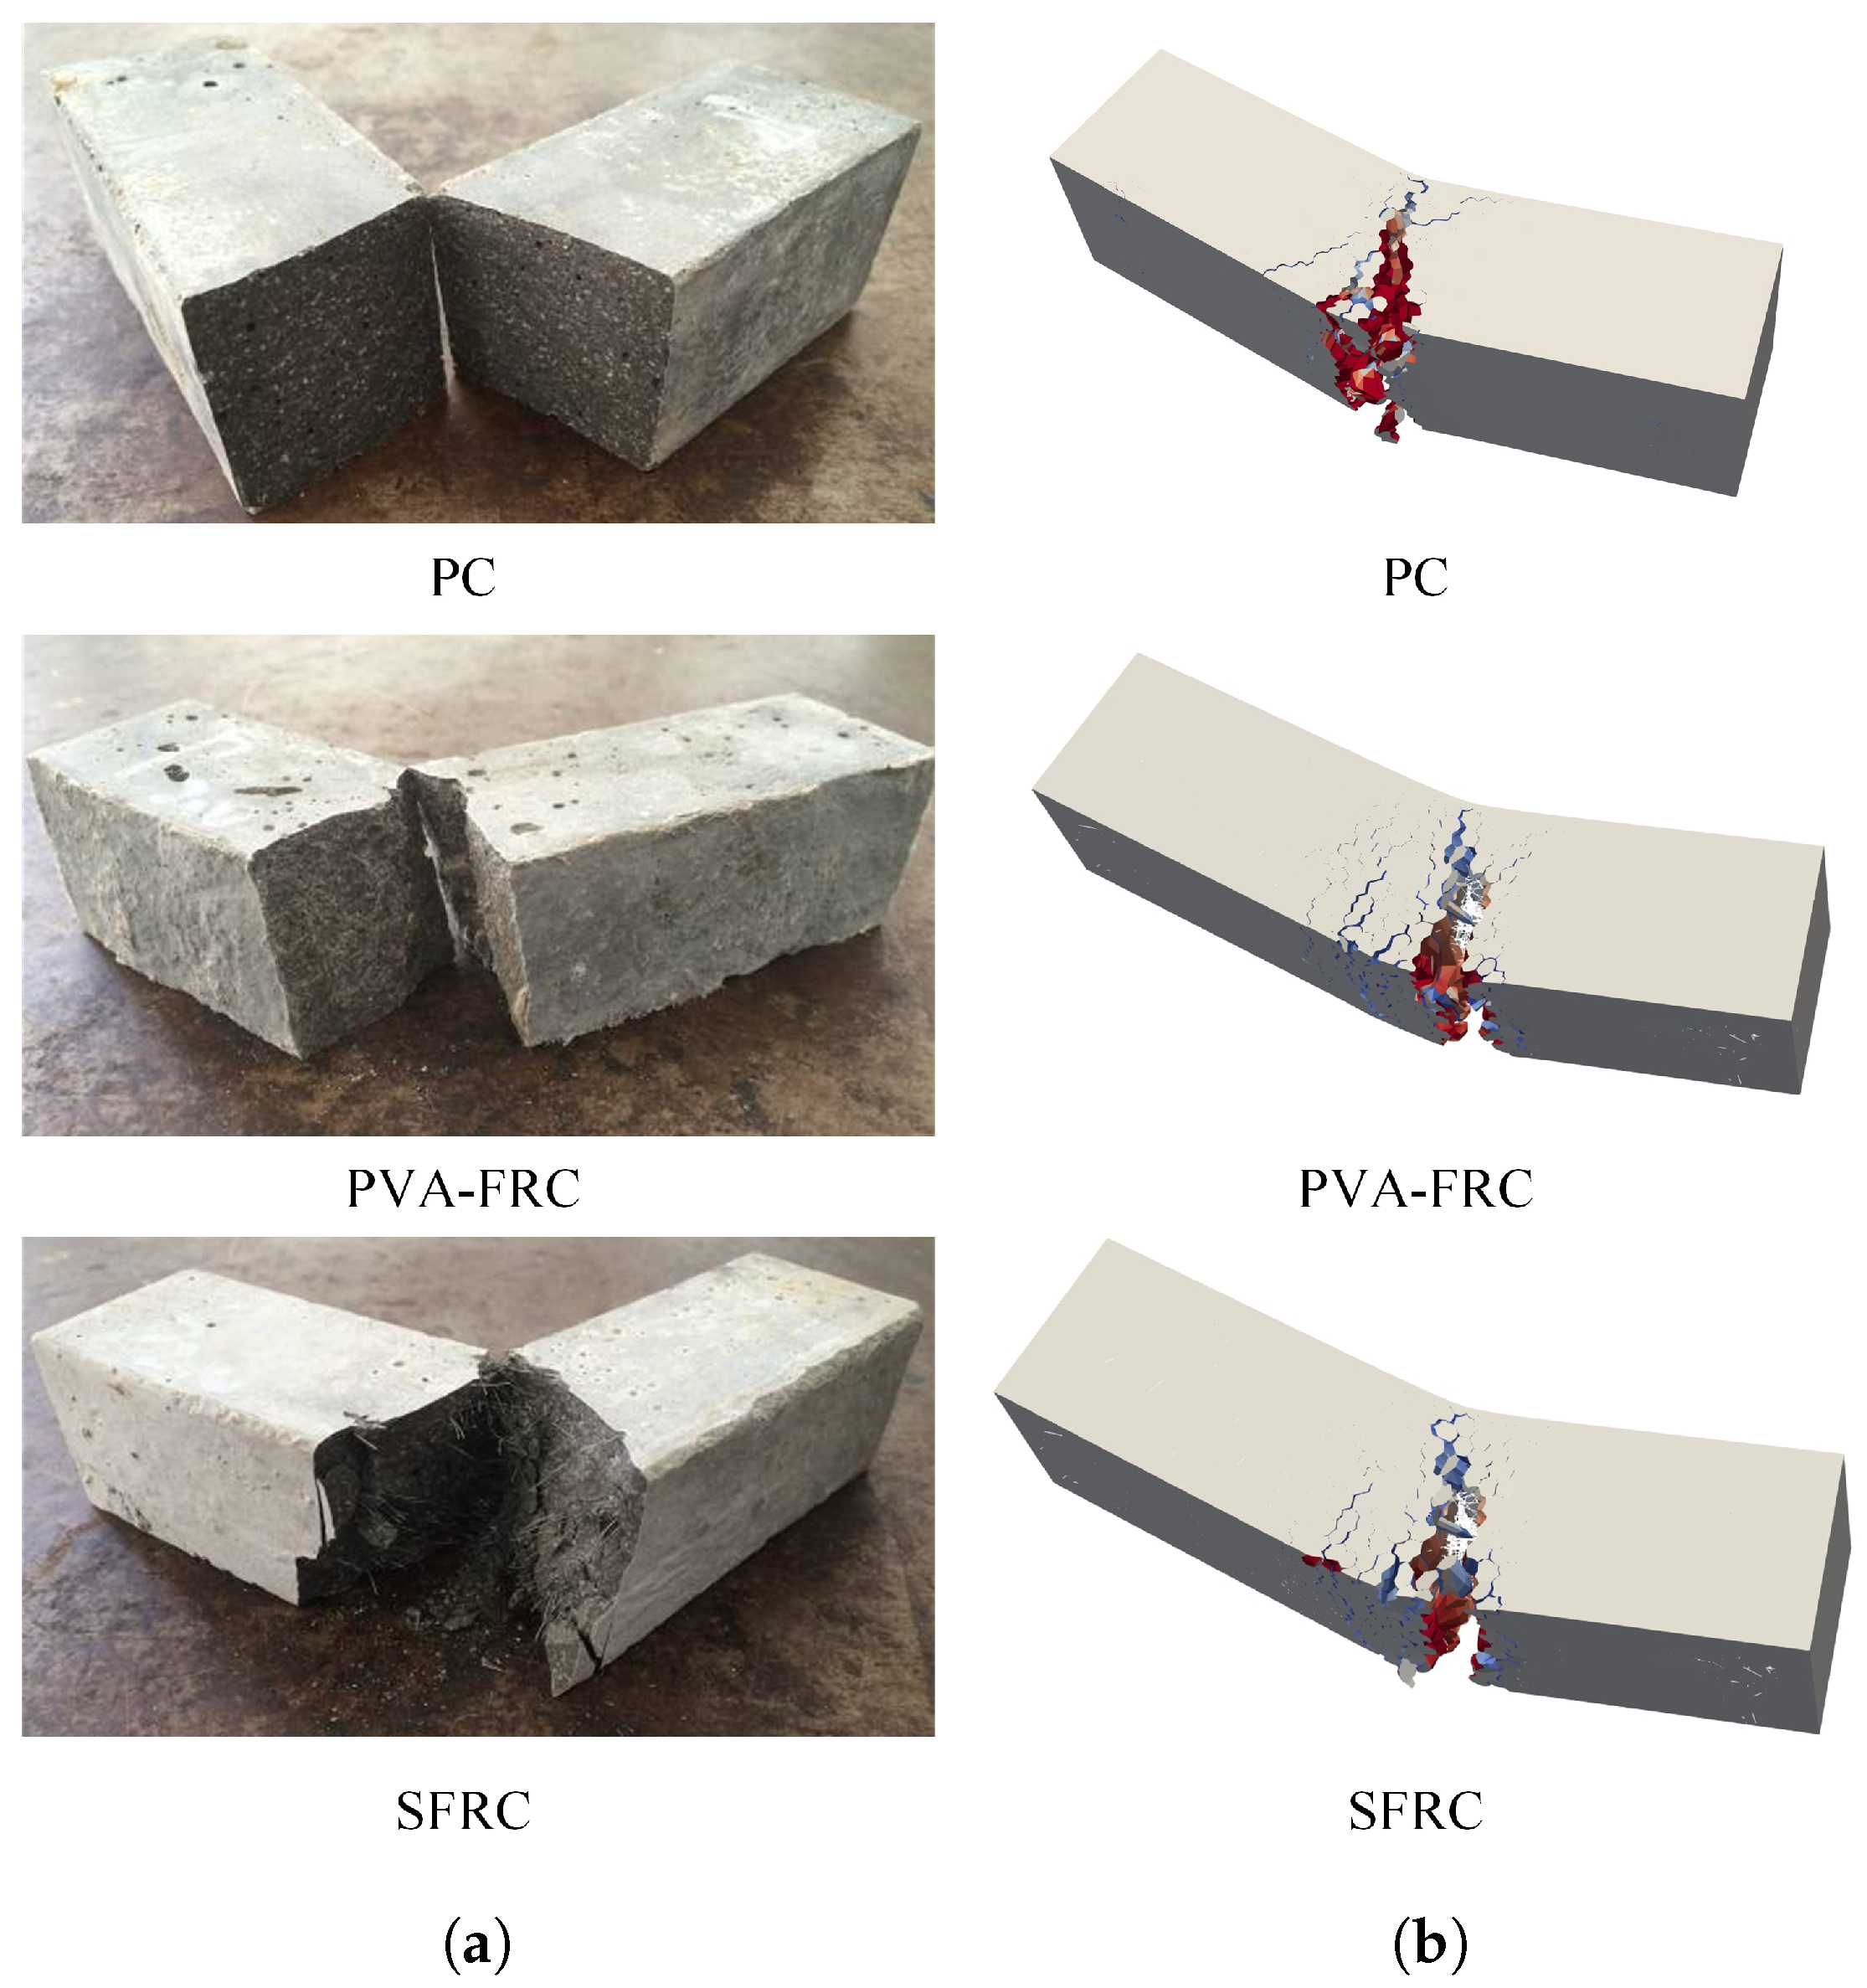
Quasi-static three-point bending test were conducted on the 40 mm × 40 mm × 160 mm specimens and the test configuration was presented in Figure 3. The span was chosen as 120 mm, following the experimental standard of mechanical properties of cement mortar [7]. The PC and FRC specimens were tested under load speed of 0.1 mm/min with the peak load values recorded. The flexural strength was calculated with f f = 3 F p l / ( 2 b d 2 ) [31], where F p is peak load, l is span length, d denotes the beam depth and b is the beam width. The average flexure strength of the specimens was listed in Table 3 and the failure modes of the specimens after tests were depicted in Figure 4a.
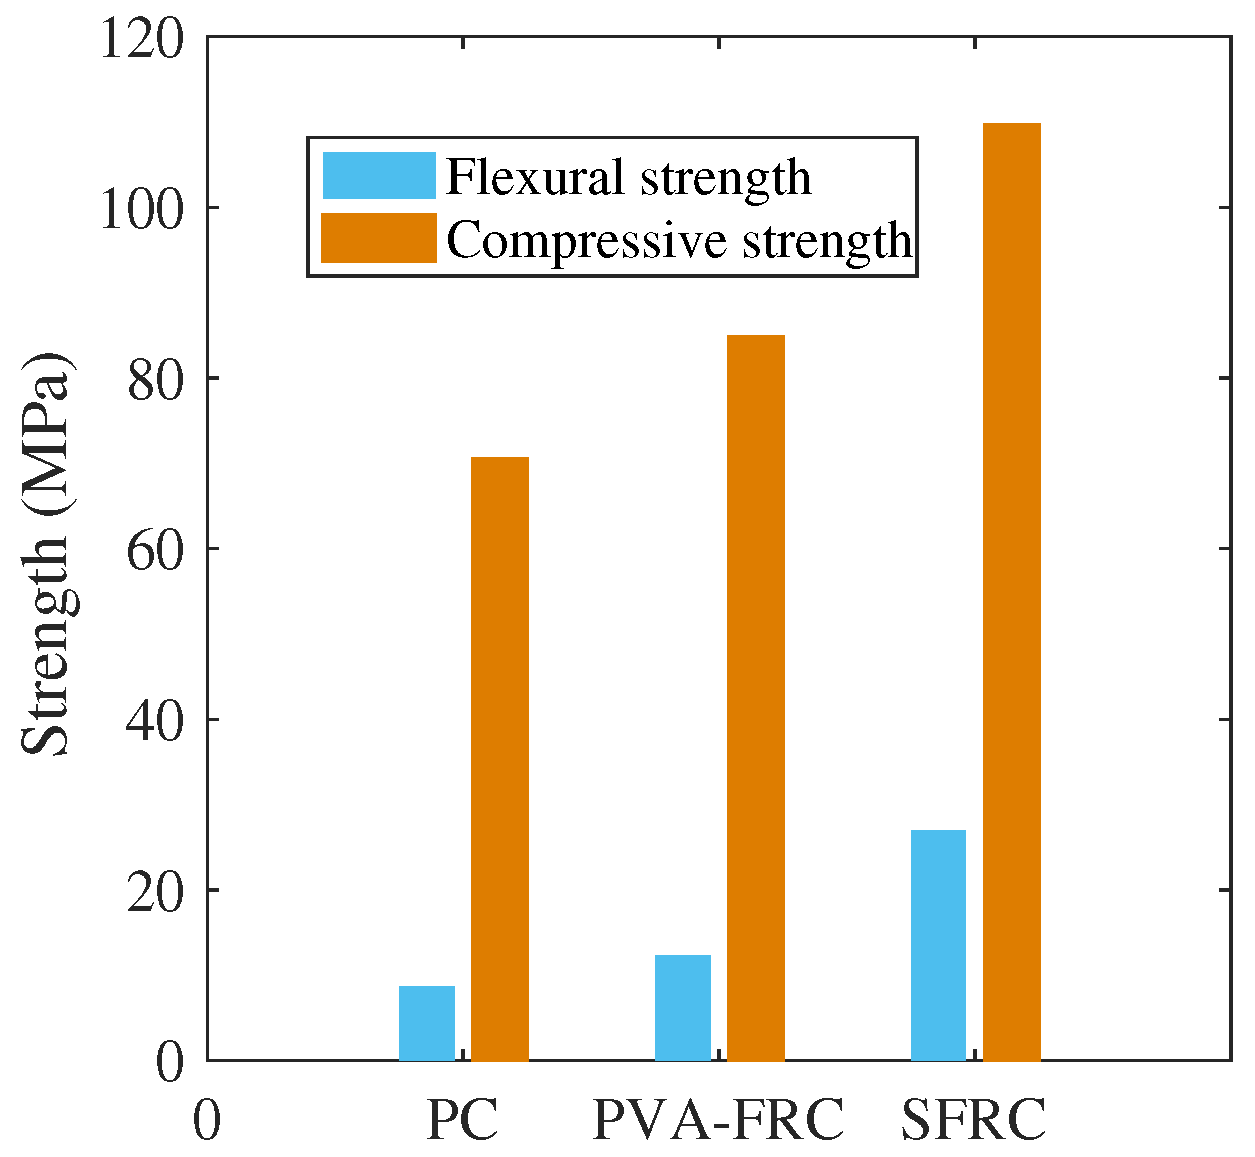
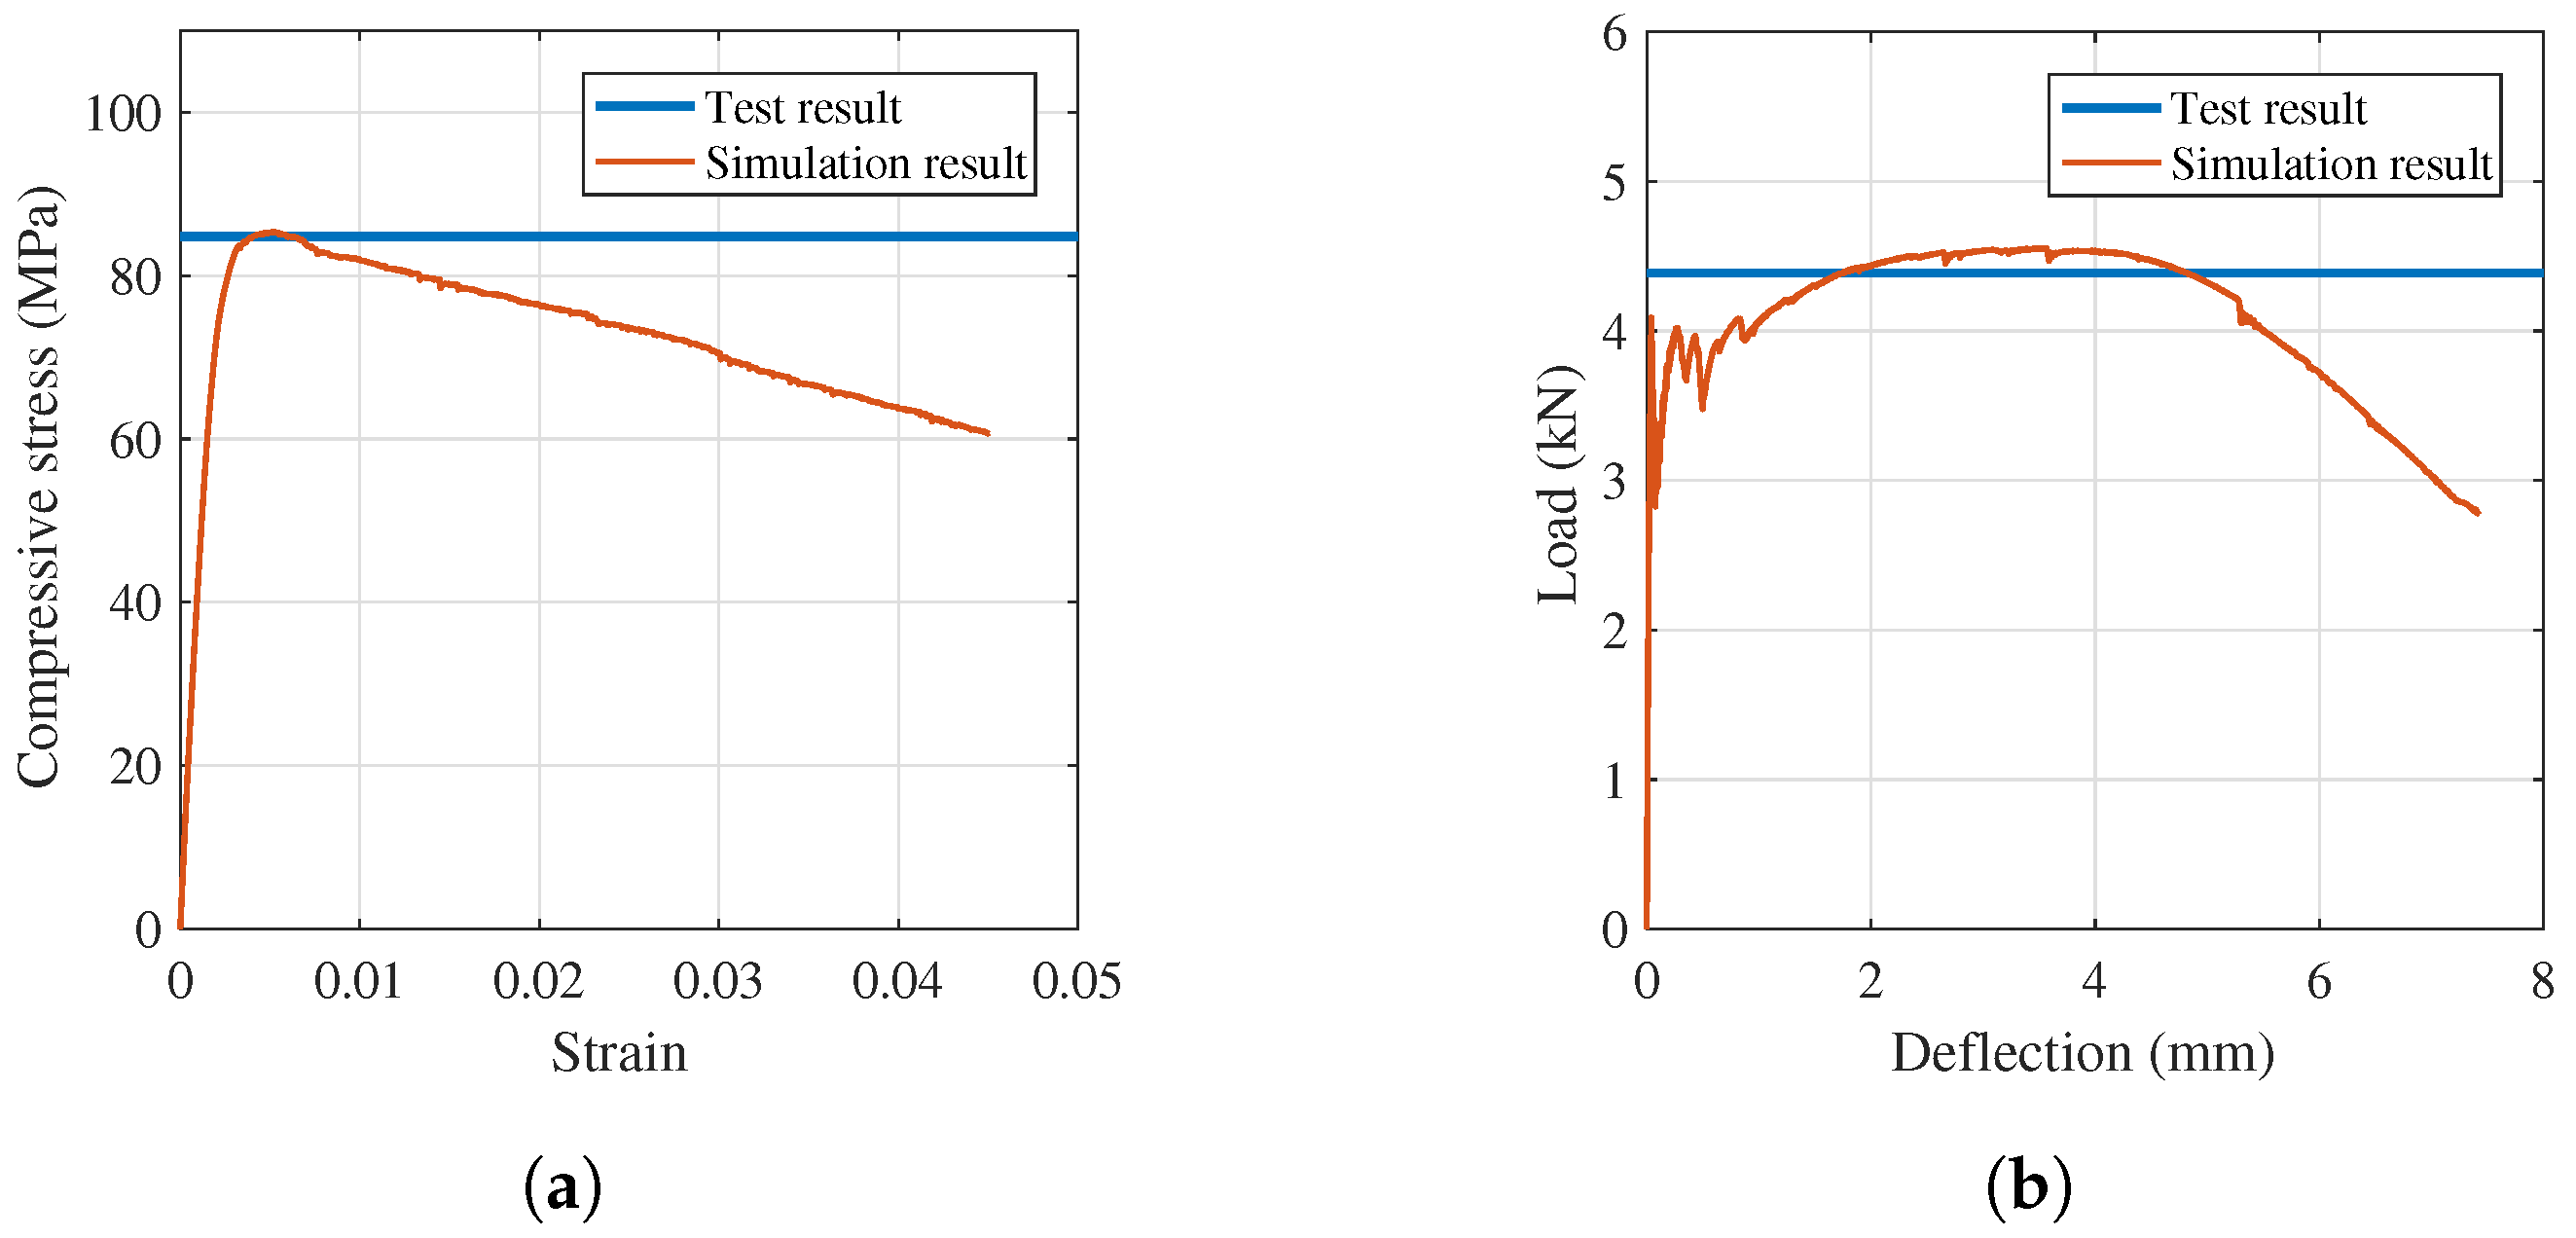
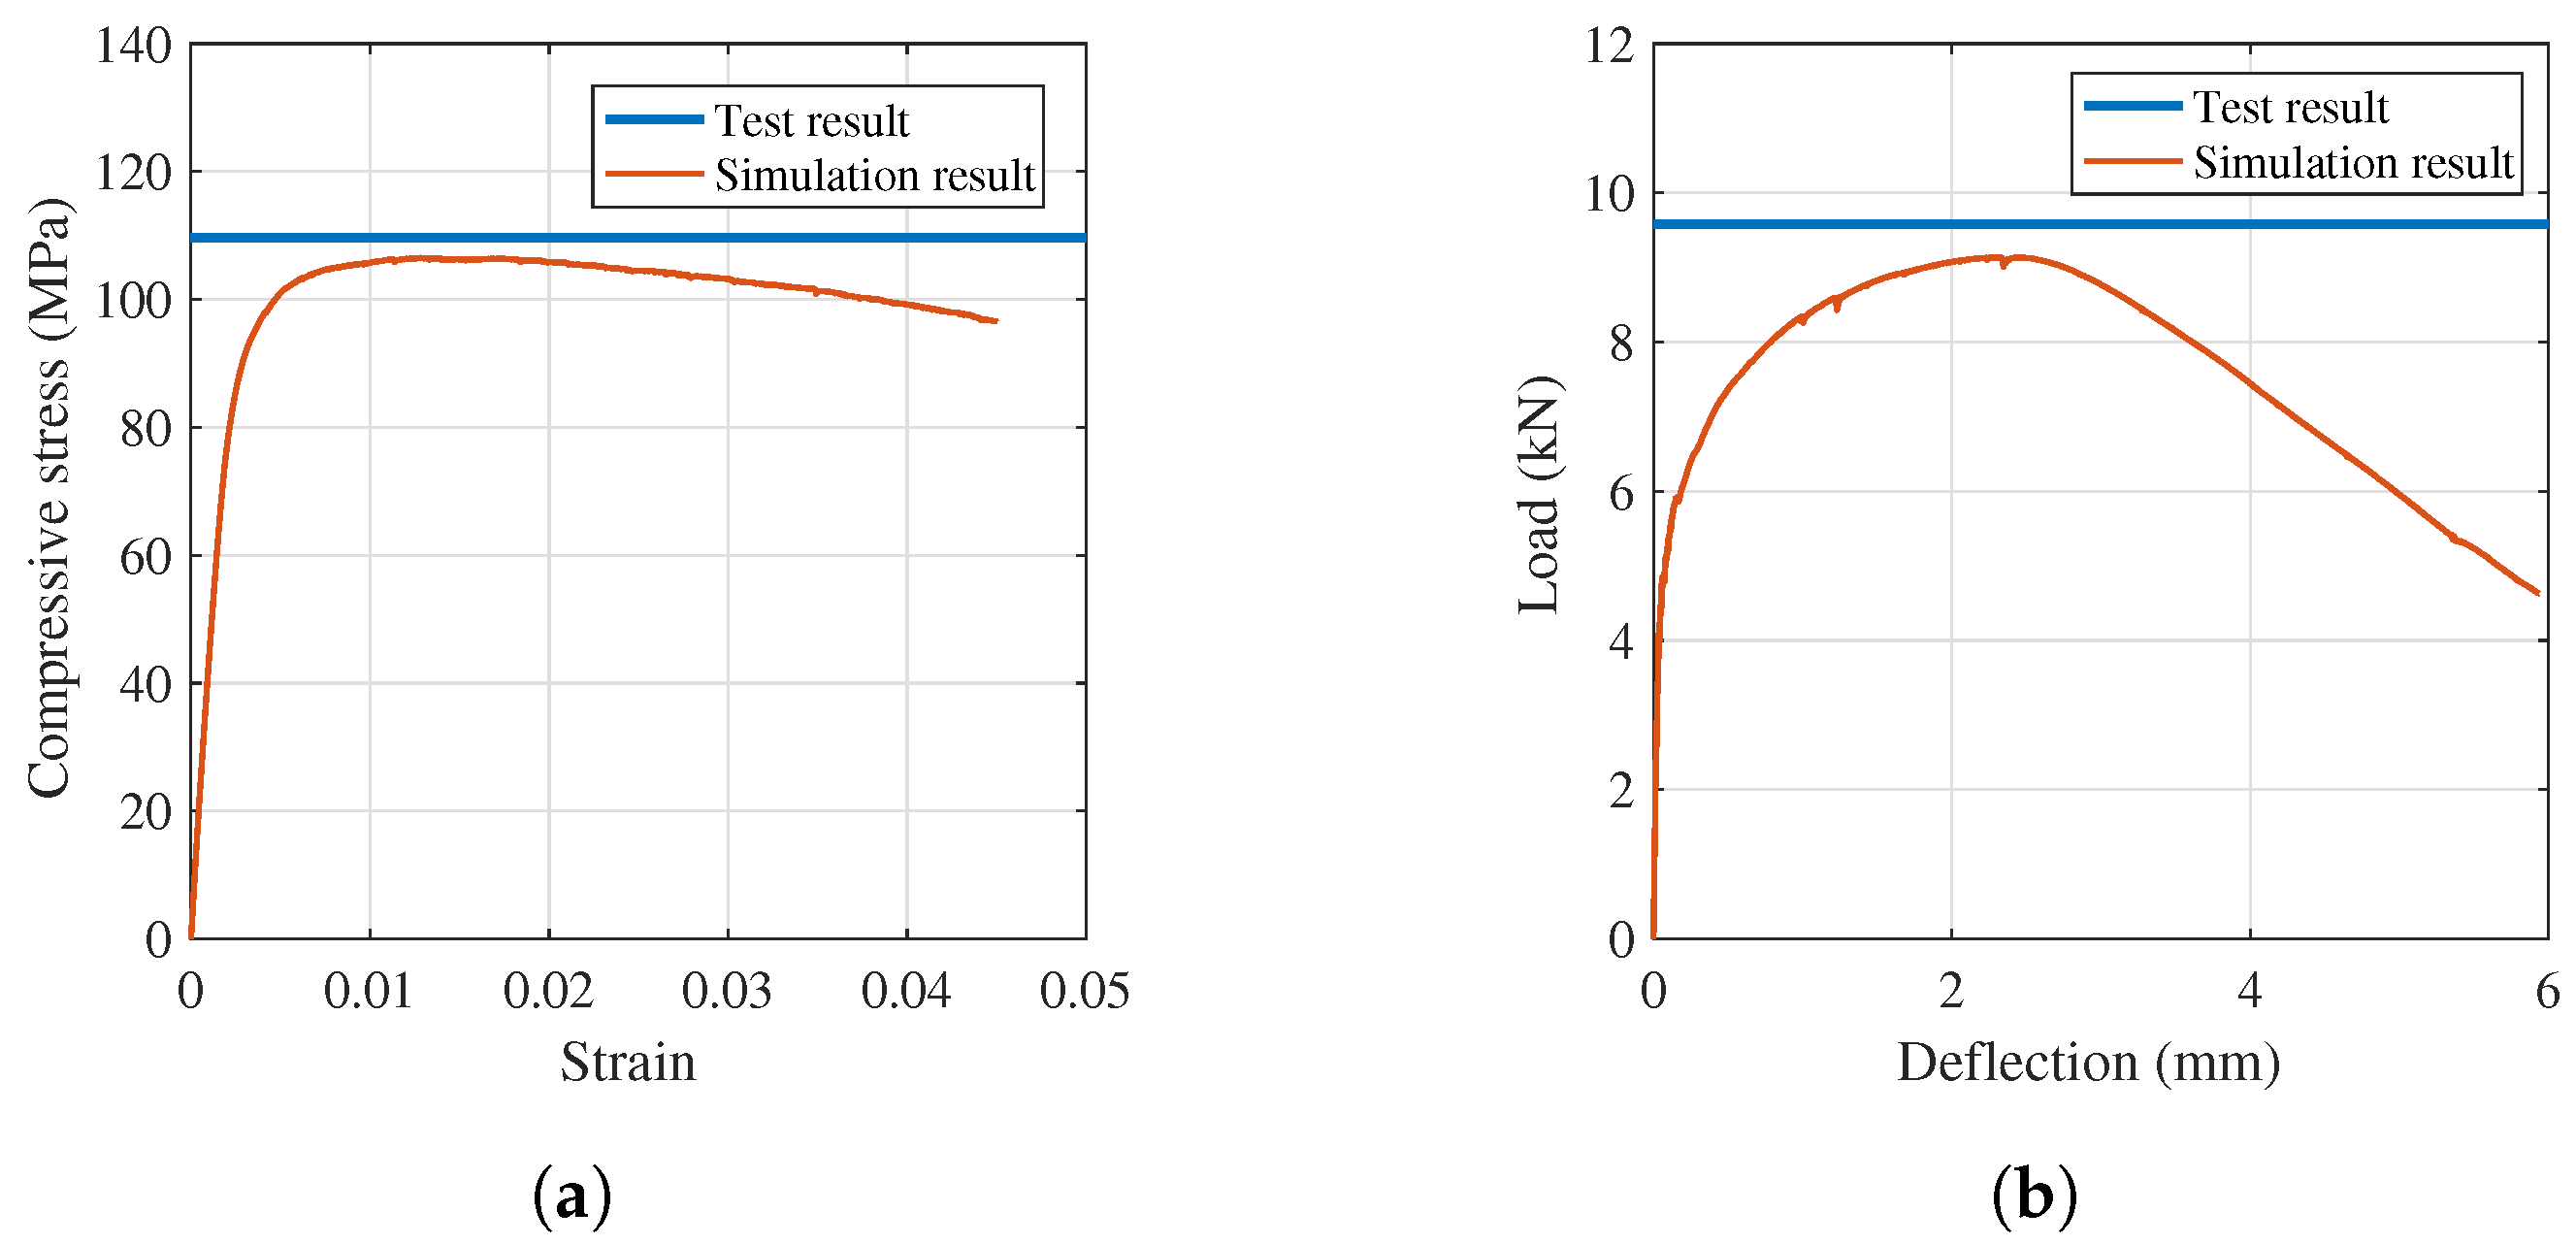
The UC and 3PBT results, as listed in Table 3 and plotted in Figure 5, demonstrated that both SFRC and PVA-FRC showed boosted compressive and bending performance compared to PC. From the bending test results, it could be found that the flexural strength of PVA-FRC was increased to 12.34 MPa, improved by 42.3 % compared to PC specimen. With 26.95 MPa flexural strength, SFRC presented much more strong improvement in the bending performance. Similar results were also captured in the UC test, PVA-FRC compressive strength was 84.81 MPa while f c for SFCR was 109.66 MPa, improved by 20.2% and 55.4% respectively compared to control PC cubes. The reason might lie on the fact that with the stronger and stiffer steel fibers, the first crack strength and ultimate strength of SFRC were greatly improved. Besides, the properties of bond between fiber and cementitious matrix also plays an important role on the performance of FRC. According to literature [26,35], bond strength of steel fibers in the cementitious matrix is usually within the range between 5–8 MPa, while this value could be 2–5 MPa for PVA fibers bond. What’s more is that the snubbing effect of steel fibers is also stronger than that of PVA fibers. While PVA fiber sometimes exhibits good pullout hardening behavior, it doesn’t contribute much to FRC overall strength.

2.3. Blast Test

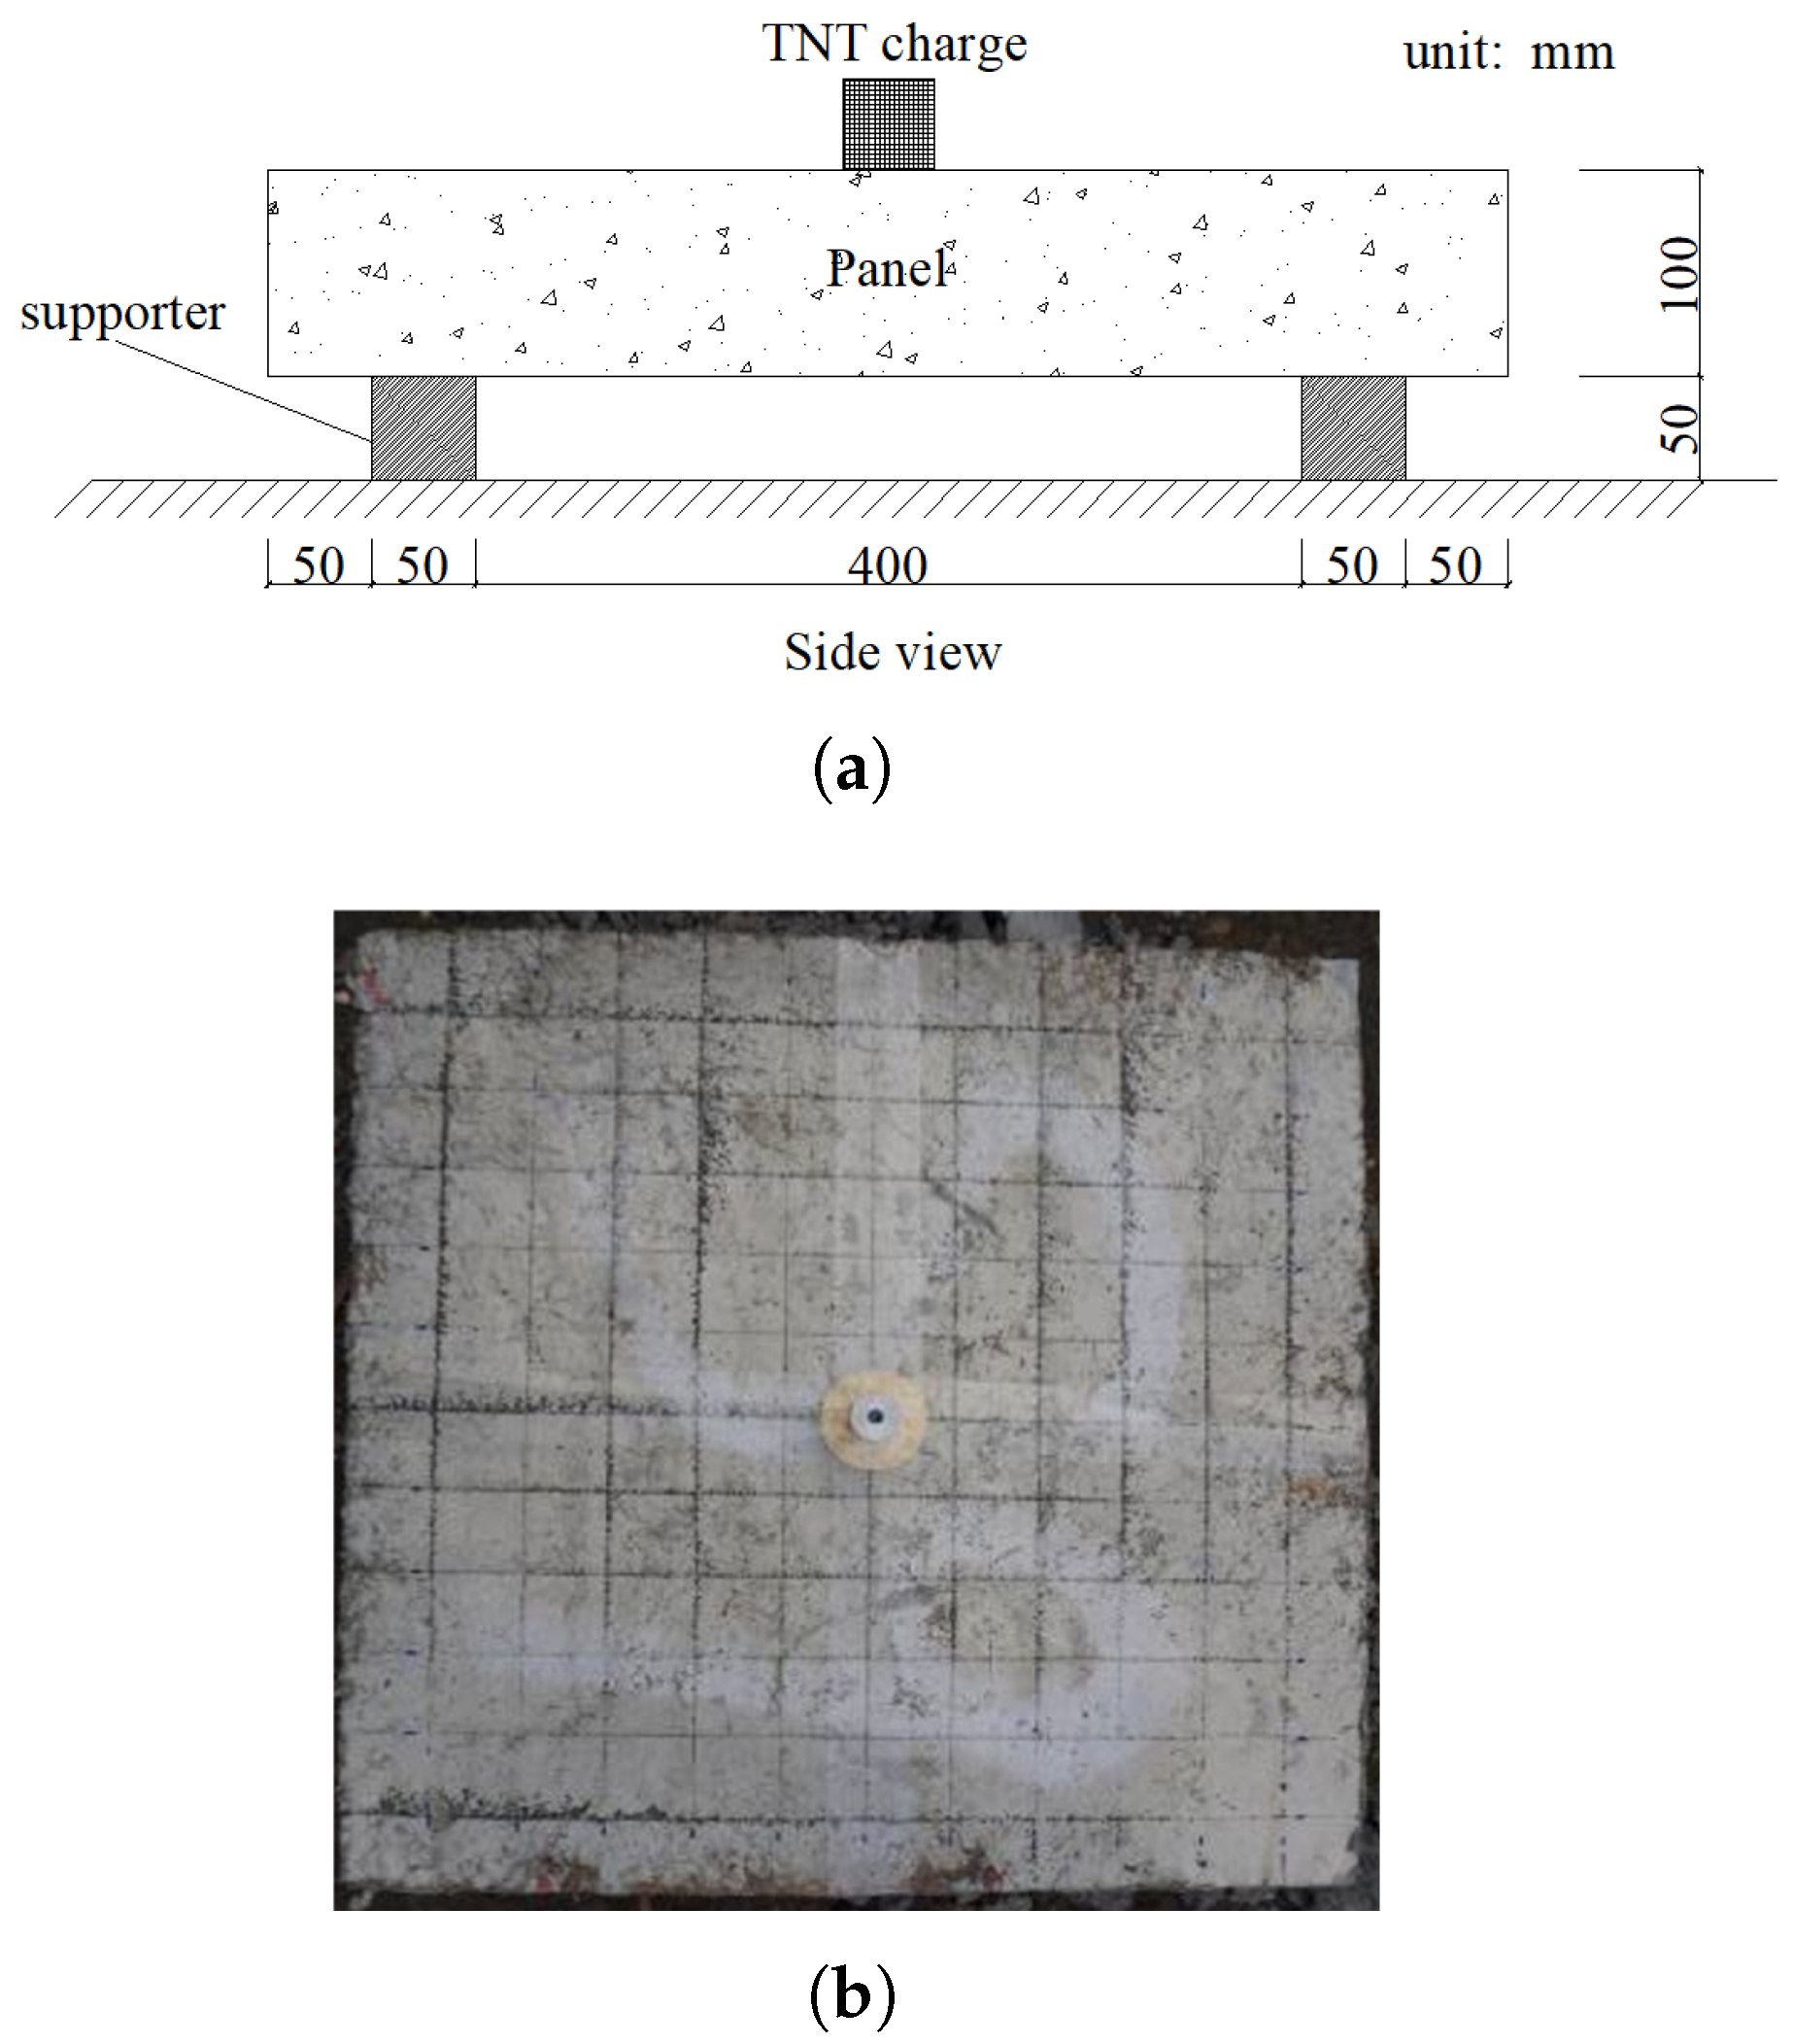
The explosion tests via contact detonation were carried out in this section to simulate the bomb explosion scenario. Each mixture (i.e., PC, SFRC and PVA-FRC) was prepared with 2 identical panels with dimension of 600 mm × 600 mm × 100 mm for the blast tests. The labels of these specimens were listed in Table 4, whereas S1 represented the control plain concrete, S2 and S3 were the PVA-FRC and SFRC panels respectively. The test setup was shown in Figure 6 where the slab was placed on two bottom steel supporters whose length was 600 mm and section size was 50 mm × 50 mm. All the panels were tested with 100 g and 44 mm height cylinder TNT charge placed at the center of the panel upper surface. An electric detonator was used herein to trigger the TNT charge.
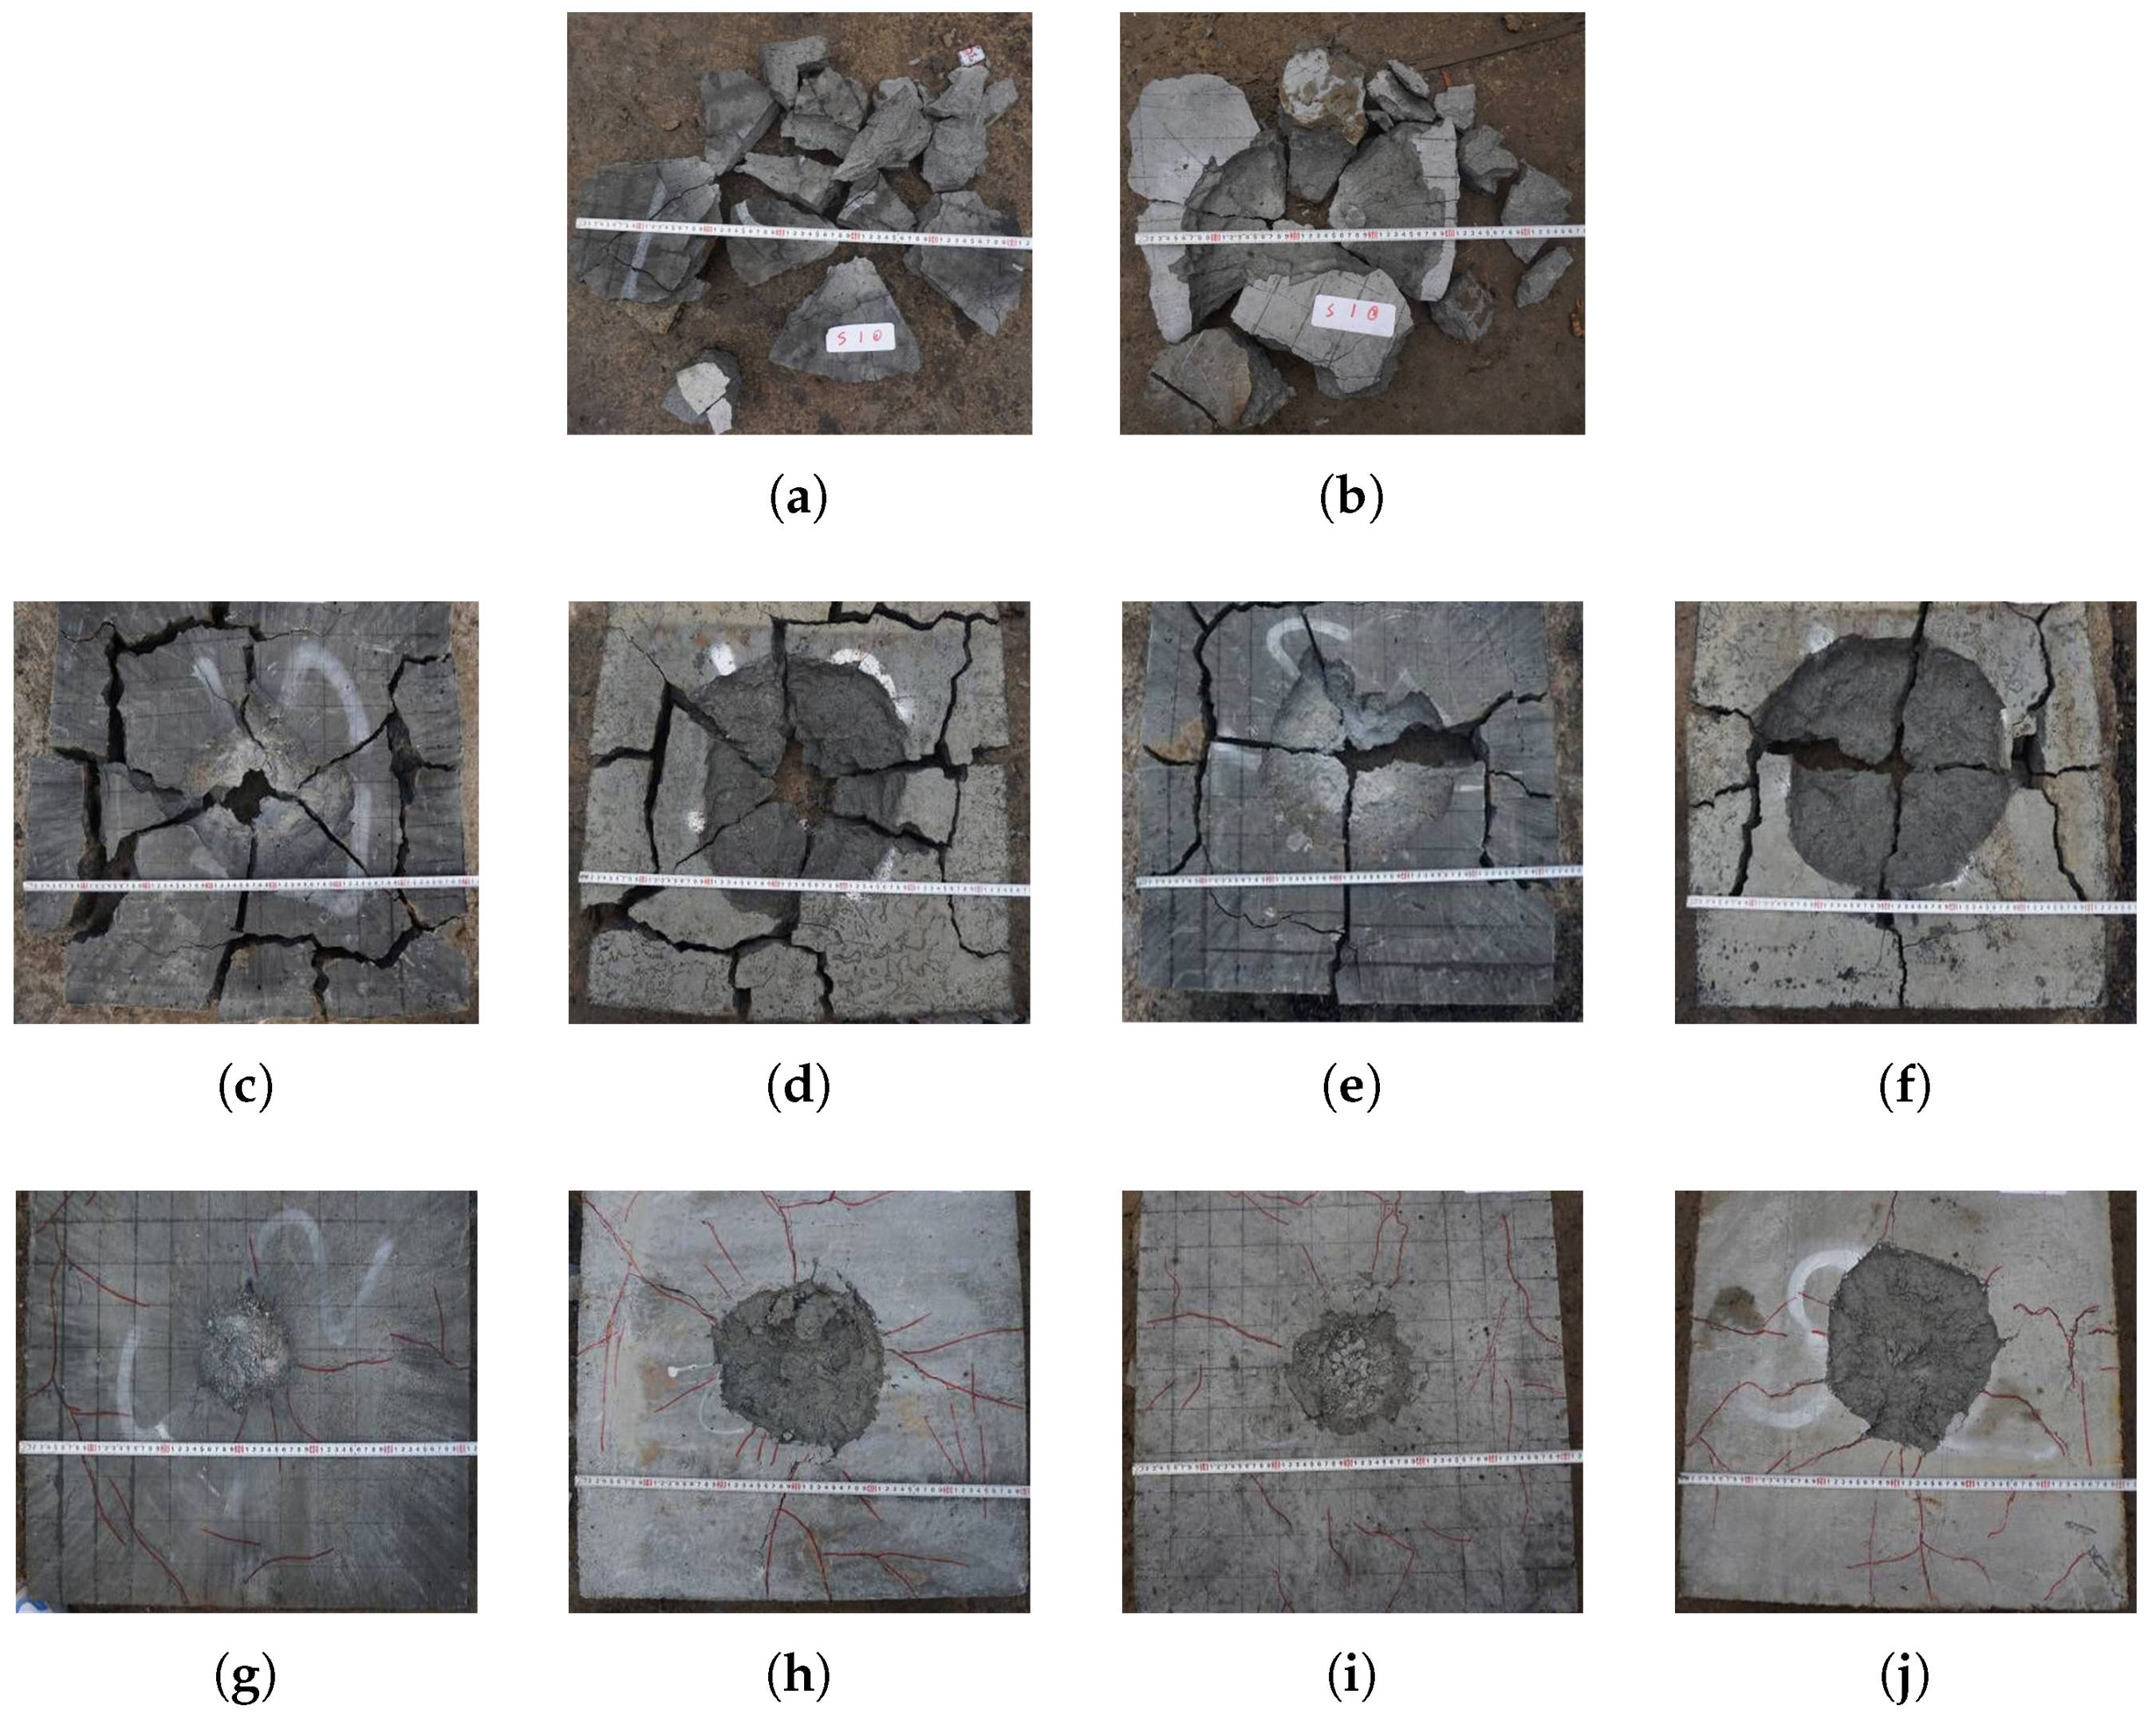
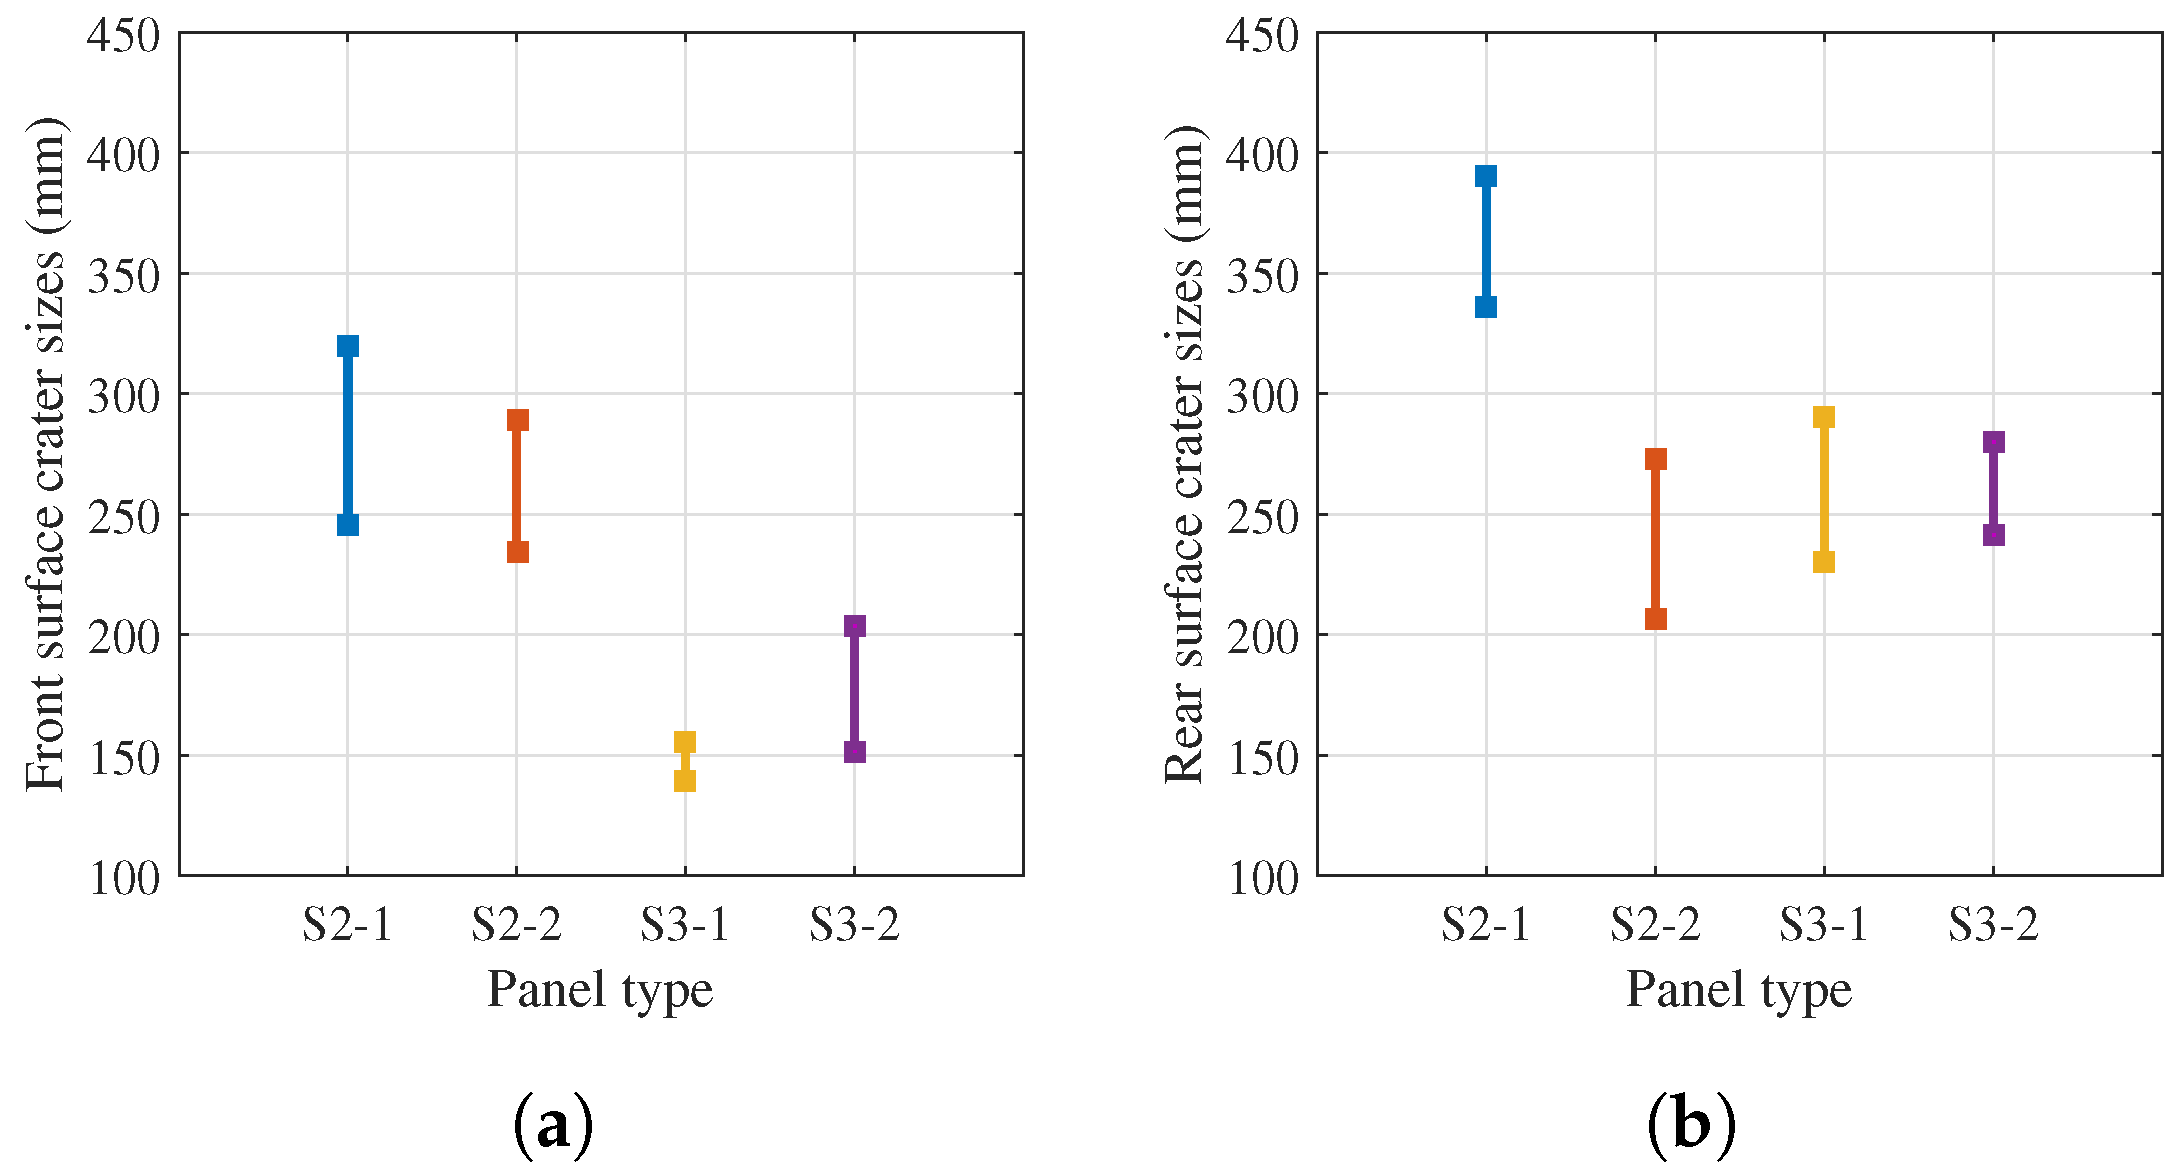
The damage modes of the specimens after the blast tests were depicted in Figure 7. The detailed damage conditions were listed in Table 5 and depicted in Figure 8 for the sake of visualization. It should be noted that the crater depth of only SFRC panels was given because that only SFRC panels structure stayed intact after blast, PC and PVA-FRC panels were all perforated. In Figure 7, the plain concrete specimens S1 were totally torn apart under blast loadings. The natural brittleness makes the PC panels could not bear the extreme dynamic loading. While the FRC specimens S2 and S3 behaved much greater blast-resistance than control PC specimens. The PVA-FRC slabs (No.2-1, No.2-2) showed the boost blast-resistant performance. Panel No.2-1 was broken into 3 main blocks and 9 smaller pieces, 28 cracks were observed on the front surface and 21 cracks on the rear surface. Panel No.2-2 had similar damage mode, featured with 4 main blocks and 5 smaller pieces, and its front and rear surface had 19 and 15 main cracks. The SFRC specimens (No.3-1, No.3-2) behaved the greatest blast resistance, whose structure were remain intact after blast loading. Only craters and some fine cracks were found on the front and rear surface. There were about 20 fine cracks on the front and 26 cracks on the rear. Downward tendency was found in Figure 8 in terms of both front and rear crater sizes, which again proved its good blast resistance.
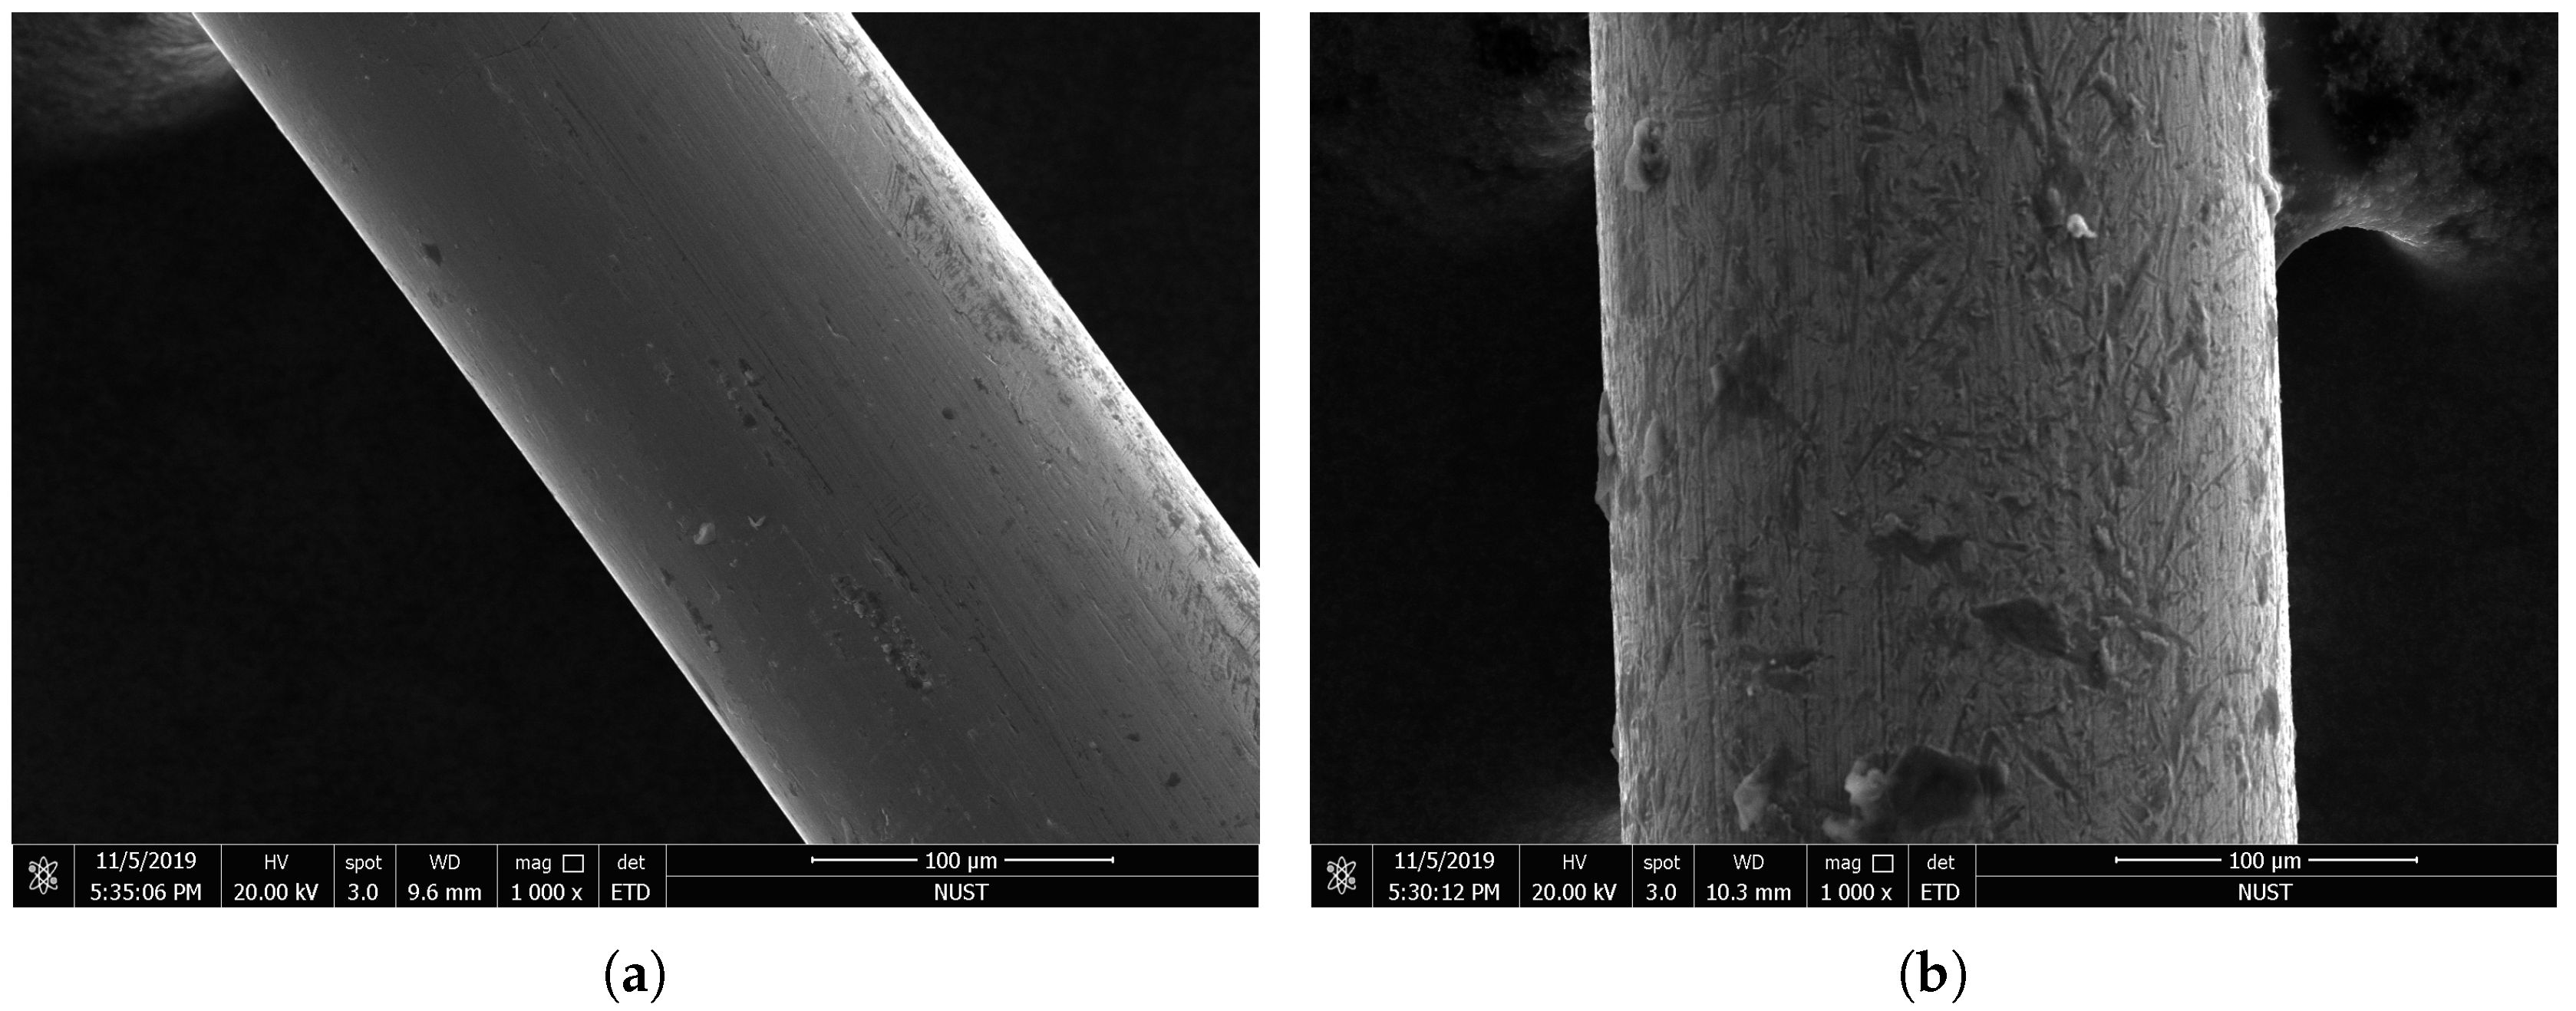
It could be concluded that plain concrete had the least blast-resistant capability, i.e., the natural brittleness make PC could seldom bear the blast loadings. FRC showed good blast resistance mainly because the fibers embedded into the matrix enhanced the strength and toughness of the concrete. Under blast loadings, the fiber-bridging effect resisted and limited the cracking, the energy absorption capacity and strength of the composite were greatly improved. With the stronger and stiffer embedded steel fibers, the SFRC exhibited the best resistance against blast loadings. Figure 9 showed the steel fiber recovered from damaged panels under scanning electron microscope (SEM) test. Magnified by 1000 times, it could be found that in contrast to smooth surface of pre-test steel fiber in Figure 9a, clear scratches due to friction were observed on the pulled out steel fiber surface. Moreover, some cementitious micro particles were adhered to the fiber surface in Figure 9b. These phenomena indicated that most of the steel fibers were pulled out during the blast process and there was a perfect bond between the steel fiber and the matrix. However, most PVA fibers found raptured after the test, that’s another reason why PVA-FRC panels were perforated while SFRC panels were still intact. It was worth noting the FRC rear crater dimensions are much larger than the front crater. The reason for this phenomenon may lie in the fact that rear surface suffers reflected tensile stress wave, which could cause severer damage to the concrete panel since its tensile behavior is much weaker compared to its compressive behavior.

3. Review of LDPM-F

The LDPM model was selected as the simulation tool for FRC blast modeling. Prior to numerical study, the basic information of LDPM for PC and LDPM-F for FRC were reviewed briefly. LDPM model generation procedure and governing constitutive equations are explained in the following parts, in accordance with [34].

3.1. LDPM Model Construction

LDPM simulates concrete meso-structure through the following steps [41,42]:
The first step is the aggregate generation, which is carried out assuming that each aggregate can be approximated as a sphere. Then, the spherical aggregate size distribution function proposed by Stroeven [43] is considered
f ( d ) = q d 0 q [ 1 ( d 0 / d a ) q ] d q + 1
in which d 0 and d a are the minimum and maximum spherical aggregate diameter respectively, and q is a material parameter. Reference [34] shows that Equation (1) is associated with a sieve curve in the form
f ( d ) = ( d d a ) n f
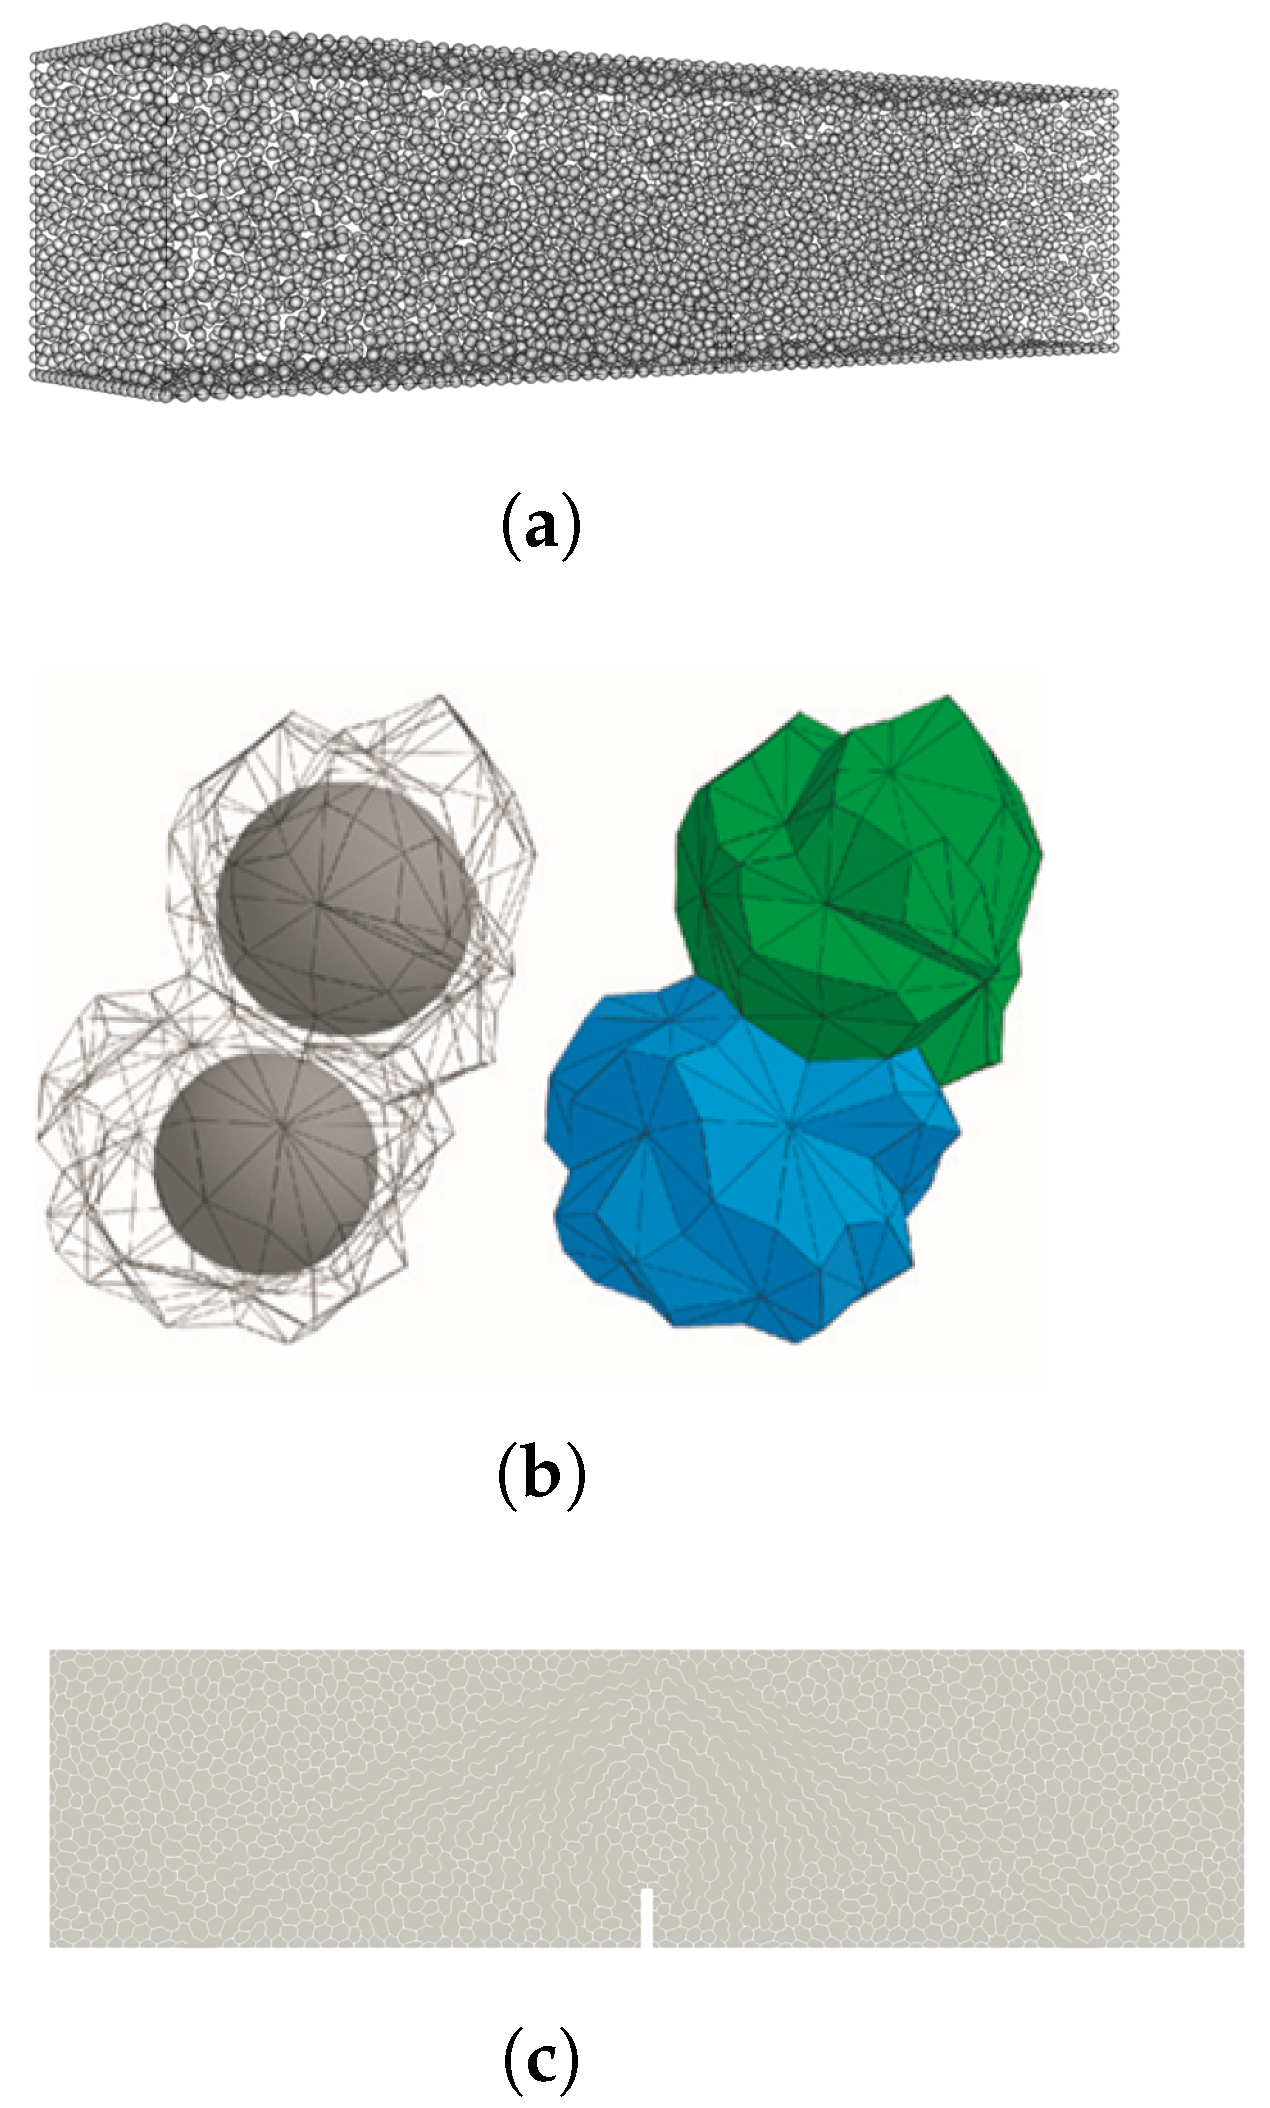
where n f = 3 q . When n f = 0.5 , Equation (2) corresponds to the classical Fuller curve [34], which is extensively used in concrete technology. For a given cement content c, water-to-cement ratio w / c , specimen volume V, minimum particle diameter d 0 and maximum aggregate diameter d a along with the considered Equation (1), the spherical aggregate system can be generated using a random number generator [34], which is depicted in Figure 10a. Delaunay tetrahedralization of the spherical aggregate center is utilized to define the interactions of the spherical aggregate system, as shown in Figure 10b. Figure 10c shows the final polyhedral particle discretization of the notched beam specimen.

3.2. LDPM Kinematics

The triangular facets forming the rigid polyhedral particles are assumed to be the potential material failure locations. Each facet is shared between two polyhedral particle and is characterized by a unit normal vector n and two tangential vectors m and l . Accordingly, three strain components are defined on each triangular facet using Equations (1) and (2), which for LDPM gives:
ε N = n T u C ; ε L = l T u C ; ε M = m T u C
where u c is the displacement vector calculated at the facet centroid, is the length of the tetrahedron edge which means the distance between two particles. It was demonstrated that the meso-scale strain defined in Equation (3) corresponds to the local reference system projection of Green-Lagrange strain tensor of continuum mechanics [34,44,45].
When a facet strain increases beyond the tensile elastic limit, the mesoscale crack opening can be computed as w = w N n + w M m + w L l , in which w N = ( ε N σ N / E N ) , w M = ( ε M σ M / E T ) and w L = ( ε L σ L / E T ) , E N and E T are the elastic normal and tangential stiffness respectively.

3.3. LDPM Constitutive Equations

In the elastic regime, the normal and tangential meso-scale stress are proportional to the corresponding strains:
σ N = E N ε N ; σ M = E T ε M ; σ L = E T ε L ;
where E N = E 0 , E T = α E 0 , E 0 is the normal modulus and α is the shear-normal coupling parameter.
For fracture behavior, through the relationship between equivalent strain, ε = ε N 2 + α ( ε M 2 + ε L 2 ) , and equivalent stress, σ = σ N 2 + ( σ M + σ L ) 2 / α , the fracture response is demonstrated as
σ N = ε N ( σ / ε ) ; σ M = α ε M ( σ / ε ) ; σ L = α ε L ( σ / ε ) ;
Equivalent stress corresponding to the tensile boundary is considered as
σ b t = σ 0 ( ω ) e x p [ H 0 ( ω ) ε m a x ε 0 ( ω ) / σ 0 ( ω ) ]
where ε m a x is the maximum equivalent strain, = m a x ( , 0 ) , ω is a coupling variable representing the interaction degree between shear and normal loading and defined as t a n ω = ε N α ε T , ε T = ε M 2 + ε L 2 . Until the maximum equivalent strain reaches the elastic limit, the fracture damage begins to decline the boundary σ b c with the softening modulus H 0 ( ω ) , which governs the post-peak slope and is assumed as H 0 ( ω ) = H t ( 2 ω π ) n t , where n t is the softening exponent and H t = 2 E 0 / ( l t / l 1 ) is the softening modulus in pure tension. l t = 2 E 0 G t / σ t 2 , l e is the length of the tetrahedron edge and G t is the meso-scale fracture energy. LDPM assumes σ 0 ( ω ) as a variation providing a transition between pure tension and pure shear and the variation is denoted as
σ 0 ( ω ) = σ t γ s t 2 ( s i n ( ω ) + s i n 2 ( ω ) + 4 α c o s 2 ( ω ) / γ s t 2 ) / ( 2 α c o s 2 ω )
where γ s t = σ s / σ t is the shear-tensile strength ratio.
The second physical phenomenon simulated in LDPM is pore collapse from compression and compaction. For compressive loading( ε N < 0 ), the normal stress is computed by meeting the inequality σ b c ( ε D , ε V ) σ N 0 , where σ b c is a strain-dependent boundary associated with the volumetric strain ε V and the deviatoric strain ε D . The volumetric strain ε V = ( V V 0 ) / 3 V 0 (V and V 0 are the current and original volumes of a tetrahedron), is calculated at the tetrahedron level. The limitation of the elastic regime is defined as: ε c 0 = σ c 0 / E 0 , where σ c 0 is the meso-scale compressive yielding strength. Beyond the limitation, pore collapse begins, where the compressive boundary is assumed to have an initial linear evolution, up to a volumetric strain value ε c 1 = k c 0 ε c 0 , k c 0 is a material parameter. For axial compression with lateral confinement, γ D V = ε D / ε V can significantly affect the response. The compressive boundary for the pore collapse phase is denoted as
σ b c = σ c 0 + ε V ε c 0 H c ( γ D V )
Following the pore collapse, modeling compaction starts with the compressive boundary experiencing an exponential evolution. In this case, the boundary can be expressed as:
σ b c = σ c 1 ( γ D V ) e x p [ ( ε V ε c 1 ) H c ( γ D V ) / σ c 1 ( γ D V ) ]
where σ c 1 ( γ D V ) = σ c 0 + ( ε c 1 ε c 0 ) H c ( γ D V )

3.4. Formulation of LDPM-F

For the simulation of fiber-matrix interaction, LDPM-F adopts some assumptions, including that fiber is totally straight, ignoring the bending stiffness of fibers. Before the complete frictional pull-out stage, the embedded segment of a fiber was completely debonded from the surrounding matrix. The debonding stage is characterized by two main factors: The bond fracture energy G d and the frictional stress τ 0 [46]. The critical slippage value is considered as v d , which represents full debonding. For a given embedment length L e , it can be expressed as [47]
v d = 2 τ 0 L e 2 E f d f + ( 8 G d L e 2 E f d f ) 1 / 2
where E f is the elastic modulus of the fiber. For the debonding stage ( v < v d ), fiber load is given as [47]
P ( v ) = [ π 2 E f d f 3 2 ( τ 0 v + G d ) ] 1 / 2
For the pull-out stage ( v > v d ), the pull-out resistance is entirely frictional and considered as [47]
P ( v ) = P 0 ( 1 v v d L e ) [ 1 + β ( v v d ) d f ]
where P 0 = π L e d f τ 0 , and β is a dimensionless coefficient.
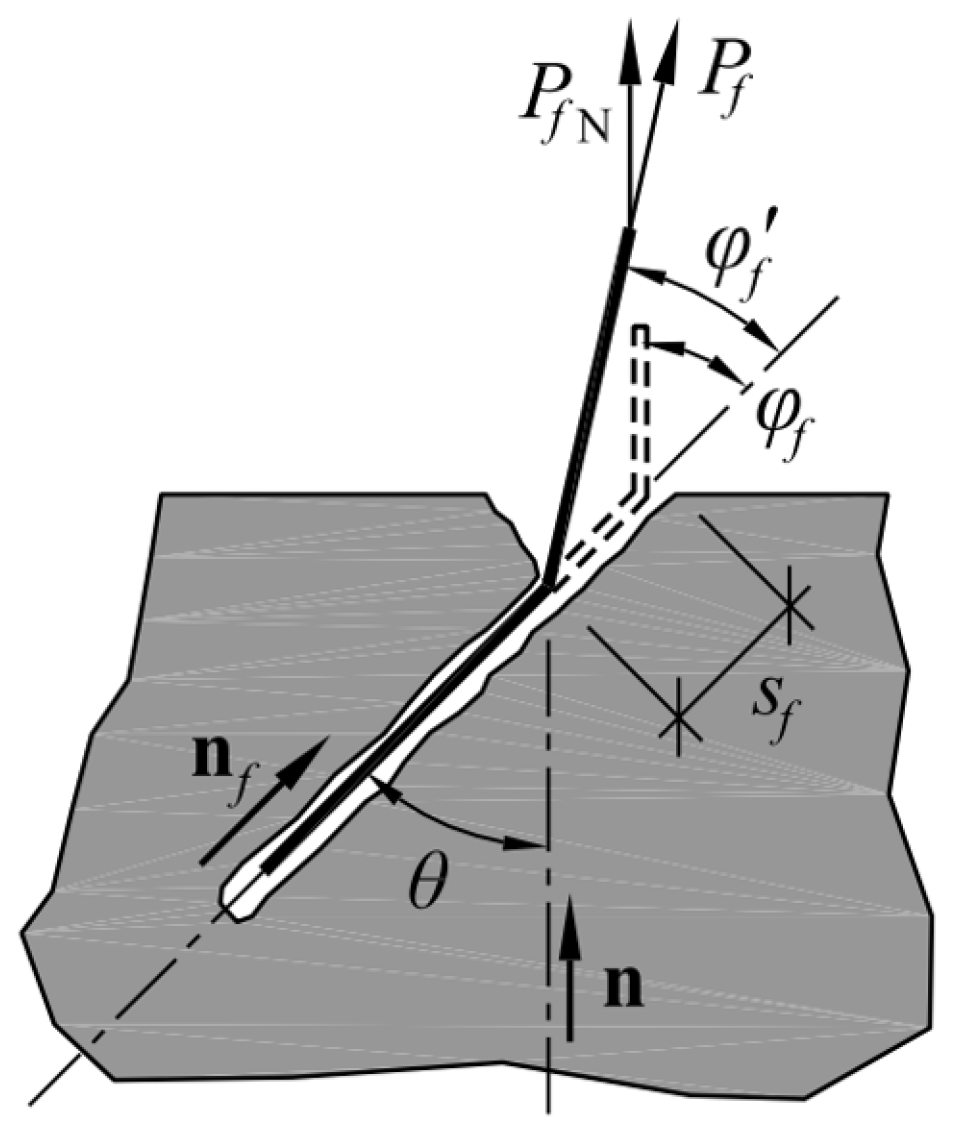
In most situations, it is quite different between the orientation of the embedded segment and the free segment of a fiber under crack-bridging force P f . As shown in Figure 11 [35,48], the original angle between the embedded segment and the free segment is denoted as φ f . At the point where the fiber exists the matrix, bearing stresses are created in the matrix [49,50]. When the bearing stresses reached a critical value, spalling occurs, causing that the embedment length of the fiber is reduced by a corresponding length s f . The crack-bridging force in the fiber experiences a sudden drop, along with the angle between two fiber segments is reduced to φ f . The spalling length is obtained by [51] and is considered as
S f = P f N s i n ( θ / 2 ) k s p σ t d f c o s 2 ( θ / 2 )
where P f N is the normal component of the total pullout crack-bridging force P f , σ t is the matrix tensile strength, θ = a r c c o s ( n f T n ) and k s p is a material spalling parameter.
The snubbing effect is also taken into account. When a fiber is pulled out from the matrix, at the point where the fiber exits the crack, LDPM-F assumes that the fiber wraps around the surrounding matrix in a totally flexible manner. The summation of the crack-bridging force paralleled to the embedded segment is denoted as P. The additional bearing force caused by the snubbing effect is considered as P f , and P f > P . The P f is obtained as
P f = e x p ( k s n φ f ) P ( v )
where P is a function of relative fiber slippage v and k s n is a material snubbing parameter. From Equations (13) and (14), it can be seen that the influence of fiber deflection angle on the fiber pullout response was introduced in LDPM-F, based on which LDPM-F could capture a more comprehensive effect that crack-bridging fiber has on the surrounding matrix. Due to the spalling and snubbing effect that was naturally introduced in LDPM-F, it is reasonable to effectively simulate the fiber orientation effect through LDPM-F.
In order to determine whether the crack-bridging force would cause the fiber rupture during the fiber pull-out process, k r u p is introduced herein. Then, it is necessary to check for each fiber
σ f = 4 P f / π d f 2 σ u f e k r u p φ f
where σ u f is the ultimate strength of the fiber and k r u p is a material rupture parameter.
Consider a fiber, with initial orientation n f , subject to a crack opening vector w . The tangential component of w is defined as w T = w M 2 + w L 2 . Assuming that the spalling length is the same on the both sides, the crack-bridging segment vector is computed as w = w + 2 s f n f . The crack-bridging force vector is assumed to be paralleled to the crack-bridging fiber and is denoted as P f = P f n f , where n f = w / w .
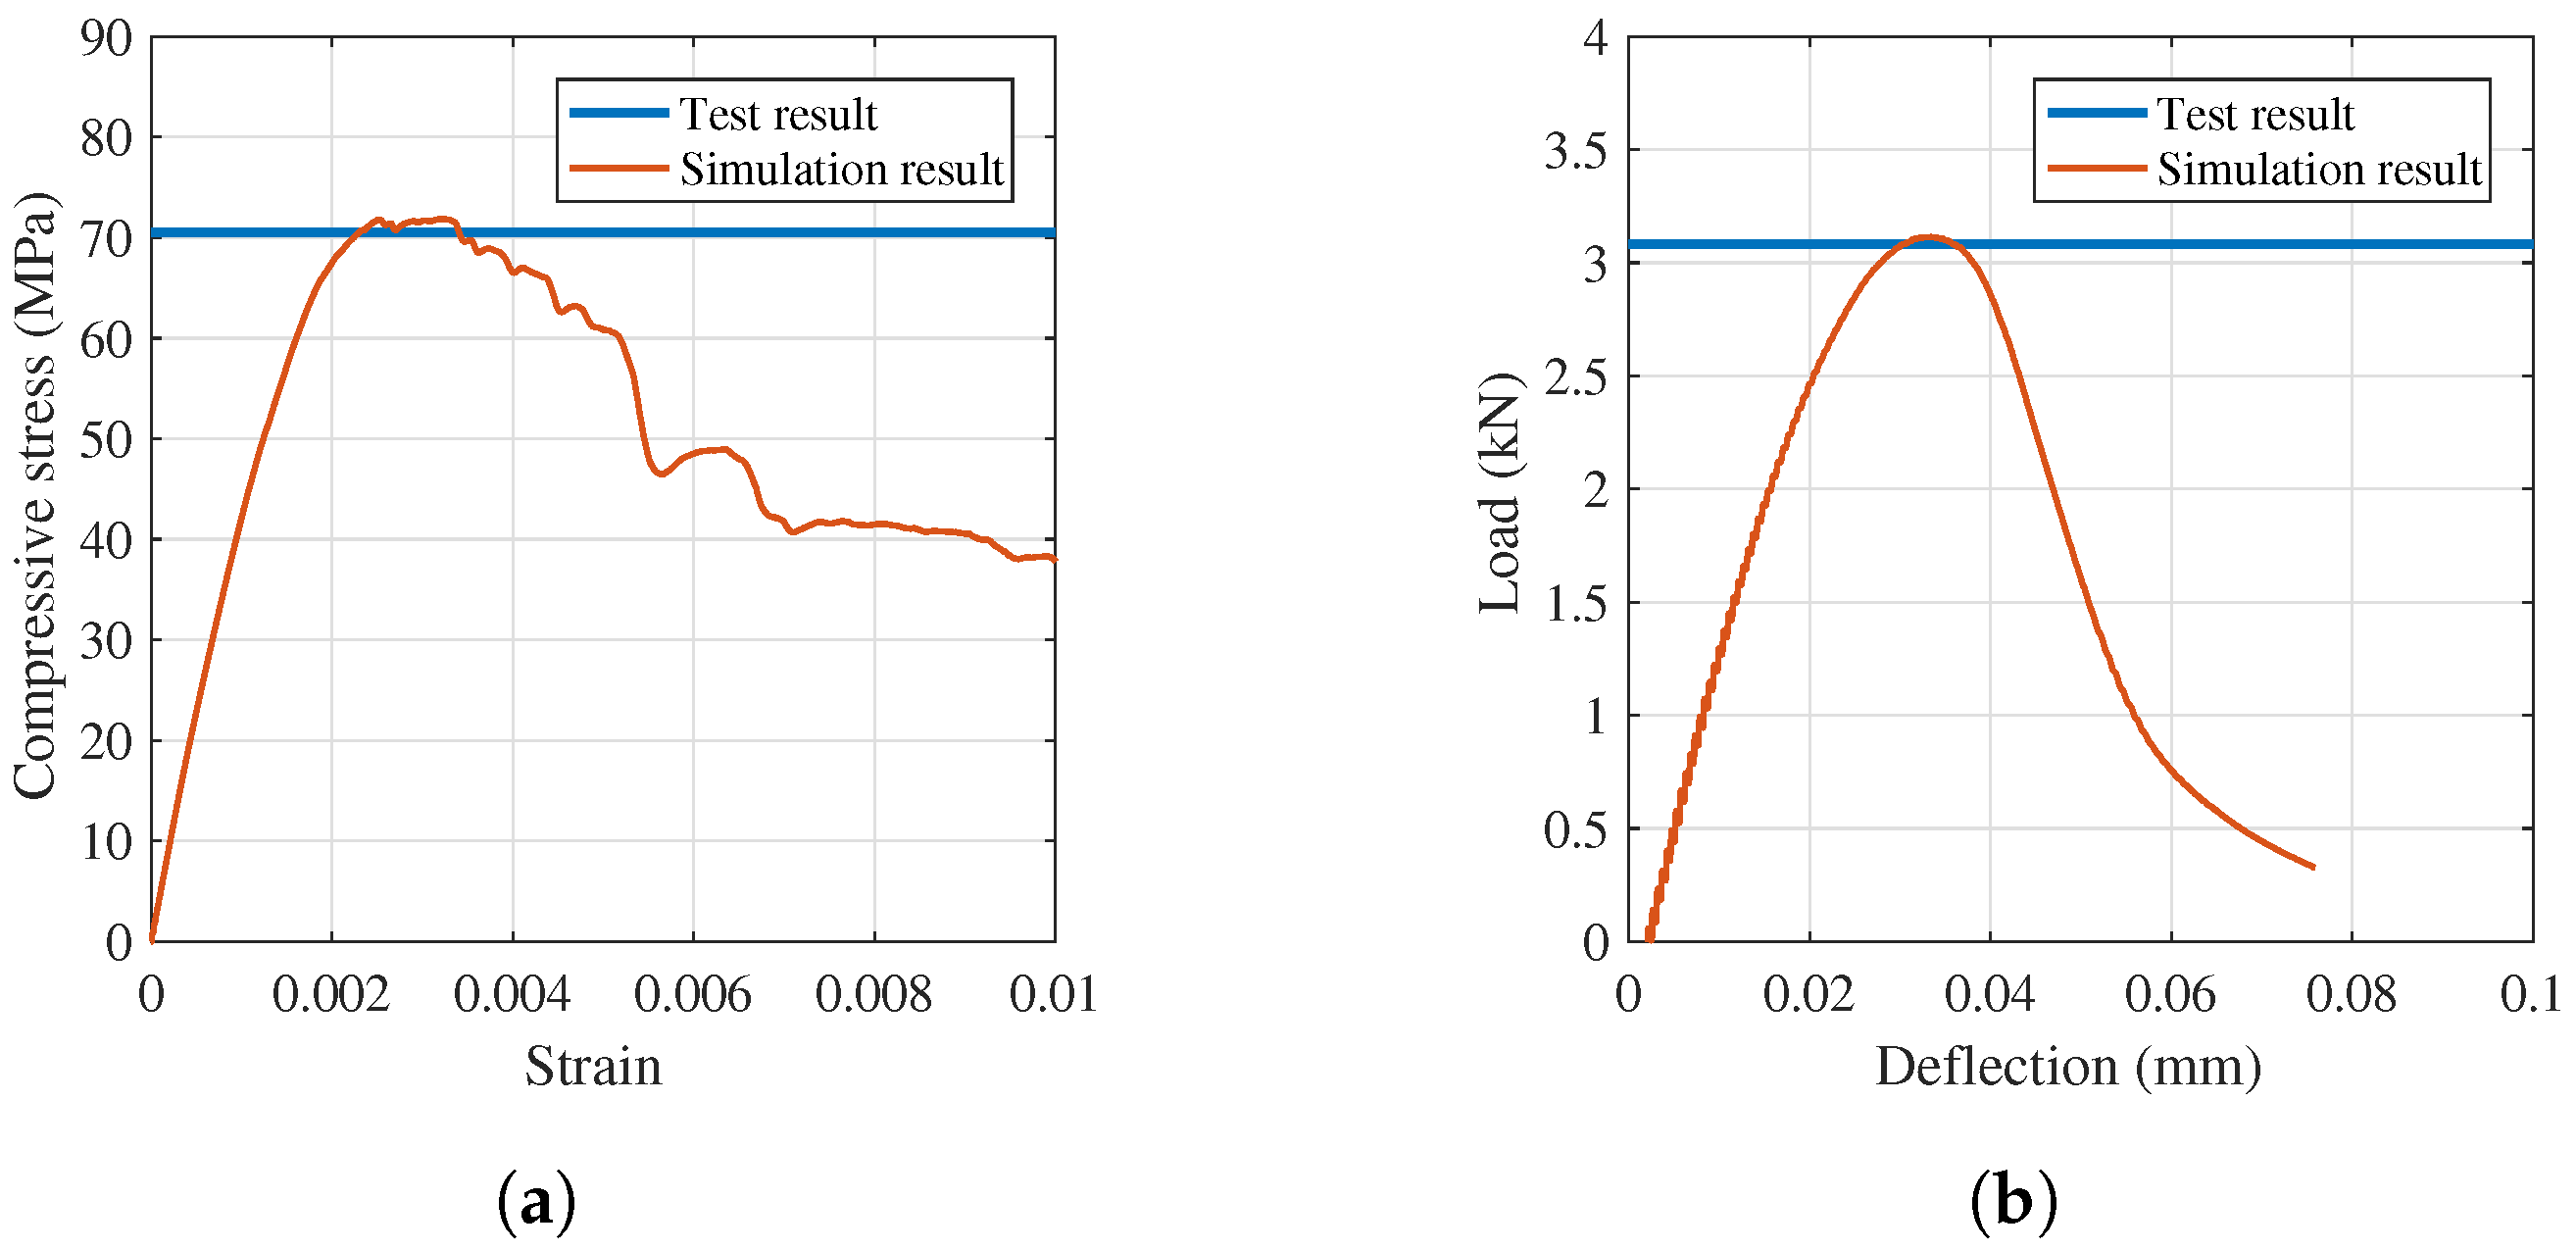
As discussed above, the realistic LDPM-F simulation response depends on two sets of parameters: (1) The LDPM material parameters which govern the behavior of plain concrete; (2) the parameters which govern the fiber-matrix interaction. All the parameters should be identified by fitting experimental data [16,52].

4. Numerical Modeling of FRC Contact Detonation

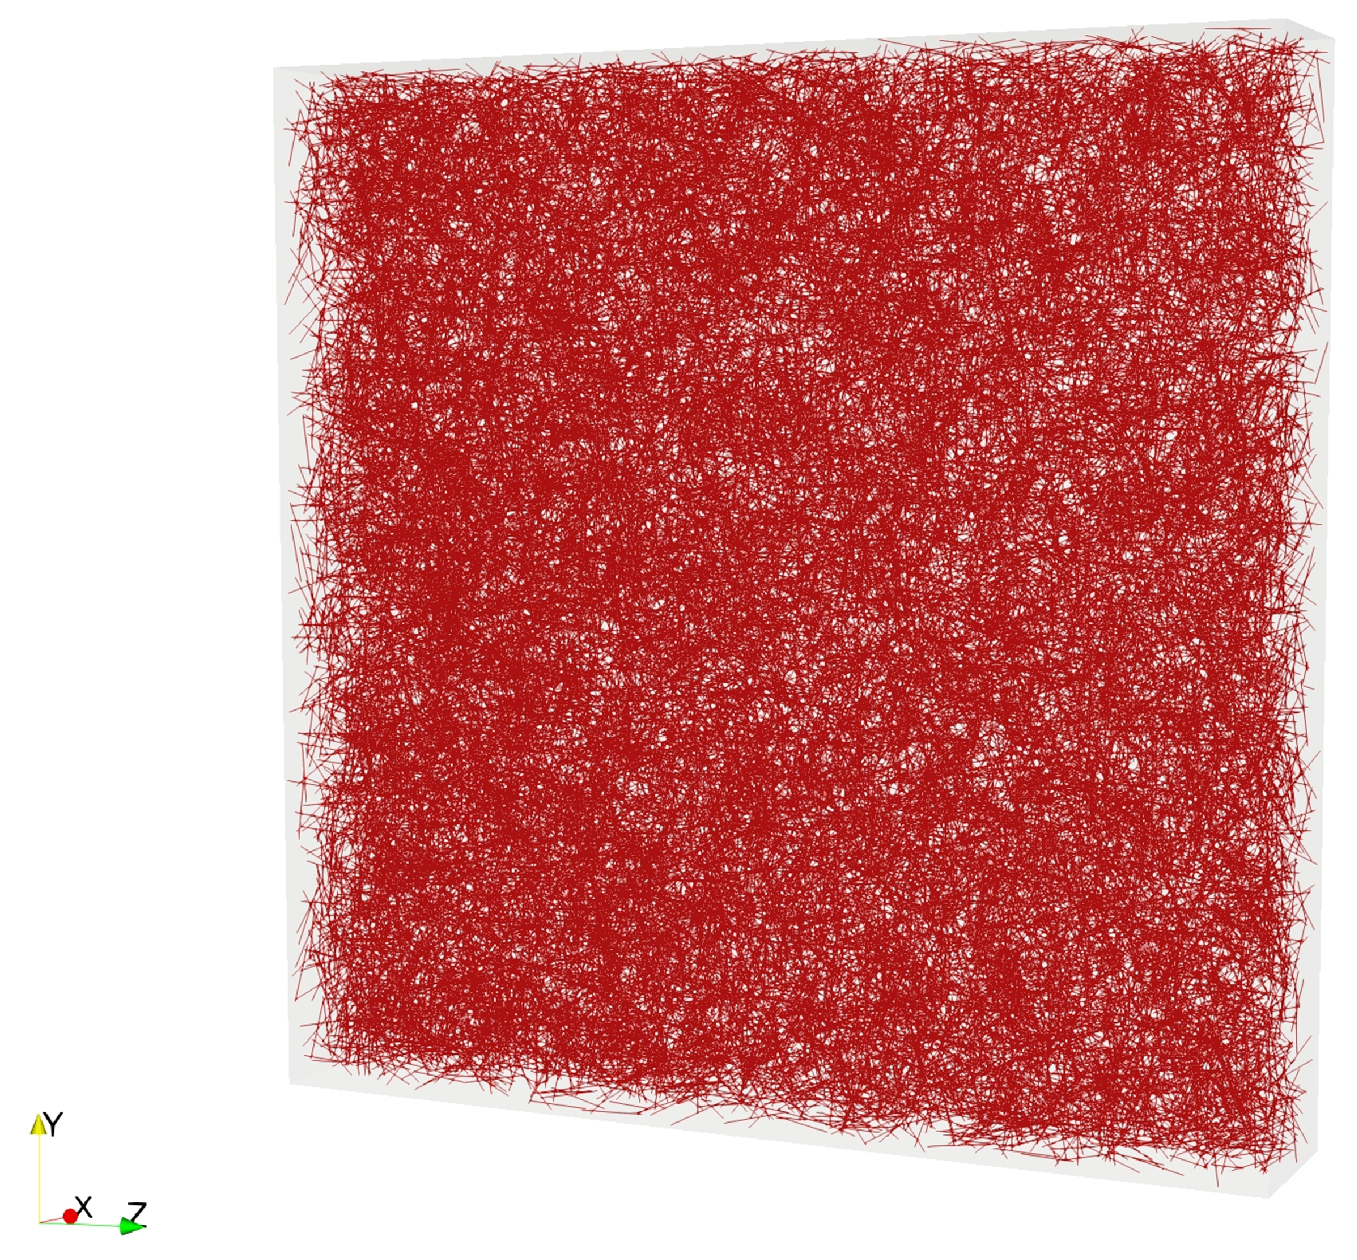
Numerical investigation on the blast-resistant performance of steel and PVA FRC was carried out in this section with LDPM-F. Figure 12 depicted the fiber distribution in a panel specimen simulated by LDPM-F. The geometry of an individual fiber can be characterized by two primary parameters: Diameter d f and length L f , for a given fiber volume fraction V f , individual fibers will be inserted in the matrix with randomly generated positions and orientations. In this work, L f and d f were consistent with the actual fiber dimensions.
For the calibration purpose, uniaxial compression and 3-point bending test were firstly simulated with LDPM-F to calibrate the parameters controlling plain concrete and fiber properties. Furthermore, the validated LDPM-F blast model was further applied to investigate the fiber content effect on the blast-resistant performance. SFRC and PVA-FRC panels with fiber content of 0.5%, 1.0%, 1.5% were modeled with LDPM-F and the simulation results were compared to FRC with fiber content of 2.0%.

4.1. LDPM-F Parameter Calibration

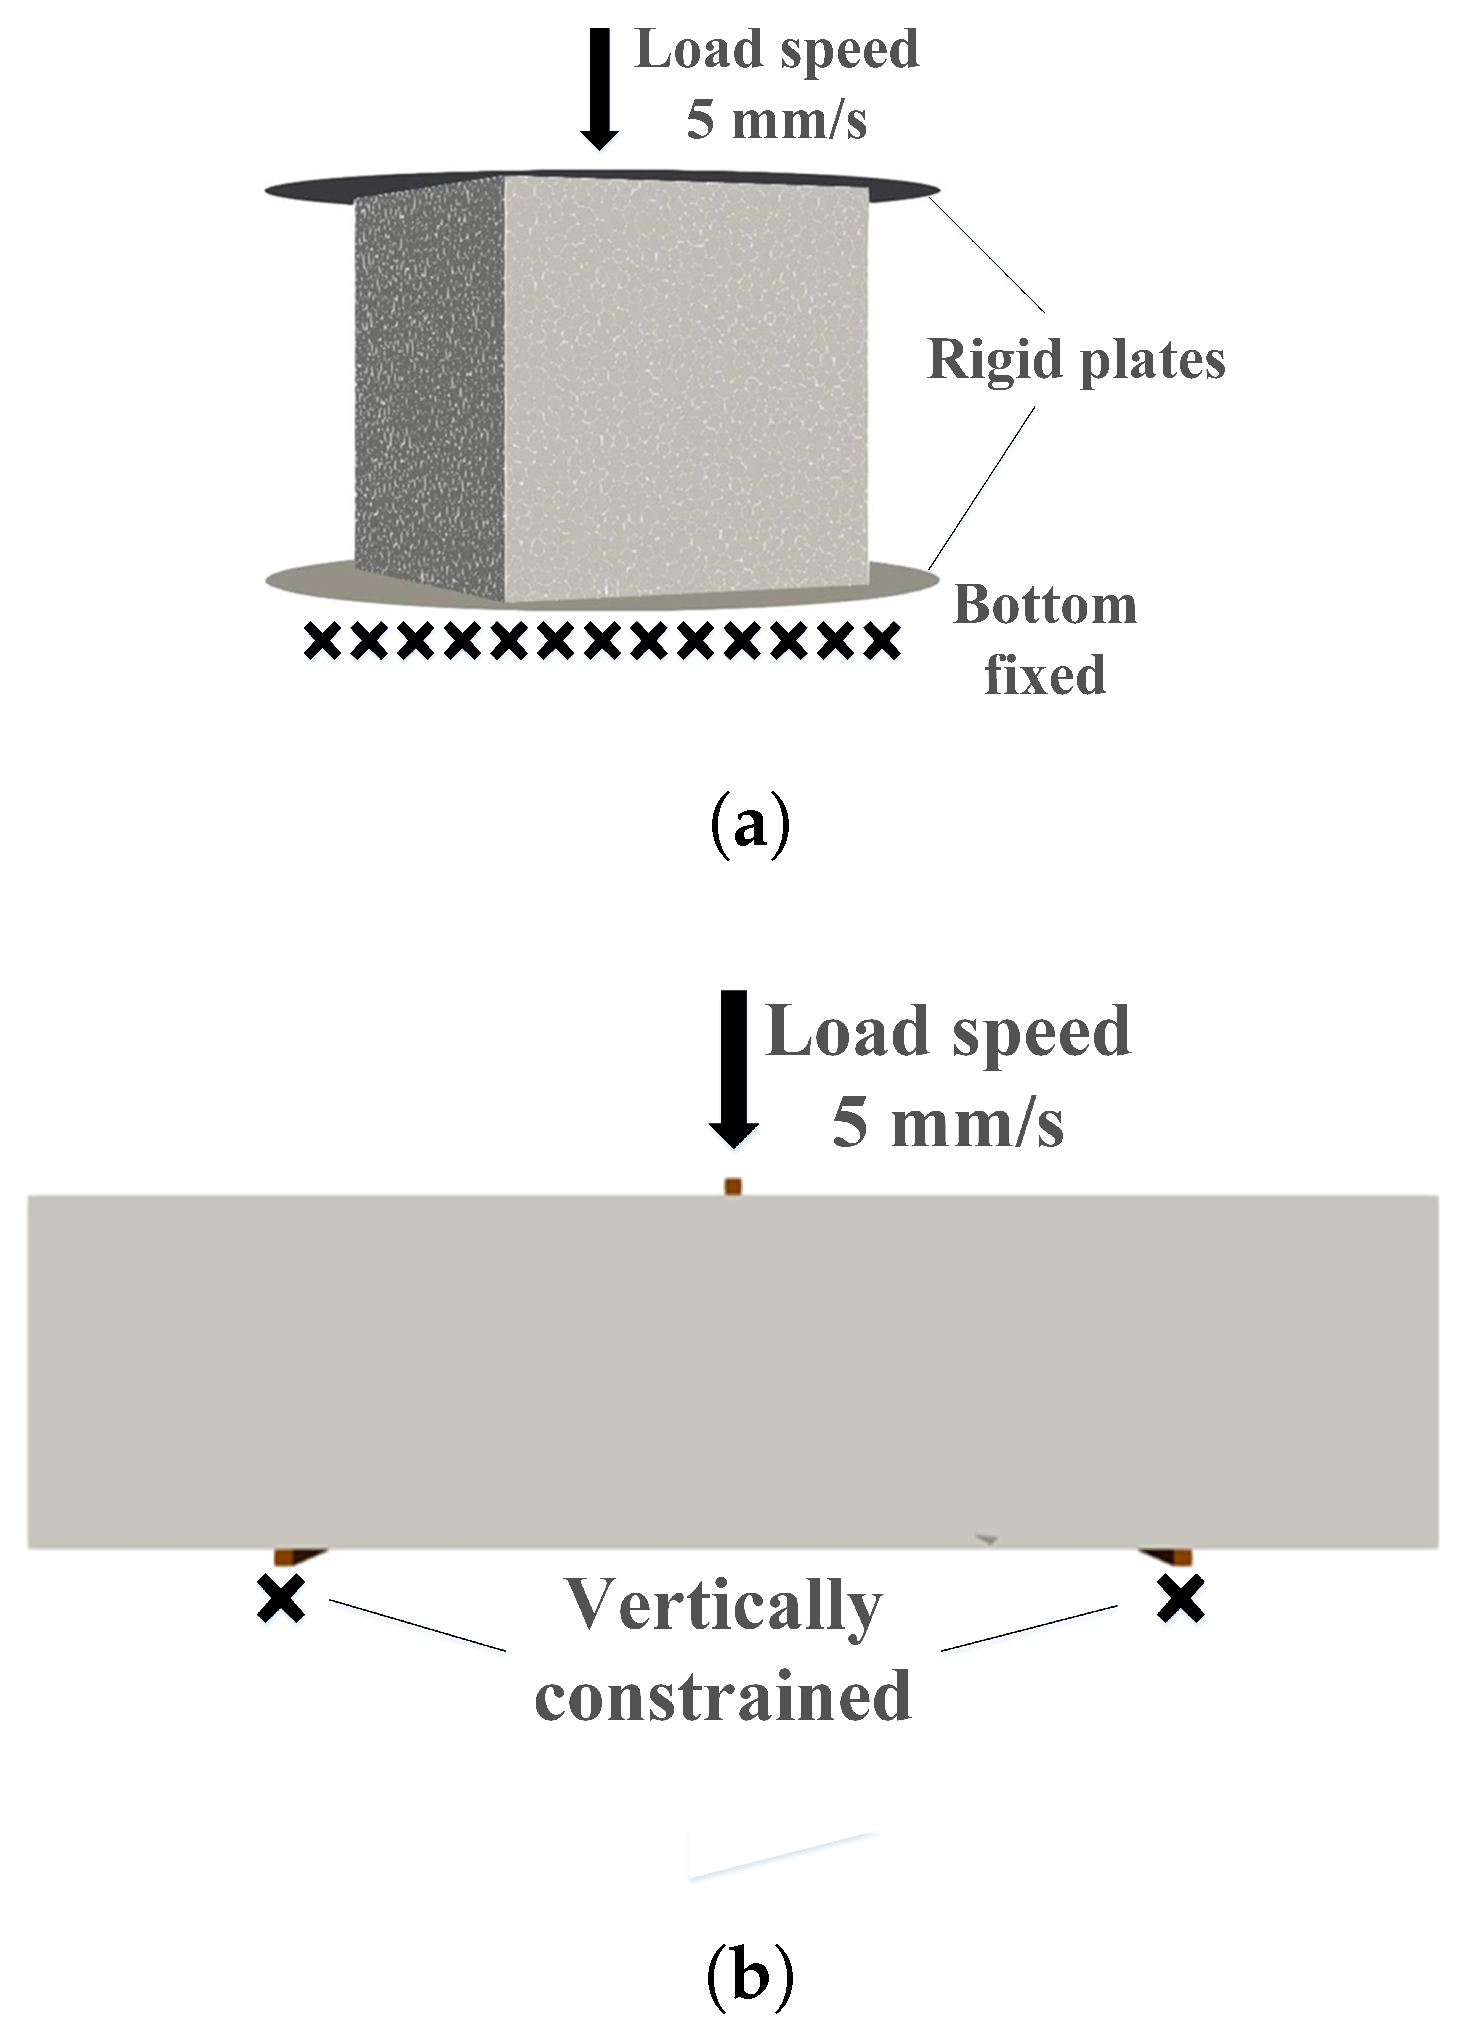
For calibrating the parameters governing the plain concrete mechanical properties, the UC and 3PBT simulations of PC were carried out herein. The simulation constrains of UC and 3PBT simulations were depicted in Figure 13. The simulated response curve were shown in Figure 14 and the failure modes of the simulated 3PBT results were depicted in Figure 4b. It could be found that the simulation results were fitted well to the test results in terms of both mechanical responses and damage modes. The calibrated parameters were listed in Table 6.
The fiber parameters were also calibrated herein by fitting the simulation results to the test results. The UC and 3PBT simulation constrains of FRC were the same with that of plain concrete. Both PVA-FRC and SFRC were simulated with the response curves plotted in Figure 15 and Figure 16. Both PVA-FRC and SFRC presented similar compressive strength and flexural strength with test data. The predicted failure modes of the FRC specimens after 3PBT were depicted in Figure 4b, good consistency was also presented compared to test results, which further verified the calibrated parameters. The calibrated PVA and steel fiber parameters were listed in Table 7. After the calibration of LDPM parameters with plain concrete and LDPM-F parameters with FRC, the FRC panel blast model can be established for validation.

4.2. FRC Blast Simulation

Simulations of FRC panels under blast loadings were carried out with LDPM-F describing the FRC material properties. The FRC blast simulation model was plotted in Figure 17, wherethe blast model setup was consistent with the contact detonation test. The FRC panel was incorporated into 2% volume ratio fibers and the bottom supporters were set as rigid bodies, whose vertical freedom was constrained. The interaction between the FRC panel and the rigid supporters was set as penalty contact. The explosion source was set vertically 22 mm away from the center of the panel front surface.
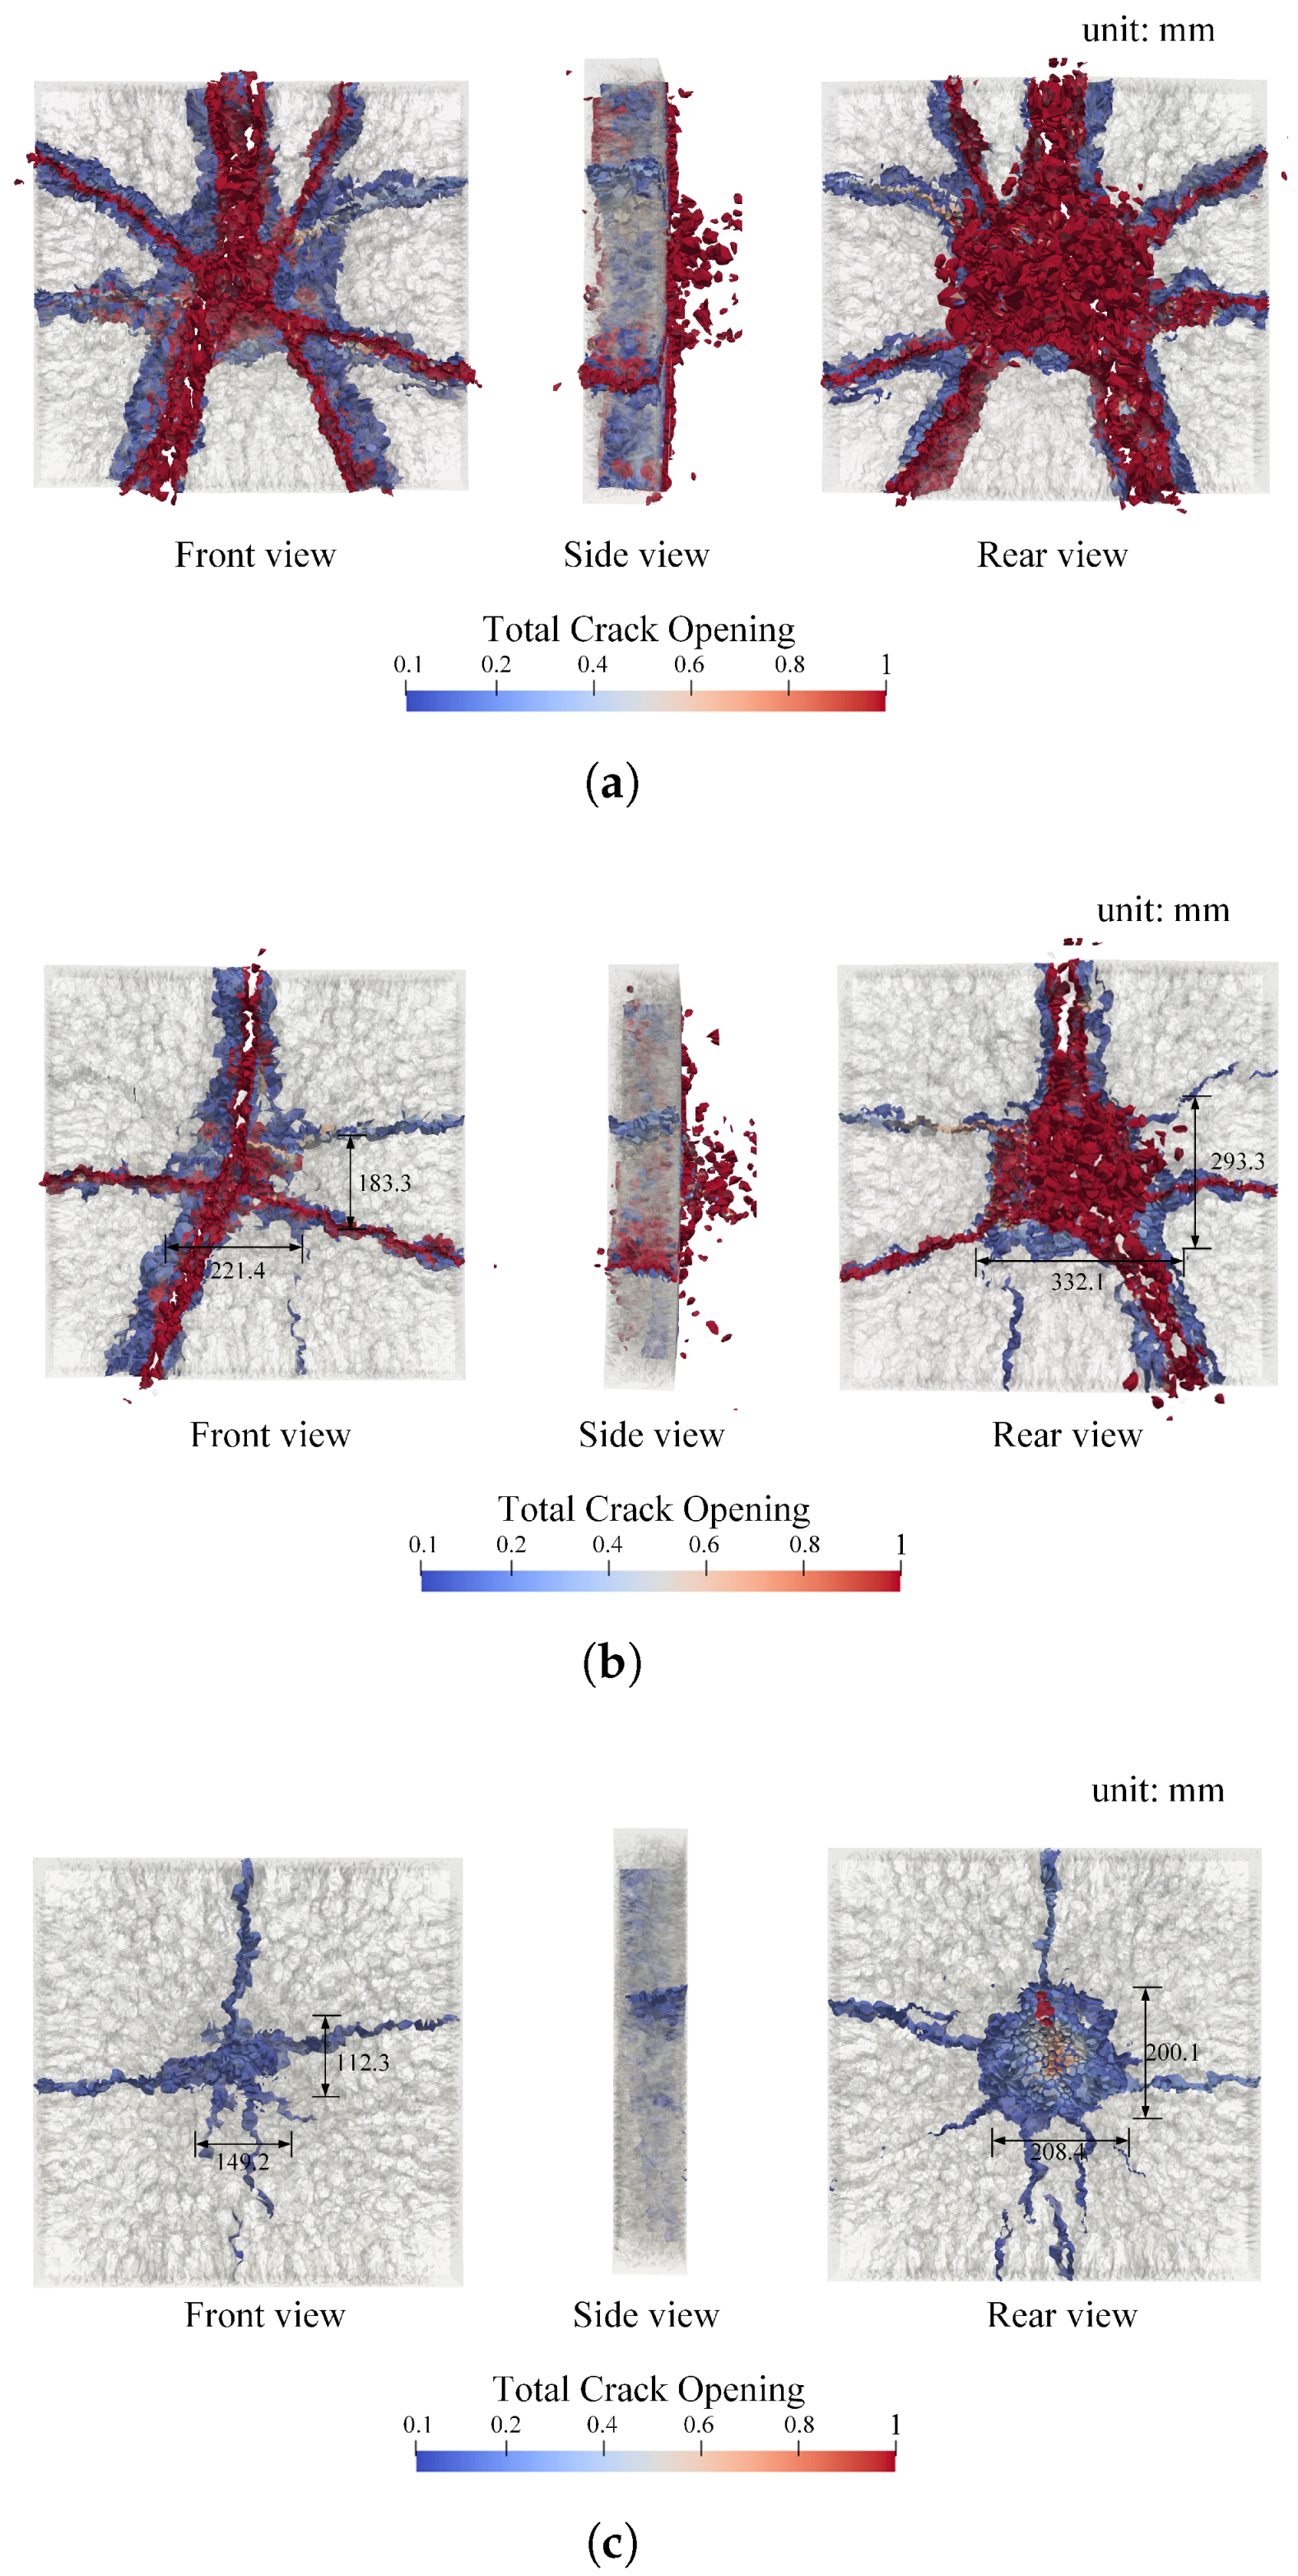
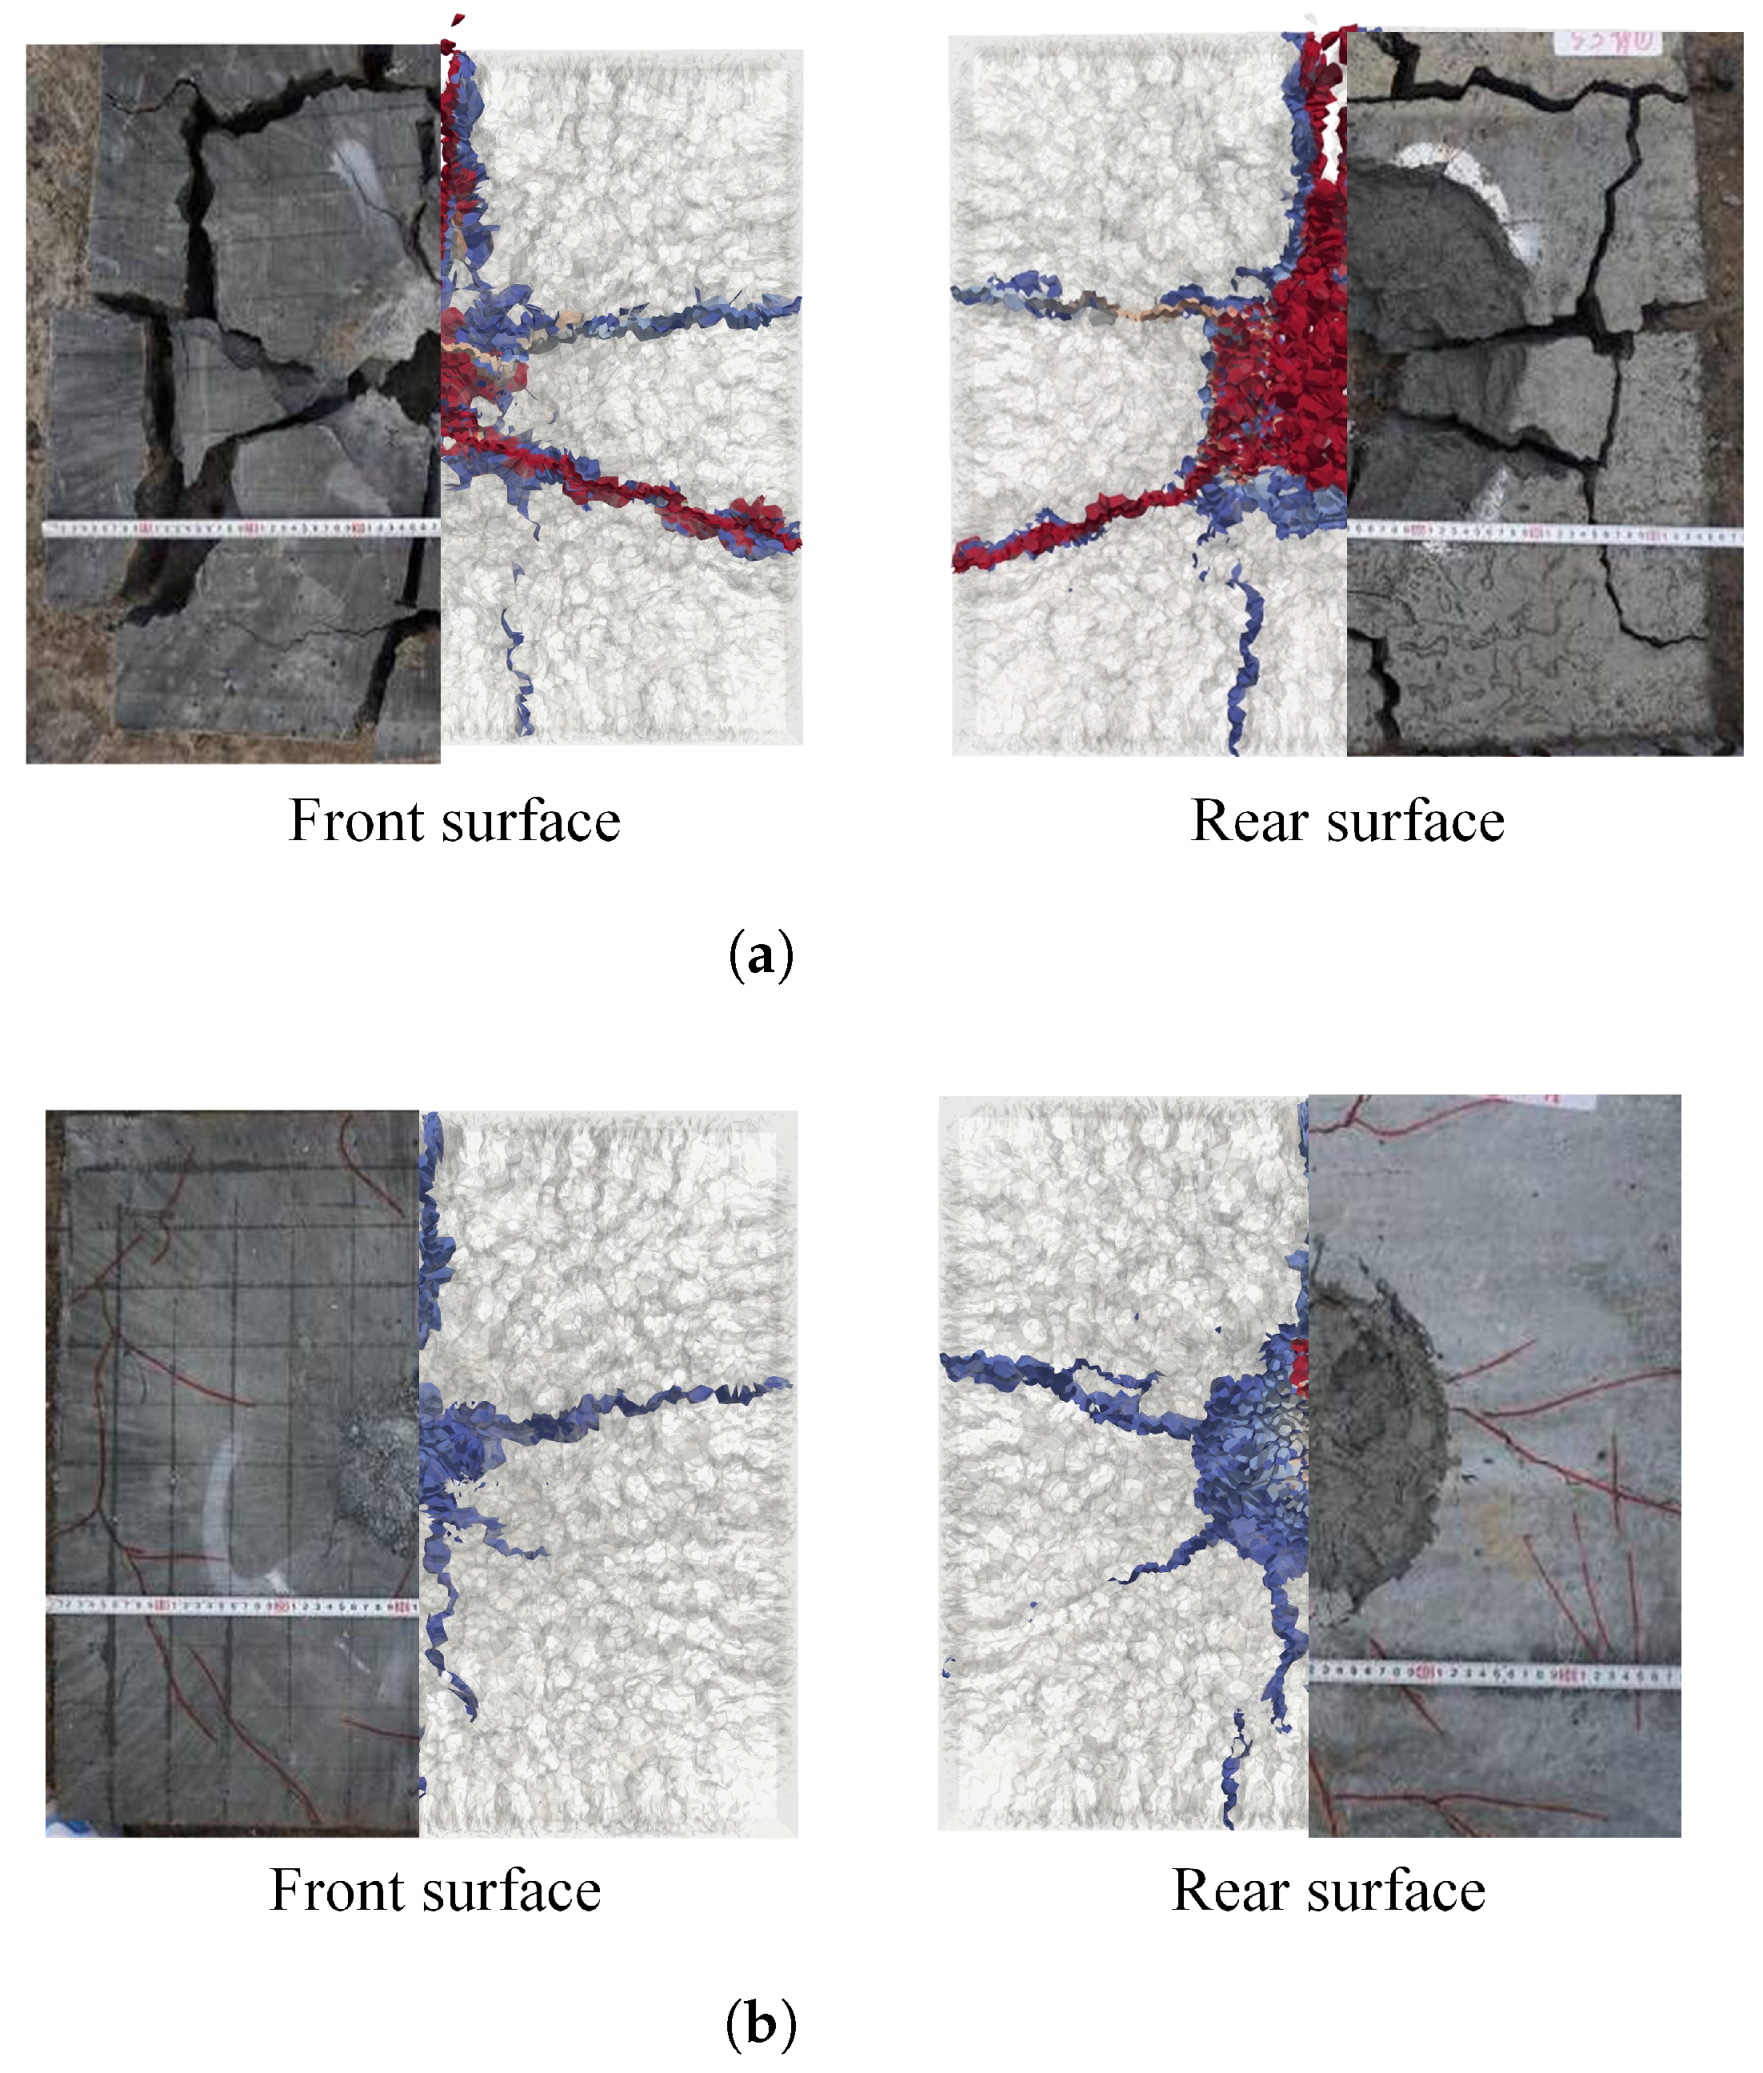
After 5 ms simulation termination time, the numerically derived damage modes of PC and FRC were shown in Figure 18, in which the sizes of the craters on the front and rear surfaces were also presented in detail. The comparison of damage modes between test and simulation results were demonstrated in Figure 19, and detailed data was listed in Table 8 and Table 9.
As can be seen in Figure 18, the PC panel was blown into pieces under blast loadings, just like the test results that the brittleness of the plain concrete was completely demonstrated. The PVA-FRC panel was also perforated by the blast loadings. Compared to PC specimen, the entire panel was greatly enhanced by the PVA fibers in terms of crater sizes on the front and rear surface and the panel integrity. The fiber-bridging effect brought by PVA fibers improved the concrete energy absorption capacity to some extent, as a result the PVA-FRC could withstand a certain amount of blast loadings. However, the steel FRC panels had the least damage, e.g., only craters and a few fine cracks occurred on the surface suggesting that the SFRC panel has the best blast-resistant performance.
The crater sizes of PVA-FRC and SFRC predicted by LDPM-F were listed in Table 8 and Table 9. The comparison of damage modes between test and simulation results were shown in Figure 19. Good agreements were achieved in terms of both crater sizes and crack distribution, which strongly validated the LDPM-F blast model. As a result, the validated LDPM-F blast model was extended to investigate on the fiber content effect on the blast resistance of FRC for further discussion.

4.3. Fiber Content Effect

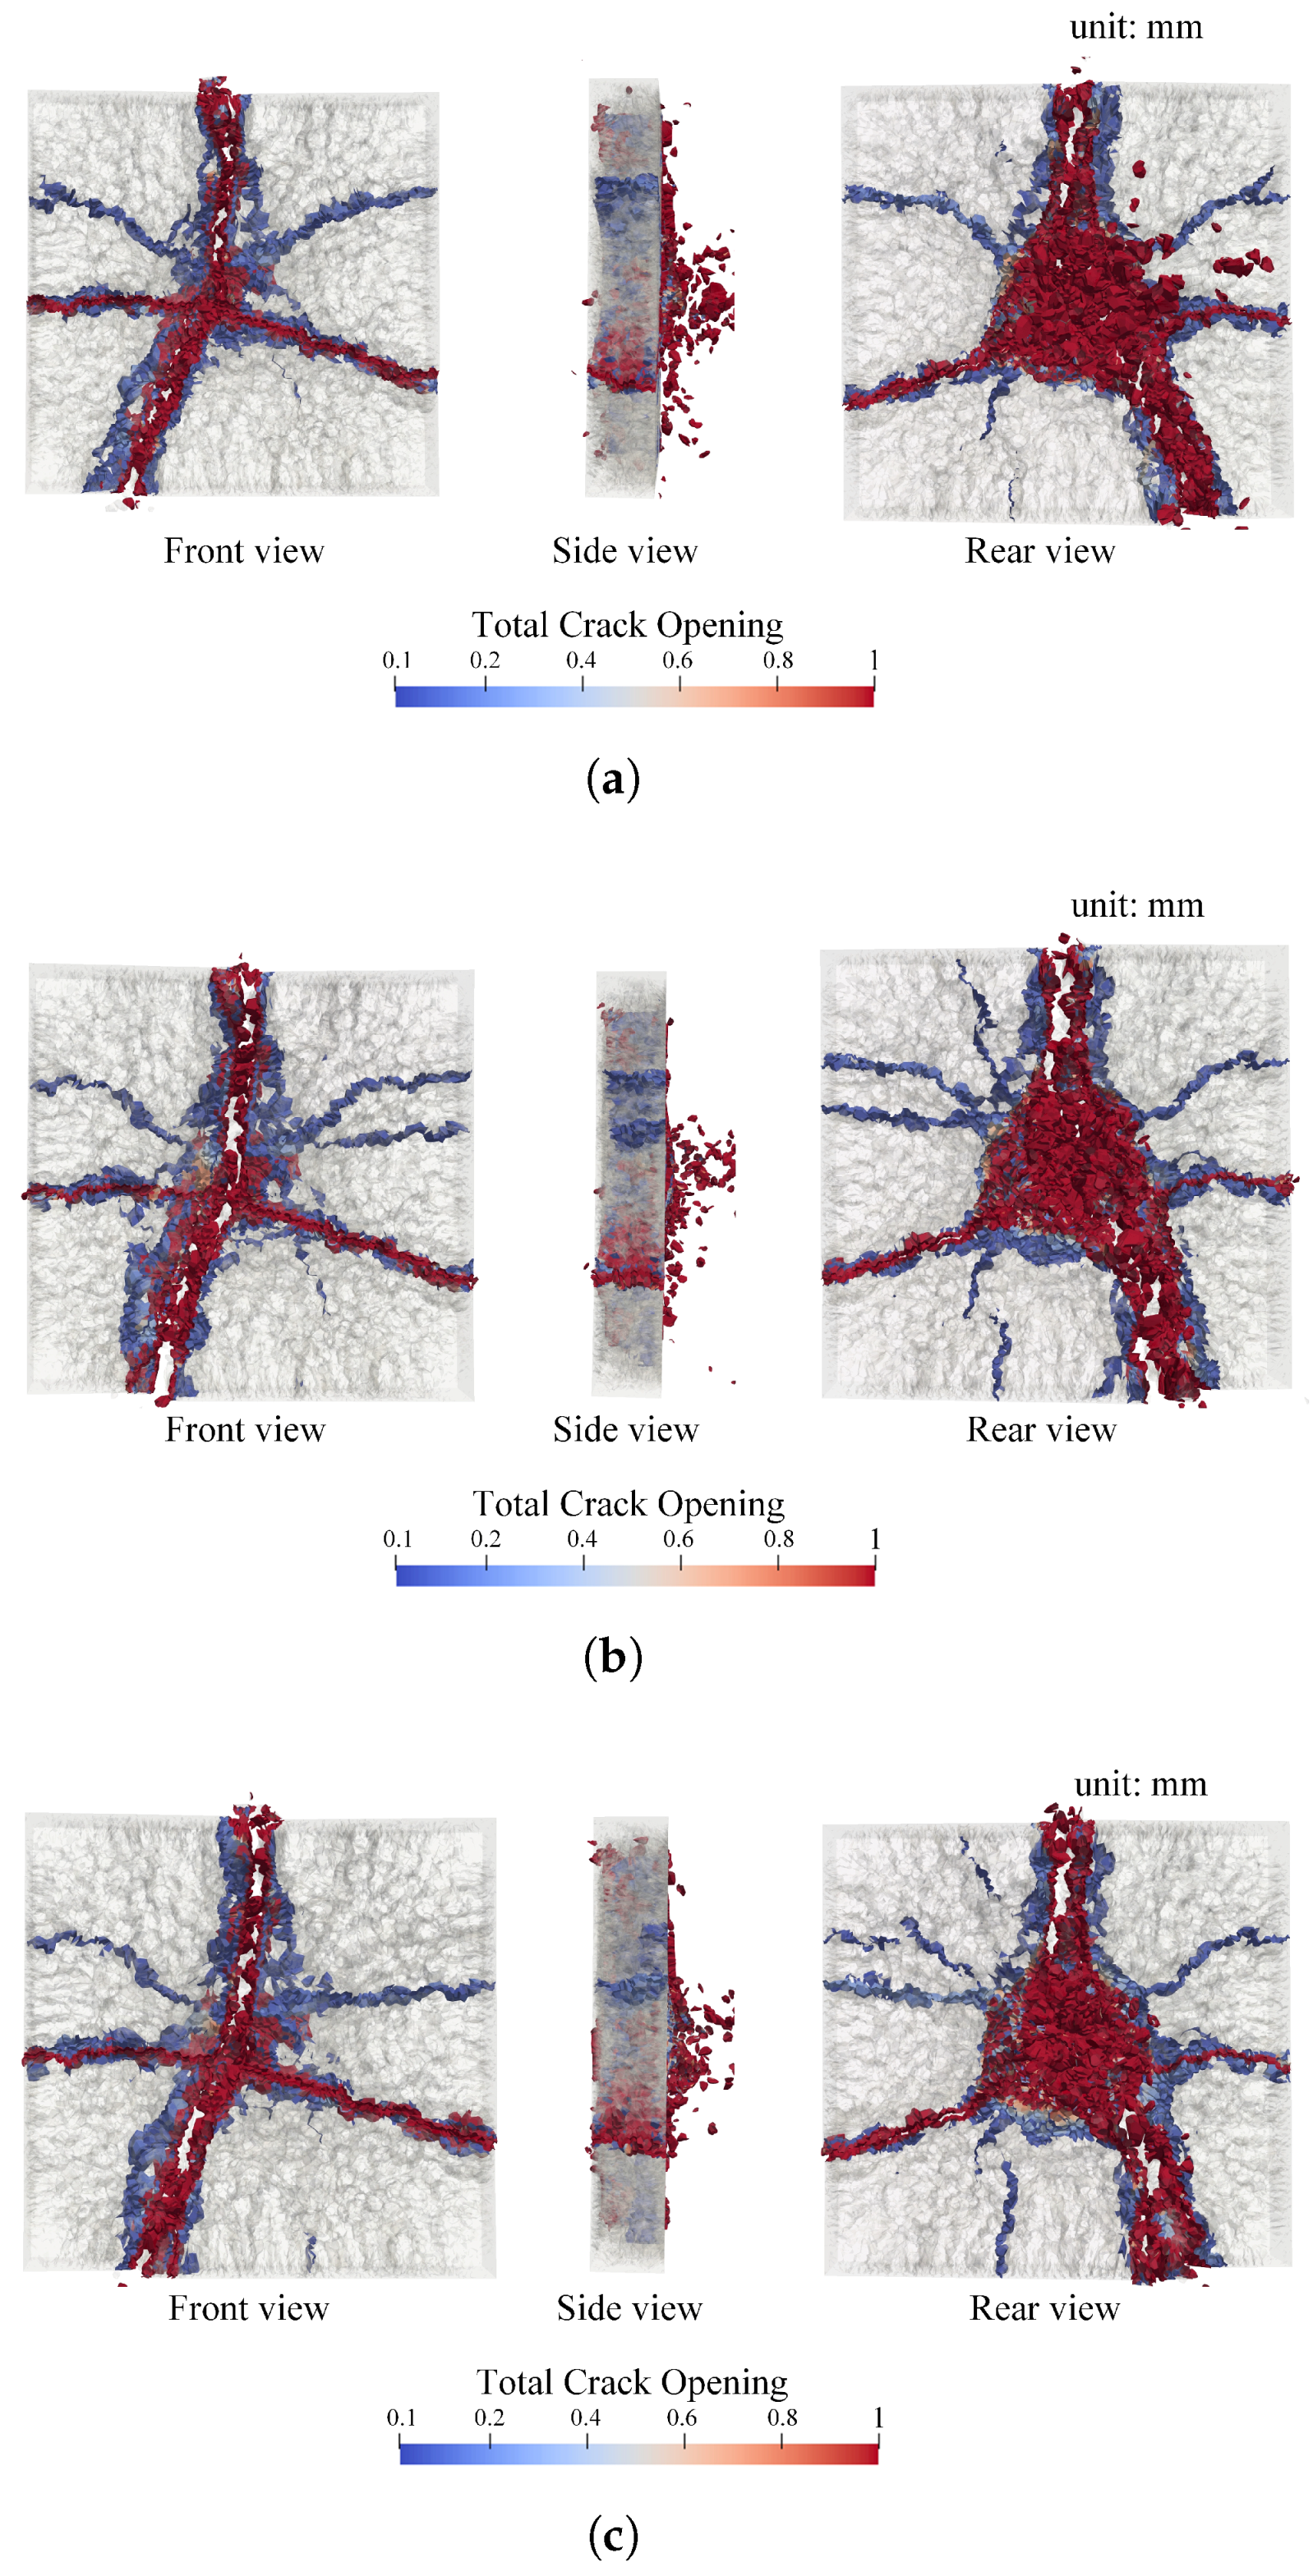
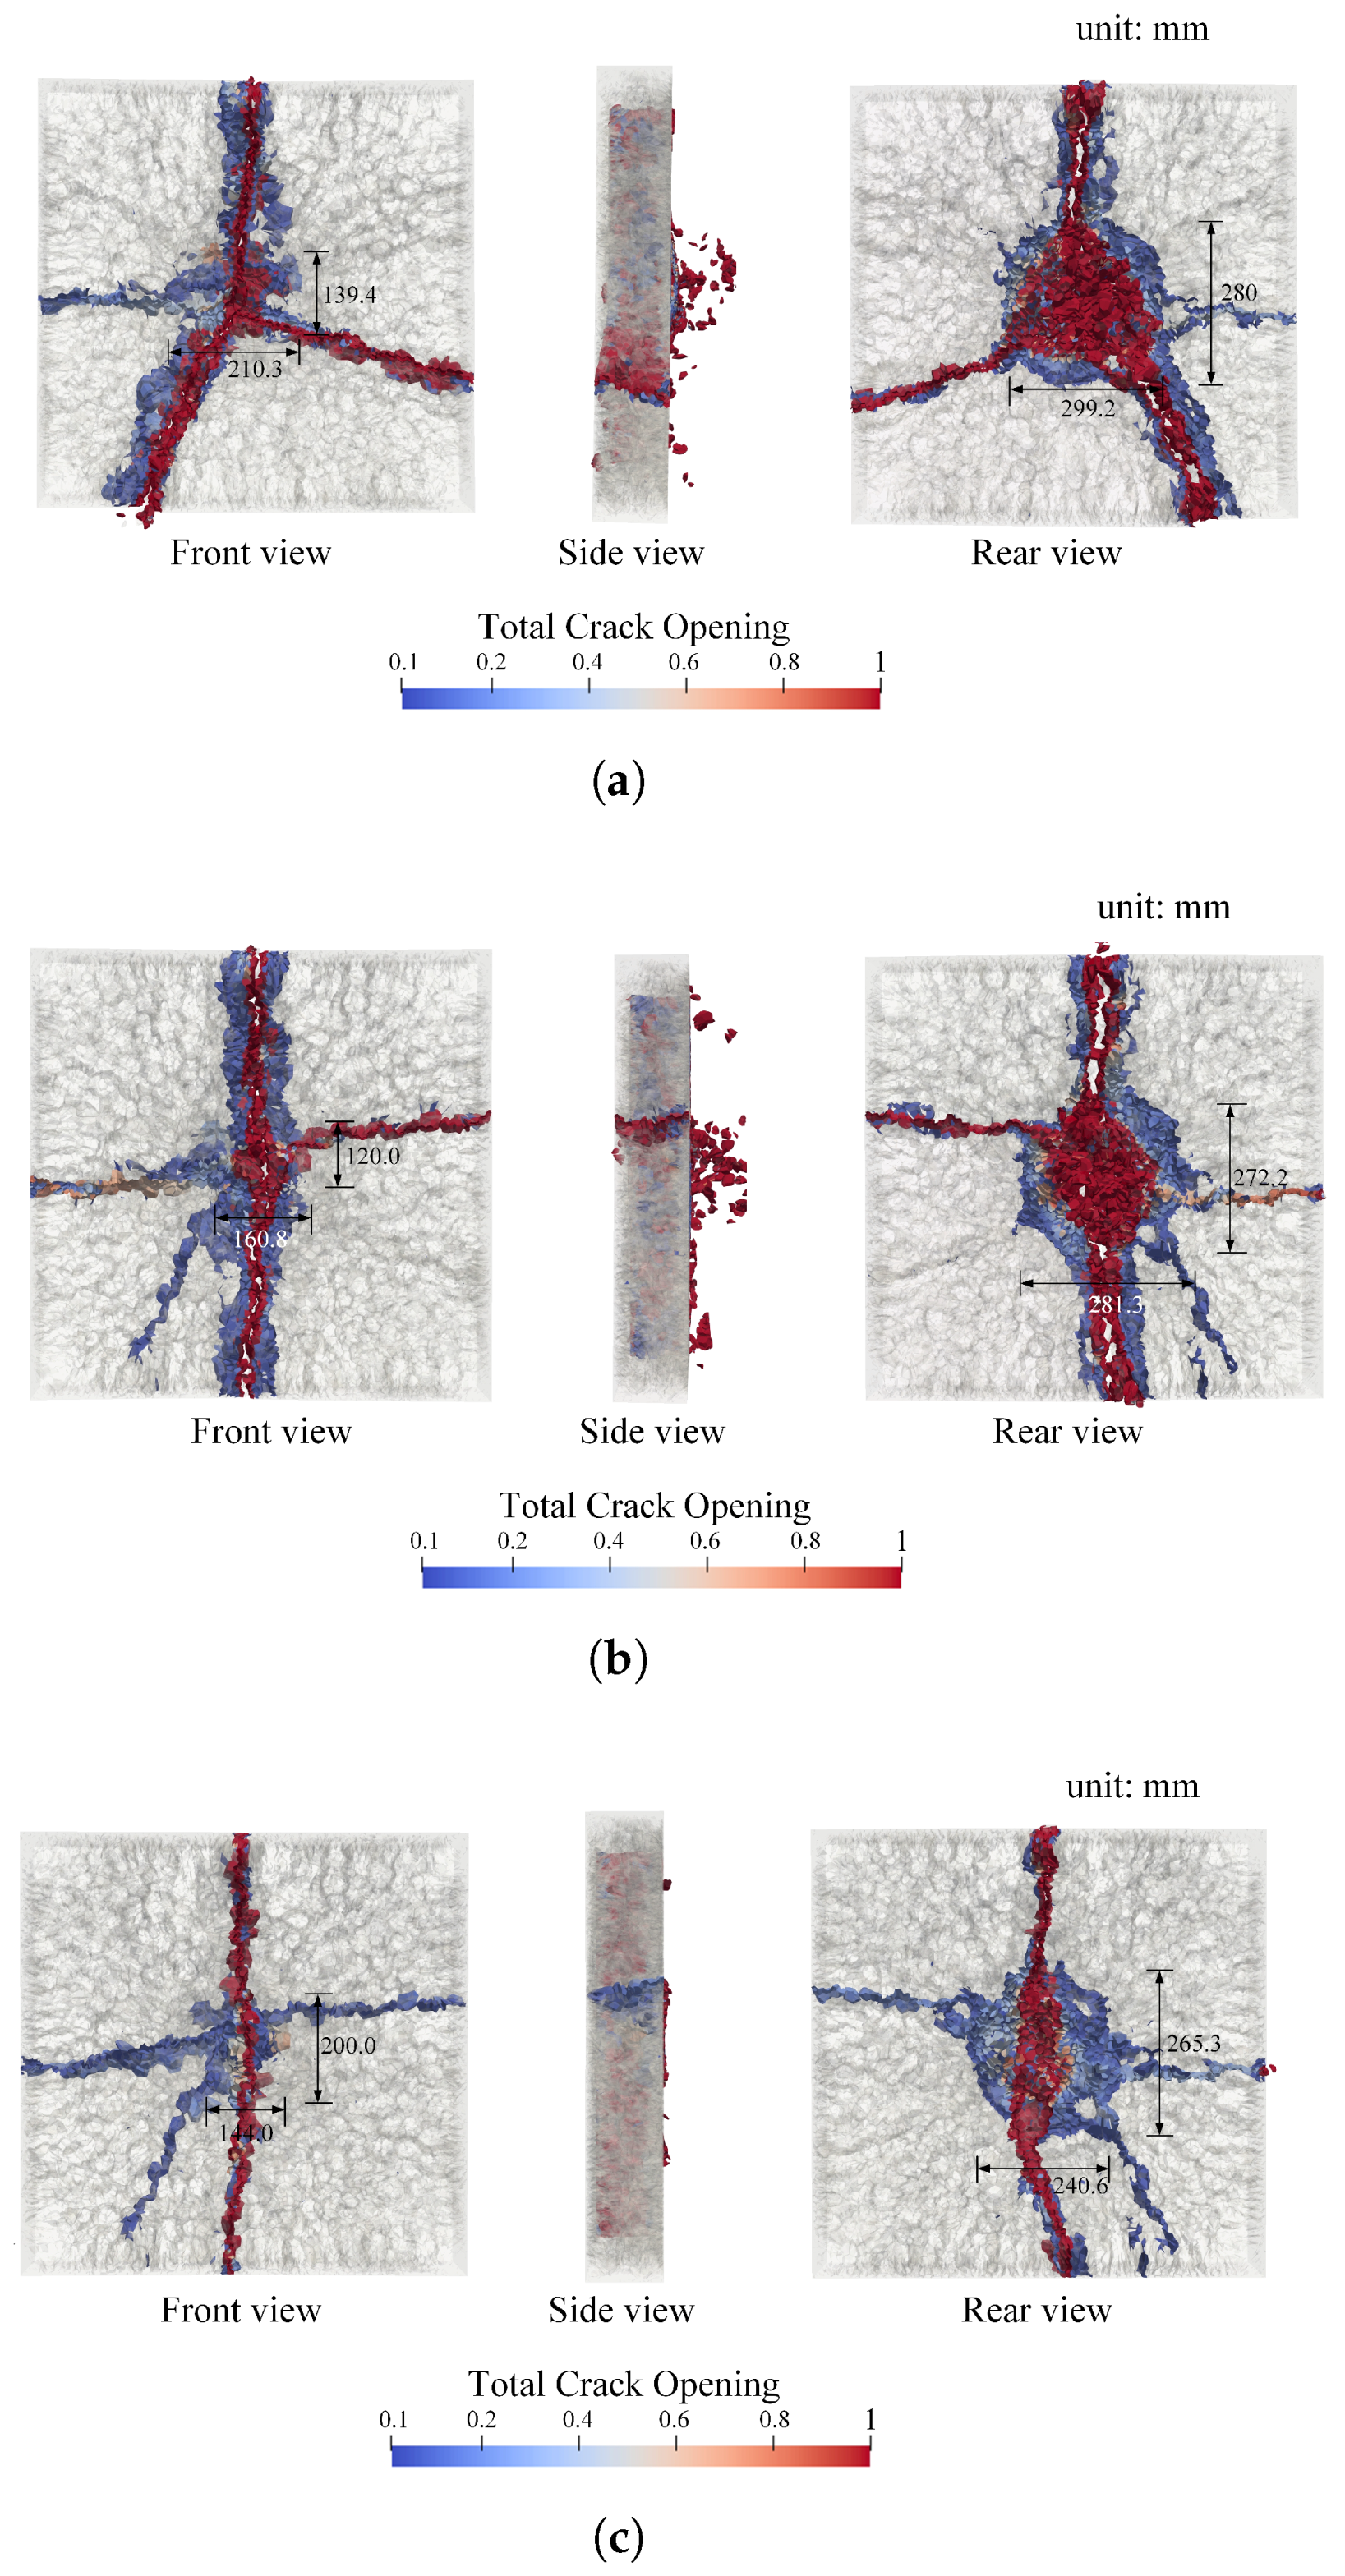
In this section, for the purpose of investigating on the blast resistance and damage modes of FRC with fiber content lower than 2.0%, the fiber content effect on the blast resistance was carried out herein through the validated LDPM-F blast model. For both PVA-FRC and SFRC, specimens embedded into fibers with fiber volume fraction of 0.5%, 1.0% and 1.5% under blast loadings were numerically simulated. The simulation setup was totally same with the contact detonation test. Thereafter, the simulation results were depicted in Figure 20 and Figure 21 in front, side and rear view.
As can be seen in Figure 20, PVA-FRC with fiber content less than 2%, had limited blast resistance improvement since all panels were torn into some smaller blocks due to the reduction of PVA fibers amount. With less PVA fibers bridging cracking gaps, PVA-FRC exhibits reduced ductility and thus losing energy absorption capacity. It can be argued that 2% fiber volume fraction was a proper content for PVA-FRC shelter construction material since lower content leads to significant blast resistance degradation.
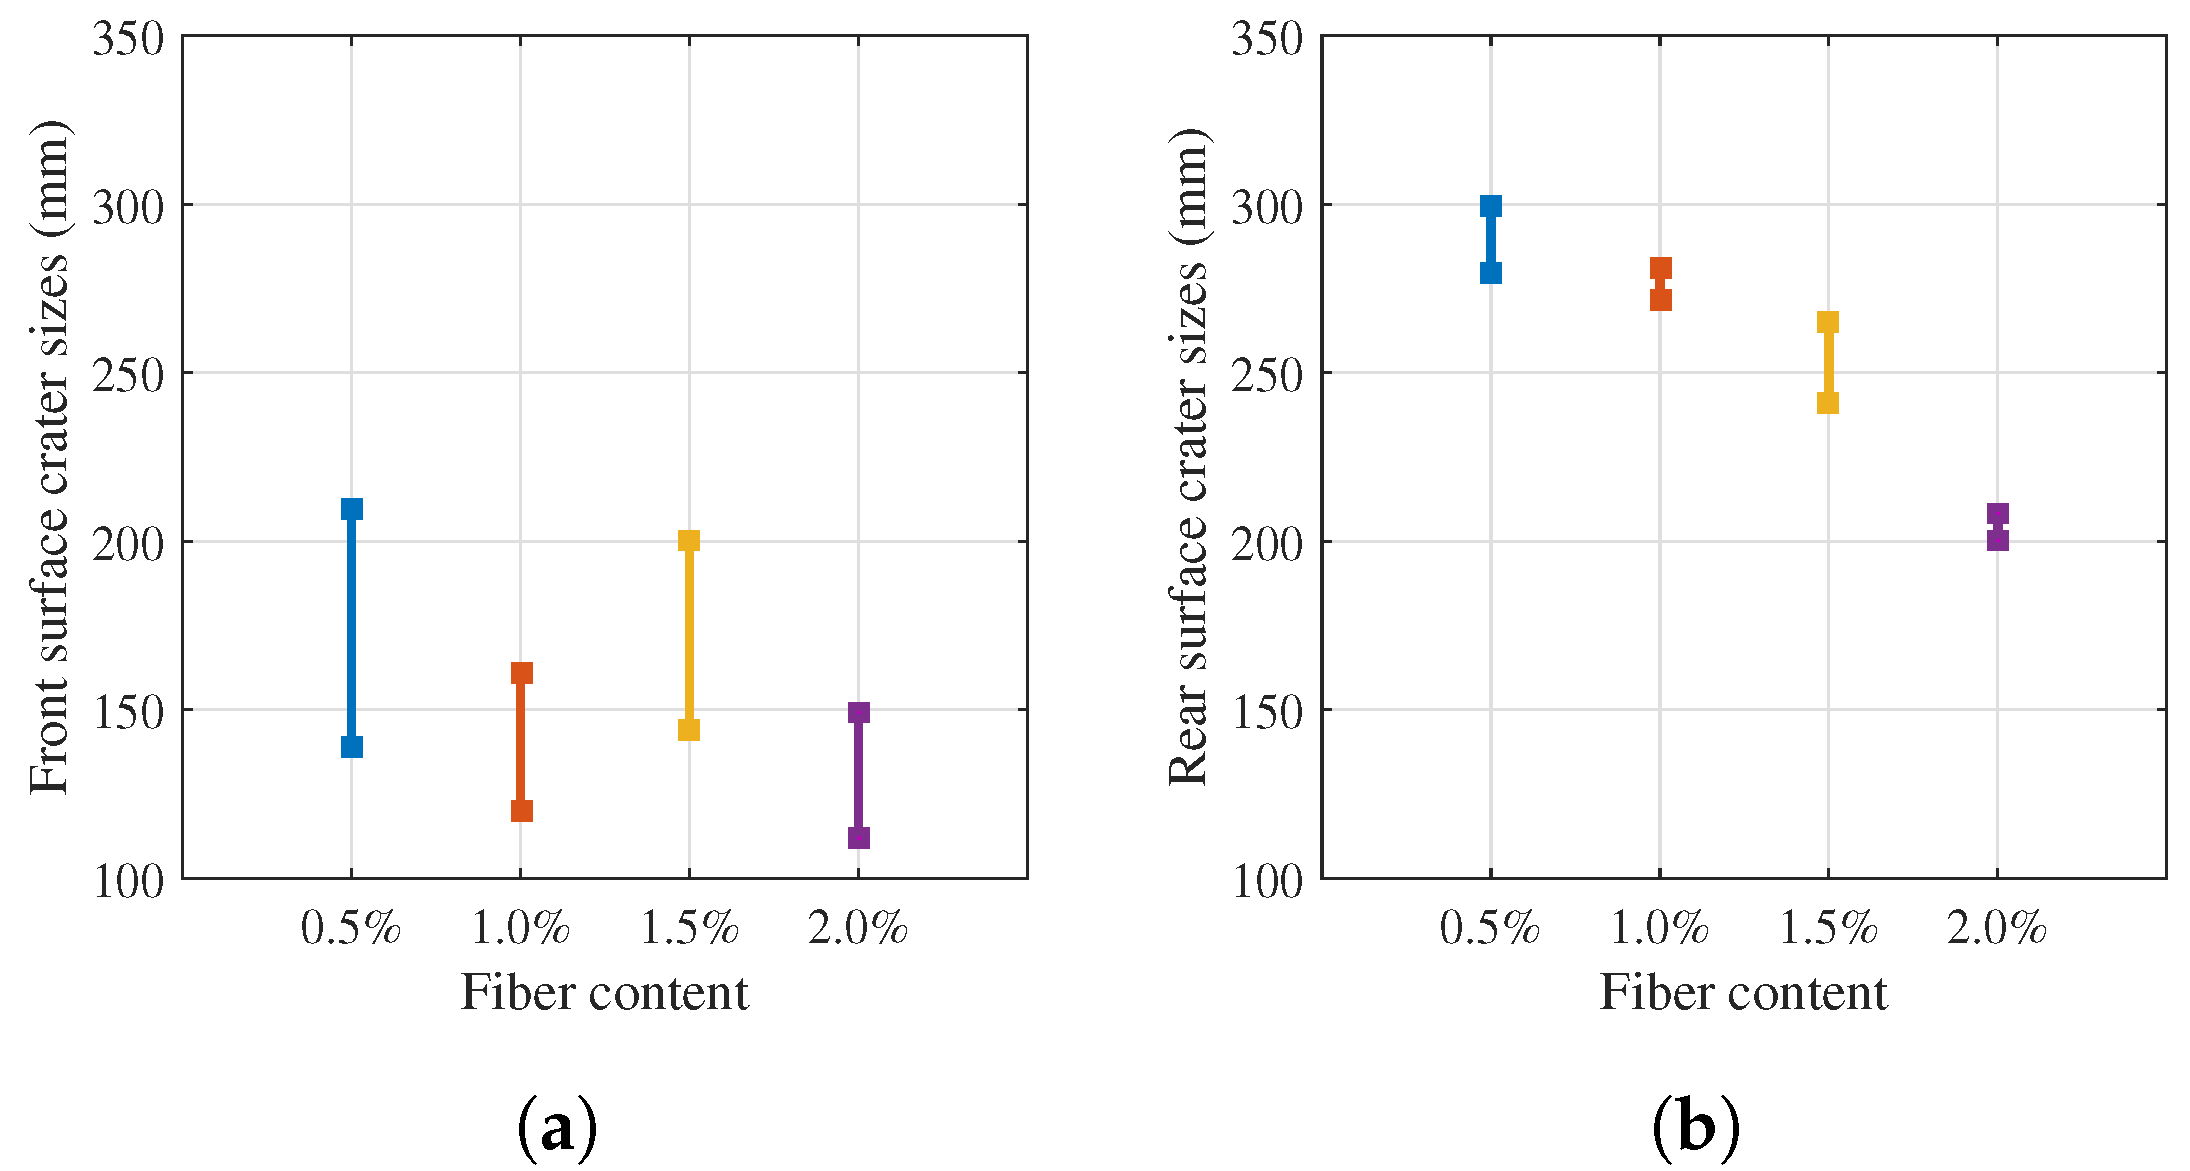
On the contrary, SFRC still behaved substantial blast-resistant performance even for the panel with only 0.5% steel fiber content. It was vividly suggested in the Figure 21 that all the SFRC panels maintain good integrity. With the increase of steel fiber content, less cracks with smaller cracking opening occurred on the panel surface. The strong bond between steel fiber and cementitous matrix contribute to the enhanced bending mechanical behavior even with much less fiber content. The crater sizes of SFRC with different fiber content were denoted in Figure 22 and listed in Table 10. It was demonstrated that as fiber content increases, the front surface crater has some oscillation while the rear surface crater sizes gradually decreases. The front crater mainly caused by compressive stress wave was less affected by the steel fiber content. On the other hand, the reflected tensile stress wave results in rear crater forming which was more sensitive to incorporated fiber dosage.

5. Conclusions

This work aimed at comparative investigating on the blast-resistant performance of steel fiber-reinforced concrete and PVA fiber-reinforced concrete. Experimental program was conducted to characterize the mechanical properties and blast resistance. LDPM-F was introduced to model FRC contact detonation. The validated model was further applied for fiber content effect study. Several conclusions were drawn as follows: (1) The plain concrete could hardly bear the blast loadings. SFRC, PVA-FRC with fiber volume fraction of 2% showed much better blast resistance due to the improved ductility resulting from fiber incorporation. (2) Compared with PVA-FRC, SFRC exhibits higher compressive strength and bending ductility, thus providing better blast resistance against contact detonation. (3) The established LDPM-F blast model can predict the damage modes as well as crater sizes for both PVA-FRC and SFRC panels. (4) For fiber content lower than 2%, the blast-resistant performance of PVA-FRC was greatly degraded, while SFRC specimens still showed good integrity under blast even for panel with only 0.5% volume fraction steel fiber. (5) SFRC panel front surface crater is less affected by the steel fiber content while the rear surface crater is more sensitive to incorporated fiber dosage.

Author Contributions

Data curation, L.C.; Formal analysis, J.F.; Funding acquisition, J.L.; Investigation, B.C. and S.X.; Methodology, C.D.; Project administration, W.S. and J.L.; Software, L.C. and J.F.; Supervision, W.S.; Writing—original draft, L.C.; Writing—review & editing, J.F. All authors have read and agreed to the published version of the manuscript.

Funding

This research was funded by the Natural Science Foundation of Jiangsu Province (No. BK20170824).

Acknowledgments

This research was financial supported by the National Natural Science Foundation of China (No. 11902161). Weiwei Sun thanks the Foundation Strengthening Plan Technology Fund (No. 2019-JCJQ-JJ-371). Bingcheng Chen expresses gratitude to the Postgraduate Research & Practice Innovation Program of Jiangsu Province (No. KYCX20_0377). Le Chen was sponsored by the Postgraduate Research & Practice Innovation Program of Jiangsu Province via Grant No. SJCX19_0118.

Conflicts of Interest

The authors declare no conflict of interest.

References

  1. Yoo, D.; Banthia, N. Mechanical and structural behaviors of ultra-high-performance fiber-reinforced concrete subjected to impact and blast. Constr. Build. Mater. 2017, 149, 416–431. [Google Scholar] [CrossRef]
  2. Feng, J.; Sun, W.; Wang, L.; Chen, L.; Xue, S.; Li, W. Terminal ballistic and static impactive loading on thick concrete target. Constr. Build. Mater. 2020, 251, 118899. [Google Scholar] [CrossRef]
  3. Wang, Z.L.; Shi, Z.M.; Wang, J. On the strength and toughness properties of sfrc under static-dynamic compression. Compos. Part B Eng. 2011, 42, 1285–1290. [Google Scholar] [CrossRef]
  4. Liu, J.; Han, F.; Cui, G.; Zhang, Q.; Lv, J.; Zhang, L.; Yang, Z. Combined effect of coarse aggregate and fiber on tensile behavior of ultra-high performance concrete. Constr. Build. Mater. 2016, 121, 310–318. [Google Scholar] [CrossRef]
  5. Simoes, T.; Octavio, C.; Valenca, J.; Costa, H.; Diasdacosta, D.; Julio, E. Influence of concrete strength and steel fibre geometry on the fibre/matrix interface. Compos. Part B Eng. 2017, 122, 156–164. [Google Scholar] [CrossRef] [Green Version]
  6. Li, P.P.; Brouwers, J.; Yu, Q.Q. Influence of key design parameters of ultra-high performance fibre reinforced concrete on in-service bullet resistance. Int. J. Impact Eng. 2020, 136, 103434. [Google Scholar] [CrossRef]
  7. Zhang, W.; Chen, S.; Zhang, N.; Zhou, Y. Low-velocity flexural impact response of steel fiber reinforced concrete subjected to freeze–thaw cycles in nacl solution. Constr. Build. Mater. 2015, 101, 522–526. [Google Scholar] [CrossRef]
  8. Hong, K.; Lee, S.; Han, S.; Yeon, Y. Evaluation of fe-based shape memory alloy (fe-sma) as strengthening material for reinforced concrete structures. Appl. Sci. 2018, 8, 730. [Google Scholar] [CrossRef] [Green Version]
  9. Picazo, A.; Alberti, M.G.; Galvez, J.C.; Enfedaque, A.; Vega, A.C. The size effect on flexural fracture of polyolefin fibre reinforced concrete. Appl. Sci. 2019, 9, 1762. [Google Scholar] [CrossRef] [Green Version]
  10. Feldman, D. Fibre reinforced cementitious composites. Can. J. Civ. Eng. 1993, 20, 341. [Google Scholar] [CrossRef]
  11. Soe, K.; Zhang, Y.X.; Zhang, L. Material properties of a new hybrid fibre-reinforced engineered cementitious composite. Constr. Build. Mater. 2013, 43, 399–407. [Google Scholar] [CrossRef]
  12. Halvaei, M.; Jamshidi, M.; Latifi, M. Investigation on pullout behavior of different polymeric fibers from fine aggregates concrete. J. Ind. Text. 2016, 45, 995–1008. [Google Scholar] [CrossRef]
  13. Halvaei, M.; Jamshidi, M.; Pakravan, H.R.; Latifi, M. Interfacial bonding of fine aggregate concrete to low modulus fibers. Constr. Build. Mater. 2015, 95, 117–123. [Google Scholar] [CrossRef]
  14. Sim, J.; Park, C.; Moon, D.Y. Characteristics of basalt fiber as a strengthening material for concrete structures. Compos. Part B Eng. 2005, 36, 504–512. [Google Scholar] [CrossRef]
  15. Martinezperez, I.; Valivonis, J.; Salna, R.; Coboescamilla, A. Experimental study of flexural behaviour of layered steel fibre reinforced concrete beams. J. Civ. Eng. Manag. 2017, 23, 806–813. [Google Scholar] [CrossRef] [Green Version]
  16. Jin, C.; Buratti, N.; Stacchini, M.; Savoia, M.; Cusatis, G. Lattice discrete particle modeling of fiber reinforced concrete: Experiments and simulations. Eur. J. Mech. A Solids 2016, 57, 85–107. [Google Scholar] [CrossRef] [Green Version]
  17. Hassan, A.M.T.; Jones, S.W.; Mahmud, G.H. Experimental test methods to determine the uniaxial tensile and compressive behaviour of ultra high performance fibre reinforced concrete (uhpfrc). Constr. Build. Mater. 2012, 37, 874–882. [Google Scholar] [CrossRef]
  18. Pan, Z.; Wu, C.; Liu, J.; Wang, W.; Liu, J. Study on mechanical properties of cost-effective polyvinyl alcohol engineered cementitious composites (pva-ecc). Constr. Build. Mater. 2015, 78, 397–404. [Google Scholar] [CrossRef]
  19. Feng, J.; Sun, W.; Zhai, H.; Wang, L.; Dong, H.; Wu, Q. Experimental study on hybrid effect evaluation of fiber reinforced concrete subjected to drop weight impacts. Materials 2018, 11, 2563. [Google Scholar] [CrossRef] [Green Version]
  20. Olivito, R.S.; Zuccarello, F.A. An experimental study on the tensile strength of steel fiber reinforced concrete. Compos. Part B Eng. 2010, 41, 246–255. [Google Scholar] [CrossRef]
  21. Habel, K.; Gauvreau, P. Response of ultra-high performance fiber reinforced concrete (uhpfrc) to impact and static loading. Cem. Concr. Compos. 2008, 30, 938–946. [Google Scholar] [CrossRef]
  22. Nili, M.; Afroughsabet, V. Combined effect of silica fume and steel fibers on the impact resistance and mechanical properties of concrete. Int. J. Impact Eng. 2010, 37, 879–886. [Google Scholar] [CrossRef] [Green Version]
  23. Nia, A.A.; Hedayatian, M.; Nili, M.; Sabet, V.A. An experimental and numerical study on how steel and polypropylene fibers affect the impact resistance in fiber-reinforced concrete. Int. J. Impact Eng. 2012, 46, 62–73. [Google Scholar]
  24. Naaman, A.E.; Najm, H. Bond-slip mechanisms of steel fibers in concrete. Materials 1991, 88, 135–145. [Google Scholar]
  25. Lee, Y.; Kang, S.; Kim, J. Pullout behavior of inclined steel fiber in an ultra-high strength cementitious matrix. Constr. Build. Mater. 2010, 24, 2030–2041. [Google Scholar] [CrossRef]
  26. Abdallah, S.; Fan, M.; Rees, D.W.A. Bonding mechanisms and strength of steel fiber–reinforced cementitious composites: Overview. J. Mater. Civ. Eng. 2018, 30, 04018001. [Google Scholar] [CrossRef]
  27. Marcalikova, Z.; Cajka, R.; Bilek, V.; Bujdos, D.; Sucharda, O. Determination of mechanical characteristics for fiber-reinforced concrete with straight and hooked fibers. Crystals 2020, 10, 545. [Google Scholar] [CrossRef]
  28. Ma, H.; Cai, J.; Lin, Z.; Qian, S.; Li, V.C. CaCO3 whisker modified engineered cementitious composite with local ingredients. Constr. Build. Mater. 2017, 151, 1–8. [Google Scholar] [CrossRef]
  29. Yao, W.; Sun, W.; Shi, Z.; Chen, B.; Chen, L.; Feng, J. Blast-resistant performance of hybrid fiber-reinforced concrete (hfrc) panels subjected to contact detonation. Appl. Sci. 2019, 10, 241. [Google Scholar] [CrossRef] [Green Version]
  30. Yusof, M.A.; Nor, N.M.; Ismail, A.; Peng, N.C.; Sohaimi, R.M.; Yahya, M.A. Performance of hybrid steel fibers reinforced concrete subjected to air blast loading. Adv. Mater. Sci. Eng. 2013, 2013, 420136. [Google Scholar] [CrossRef] [Green Version]
  31. Feng, J.; Gao, X.; Li, J.; Dong, H.; He, Q.; Liang, J.; Sun, W. Penetration resistance of hybrid-fiber-reinforced high-strength concrete under projectile multi-impact. Constr. Build. Mater. 2019, 202, 341–352. [Google Scholar] [CrossRef]
  32. Huang, S.; Yuan, Z.; Fish, J. Computational framework for short-steel fiber-reinforced ultra-high performance concrete (cor-tuf). Int. J. Multiscale Comput. Eng. 2019, 17, 551–562. [Google Scholar] [CrossRef]
  33. Yang, F.; Xie, W.; Meng, S. Impact and blast performance enhancement in bio-inspired helicoidal structures: A numerical study. J. Mech. Phys. Solids 2020, 142, 104025. [Google Scholar] [CrossRef]
  34. Cusatis, G.; Pelessone, D.; Mencarelli, A. Lattice discrete particle model (ldpm) for failure behavior of concrete. I: Theory. Cem. Concr. Compos. 2011, 33, 881–890. [Google Scholar] [CrossRef]
  35. Schauffert, E.A.; Cusatis, G. Lattice discrete particle model for fiber-reinforced concrete. I: Theory. J. Eng. Mech. 2011, 138, 826–833. [Google Scholar] [CrossRef]
  36. Feng, J.; Yao, W.; Li, W.; Li, W. Lattice discrete particle modeling of plain concrete perforation responses. Int. J. Impact Eng. 2017, 109, 39–51. [Google Scholar] [CrossRef]
  37. Yang, S.; Millard, S.; Soutsos, M.; Barnett, S.; Le, T.T. Influence of aggregate and curing regime on the mechanical properties of ultra-high performance fibre reinforced concrete (uhpfrc). Constr. Build. Mater. 2009, 23, 2291–2298. [Google Scholar] [CrossRef]
  38. Cao, M.; Zhang, C.; Li, Y.; Wei, J. Using calcium carbonate whisker in hybrid fiber-reinforced cementitious composites. J. Mater. Civ. Eng. 2015, 27, 04014139. [Google Scholar] [CrossRef]
  39. Cao, M.; Zhang, C.; Wei, J. Microscopic reinforcement for cement based composite materials. Constr. Build. Mater. 2013, 40, 14–25. [Google Scholar] [CrossRef]
  40. Kanda, T.; Li, V.C. Practical design criteria for saturated pseudo strain hardening behavior in ecc. J. Adv. Concr. Technol. 2006, 4, 59–72. [Google Scholar] [CrossRef] [Green Version]
  41. Feng, J.; Song, M.; Sun, W.; Wang, L.; Li, W.; Li, W. Thick plain concrete targets subjected to high speed penetration of 30crmnsini2a steel projectiles: Tests and analyses. Int. J. Impact Eng. 2018, 122, 305–317. [Google Scholar] [CrossRef]
  42. Shen, L.; Li, W.; Zhou, X.; Feng, J.; Di Luzio, G.; Ren, Q.; Cusatis, G. Multiphysics lattice discrete particle model for the simulation of concrete thermal spalling. Cem. Concr. Compos. 2020, 106, 103457. [Google Scholar] [CrossRef] [Green Version]
  43. Stroeven, P. A stereological approach to roughness of fracture surfaces and tortuosity of transport paths in concrete. Cem. Concr. Compos. 2000, 22, 331–341. [Google Scholar] [CrossRef]
  44. Cusatis, G.; Rezakhani, R.; Schauffert, E.A. Discontinuous cell method (dcm) for the simulation of cohesive fracture and fragmentation of continuous media. Eng. Fract. Mech. 2017, 170, 1–22. [Google Scholar] [CrossRef] [Green Version]
  45. Rezakhani, R.; Cusatis, G. Asymptotic expansion homogenization of discrete fine-scale models with rotational degrees of freedom for the simulation of quasi-brittle materials. J. Mech. Phys. Solids 2016, 88, 320–345. [Google Scholar] [CrossRef] [Green Version]
  46. Yang, E.-H.; Yang, Y.; Li, V.C. Use of high volumes of fly ash to improve ecc mechanical properties and material greenness. ACI Mater. J. 2007, 104, 620. [Google Scholar]
  47. Lin, Z.; Kanda, T.; Li, V.C. On interface property characterization and performance of fiber reinforced cementitious composites. J. Concr. Sci. Eng. 1999, 1, 173–184. [Google Scholar]
  48. Feng, J.; Sun, W.; Liu, Z.; Cui, C.; Wang, X. An armour-piercing projectile penetration in a double-layered target of ultra-high-performance fiber reinforced concrete and armour steel: Experimental and numerical analyses. Mater. Des. 2016, 102, 131–141. [Google Scholar] [CrossRef]
  49. Leung, C.K.; Ybanez, N. Pullout of inclined flexible fiber in cementitious composite. J. Eng. Mech. 1997, 123, 239–246. [Google Scholar] [CrossRef]
  50. Leung, C.K.; Chi, J. Crack-bridging force in random ductile fiber brittle matrix composites. J. Eng. Mech. 1995, 121, 1315–1324. [Google Scholar] [CrossRef]
  51. Yang, E.-H.; Wang, S.; Yang, Y.; Li, V.C. Fiber-bridging constitutive law of engineered cementitious composites. J. Adv. Concr. Technol. 2008, 6, 181–193. [Google Scholar] [CrossRef] [Green Version]
  52. Feng, J.; Song, M.; He, Q.; Sun, W.; Wang, L.; Luo, K. Numerical study on the hard projectile perforation on rc panels with ldpm. Constr. Build. Mater. 2018, 183, 58–74. [Google Scholar] [CrossRef]
Figure 1. Fibers used for steel fiber-reinforced concrete (SFRC) and polyvinyl alcohol (PVA) fiber-reinforced concrete (PVA-FRC).
Crystals 10 00707 g001
Figure 2. Setup of the uniaxial compression test.
Crystals 10 00707 g002
Figure 3. Setup of the three-point bending test.
Crystals 10 00707 g003
Figure 4. Failure modes of tested and simulated specimens after 3PBT. (a) Test results, (b) Simulation results.
Crystals 10 00707 g004
Figure 5. Fiber reinforcement effect on compressive and flexure strength.
Crystals 10 00707 g005
Figure 6. Blast test setup. (a) Test setup, (b) Top view.
Crystals 10 00707 g006
Figure 7. Damage modes of specimens after contact detonation. (a) S1-1, (b) S1-2, (c) S2-1 front, (d) S2-1 rear, (e) S2-2 front, (f) S2-2 rear, (g) S3-1 front, (h) S3-1 rear, (i) S3-2 front, (j) S3-2 rear.
Crystals 10 00707 g007
Figure 8. Crater sizes of SFRC and PVA-FRC panels. (a) Front surface, (b) Rear surface.
Crystals 10 00707 g008
Figure 9. SEM images for steel fiber surface. (a) Original steel fiber, (b) Fiber after blast.
Crystals 10 00707 g009
Figure 10. Lattice Discrete Particle Model (LDPM) polyhedral particles and cell discretization for a typical notched beam specimen. (a) Aggregate system, (b) Particles with interaction facets, (c) LDPM cell discretization.
Crystals 10 00707 g010
Figure 11. Spalling effect of fiber pullout.
Crystals 10 00707 g011
Figure 12. Fiber distribution in a panel.
Crystals 10 00707 g012
Figure 13. Simulation constrains. (a) Uniaxial compression, (b) 3-point bending test.
Crystals 10 00707 g013
Figure 14. LDPM parameter calibration with test data. (a) Uniaxial compression, (b) 3-point bending test.
Crystals 10 00707 g014
Figure 15. Comparison between simulation and PVA-FRC tests. (a) Uniaxial compression, (b) 3-point bending test.
Crystals 10 00707 g015
Figure 16. Comparison between simulation and SFRC tests. (a) Uniaxial compression, (b) 3-point bending test.
Crystals 10 00707 g016
Figure 17. Blast simulation model.
Crystals 10 00707 g017
Figure 18. The damage modes of plain concrete (PC) and FRC under blast loadings. (a) Plain concrete (PC), (b) PVA-FRC, (c) SFRC.
Crystals 10 00707 g018
Figure 19. The comparison between damage modes of test and simulation results. (a) PVA-FRC, (b) SFRC.
Crystals 10 00707 g019
Figure 20. Damage modes of PVA-FRC with different fiber content under blast loadings. (a) 0.5% fiber volume fraction, (b) 1.0% fiber volume fraction, (c) 1.5% fiber volume fraction.
Crystals 10 00707 g020
Figure 21. Damage modes of SFRC with different fiber content under blast loadings. (a) 0.5% fiber volume fraction, (b) 1.0% fiber volume fraction, (c) 1.5% fiber volume fraction.
Crystals 10 00707 g021
Figure 22. Crater sizes prediction of SFRC panels with different fiber content. (a) Front surface, (b) Rear surface.
Crystals 10 00707 g022
Table 1. Normalized mix proportion.
CementFly AshWaterQuartz SandSuperplasticizer
1.000.1250.250.450.02
Table 2. Mechanical properties of fibers.
Fiber TypeDiameter ( μ m)Length (mm)Density (g/cm 3 )Tensile Strength (MPa)Elastic Modulus (GPa)
PVA3012–151.3010008
Steel22012–157.851200200
Table 3. Static test results.
Test DataPCPVA-FRCSFRC
Flexural strength f f (MPa)8.6712.3426.95
Compressive strength f c (MPa)70.5784.81109.66
Table 4. Concrete mixture for blast test.
No.QuantityPVA Fiber Volume Ratio (%)Steel Fiber Volume Ratio (%)
S12--
S222.00-
S32-2.00
Table 5. Damaged crater for each specimen.
No.Front Crater Size (mm)Front Crater Depth (mm)Rear Crater Size (mm)
S1-1---
S1-2---
S2-1245 × 320-336 × 390
S2-2234 × 289-207 × 273
S3-1139 × 15620230 × 290
S3-2152 × 20433241 × 280
Table 6. LDPM parameters.
E 0 [MPa] α [-] σ t [MPa] σ c 0 [MPa] σ s / σ t [-] l t [mm] n t [-] H c 0 / E 0 [-] σ N 0 [MPa] k c 0 [-]
80,6100.254.551505.552000.10.46004
Table 7. Lattice Discrete Particle Model-Fiber (LDPM-F) parameters.
Fiber Type E f [MPa] k sp [-] σ uf [MPa] k rup [-] k sn [-] τ 0 [MPa] G d [N/m] β [-] γ f [-]
Steel fiber210,00050028000.20.26.00.00.00.6
PVA fiber30,00030010000.00.22.530.051.0
Table 8. The comparison of the PVA-FRC crater size between test and simulation results.
No.Front Surface (mm)Rear Surface (mm)
S2-1245 × 320336 × 390
S2-2234 × 289207 × 273
Simulation prediction183 × 221293 × 332
Table 9. The comparison of the SFRC crater size between test and simulation results.
No.Front Surface (mm)Rear Surface (mm)
S3-1139 × 156230 × 290
S3-2152 × 204241 × 280
Simulation prediction112 × 149200 × 208
Table 10. The crater sizes of SFRC with different fiber content.
Fiber ContentFront Surface (mm)Rear Surface (mm)
0.5%139 × 210280 × 299
1.0%120 × 161272 × 281
1.5%200 × 144265 × 241
2.0%112 × 149200 × 208