Article

Quantitative Structure–Property Relationships from Experiments for CH4 Storage and Delivery by Metal–Organic Frameworks

Department of Chemical and Petroleum Engineering, United Arab Emirates University, Al-Ain, UAE
Crystals 2020, 10(8), 700; https://doi.org/10.3390/cryst10080700
Submission received: 15 July 2020 / Revised: 8 August 2020 / Accepted: 11 August 2020 / Published: 13 August 2020
(This article belongs to the Special Issue Metal-Organic Frameworks)

Abstract

:
Quantitative structure–property relationships (QSPRs) can be applied to metal–organic frameworks (MOFs) to allow for reasonable estimates to be made of the CH4 storage performance. QSPRs are available for CH4 storage of MOFs, but these were obtained from Grand Canonical Monte Carlo (GCMC) simulations which have come under scrutiny and of which the accuracy has been questioned. Here, QSPRs were developed from experimental data and insights are provided on how to improve storage and deliverable CH4 storage capacity based on material properties. Physical properties of MOFs, such as density, pore volume, and largest cavity diameter (LCD), and their significance for CH4 storage capacity were assessed. One relationship that was found is that CH4 gravimetric storage capacity is directly proportional to Brunauer–Emmett–Teller (BET) surface area (r2 > 90%). The QSPRs demonstrated the effect of van der Waals forces involved in CH4 adsorption. An assessment was made of the accuracy of QSPRs made by GCMC as compared to QSPRs derived from experimental data. Guidelines are provided for optimal design of MOFs, including density and pore volume. With the recent achievement of the gravimetric 2012 DOE CH4 storage target, the QSPRs presented here may allow for the prediction of structural descriptors for CH4 storage capacity and delivery.

Graphical Abstract

1. Introduction

Metal–organic frameworks (MOFs) are compounds comprised of metal nodes coordinated to organic ligands [1,2,3,4,5,6]. The metal ions form a cluster known as the secondary building unit (SBU), which can be linked by organic compounds through reticular synthesis to form designed three-dimensional structures for CH4 storage and delivery (Figure 1). Reticular synthesis allows for the molecular assembly of MOFs with a structure tailored for CH4 storage. HKUST-1 (Hong Kong University of Science and Technology) is among the MOF compounds that can be used for methane storage [7]. HKUST-1 is a MOF used as a benchmark for medium-pressure ranges (35–65 bar) [8]. HKUST-1 is composed of copper centers and benzene-1,3,5-tricarboxylate (BTC) organic linkers [9,10]. This MOF is notable and has a surface area of 1800 m2 g−1 [9,11,12].
The design of MOFs for high CH4 storage and deliverable capacity requires an understanding of how MOFs’ structure and properties affect storage and deliverable capacity. This is a highly effective strategy because MOFs can be designed using a molecular building-block approach to possess certain geometrical and topological features, which lead to the measured density, pore volume, void fraction, etc. of these materials. The relationships between these properties and CH4 storage and deliverable capacity developed through quantitative structure–property relationships (QSPRs) allow these materials to be designed, synthesized, and tested to meet CH4 storage targets more efficiently. One storage target was set by the 2012 United States (US) Department of Energy (DOE) program for methane-storage systems, called Methane Opportunities for Vehicular Energy (MOVE) [13]. The target set by the program was to achieve a gravimetric capacity of 0.5 g (methane) g−1 and a volumetric capacity of 350 cm3 (STP = standard temperature and pressure equivalent: T = 273.15 K, P = 101.325 kPa) cm−3, which corresponds to 250 g (methane) L−1 [14,15,16]. The critical issue for this approach is how to develop structure–property relations which are effective and accurate based on key structural features, in order to be able to make a quick estimate of whether the MOF is likely to meet the storage target.
The development of QSPRs provides models that may be used to yield estimates of CH4 storage performance by provided key material properties, without the theory required for first-principles calculations. QSPRs developed based on three-dimensional descriptors have been wrong [17]. QSPR models have been developed using Grand Canonical Monte Carlo simulations [18]. For computational methods, there is always a question regarding the necessary degree of detail associated with the molecular structure of the MOF. Different computational approaches are available, including molecular mechanics and ab initio programs. Structures can be complex and heterogeneous, and various 3D molecular descriptors may therefore be used. In addition, material structures are not static but are in fact dynamic, and have various molecular conformations. This may lead to misleading information from QSPRs developed using simulations. This is a fundamental problem that needs to be addressed for QSPRs to become more effective and reliable.
In this study, QSPR analysis was used to predict CH4 adsorption capacity and, more importantly, delivery, based on experimental properties and the underlying molecular structure of MOFs. For practical applications, deliverable capacity is an important variable to assess the performance of these materials. The deliverable capacity is a measure of the amount of available gas released between the upper storage pressure and lower pressure (5 bar) required at the engine inlet of the adsorption–desorption process. The deliverable capacity is affected by properties of the MOF material such as pore architecture [19], pore spacing [20], linker [21,22], functional groups [23,24], and hydrophobicity [25,26]. For this QSPR study, experimental descriptors were selected and QSPR analysis was conducted via regression analysis. BET surface area, pore volume, and density were experimental descriptors used in the analysis, as well as the largest cavity diameter (LCD) and pore limiting diameter (PLD) which were used to molecularly represent the pores. The accuracy of computational QSPR models was assessed as compared to the developed experimental model. In addition, a relationship between experimental properties of MOFs and CH4 storage and delivery was developed and investigated.

2. Materials and Methods

Over 150 MOFs with known experimentally determined crystal structures, densities, pore volumes, isosteric heats of adsorption (Qst), CH4 uptakes, and CH4 deliveries were selected for QSPR analysis (Table 1 and Supplementary Materials). In addition, the computation-ready experimental (CoRE) MOF database was used to supplement the experimental data to obtain additional physical properties of the MOFs [27]. The CoRE database does not contain any disordered structures. Because the QSPR models were determined from experimental data, the reliability of the work was not affected by the disorder, group position disorder, or lattice deformation of the MOF, or the properties that are not included in the CoRE database. These factors were already taken into account during measurement of the properties obtained through N2 and CH4 adsorption. In the future, artificial intelligence (AI) and machine-learning algorithms may be able to play a role in incorporating and modeling these features in the structures of these real materials to maximize CH4 storage [28]. The CH4 uptake includes excess CH4 adsorbed. The framework topologies, LCD, PLD, accessible surface area, metal sites, and whether or not the MOFs had open metal sites were noted. LCD was used as an important descriptor to determine whether the pores were efficiently utilized for adsorption and packing of CH4 molecules without dead or free space. LCD was selected based on its previously demonstrated success in improving CH4 storage [15]. The objective was to increase the adsorption over that of a pressurized CH4 tank that does not contain a MOF. Organic linkers and functional groups were also selected to better analyze the relationships between structure and performance. This information allowed the MOFs to be classified and grouped. This classification was used to partition MOFs into subsets based on their common properties to obtain additional QSPRs.
Data were obtained at 298 K and at 65 and 35 bar. Deliverable capacities were determined based on the difference between the available gas released between the upper storage pressure and lower pressure (5 bar) required at the engine inlet of the adsorption–desorption process. Gravimetric uptakes were calculated when not available, based on the density of the MOF and the density of CH4 gas at STP. LCD, PLD, and metal sites were obtained from the CoRE MOF database [27]. Adsorption isotherms were used when available and needed to determine deliverable capacity when not reported.
The electronic environment of the MOF was also considered as a descriptor, including the electronegativity of functional groups in MOFs and their effects on van der Waals interactions between the MOF and CH4. Correlational analysis was used to establish regressions. Various structural descriptors were used to describe the molecular dimensions of the MOFs, as well as intensive experimental variables as opposed to extensive variables.
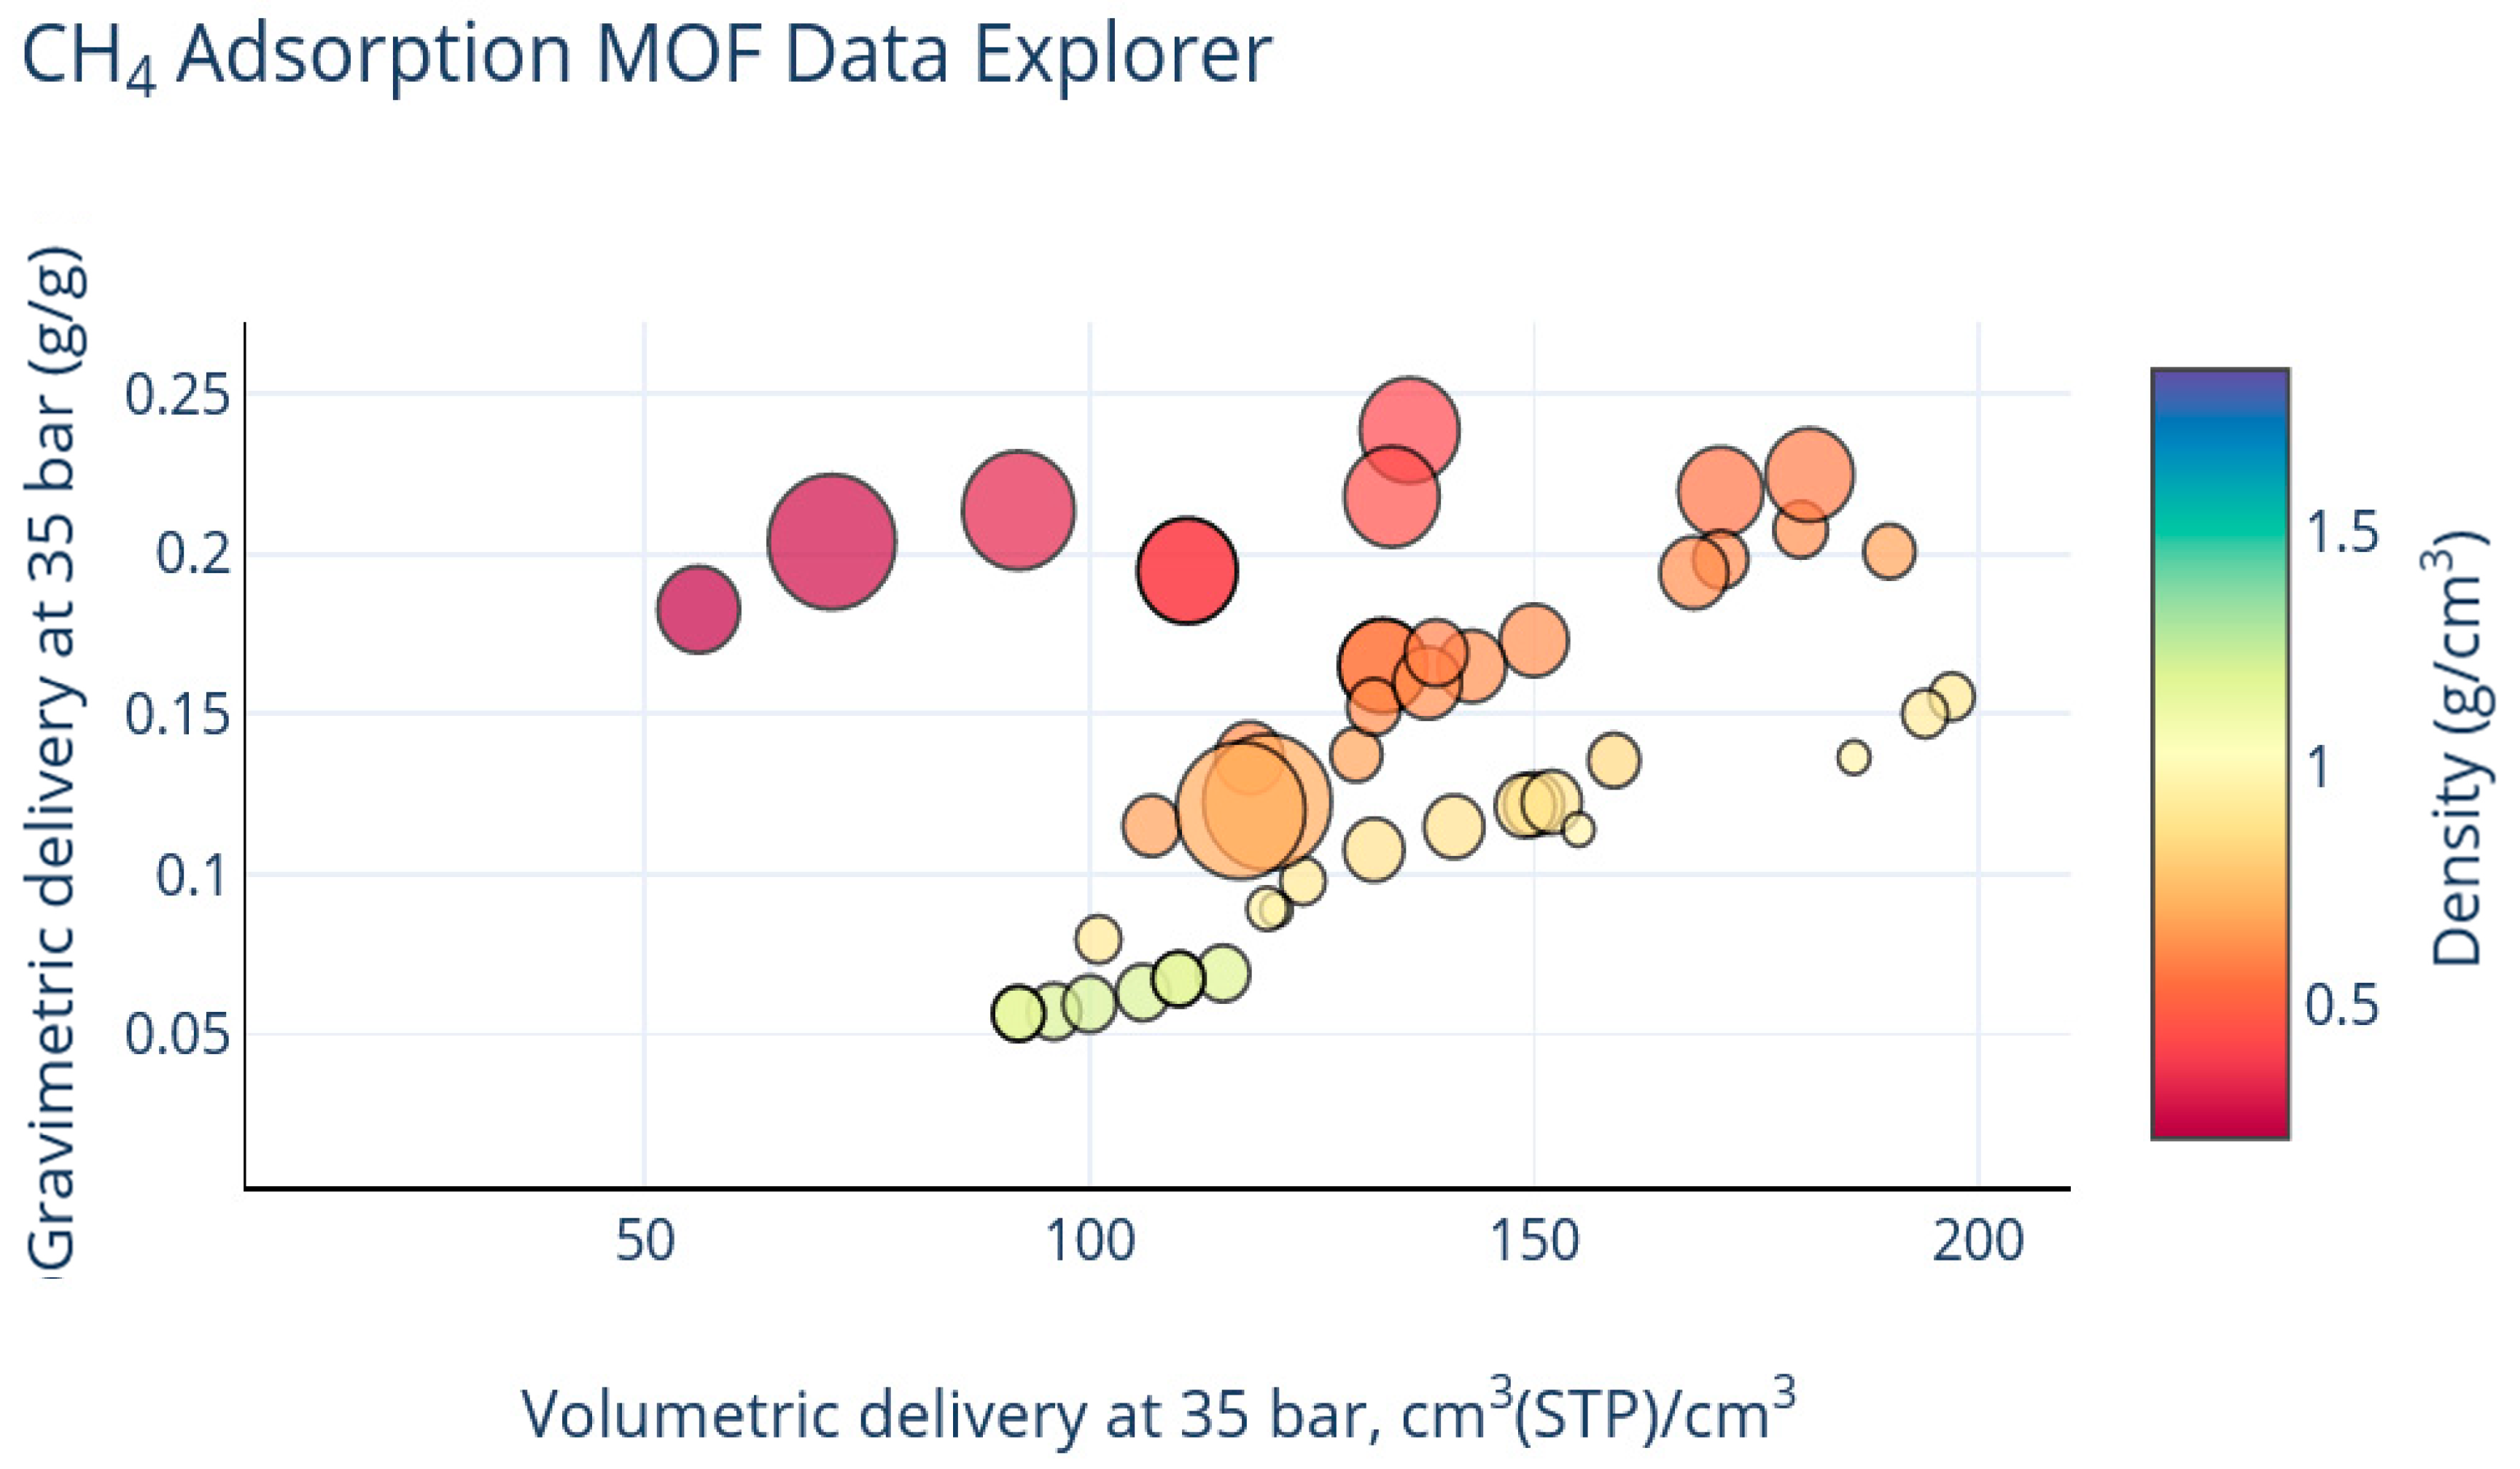
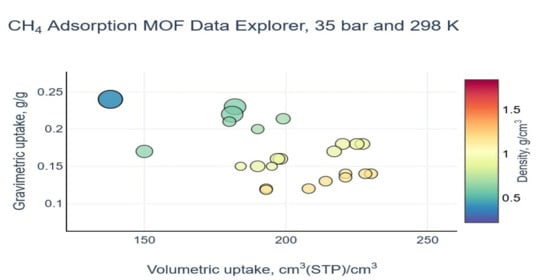
The results were plotted using a 5D visualization platform named the CH4 Adsorption MOF Data Explorer, which was generated using experimental data to establish structure–property relationships. This allowed for the generation of structure–property figures at various pressures and conditions. The explorer allowed for the assessment of uptake and delivery of CH4. In the explorer, MOFs that were considered outliers could be monitored. Various structural parameters were assessed, including the pore volume, Vp, BET surface area, void fraction, Qst, LCD, LPD, etc., and snapshots were captured of their behavior for QSPR analysis.
Molecular and experimental descriptors of the MOFs were analyzed and selected for QSPR model building. The model was validated by calculating the coefficient of determination or r2. r2 is the proportion of the variance in the dependent variable that is predictable from the independent variable. r2 was determined using the following equation:
r 2 = S S R S S T
where SSR is the sum of squares of regression and SST is the total sum of squares. r2 measures how effective a model is at predicting CH4 uptake or delivery.

3. Results

Important variables influencing CH4 adsorption capacity and CH4 delivery were identified through QSPR analysis based on experiments. These structural descriptors were used to predict CH4 uptake and delivery in order to provide insights into MOF design and to improve material design and discovery. Important structural parameters which have a significant effect on CH4 storage and delivery were identified. The density of the MOF and the LCD were found to be significant.
The relationship between the properties of MOFs is important in the design of better CH4 adsorbents. An increase in pore volume, Vp, was associated with an increase in BET surface area (Figure 2). Increasing BET surface area was associated with decreasing density and increasing LCD. For a BET surface area greater than 6000 m2/g, the pore volume was estimated to be greater than 3 cm3/g. Larger BET surface areas were associated with lower density and larger LCD. The relationship between pore volume and BET surface for MOFs from experiments was provided by the following equation.
B E T   s u r f a c e   a r e a   ( m 2 g ) = 1925.7 × v p   ( c m 3 g ) + 350.98
For this equation, r2 = 0.881. The fact that there is an estimated relationship between pore volume and BET may support the selection one structural descriptor to estimate CH4 uptake and delivery to simplify QSPR analysis. Because of the minute details and the wide design freedom accessible for MOFs, not every structure is expected to exactly fit this model, but most structures experimentally investigated to date do, as indicated by the r2 of nearly 0.90.
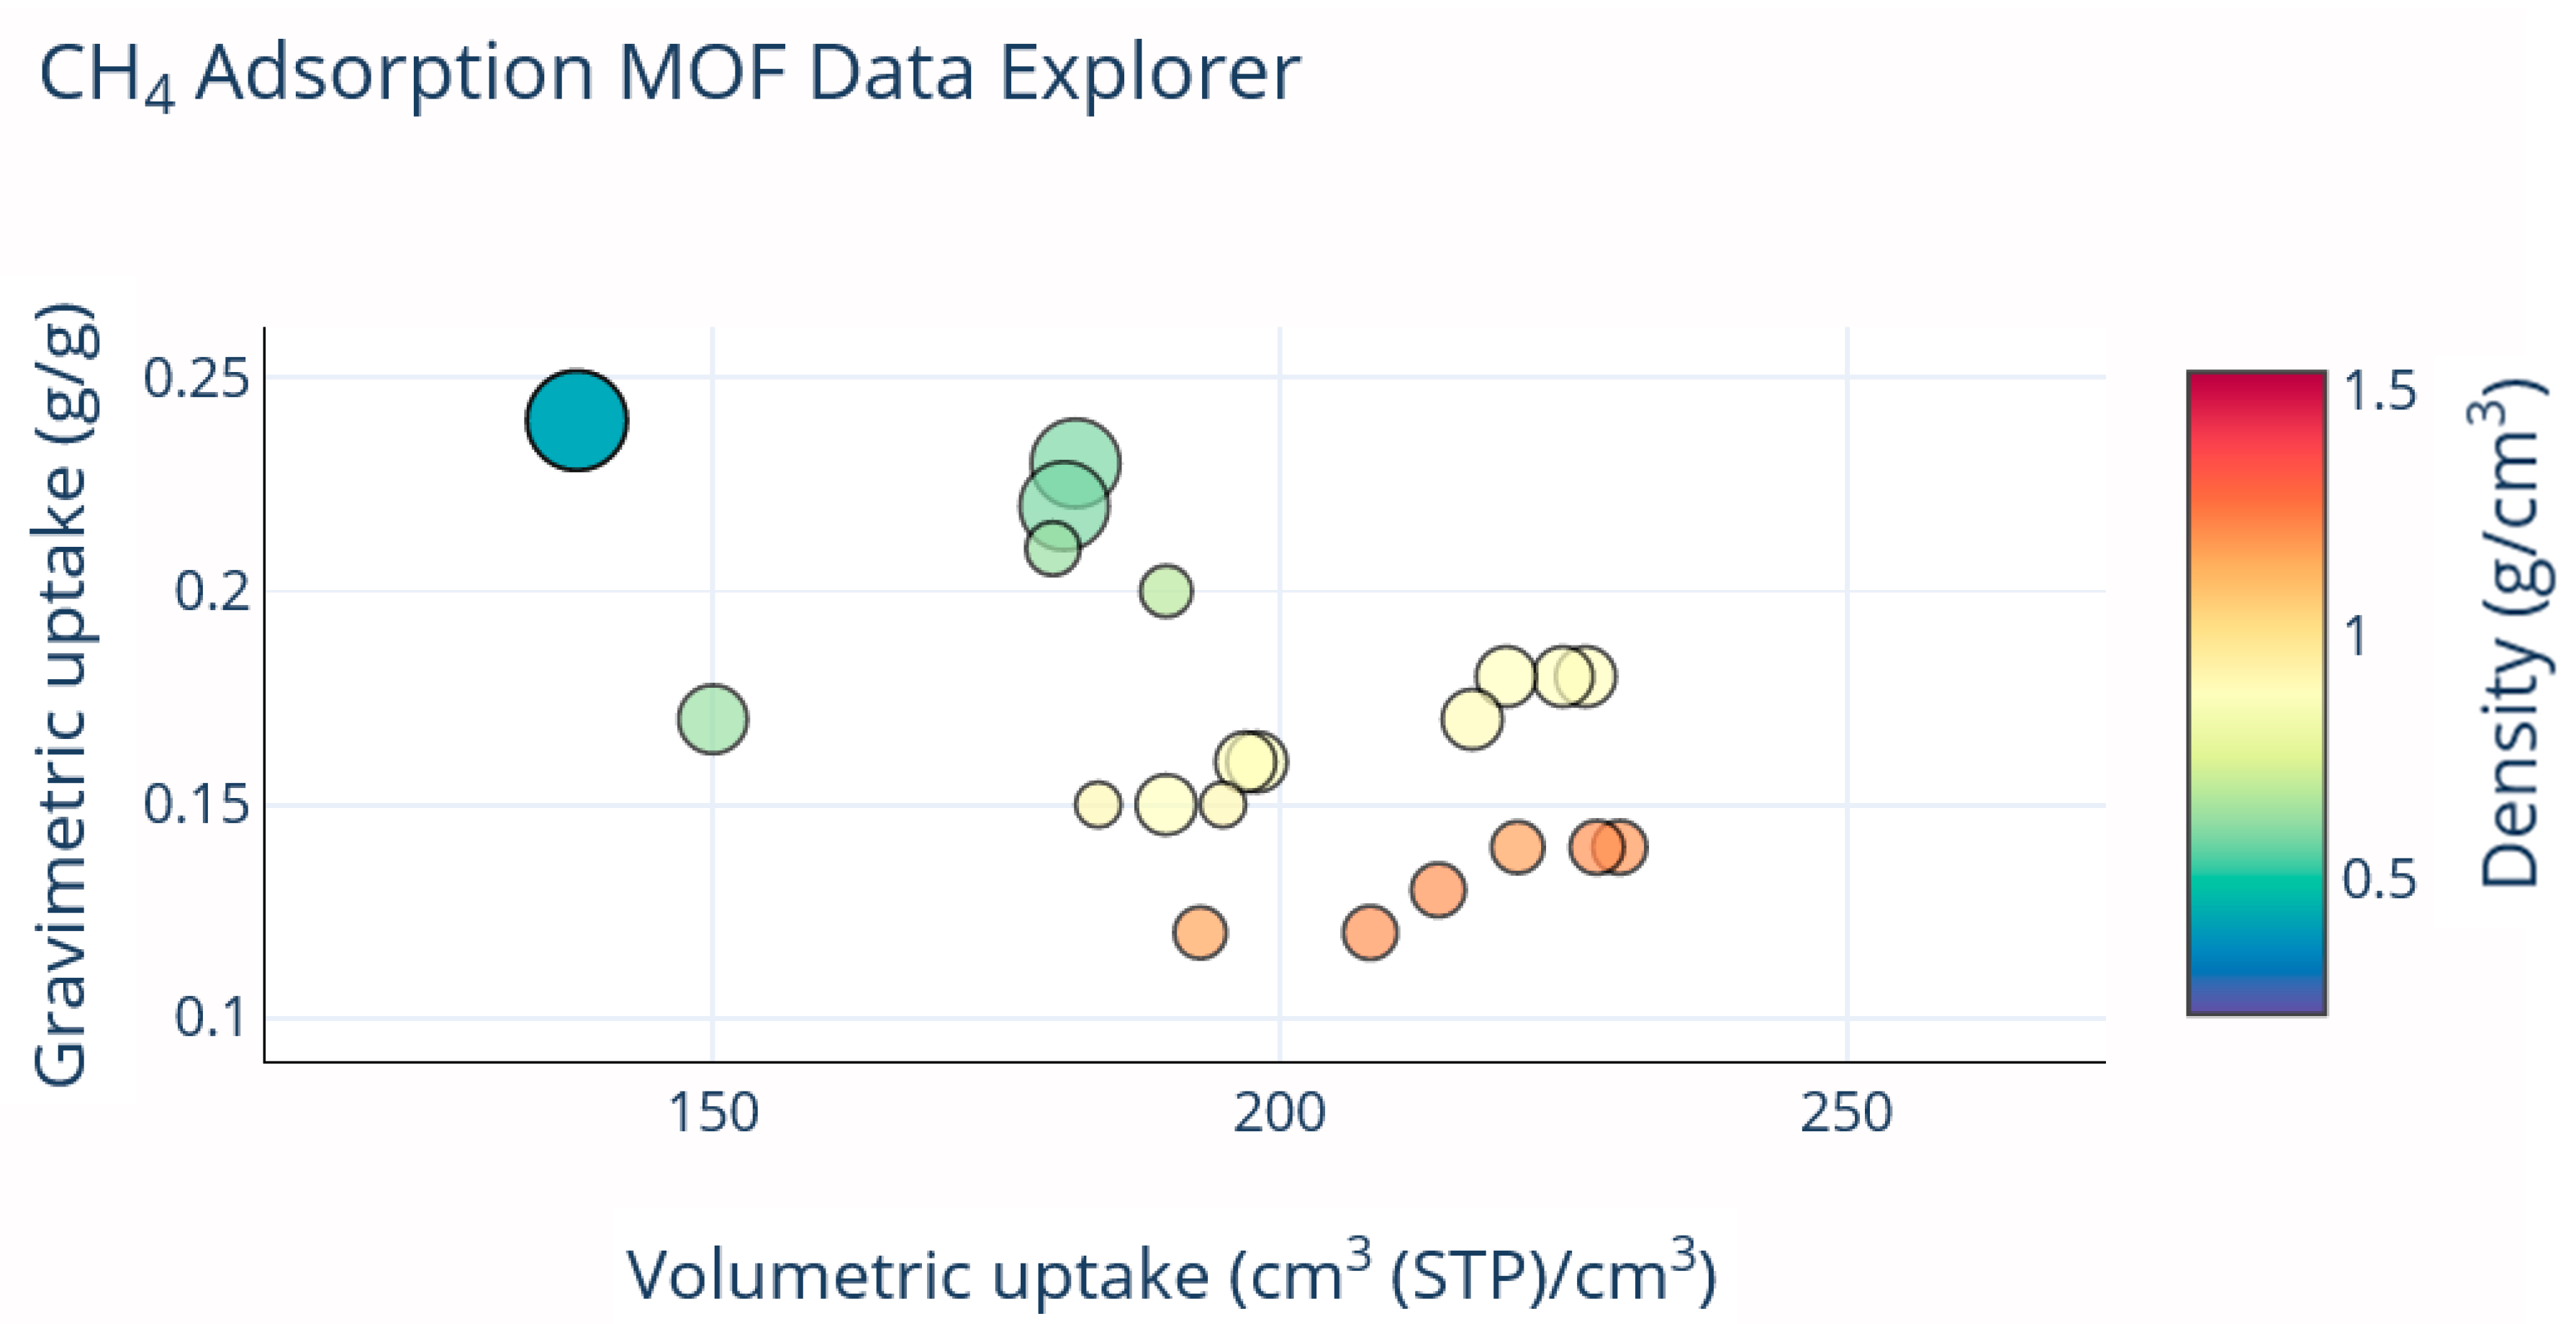
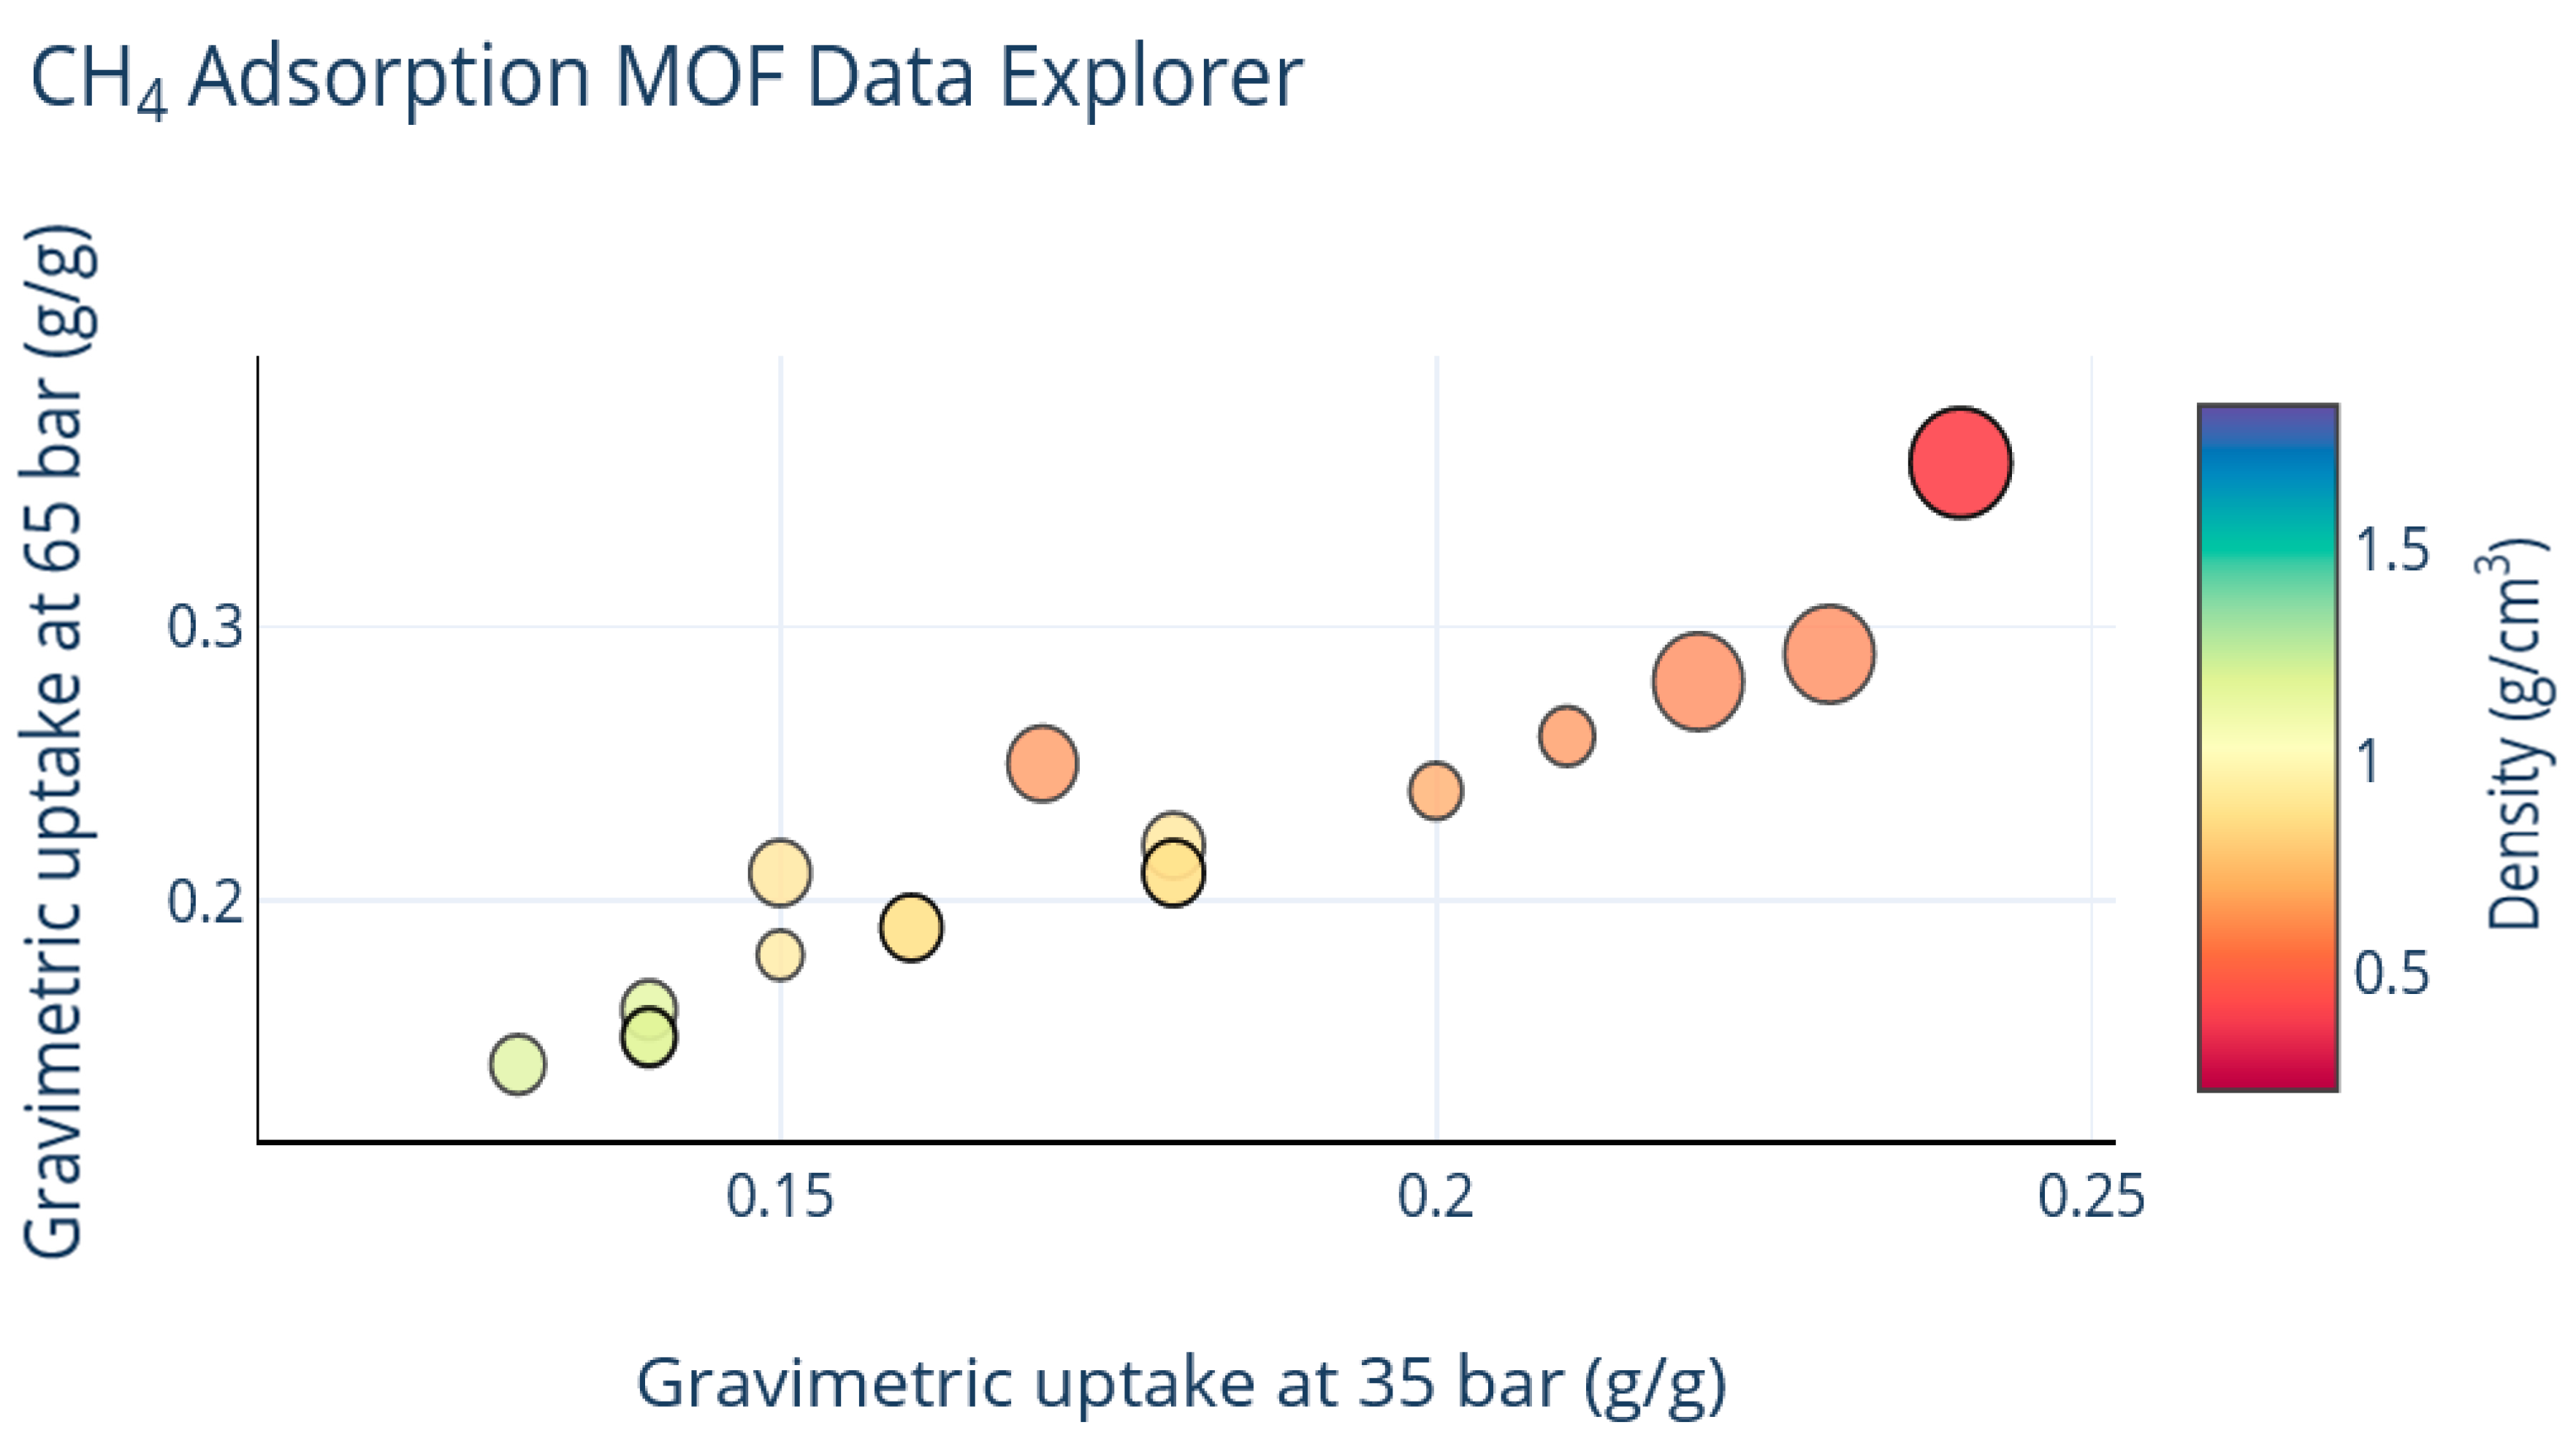
CH4 volumetric and gravimetric uptakes were compared at 35 bar and 298 K as functions of density and LCD (Figure 3). Increasing volumetric uptake was associated with decreasing gravimetric uptake. The results showed that as the density of the MOF increased from 0.3 g/cm3 to greater than 1 g/cm3, the gravimetric uptake decreased from around 0.24 g/g to around 0.125 g/g. As the mass of MOF per unit volume increased, the mass of CH4 stored decreased. As LCD decreased, gravimetric uptake also decreased. As LCD decreased, volumetric uptake increased. Principally, CH4 adsorption takes place in the pores. The diameters of these pores are four or five times the molecular diameter of CH4. Fundamentally, the interaction between CH4 and the pore plays a significant role in adsorption. With increasing pore size, the force associated with the interaction between CH4 and the pore decreases rapidly, such that the equilibrium adsorption becomes like that of a plane surface. The consequence of this is that any pores with widths greater than 2 nm, which excludes mesopores, do not significantly improve of CH4 storage as compared to a system with a compressed gas. To design high-performing adsorbents for CH4 storage, the volume of the micropores per unit volume of adsorbent should be maximized to improve CH4 storage as compared to a compressed gas system. At the same time, void volume in the system packed with adsorbent should be minimized. As shown in Figure 4, gravimetric uptake at 35 bar increased with gravimetric uptake at 65 bar. Increasing gravimetric uptake was associated with decreasing density and increasing LCD (Figure 4). For the relationship shown in Figure 4:
G r a v i m e t r i c   u p t a k e   a t   65   b a r   ( g g ) = 1.6997 × G r a v i m e t r i c   u p t a k e   a t   35   b a r   ( g g ) 0.0801
where r2 = 0.9331.
CH4 gravimetric uptake as a function of BET surface area was assessed at 35 bar and 298 K for different MOF densities and LCDs (Figure 5). Increasing the BET surface area increased gravimetric uptake. As the BET surface area increased, there was usually an increase in the LCD and a decrease in the density. A QSPR model was built, yielding two different equations for two different pressures at 298 K. The model was validated by calculating the coefficient of determination or r2.
G r a v i m e t r i c   U p t a k e   a t   35   b a r   ( g g ) = 3 × 10 5 × B E T   S u r f a c e   A r e a   ( m 2 g ) + 0.1045    
where r2 = 0.7973, indicating that this equation can be used to predict CH4 uptake. At 65 bar,
G r a v i m e t r i c   U p t a k e   a t   65   b a r   ( g g ) = 5 × 10 5 × B E T   S u r f a c e   A r e a   ( m 2 g ) + 0.0916        
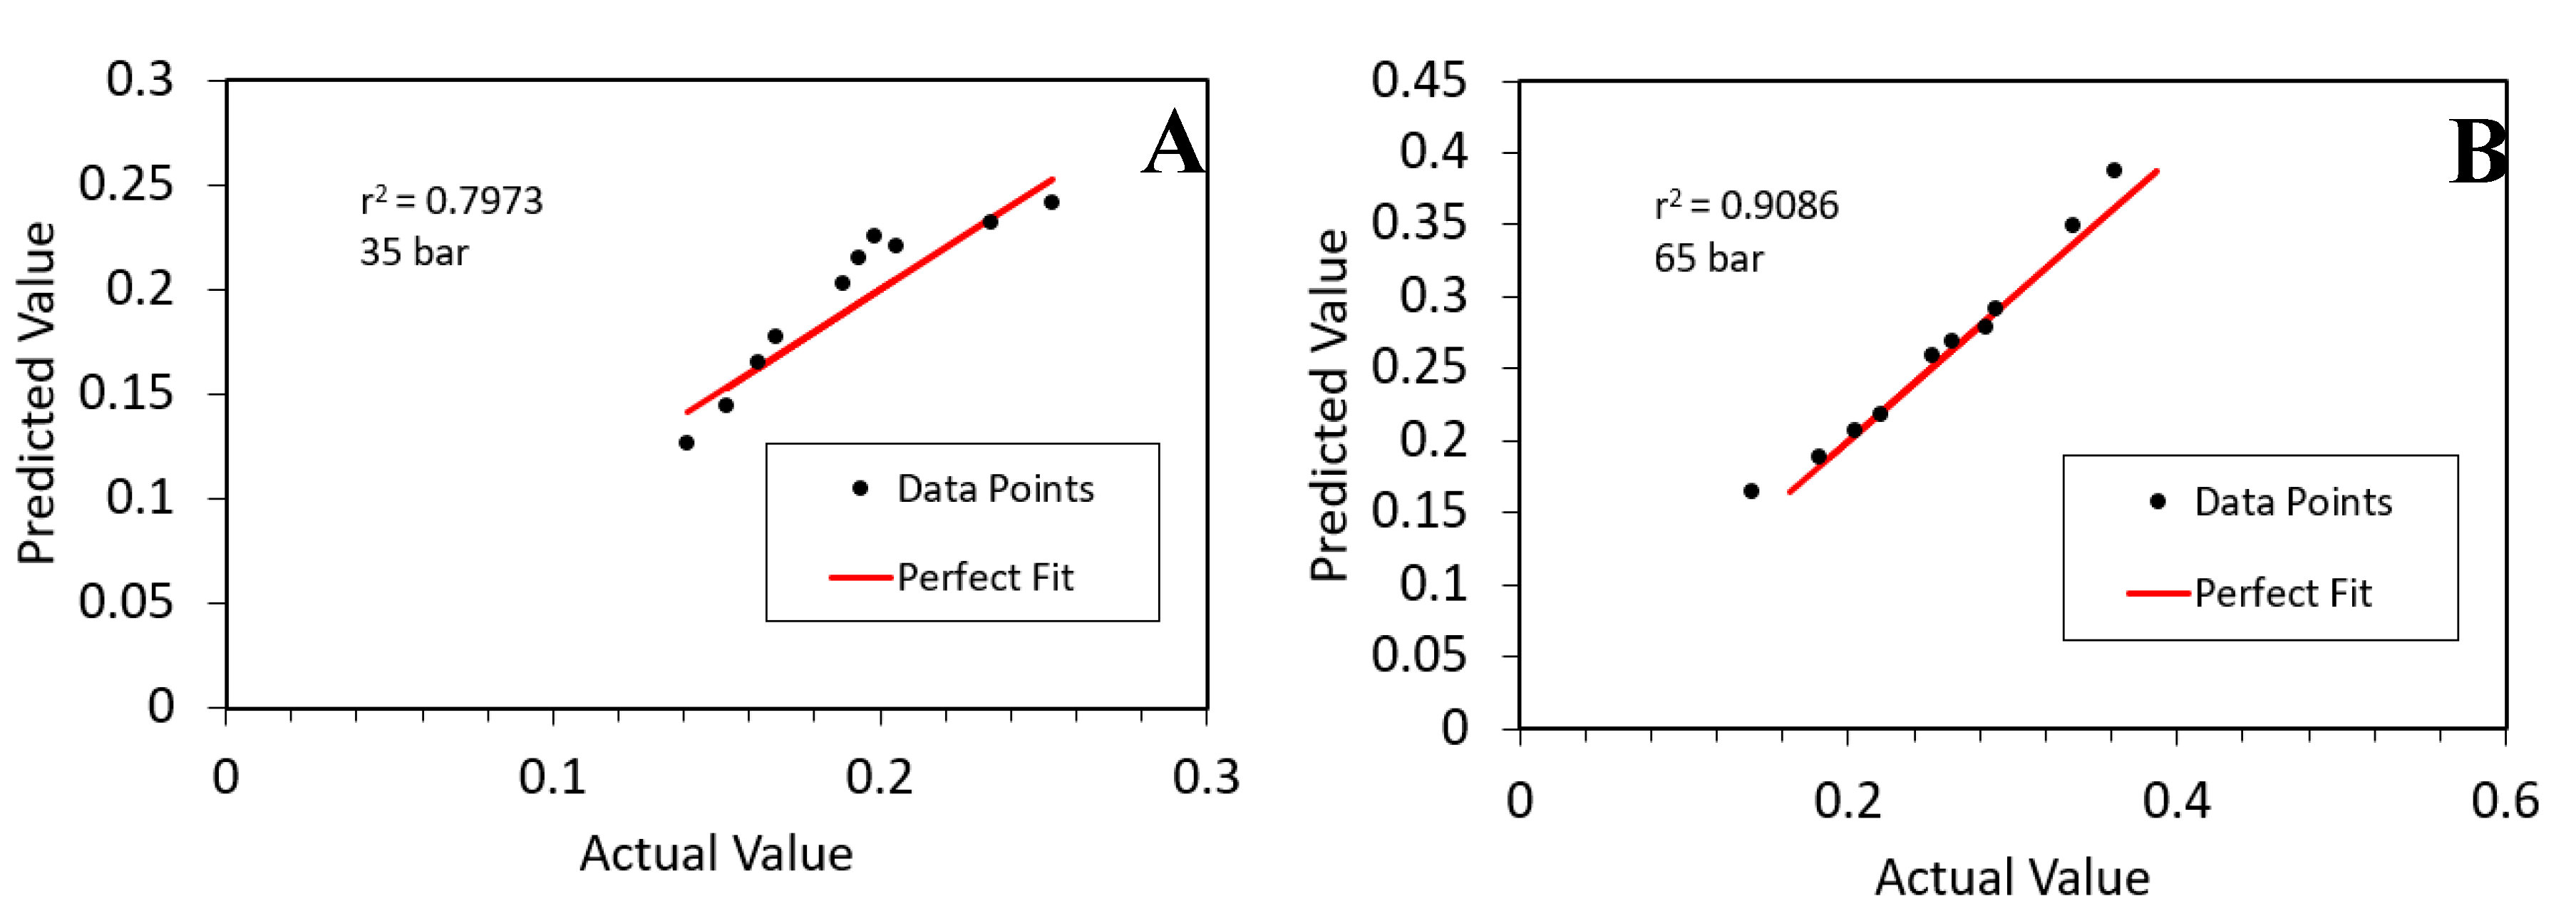
where r2 = 0.9086m indicating that this equation can be used to predict CH4 uptake. The predictive power of the QSPR model proposed in Equation (5) is shown in Figure 6 for a test set of MOFs. The model was found to have excellent predictive power over the range of data tested.
To meet the DOE’s target of 0.5 g/g at 65 bar and 298 K, it was estimated that the BET surface area of the MOF should be greater than 7000 m2/g, based on the QSPR analysis presented here. At 100 bar and 270 K, a CH4 uptake of 0.66 g/g was met by NU-1501-Al, which has a BET area of 7310 m2/g [40]. As indicated by Figure 3, it is difficult to simultaneously achieve both the gravimetric and volumetric DOE CH4 storage targets due to the observation that with increasing gravimetric uptake, volumetric uptake decreases.
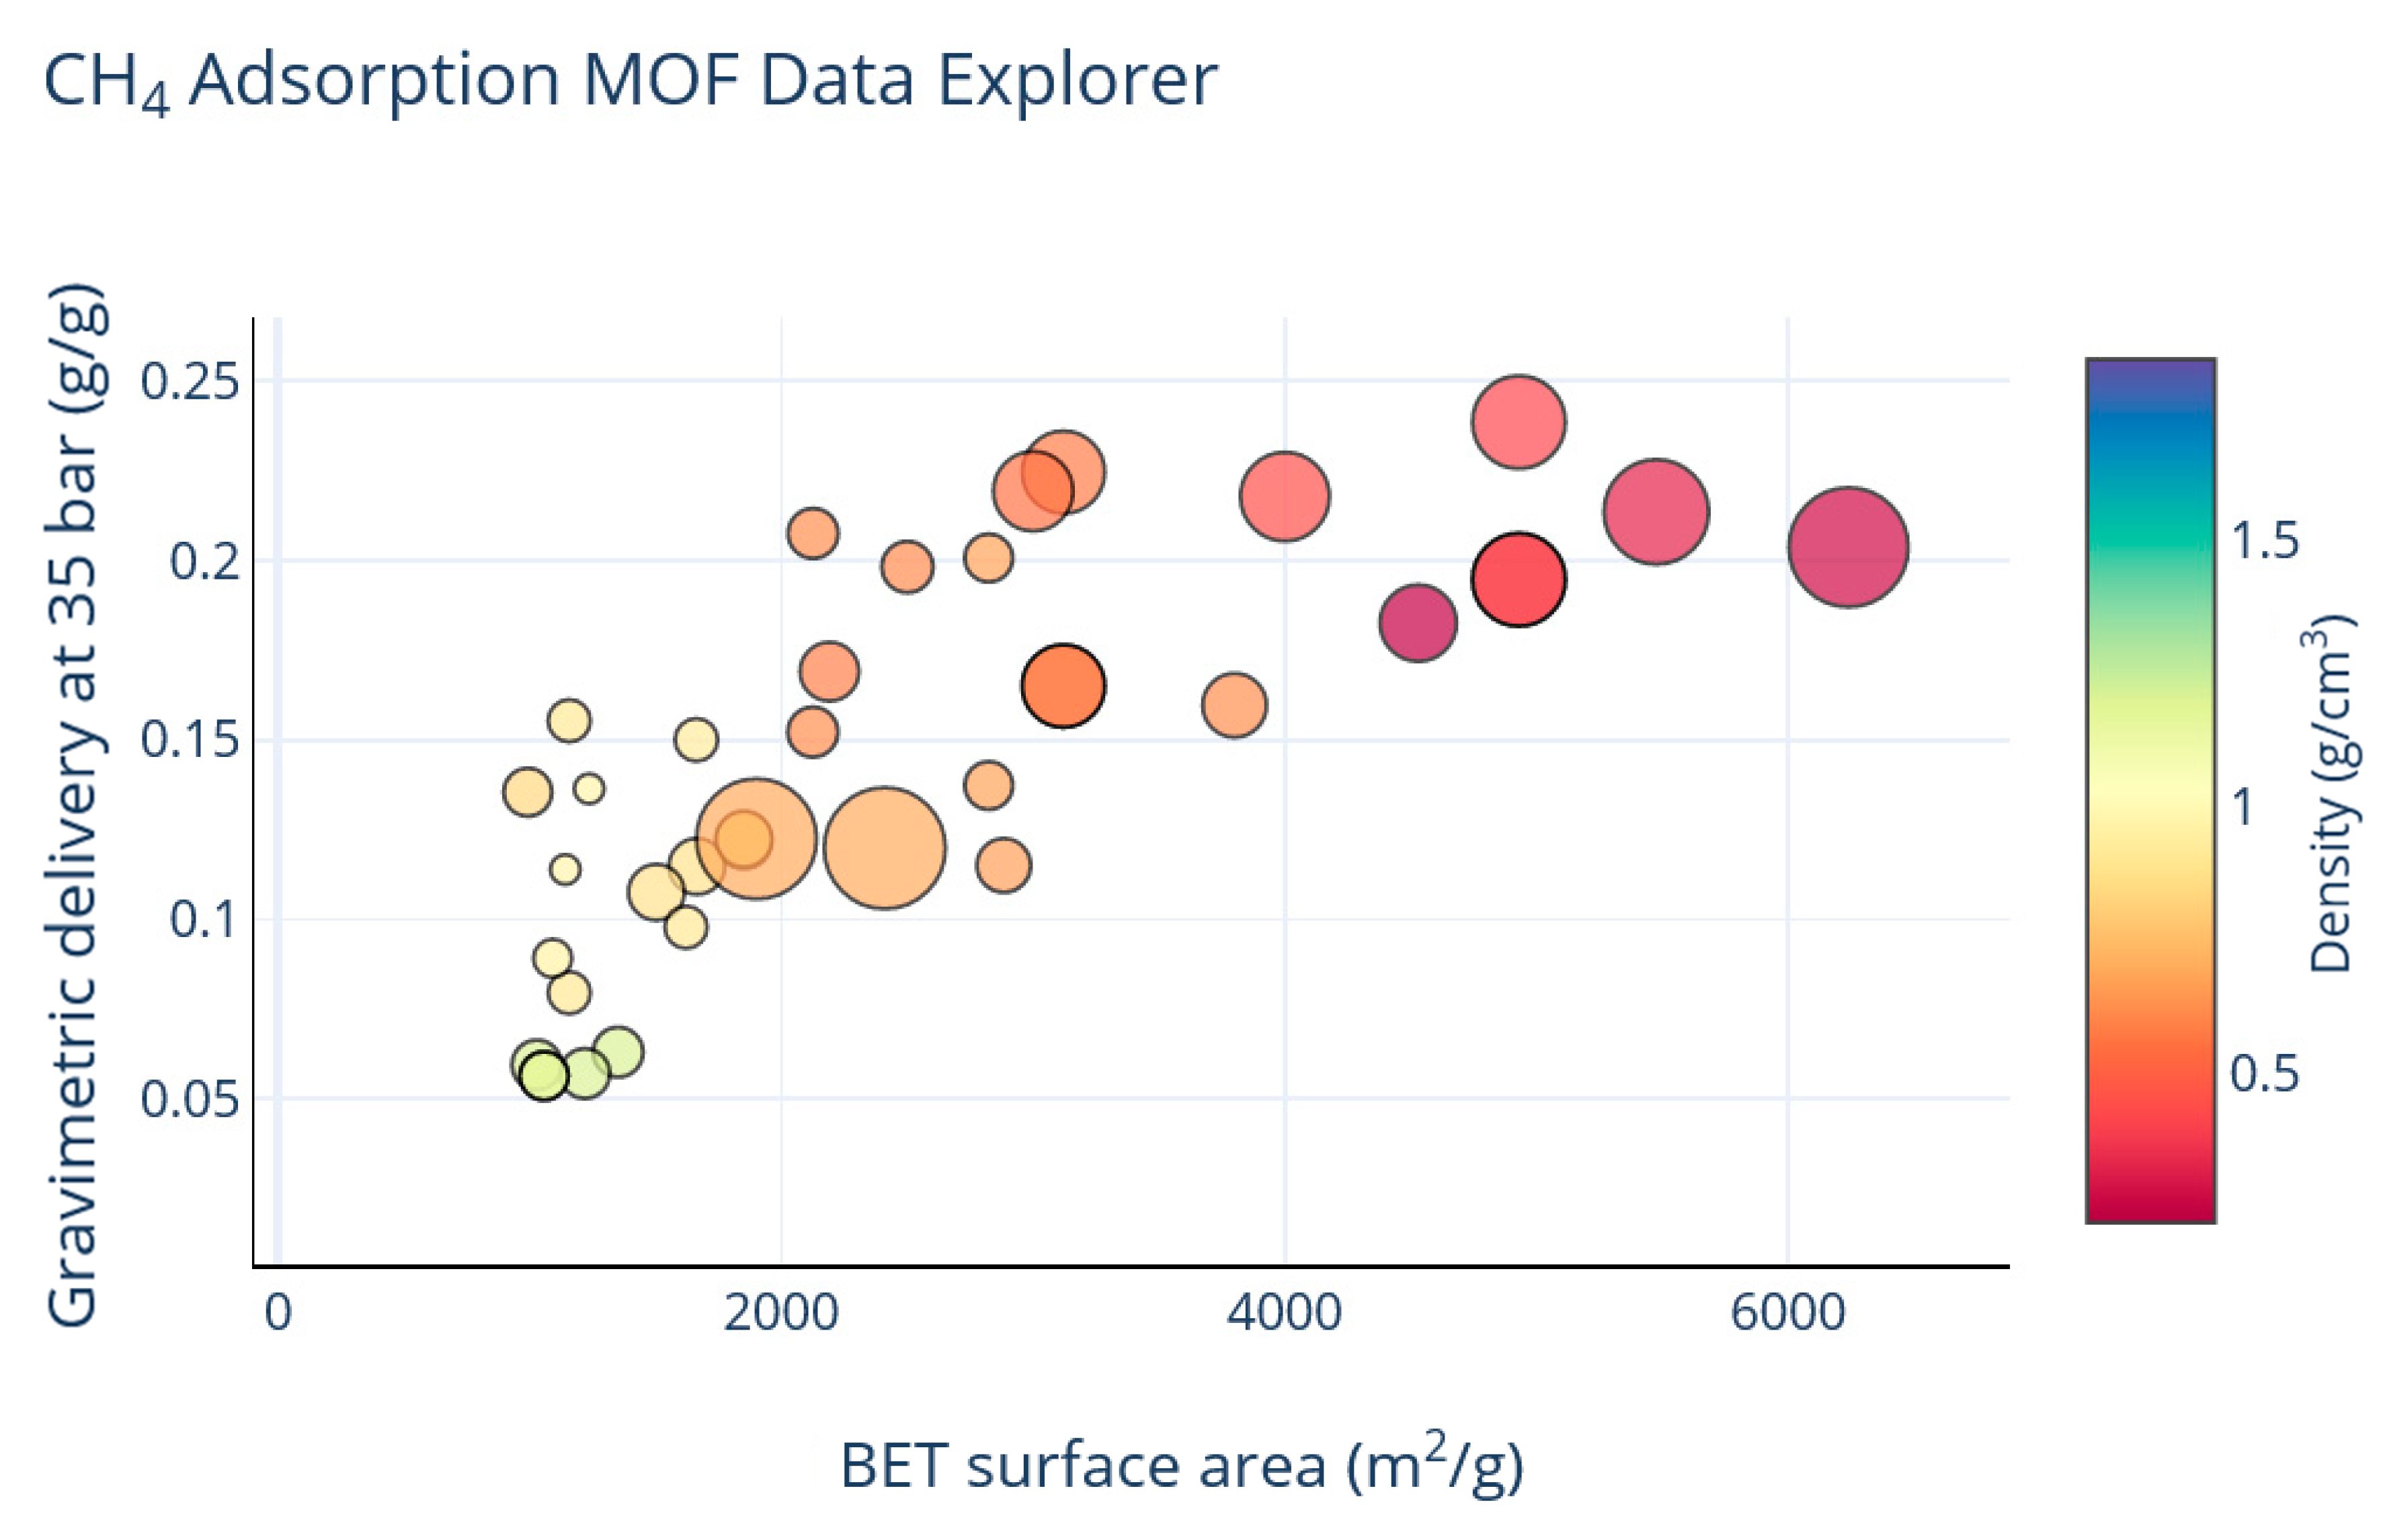
In practice, gravimetric deliverable capacity is a more important parameter than gravimetric uptake for energy storage applications. Structural features of MOFs should be designed for low CH4 uptake at low pressure (5 bar). As shown in Figure 7, two main structural features which showed an apparent trend were the experimental density and LCD of the MOF. Increasing BET surface area increased gravimetric delivery at 35 bar. This was associated with a decrease in density. Density and LCD are intricately linked to void space. Another material property to consider is the Qst of CH4. Decreasing the Qst from around 22 kJ/mol to around 15 kJ/mol was associated with increasing gravimetric delivery from 0.06 g/g to around 0.2 g/g, based on experimental results at 35 bar (SI). At 65 bar, gravimetric delivery increased when decreasing Qst from 22 kJ/mol to around 15 kJ/mol, and decreased when further decreased to around 10 kJ/mol. These structural features must be optimized to maximize gravimetric delivery.
From a holistic point of view where both the gravimetric and volumetric delivery targets are met, a particular strategy may work to achieve this, as shown in Figure 8. This strategy involves the use of medium-sized LCDs and densities of around 0.8 g/cm3. For this design challenge, using structures with large LCDs of 25 Å or more is not sufficient anymore.
In the case of volumetric CH4 delivery at 35 bar and 298 K, volumetric delivery decreased with increasing BET surface area. This was accompanied by a decrease in density and increase in LCD (Supplementary Figure S1). For a BET surface area of around 6000 m2/g, the volumetric delivery was around 75 cm3 (STP)/cm3. Volumetric uptake at 65 bar increased linearly with volumetric uptake at 35 bar (Supplementary Figure S2). Comparing volumetric delivery at 65 bar to that at 35 bar, it was noted that there was an optimum at a density of around 1 g/cm3 (Figure 9). Therefore, this indicated that the optimum structural properties for CH4 delivery were nearly the same at various pressures. For volumetric delivery at 35 bar, the optimum experimental result was obtained at lower BET surface areas and smaller LCDs. This coincided with Qst values of around 17.5 kJ/mol to 19 kJ/mol.

4. Discussion

The results shown here provide several QSPR models that can be used to design MOFs for CH4 storage at 298 K. Observations were made on how to optimize gravimetric CH4 delivery and volumetric CH4 delivery through correlations. Some trends were also observed regarding the structures of these materials. One of the key questions asked during this work was whether computational QSPR analysis was accurate. Furthermore, can advanced material design (mesopores, low temperature) be incorporated into QSPR analysis? Computational results are good and provide insights, but sometimes they miss some important or minute details from the real systems.
Regarding previous studies, QSPRs were established using 130,000 hypothetical MOF structures [41]. However, because the structures were hypothetical and the results were computationally obtained, this work sought to verify and complete QSPR analysis using experimental results and synthesized MOF structures. The results from the QSPR models can aid future MOF development and be used to double-check how accurate and realistic GCMC simulation predictions are. Critical to both endeavors is the identification of key structural parameters that can be controlled through reticular synthesis, which significantly affect CH4 uptake and delivery. Computationally, Fernandez et al. [41] focused on the following structural properties in their QSPR analysis: dominant pore diameter, surface area, and void fraction. It was concluded that for CH4 storage at 35 bar, the density of the MOF should be greater than 0.43 g/cm3 and the void fraction should be greater than 0.52. One drawback of this statement is that the simulated MOFs were hypothetical and no upper bound is given to narrow the range. In another study, 122,835 hypothetical MOFs were simulated for methane storage [32]. At 65 bar, the optimal structural parameters for these hypothetical MOFs was a Qst between 10.5 and 13.0 kJ/mol, an LCD between 10 and 12 Å, and a volumetric surface area between 2100 and 2300 m2/cm3. In another study, 45 MOFs were simulated for CH4 storage at 65 bar for an investigation on structural parameters, of which void fraction and Qst were found to be most significant [18]. The optimum Qst was 30 kJ/mol with a void fraction of 0.9 at 35 bar. More recently, it was demonstrated that these hypothetical MOF structures can be synthesized [42]. However, most hypothetical MOFs have not actually been tested for CH4 adsorption.
One certainty from simulated CH4 adsorption on MOFs is that there does not seem to be a clear consensus across all reports on what the best structural parameters are. In this work, more than 150 MOFs were analyzed and their CH4 adsorption results from experiments were used to create a previously unreported QSPR model. This gave realistic results that can be referenced and will allow better design of MOFs for CH4 adsorption. QSPR correlations were created for simplicity and were modeled as linear equations which possessed r2 values of around 0.9. From the analysis of CH4 data from 150 MOFs, it was observed that estimates of an optimum Qst of more than 30 kJ/mol are too high at 65 bar and 298 K. As far as density is concerned, the value depends on whether high volumetric or gravimetric delivery or uptake is being targeted. Starkly different optima were obtained in these cases. The recommendation given here is to design MOFs with an optimum density that is determined based on whether the storage target is volumetric or gravimetric, the pressure, and the temperature of operation for this process. For example, if the objective is to maximize volumetric delivery, then a density of around 1 g/cm3 seems to be sufficient. In the case of gravimetric delivery optimization, lower densities seem best.
Ultimately, the complexity and the number of structural properties of MOFs make it difficult to perform optimizations as observed in GCMC simulations. In this work, these structural parameters were related. The relationship and effect of one structural property on another allows the analysis to essentially be simplified, and for fewer structural properties to be focused on for QSPR analysis and the proposition of simplified correlations. Again, as shown in Figure 2, these properties are related and clear trends were observed from the experiments. It was observed that pore volume and surface area are related. Increases in either parameter were accompanied by a decrease in density and increase in LCD. The specific values of LCD and density can be obtained from the 5D interactive data explorer assembled for CH4 adsorption. The relationship between surface area and pore volume were obtained by a linear relation to help simplify analysis. While it is true that not all MOFs fit exactly to the proposed model, the majority did. The fit depends on whether advanced material-design strategies that have recently swept this area of research are used, including ultraporosity. Nevertheless, a clear framework and QSPR analysis equations are provided in this work to estimate the properties required with some confidence, and extrapolate required surface areas to meet current and future storage targets. For future work, it is proposed that the predictions from the models provided here be implemented and that experimental data and machine learning be applied to generate more complex models for the efficient design and synthesis of CH4 adsorbents.

5. Conclusions

Quantitative structure–property relationship (QSPR) approaches, when applied to MOFs, allow for reasonable estimates to be made of CH4 storage performance. Here, QSPRs were developed from experimental data and insights are provided on how to improve storage and deliverable CH4 storage capacity based on material properties. Geometrical features of MOFs such as density, pore volume, and LCD, and their significance for CH4 storage capacity, were assessed. One relationship identified is that CH4 gravimetric storage capacity is proportional to BET surface area (r2 > 90%). QSPR demonstrated the effect of open metal sites required for van der Waals forces involved in CH4 adsorption. Guidelines are provided for optimal design of MOFs, including density and pore volume. With the recent achievement of the 2012 DOE target, the QSPRs presented here may allow for the prediction of structural descriptors for CH4 storage capacity and delivery [28].
These predictions can be made at various pressures and a range of densities, and associated void fractions can be estimated based on the storage target desired. This was done using large-scale, experimental data, which has not previously been available to allow for comparison with GCMC model predictions. Linear relationships were found between gravimetric CH4 delivery, CH4 uptake, and BET surface area. Based on these relationships, surface area should be around 7000 m2/g or higher to achieve the 0.5 g/g gravimetric uptake target set by the DOE in 2012 at 65 bar and 298 K. Topology has an important effect, and the effect of functionalization was taken into account in the model. Pore volume and diameter play important roles, and the structural parameters were related to each other to simply the QSPR analysis and to allow for predictions to be made easily. Overprediction and underprediction of experimental data were observed in the GCMC simulations.

Supplementary Materials

The following are available online at https://www.mdpi.com/2073-4352/10/8/700/s1, Figure S1: QSPR for CH4 storage in MOFs. CH4 volumetric uptake at 298 K and 35 bar is plotted against density and the largest cavity diameter (LCD) denoted by the diameter of the circles, Figure S2: QSPR for CH4 storage in MOFs. CH4 volumetric uptake at 298 K and 35 bar and 65 bar is plotted against density and the largest cavity diameter (LCD) denoted by the diameter of the circles, Figure S3. QSPR for CH4 storage in MOFs. CH4 gravimetric uptake at 298 K and 65 bar on the y-axis is plotted against BET surface area in m2/g on the x-axis, Figure S4. QSPR for CH4 storage in MOFs. CH4 volumetric delivery at 298 K and 35 bar on y-axis is plotted against CH4 volumetric delivery at 298 K and 65 bar on the x-axis, Figure S5. QSPR for CH4 storage in MOFs. CH4 gravimetric uptake at 298 K and 65 bar (y-axis) is plotted against CH4 gravimetric uptake at 298 K and 35 bar on the x-axis, Figure S6. QSPR for CH4 storage in MOFs. CH4 gravimetric uptake at 298 K and 35 bar (g/g) is plotted against BET surface area in m2/g, Figure S7. BET surface area on the y-axis (m2/g) plotted against pore volume of MOF on x-axis (cm3/g), Spreadsheet 1. Pore volume, uptake and deliverable capacity of selected MOFs.

Funding

This research was funded by United Arab Emirates University, grant no G00002618.

Acknowledgments

The author would also like to acknowledge the Berkeley Global Science Institute for advice and discussions.

Conflicts of Interest

The author declares no conflict of interest or competing interest.

References

  1. Zhou, H.C.; Long, J.R.; Yaghi, O.M. Introduction to metal-organic frameworks. Chem. Rev. 2012, 112, 673–674. [Google Scholar] [CrossRef]
  2. Safaei, M.; Foroughi, M.M.; Ebrahimpoor, N.; Jahani, S.; Omidi, A.; Khatami, M. A review on metal-organic frameworks: Synthesis and applications. TrAC Trends Anal. Chem. 2019, 118, 401–425. [Google Scholar] [CrossRef]
  3. Metal–Organic Frameworks (MOFs). Available online: https://pubs.rsc.org/en/content/articlehtml/2014/cs/c4cs90059f?page=search (accessed on 13 August 2020).
  4. Furukawa, H.; Cordova, K.E.; O’Keeffe, M.; Yaghi, O.M. The Chemistry and Applications of Metal-Organic Frameworks. Science 2013, 341, 1230444-1-1230444-13. [Google Scholar] [CrossRef] [Green Version]
  5. Omar, M.Y.; Markus, J.K.; Christian, S.D. Emergence of Metal-Organic Frameworks. Available online: https://application.wiley-vch.de/books/sample/3527345027_c01.pdf (accessed on 13 August 2020).
  6. Ji, Z.; Wang, H.; Canossa, S.; Wuttke, S.; Yaghi, O.M. Pore Chemistry of Metal–Organic Frameworks. Adv. Funct. Mater. 2020, 2000238, 1–24. [Google Scholar]
  7. Chui, S.S.Y.; Lo, S.M.F.; Charmant, J.P.H.; Orpen, A.G.; Williams, I.D. A chemically functionalizable nanoporous material [Cu3(TMA)2 (H2O)3](n). Science 1999, 283, 1148–1150. [Google Scholar] [CrossRef]
  8. Spanopoulos, I.; Tsangarakis, C.; Klontzas, E.; Tylianakis, E.; Froudakis, G.; Adil, K.; Belmabkhout, Y.; Eddaoudi, M.; Trikalitis, P.N. Reticular Synthesis of HKUST-like tbo-MOFs with Enhanced CH4 Storage. J. Am. Chem. Soc. 2016, 138, 1568–1574. [Google Scholar] [CrossRef] [Green Version]
  9. Peng, Y.; Krungleviciute, V.; Eryazici, I.; Hupp, J.T.; Farha, O.K.; Yildirim, T. Methane storage in metal-organic frameworks: Current records, surprise findings, and challenges. J. Am. Chem. Soc. 2013, 135, 11887–11894. [Google Scholar] [CrossRef] [PubMed] [Green Version]
  10. Getzschmann, J.; Senkovska, I.; Wallacher, D.; Tovar, M.; Fairen-Jimenez, D.; Düren, T.; Van Baten, J.M.; Krishna, R.; Kaskel, S. Methane storage mechanism in the metal-organic framework Cu 3(btc)2: An in situ neutron diffraction study. Microporous Mesoporous Mater. 2010, 136, 50–58. [Google Scholar] [CrossRef]
  11. Vikrant, K.; Kumar, V.; Kim, K.H.; Kukkar, D. Metal-organic frameworks (MOFs): Potential and challenges for capture and abatement of ammonia. J. Mater. Chem. A 2017, 5, 22877–22896. [Google Scholar] [CrossRef]
  12. Todaro, M.; Buscarino, G.; Sciortino, L.; Alessi, A.; Messina, F.; Taddei, M.; Ranocchiari, M.; Cannas, M.; Gelardi, F.M. Decomposition Process of Carboxylate MOF HKUST-1 Unveiled at the Atomic Scale Level. J. Phys. Chem. C 2016, 120, 12879–12889. [Google Scholar] [CrossRef] [Green Version]
  13. Li, H.; Eddaoudi, M.; O’Keeffe, M.; Yaghi, O.M. Design and synthesis of an exceptionally stable and highly porous metal-organic framework. Nature 1999, 402, 276–279. [Google Scholar] [CrossRef] [Green Version]
  14. Varun Mehra ARPA-E is Here to Stay. Available online: https://scienceprogress.org/wp-content/uploads/2013/01/ARPA-Ebrief.pdf (accessed on 12 August 2020).
  15. Jiang, J.; Furukawa, H.; Zhang, Y.B.; Yaghi, O.M. High Methane Storage Working Capacity in Metal-Organic Frameworks with Acrylate Links. J. Am. Chem. Soc. 2016, 138, 10244–10251. [Google Scholar] [CrossRef] [PubMed]
  16. Mason, J.A.; Veenstra, M.; Long, J.R. Evaluating metal-organic frameworks for natural gas storage. Chem. Sci. 2014, 5, 32–51. [Google Scholar] [CrossRef] [Green Version]
  17. Hechinger, M.; Leonhard, K.; Marquardt, W. What is Wrong with Quantitative Structure–Property Relations Models Based on Three-Dimensional Descriptors? J. Chem. Inf. Model. 2012, 52, 1984–1993. [Google Scholar] [CrossRef]
  18. Sezginel, K.B.; Uzun, A.; Keskin, S. Multivariable linear models of structural parameters to predict methane uptake in metal–organic frameworks. Chem. Eng. Sci. 2015, 124, 125–134. [Google Scholar] [CrossRef]
  19. Liu, L.; Konstas, K.; Hill, M.R.; Telfer, S.G. Programmed pore architectures in modular quaternary metal-organic frameworks. J. Am. Chem. Soc. 2013, 135, 17731–17734. [Google Scholar] [CrossRef]
  20. Guo, Z.; Wu, H.; Srinivas, G.; Zhou, Y.; Xiang, S.; Chen, Z.; Yang, Y.; Zhou, W.; O’Keeffe, M.; Chen, B. A metal-organic framework with optimized open metal sites and pore spaces for high methane storage at room temperature. Angew. Chemie Int. Ed. 2011, 50, 3178–3181. [Google Scholar] [CrossRef]
  21. Kalidindi, S.B.; Nayak, S.; Briggs, M.E.; Jansat, S.; Katsoulidis, A.P.; Miller, G.J.; Warren, J.E.; Antypov, D.; Corà, F.; Slater, B.; et al. Chemical and structural stability of zirconium-based metal-organic frameworks with large three-dimensional pores by linker engineering. Angew. Chemie Int. Ed. 2015, 54, 221–226. [Google Scholar] [CrossRef] [Green Version]
  22. Karagiaridi, O.; Bury, W.; Mondloch, J.E.; Hupp, J.T.; Farha, O.K. Solvent-assisted linker exchange: An alternative to the de novo synthesis of unattainable metal-organic frameworks. Angew. Chemie Int. Ed. 2014, 53, 4530–4540. [Google Scholar] [CrossRef]
  23. Stock, N.; Biswas, S. Synthesis of metal-organic frameworks (MOFs): Routes to various MOF topologies, morphologies, and composites. Chem. Rev. 2012, 112, 933–969. [Google Scholar] [CrossRef] [PubMed]
  24. Deng, H.; Doonan, C.J.; Furukawa, H.; Ferreira, R.B.; Towne, J.; Knobler, C.B.; Wang, B.; Yaghi, O.M. Multiple functional groups of varying ratios in metal-organic frameworks. Science 2010, 327, 846–850. [Google Scholar] [CrossRef] [PubMed]
  25. Moghadam, P.Z.; Fairen-Jimenez, D.; Snurr, R.Q. Efficient identification of hydrophobic MOFs: Application in the capture of toxic industrial chemicals. J. Mater. Chem. A 2015, 4, 529–536. [Google Scholar] [CrossRef] [Green Version]
  26. Casco, M.E.; Rey, F.; Jordá, J.L.; Rudić, S.; Fauth, F.; Martínez-Escandell, M.; Rodríguez-Reinoso, F.; Ramos-Fernández, E.V.; Silvestre-Albero, J. Paving the way for methane hydrate formation on metal-organic frameworks (MOFs). Chem. Sci. 2016, 7, 3658–3666. [Google Scholar] [CrossRef] [PubMed] [Green Version]
  27. Chung, Y.G.; Camp, J.; Haranczyk, M.; Sikora, B.J.; Bury, W.; Krungleviciute, V.; Yildirim, T.; Farha, O.K.; Sholl, D.S.; Snurr, R.Q. Computation-ready, experimental metal-organic frameworks: A tool to enable high-throughput screening of nanoporous crystals. Chem. Mater. 2014, 26, 6185–6192. [Google Scholar] [CrossRef]
  28. Ohno, H.; Mukae, Y. Machine Learning Approach for Prediction and Search: Application to Methane Storage in a Metal–Organic Framework. J. Phys. Chem. C 2016, 120, 23963–23968. [Google Scholar] [CrossRef]
  29. Mahmoud, E.; Ali, L.; El Sayah, A.; Alkhatib, A.S.; Abdulsalam, H.; Juma, M.; Al-Muhtaseb, H.A. Implementing Metal-Organic Frameworks for Natural Gas Storage. Crystals 2019, 9, 406. [Google Scholar] [CrossRef] [Green Version]
  30. Moellmer, J.; Moeller, A.; Dreisbach, F.; Glaeser, R.; Staudt, R. High pressure adsorption of hydrogen, nitrogen, carbon dioxide and methane on the metal-organic framework HKUST-1. Microporous Mesoporous Mater. 2011, 138, 140–148. [Google Scholar] [CrossRef]
  31. Deng, H.; Grunder, S.; Cordova, K.E.; Valente, C.; Furukawa, H.; Hmadeh, M.; Gándara, F.; Whalley, A.C.; Liu, Z.; Asahina, S.; et al. Large-pore apertures in a series of metal-organic frameworks. Science 2012, 336, 1018–1023. [Google Scholar] [CrossRef] [Green Version]
  32. Gómez-Gualdrón, D.A.; Wilmer, C.E.; Farha, O.K.; Hupp, J.T.; Snurr, R.Q. Exploring the limits of methane storage and delivery in nanoporous materials. J. Phys. Chem. C 2014, 118, 6941–6951. [Google Scholar] [CrossRef]
  33. Wilmer, C.E.; Farha, O.K.; Yildirim, T.; Eryazici, I.; Krungleviciute, V.; Sarjeant, A.A.; Snurr, R.Q.; Hupp, J.T. Gram-scale, high-yield synthesis of a robust metal–organic framework for storing methane and other gases. Energy Environ. Sci. 2013, 6, 1158–1163. [Google Scholar] [CrossRef]
  34. Loiseau, T.; Serre, C.; Huguenard, C.; Fink, G.; Taulelle, F.; Henry, M.; Bataille, T.; Férey, G. A Rationale for the Large Breathing of the Porous Aluminum Terephthalate (MIL-53) Upon Hydration. Chem. A Eur. J. 2004, 10, 1373–1382. [Google Scholar] [CrossRef] [PubMed]
  35. Peng, Y.; Srinivas, G.; Wilmer, C.E.; Eryazici, I.; Snurr, R.Q.; Hupp, J.T.; Yildirim, T.; Farha, O.K. Simultaneously high gravimetric and volumetric methane uptake characteristics of the metal-organic framework NU-111. Chem. Commun. 2013, 49, 2992–2994. [Google Scholar] [CrossRef] [PubMed]
  36. He, Y.; Zhou, W.; Yildirim, T.; Chen, B. A series of metal-organic frameworks with high methane uptake and an empirical equation for predicting methane storage capacity. Energy Environ. Sci. 2013, 6, 2735–2744. [Google Scholar] [CrossRef]
  37. Prajwal, B.P.; Ayappa, K.G. Evaluating methane storage targets: From powder samples to onboard storage systems. Adsorption 2014, 20, 769–776. [Google Scholar] [CrossRef]
  38. Wen, H.-M.M.; Li, B.; Yuan, D.; Wang, H.; Yildirim, T.; Zhou, W.; Chen, B. A porous metal-organic framework with an elongated anthracene derivative exhibiting a high working capacity for the storage of methane. J. Mater. Chem. A 2014, 2, 11516–11522. [Google Scholar] [CrossRef]
  39. Li, L.; Tang, S.; Wang, C.; Lv, X.; Jiang, M.; Wu, H.; Zhao, X. High gas storage capacities and stepwise adsorption in a UiO type metal-organic framework incorporating Lewis basic bipyridyl sites. Chem. Commun. 2014, 50, 2304–2307. [Google Scholar] [CrossRef]
  40. Chen, Z.; Li, P.; Anderson, R.; Wang, X.; Zhang, X.; Robison, L.; Redfern, L.R.; Moribe, S.; Islamoglu, T.; Gómez-Gualdrón, D.A.; et al. Balancing volumetric and gravimetric uptake in highly porous materials for clean energy. Science 2020, 368, 297–303. [Google Scholar] [CrossRef]
  41. Fernandez, M.; Woo, T.K.; Wilmer, C.E.; Snurr, R.Q. Large-Scale Quantitative Structure–Property Relationship (QSPR) Analysis of Methane Storage in Metal–Organic Frameworks. J. Phys. Chem. C 2013, 117, 7681–7689. [Google Scholar] [CrossRef]
  42. Farha, O.K.; Özgür Yazaydın, A.; Eryazici, I.; Malliakas, C.D.; Hauser, B.G.; Kanatzidis, M.G.; Nguyen, S.T.; Snurr, R.Q.; Hupp, J.T. De novo synthesis of a metal–organic framework material featuring ultrahigh surface area and gas storage capacities. Nat. Chem. 2010, 2, 944–948. [Google Scholar] [CrossRef]
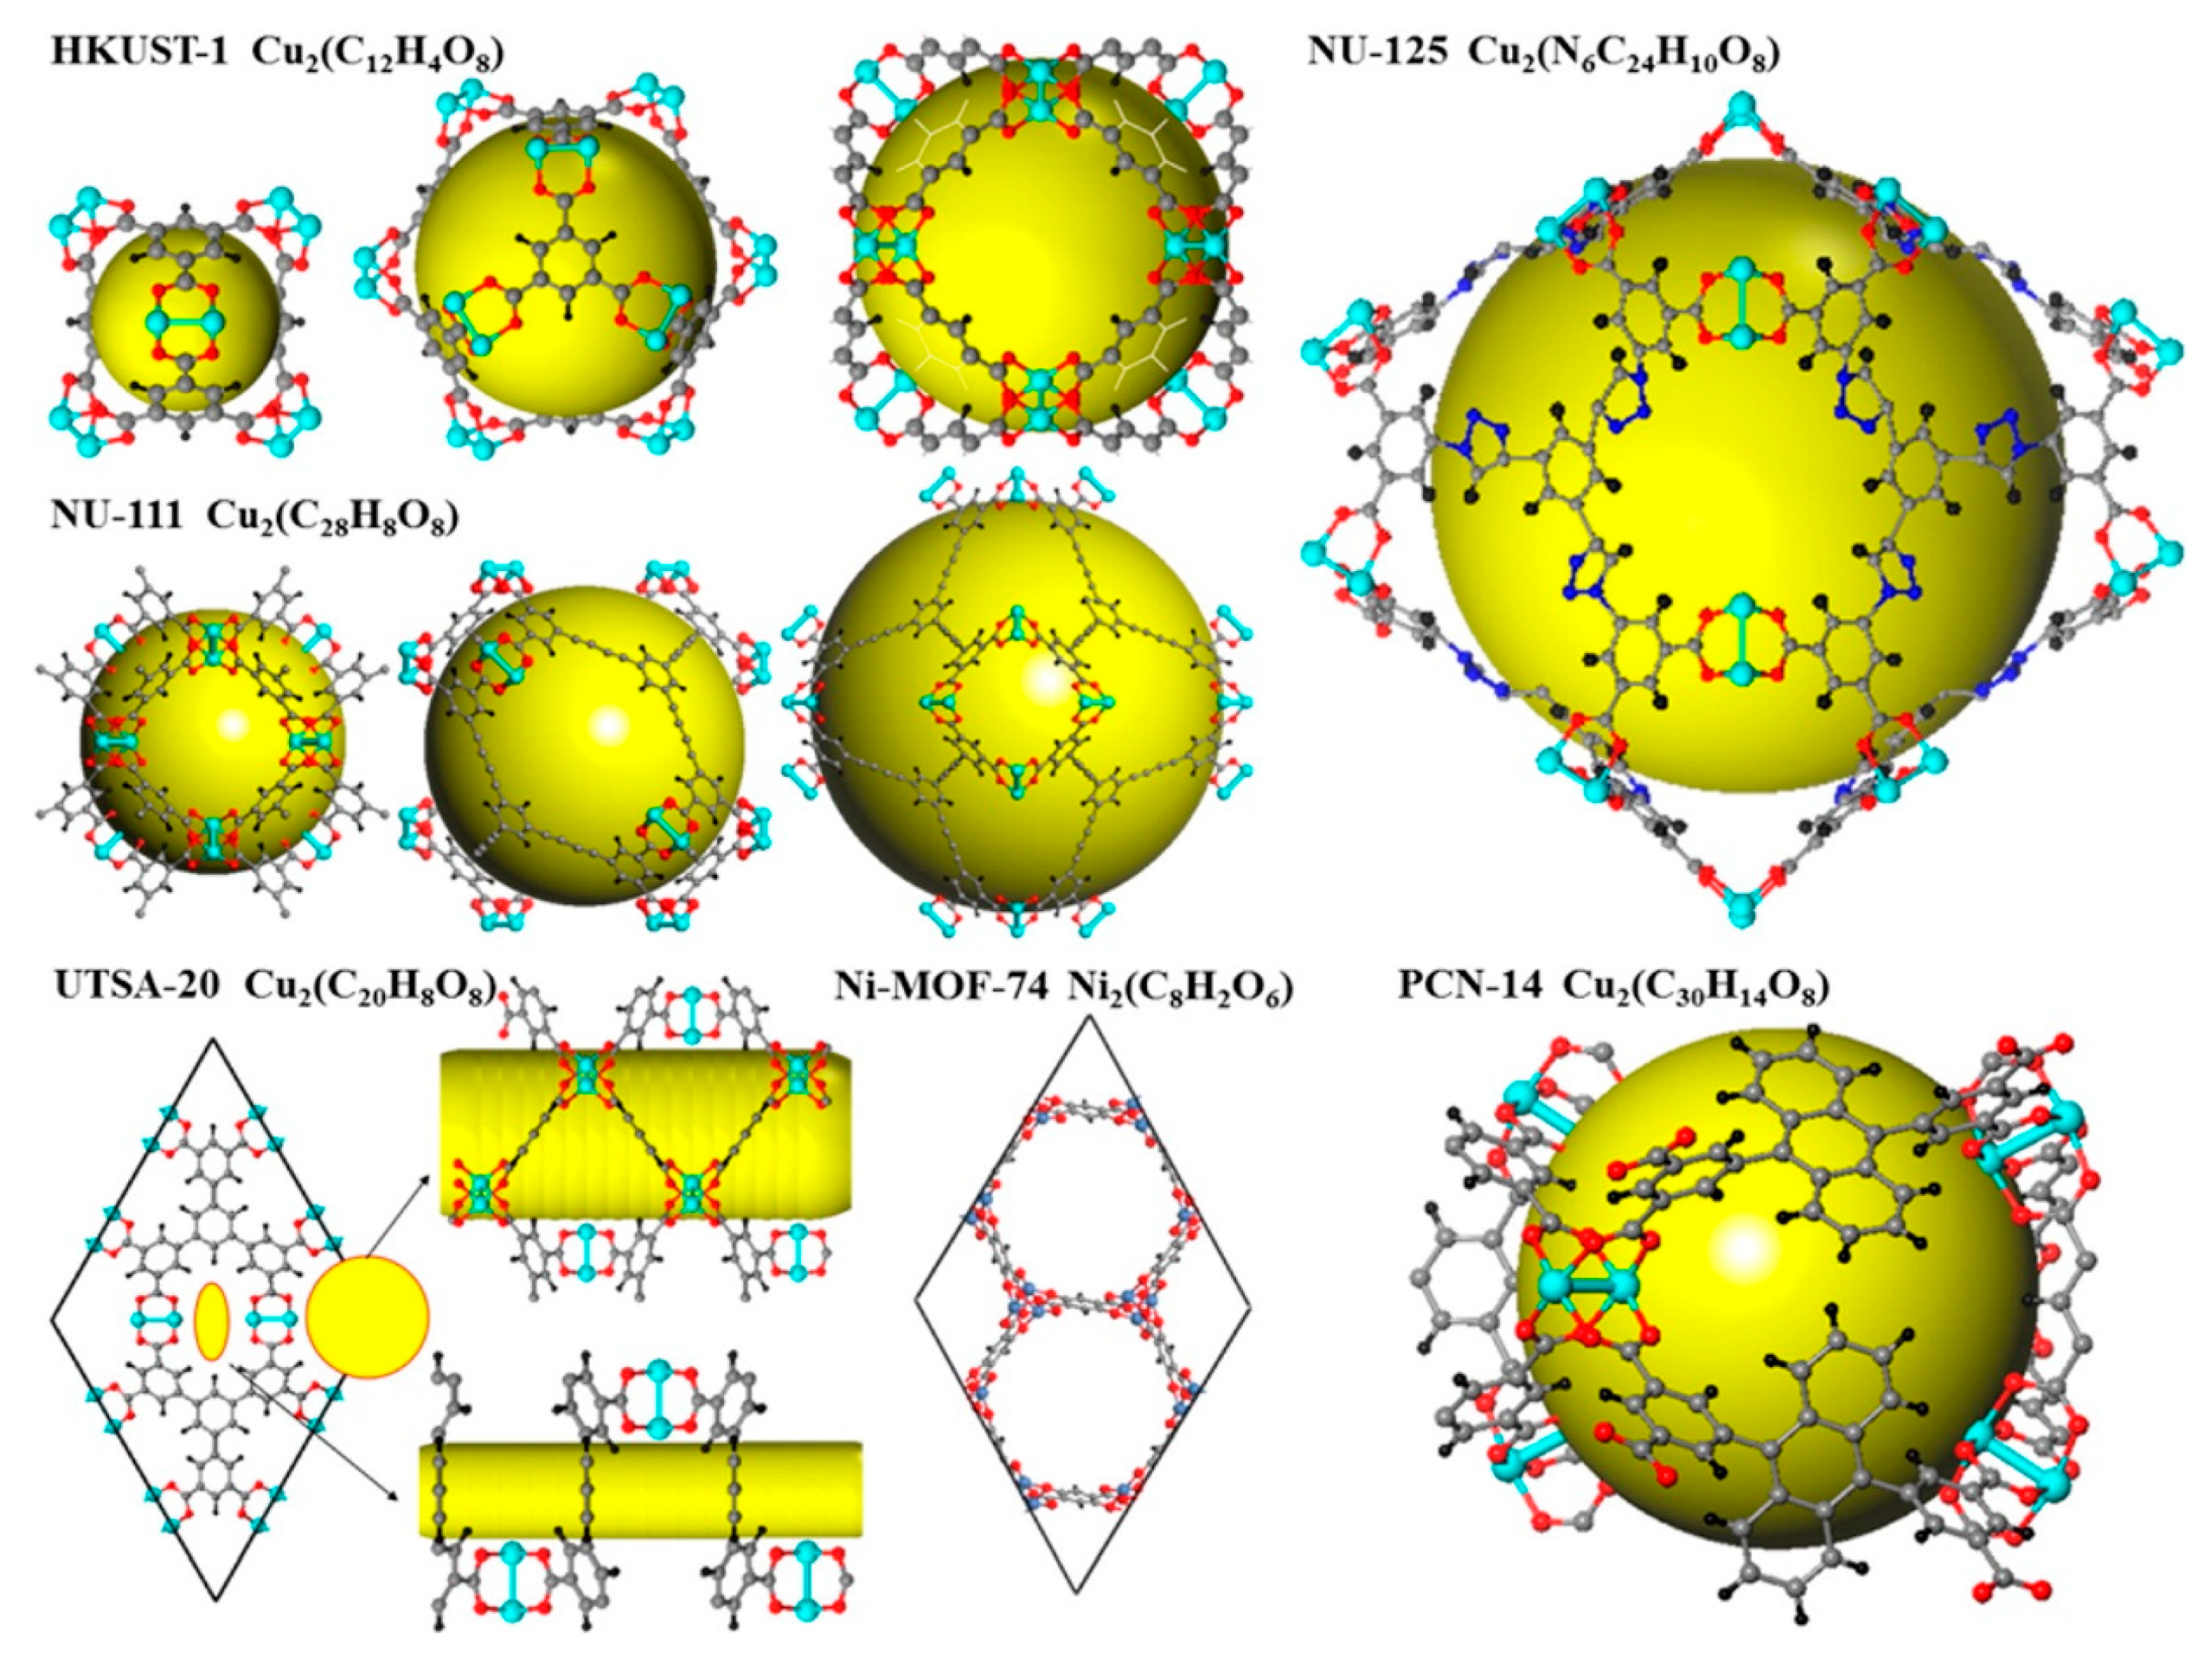
Figure 1. Nanocages of NU-111 (NU = Northwestern University), Ni-MOF-74 (MOF = metal-organic framework), PCN-14, UTSA-20 (UTSA = University of Texas at San Antonio), HKUST-1 (Hong Kong University of Science and Technology), and NU-125 and their empirical formulas. Carbon atoms are shown as gray spheres, hydrogen atoms are shown as black spheres, oxygen atoms are shown as red spheres, copper atoms are shown as cyan spheres, and nitrogen atoms are shown as blue spheres. Adapted with permission from Reference [9]. Copyright 2013 American Chemical Society.
Crystals 10 00700 g001
Figure 2. Relationship between BET surface area and the pore volume, Vp, of MOFs. Each point represents a MOF. The data points are color-coded by MOF density and the diameter of each circle represents the largest cavity diameter (LCD) of each MOF.
Crystals 10 00700 g002
Figure 3. Quantitative structure–property relationship (QSPR) for CH4 storage in MOFs. CH4 volumetric and gravimetric uptake at 298 K and 35 bar. Each point represents a MOF. The data points are color coded for the density of the MOF and the diameter of each circle represents the largest cavity diameter (LCD) of the MOF.
Crystals 10 00700 g003
Figure 4. QSPR for CH4 storage in MOFs. CH4 gravimetric uptake at 298 K and 65 bar and gravimetric uptake at 298 K and 35 bar. Each point represents a MOF. The data points are color-coded for the density of the MOF, and the diameter of each circle represents the largest cavity diameter (LCD) of the MOF.
Crystals 10 00700 g004
Figure 5. QSPR for CH4 storage in MOFs. CH4 gravimetric uptake at 298 K and 35 bar against BET surface area. Each point represents a MOF. The data points are color-coded for MOF density, and the diameter of each circle represents the largest cavity diameter (LCD) of each MOF.
Crystals 10 00700 g005
Figure 6. Predictive power of proposed models for CH4 uptake. (A) Equation (4) for CH4 gravimetric uptake at 35 bar and 298 K and (B) Equation (5) for CH4 gravimetric uptake at 65 bar and 298 K. A perfect fit is indicated by the red line and the test set of MOFs are denoted by black circles. BET surface area is the descriptor. Black circles represent experimental data points.
Crystals 10 00700 g006
Figure 7. QSPR for CH4 storage in MOFs. CH4 gravimetric deliverable capacity at 298 K and 35 bar against BET surface area. Each point represents a MOF. The data points are color-coded for MOF density, and the diameter of each circle represents the largest cavity diameter (LCD) of each MOF.
Crystals 10 00700 g007
Figure 8. QSPR for CH4 storage in MOFs. CH4 volumetric and gravimetric uptakes at 298 K and 35 bar. Each point represents a MOF. The data points are color-coded for MOF density, and the diameter of each circle represents the largest cavity diameter (LCD) of each MOF.
Crystals 10 00700 g008
Figure 9. QSPR for CH4 storage in MOFs. CH4 volumetric delivery (cm3 (STP)/cm3) at 298 K, 65 bar and at 35 bar. Each point represents a MOF. The data points are color-coded for MOF density, and the diameter of each circle represents the largest cavity diameter (LCD) of each MOF.
Crystals 10 00700 g009
Table 1. Pore volume, uptake, and deliverable capacity of selected MOFs. Table adapted from Reference [29].
MOFVP
(cm3g−1) a
BET
(m2g−1)
Uptake b
(cm3cm−3)
Delivery c
(cm3cm−3)
T
(K)
P
(bar)
Uptake b
(cm3cm−3)
Delivery c
(cm3cm−3)
T
(K)
P
(bar)
Qst
kJ mol−1
REF
PCN-611.3630001711272983521917429865-[4]
HKUST-10.711555190-30335254-3036520.7[30]
MgMOF-740.69-200113298352301422986518.5[16]
MOF-51.4-150118298352141822986512.3[16]
Cu-TDPAT0.9319381811222983522216329865-[31]
PCN-140.831984202125298352391602986517.6[16]
CoMOF-740.51-221110298352491362986519.5[16]
PCN-611.3630001711272983521917429865-[24]
MOF-2103.60624083712983514313129865-[4]
PCN-140.852000195122298352301572986518.7[9]
NU-1112.094930138111298352061792986514.2[9]
NU-1401.974300138108298352001702986514[32]
NU-1251.293120181133298352281802985815.5[33]
NiMOF-740.471218214942983523611629865-[34]
NU-1112.094930138111298352061792986515.2[35]
NOTT-1090.8502110196125300352421703006517.1[36]
ZJU-51.0742823190130300352281683006515.3[37]
ZJU-251.1832124180132300352291813006315.1[38]
NU-1351.022530187127298352301702986516.6[39]
NOTT-1000.6771661195104300352301393006518.1[36]
a Vp: pore volume. b Total volumetric uptake, cm3 (STP) cm−3. c The deliverable amount is defined as the difference in total uptake between 5 bar and the specified upper limiting working pressure under isothermal conditions. Qst is the isosteric heat of adsorption of CH4. NU-111 (NU = Northwestern University), Ni-MOF-74 (MOF = metal-organic framework), UTSA-20 (UTSA = University of Texas at San Antonio), HKUST-1 (Hong Kong University of Science and Technology), and (ZJU = Zhejiang University).