Article

Crystallographic Texture Analysis of As-Built and Heat-Treated Ti6Al4V (ELI) Produced by Direct Metal Laser Sintering

1
Department of Mechanical and Mechatronics Engineering, Central University of Technology, Free State, Bloemfontein 9300, South Africa
2
Centre for Rapid Prototyping and Manufacturing, Central University of Technology, Free State, Bloemfontein 9300, South Africa
*
Author to whom correspondence should be addressed.
Crystals 2020, 10(8), 699; https://doi.org/10.3390/cryst10080699
Submission received: 3 July 2020 / Revised: 3 August 2020 / Accepted: 5 August 2020 / Published: 12 August 2020
(This article belongs to the Special Issue Crystallography of Structural Phase Transformations)

Abstract

:
This paper reports on an investigation of crystallographic texture of as-built and heat-treated Ti6Al4V (ELI) produced by direct metal laser sintering (DMLS). The texture analyses were conducted using electron backscatter diffraction (EBSD). The β-phase texture from the obtained EBSD data was ascertained based on a reconstruction method using the Automatic Reconstruction of Parent Grain for EBSD data (ARPGE) program. A significant improvement of the maximum intensity of the texture from the pole figure was also noted upon heat treatment. The as-built samples and samples heat-treated just below the α→β transformation temperature showed a stronger fibrous texture of the reconstructed β-grains with the ⟨ 100 ⟩ directions almost parallel to the build direction. The alignment of the fibrous texture in the build direction disappeared after heat treatment above the α→β-grain transformation temperature.

Graphical Abstract

1. Introduction

Additively manufactured (AM) Ti6Al4V has been studied extensively in a wide scope, ranging from powder characterization [1], residual stresses [2,3,4], porosity [5], and heat treatment to a combination of heat treatment and high isostatic pressing (HIP) [6]. Most of these studies were dedicated to achieving AM Ti6AlV parts with superior mechanical properties to those produced via traditional conventional manufacturing processes such as forging, rolling and casting. The aim was to achieve full realization of the benefits associated with AM processes and adoption of this technology in manufacturing of functional components of Ti4Al4V such as turbine engines and orthopaedic implants. The as-built direct metal laser sintering (DMLS) produced Ti6Al4V shows high strength and low ductility due to resulting acicular (α′) microstructure. Modification of microstructure via heat treatment or thermo-mechanical heat treatments can result in optimization of the mechanical properties of these parts.
The grains of polycrystalline metals and alloys follow patterns that are induced by the manufacturing process such as rolling, drawing and forging processes that generally involve heat treatment and cooling at various rates. The patterns are commonly referred to as having a crystallographic texture. Materials are said to be strongly textured if 30% to 40% grains have similar orientation [7]. Strong texture can lead to anisotropic mechanical properties of parts. Texture has been reported to cause differences in mechanical properties in Ti6Al4V with respect to the loading axes [8]. The microstructure of DMLS Ti6Al4V is anisotrophic if the build direction is considered. Longitudinal sections parallel to the build direction show large elongated prior β-grains with their interiors filled with needle-like α′ martensitic lathes. The columnar prior β-grains in the AM process are normally a result of vertical thermal gradients of the build process that cause the grains to solidify and grow epitaxially along the build direction in the β-phase field [9]. Subsequent high cooling rates to room temperature transform the β-phase to α′-phase, leaving elongated β-grain boundaries observable [10]. Even though the columnar β-grain boundaries should cause anisotropy of the mechanical properties of the as-built parts, some studies have pointed out that the random orientation of α′/α-grains within them weakens such anisotropy [10,11]. It has also been suggested [10,12] that these elongated β-grain boundaries can be preferential regions for crack initiation and propagation for tensile loads acting orthogonal to the build direction.
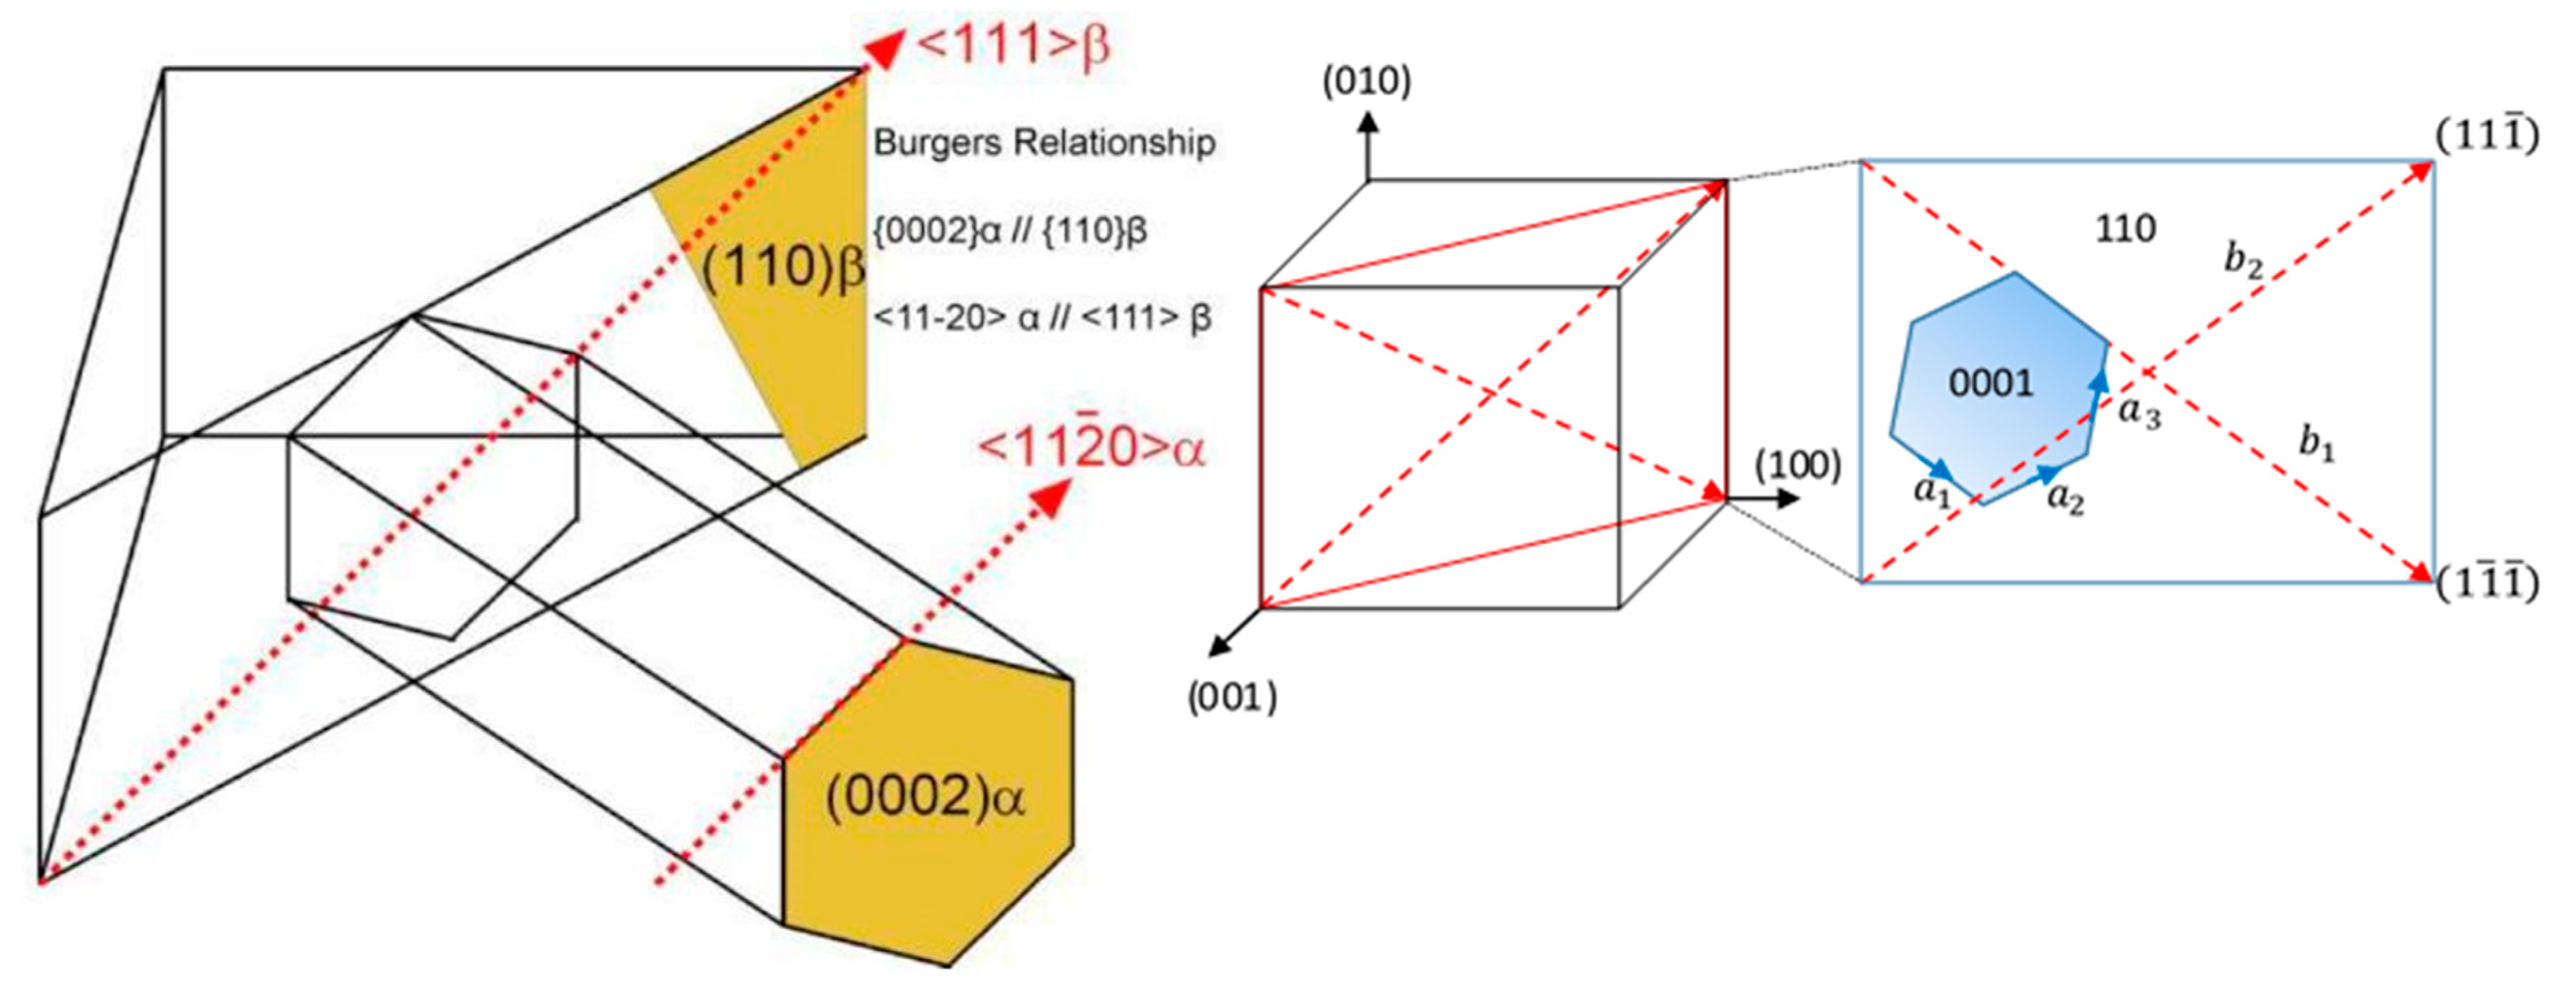
Generally, in Ti6A4V, phase transformation takes place between a high temperature body-centred cubic (bcc) phase (β-phase) and a low-temperature hexagonal closed packed (hcp) phase (α′/α –phase) [6,9,13]. The transformation α→β occurs during heating and β→α during cooling. During either of these transformations, the closed packed planes ( 110 ) β corresponds to ( 0002 )   α   / α whereas the two slip directions in bcc lattices relate to the slip directions of nearest-neighbours in hcp lattices,   [ 1 1 ¯ 1 ] β   | |   [ 11 2 ¯ 0 ] α . This transition is known as Burgers orientation relationship (BOR) [13] and is illustrated in Figure 1.
As seen in Figure 1, the perfectly aligned directions of the bcc and hcp phases are <a1> and <b1>. There exists a second direction <a2> that is reasonably aligned with the <b2> direction (with 10.52° misorientation). The third direction <a3> in the ( 0002 ) α slip plane is misaligned (with 60 ° misorientation) with respect to the <b1> Burgers vector in the corresponding bcc phase. The six { 110 } β planes in a bcc crystal give rise to six possible ( 0001 ) α orientations. Moreover, each { 110 } β plane contains two 111 β slip directions, as seen in Figure 1, that can be aligned to the <a1> direction. Thus, there are 12 possible α′/α-grain patterns that can nucleate from a single prior β-grain during cooling. If all 12 variants are formed with equal statistical probability during the β→α transformation, this could lead to a weak α-texture. However, it has been shown that there is a preferential tendency of some of the different α′/α orientations to nucleate more than others, which is commonly referred to as variant selection [10,14]. The presence of specific grain boundary characteristics in the high-temperature β-phase has been considered to enhance certain variants during transformation in titanium alloys [14]. The development of texture during the β→α transformation may also be influenced by the characteristics of texture of the high-temperature β-phase, as well as the annealing temperature and cooling rate [15].
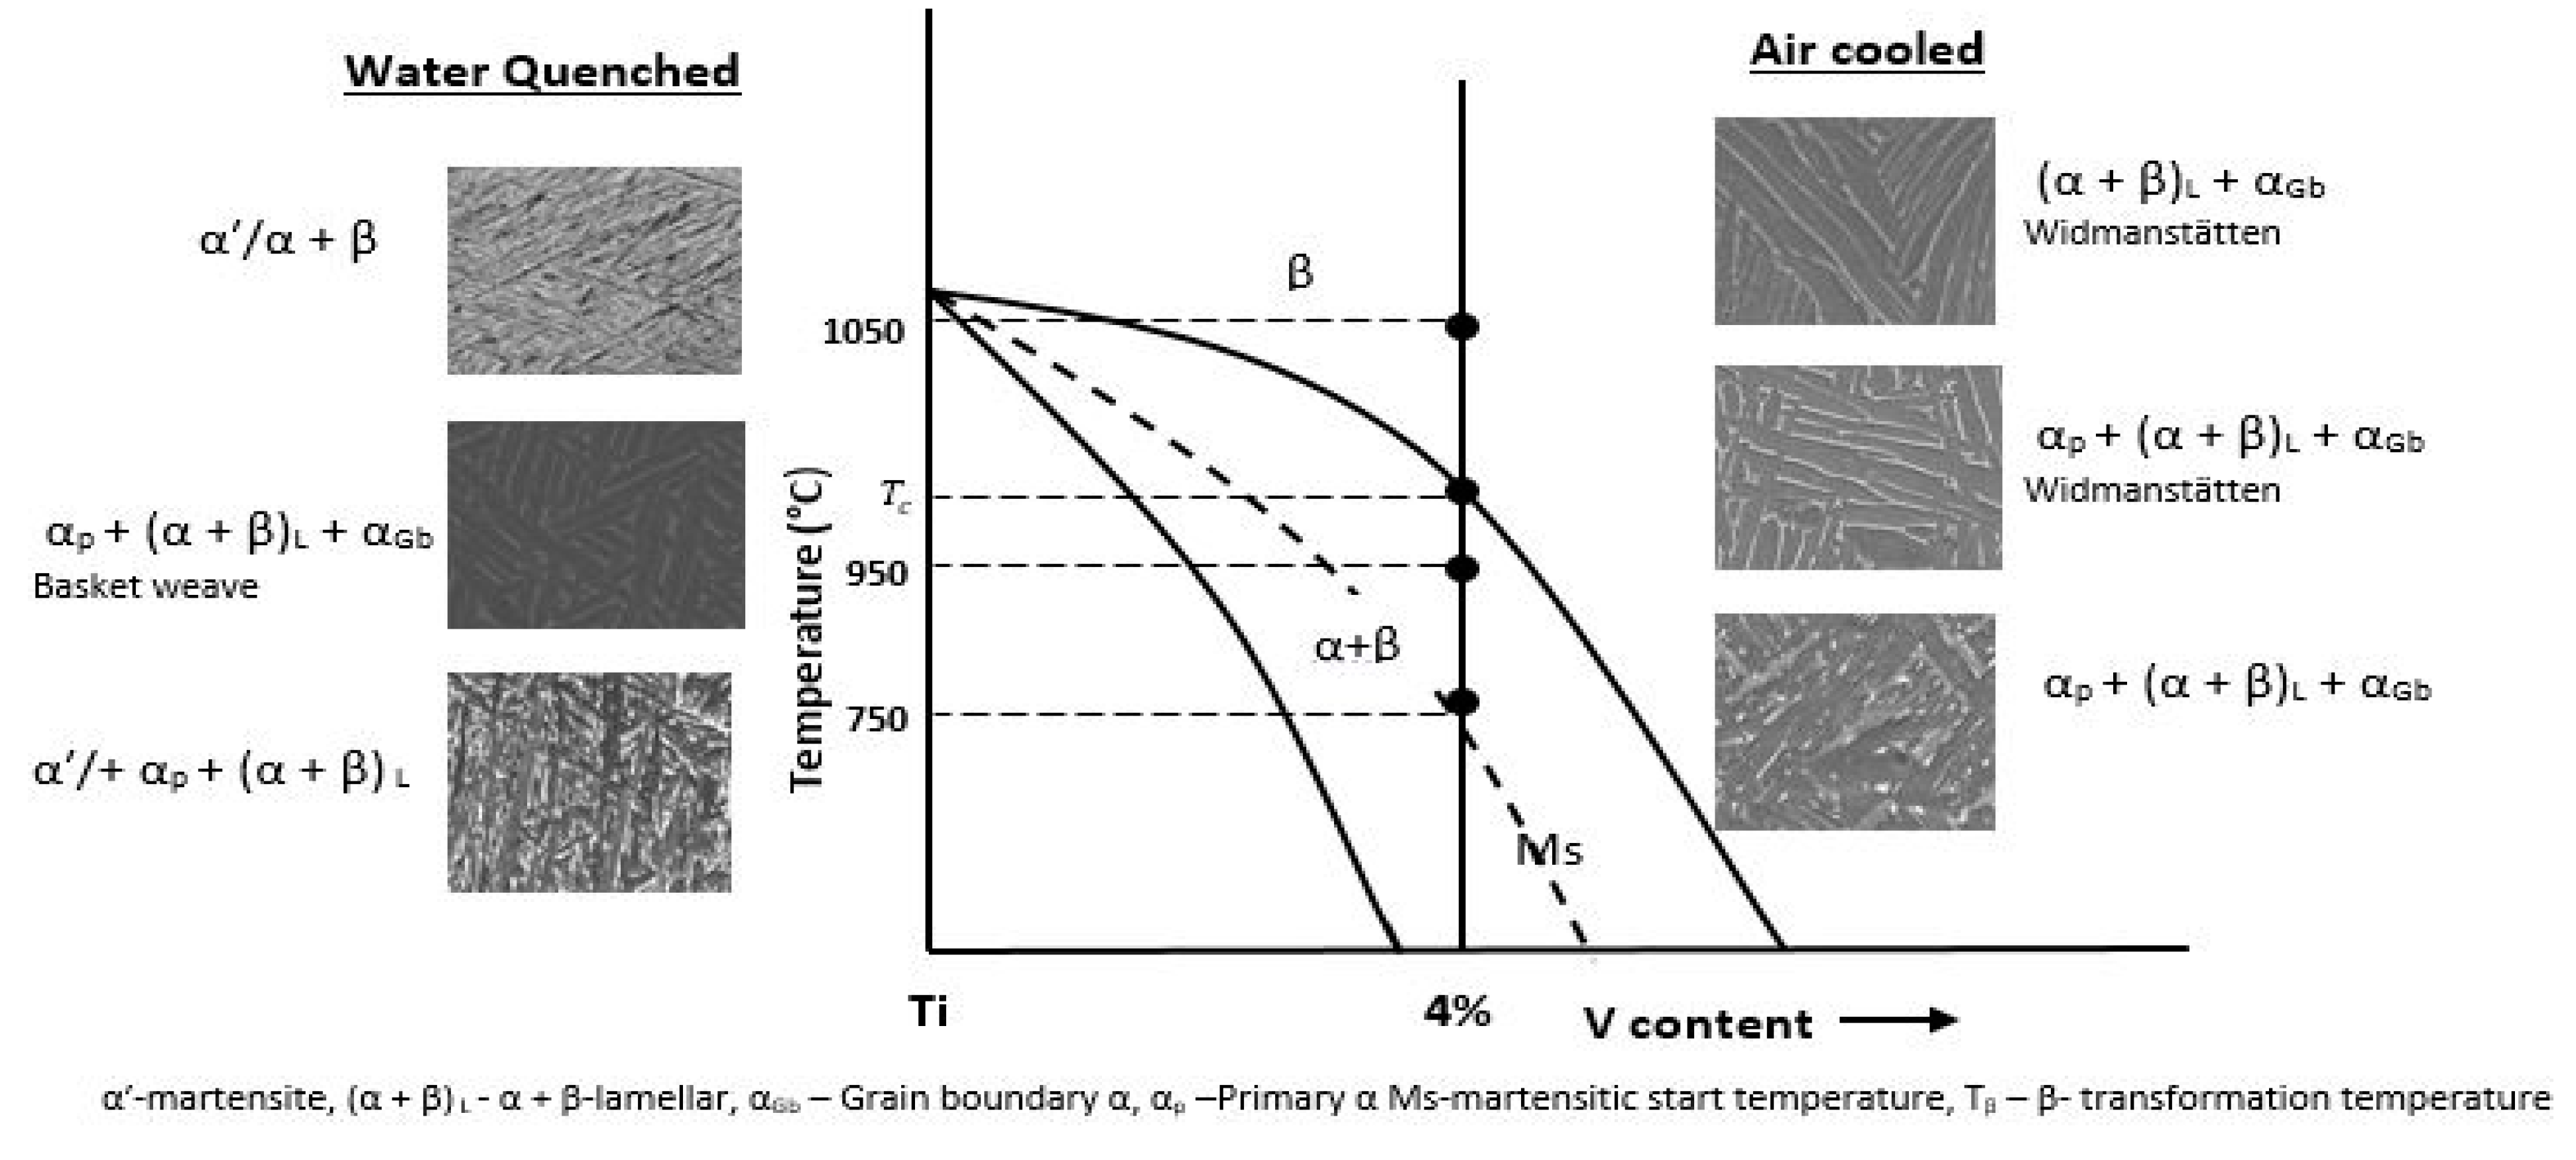
High cooling rates, such as water quenching and the ones experienced during the DMLS process, which are in the range of 104–106 K/s [16] promote displacive (diffusionless) β→α-phase transformation, leading to the formation of martensitic microstructure. Moderate to low cooling rates, however, lead to diffusional β→α-phase transformation to form more stable microstructure such as basket weave and Widmanstätten microstructures. A schematic diagram of the Ti6Al4V phase transformation and typical morphology of the resultant microstructures is shown in Figure 2.
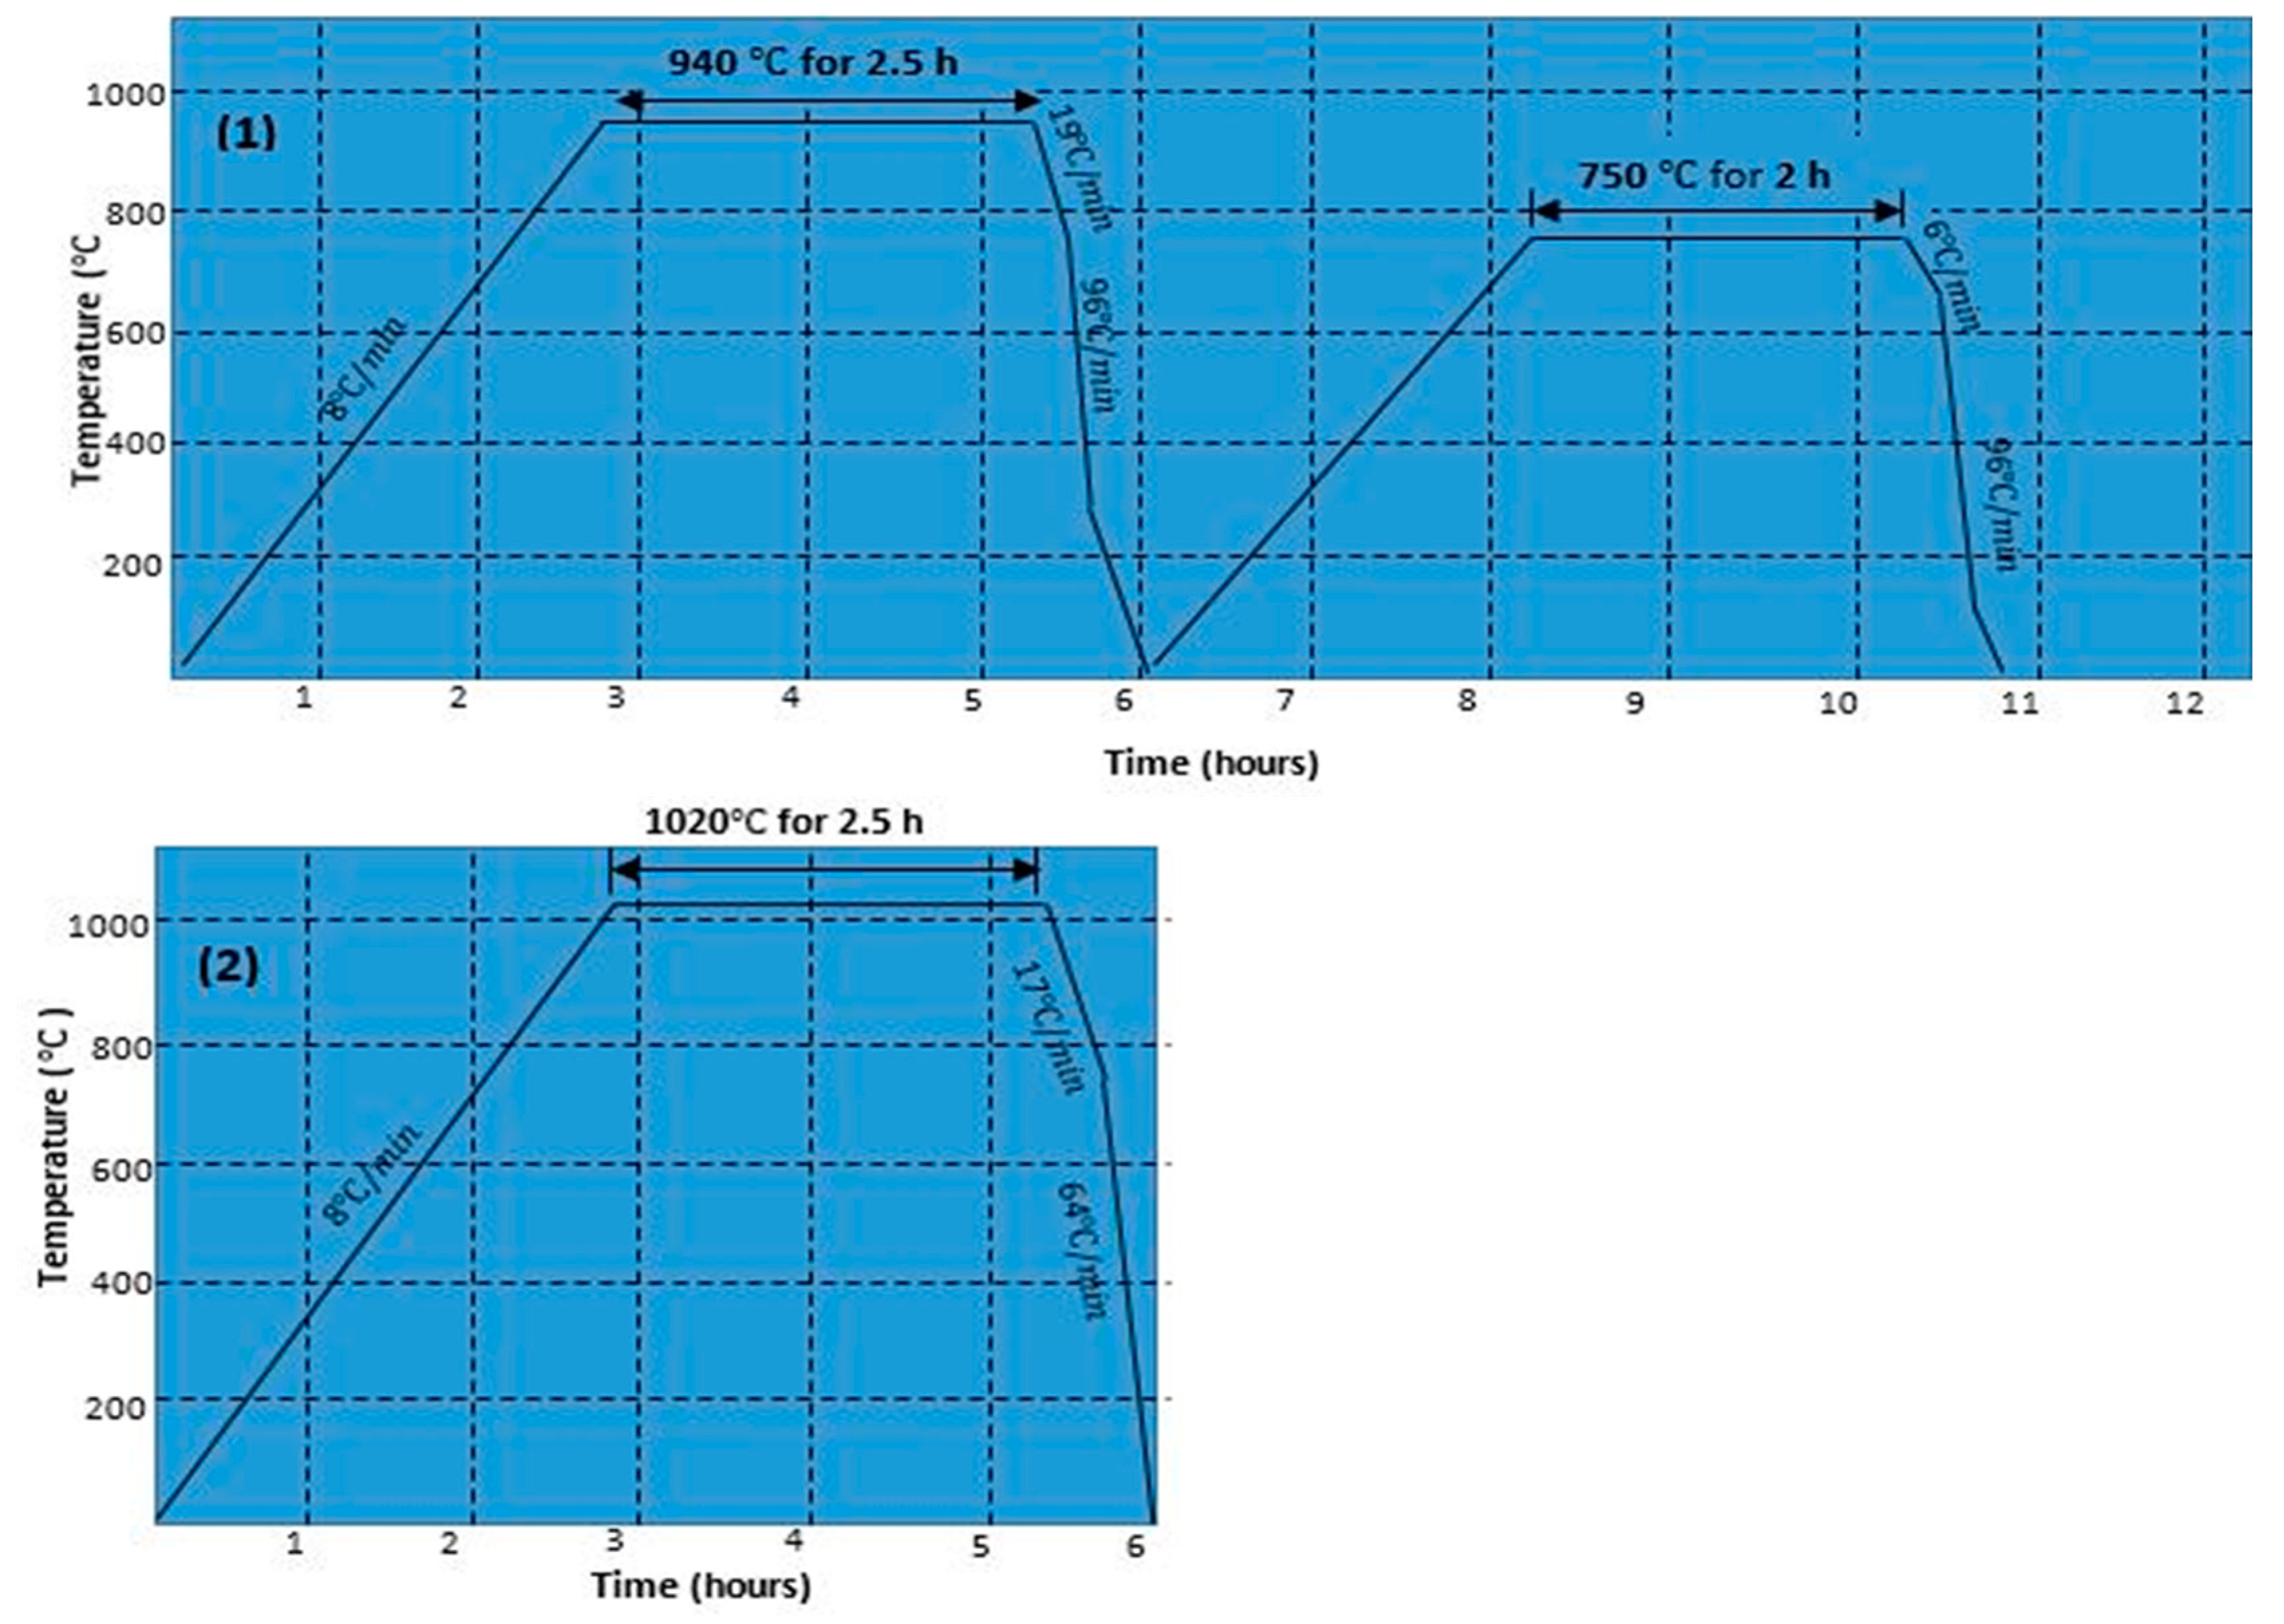
The aim of this paper is to study the crystallographic textures of martensitic, basketweave and Widmanstätten microstructures of DMLS Ti6Al4V (ELI), which are normally formed upon heat treatment of the martensitic structure just below and above the transformation temperature, respectively, followed by furnace cooling (FC). A detailed description of the variant selection of the α′/α in selected grains of the parent β-grains upon reconstruction of the grains of the three alloys then follows.

2. Materials and Methods

2.1. Production and Heat Treatment of Test Samples

The test samples for the analysis in this work were manufactured from atomised spherical-shaped Ti6Al4V (ELI) pre-alloyed powder, through the DMLS additive manufacturing process. The chemical composition of the powder complied with ASTM F3001-14. The samples were built in an EOSINT M280 DMLS machine (EOS GmbH, Munich, Germany) with the optimised set of process parameters shown in Table 1. These process parameters were adopted based on previous research carried out on this equipment and its record to produce superior solid Ti6Al4V (ELI) parts [17].
During the build process, the respective layer sections were initially offset about 100 μm from the external edges, forming an internal area. The internal area of each layer was initially scanned with parallel to and fro scan vectors. Thereafter, the area between the offset border and external border was scanned, and in this way improved the surface finish and reduced the number of defects near the surfaces of components. The process took place in a chamber filled with argon gas to maintain oxygen levels at less than 500 ppm and limit other gaseous impurities [18]. Oxygen enrichment of Ti6Al4V causes embrittlement and reduces fatigue life and toughness of the parts due to formation of an alpha-case, which is an oxygen enriched region directly beneath the surface [19]. In addition to this, the inert atmosphere reduces the fire hazard during melting [18]. The fabricated samples were cylindrical in shape with a diameter and length of 6 mm and 80 mm, respectively. Some of the as-built specimens were heat-treated at two different heat treatment regimes. Schematics of the full details of these heat treatment cycles are shown in Figure 3. The as-built samples are hereinafter referred to as samples A, while those annealed in heat treatment cycles 1 and 2 are hereinafter referred to as samples B and samples C, respectively.
Generally, cooling rates affect the growth of α-lathes for temperatures below the beta transus temperature and above the martensitic start temperature (Ms), including formation of martensitic microstructure for very rapid cooling. The initial slower cooling rates shown in Figure 3 were adopted in the present work to ensure there was sufficient grain-growth, without reformation of martensitic microstructure. The slightly higher cooling rates thereafter were aimed at minimizing excessive coarsening of the grains formed during cooling, which could otherwise have led to lowering of the strength of the final microstructure.

2.2. Microstructural Characterization

The samples for microstructural and crystallographic texture analyses were initially mid-sectioned into halves and then polished to a mirror finish. The sectioning was done along the length of the specimens and parallel to the building direction using an electrical discharge wire cutting machine. Prior to grinding and polishing, the specimens were hot compressively mounted in a mounting cylinder in Multfast resin (Struer, Cleveland, OH, USA) using a Citopress mounting machine (Struer Cleveland, OH, USA). The polished samples for use in optical and scanning electron microscopy metallography were then etched to delineate the grain boundaries in a fume chamber using a solution of Kroll’s reagent (ES Laboratory, LLC, Glendora, CA, USA), an aqueous solution containing 10 mL of HF (48% concentration), 85 mL of H2O and 5 mL of HNO3. The samples for EBSD analysis were not etched since in the EBSD technique the grain boundaries are delineated by processing the measurements of orientation.
The microstructures of the samples were examined in A ZEISS Axio Scope A1 optical microscope (Carl-Zeiss, Germany GMBH, Jena Germany) equipped with Axio Vision SE6E software (Carl-Zeiss Microscopy GMBH, Jena, Germany) that captures optical images of etched samples. The crystallographic orientations of the crystals in the samples were studied using a JOEL JSM-7001F scanning electron microscope (SEM) (JOEL Ltd., Akishima, Japan) that was equipped with an electron backscatter detector for electron backscatter diffraction analysis (EBSD). The electron backscatter detector system was equipped with a low-light sensitive camera (CCD) and the HKL channel 5 data acquisition and manipulation software. The mounted samples were glued onto a holder pre-tilted at an angle of 70 ° from the horizontal towards the detector. This angle is normally recommended in order to optimise both the contrast in the diffraction pattern and the fraction of electrons scattered from the sample [20]. Prior to acquiring the EBSD scans, selection of certain optimal parameters that influence the quality of material characterization was done. ESBD data is normally collected using a sampling grid for which the user must specify both the size (horizontally and vertically) and spacing between the points of measurement, termed as step size. These two parameters determine the total number of acquisition points for a given scan, which plays a critical role in the time required to collect the data. Scanning a critical number of grains is significant for quantitative analysis of texture, while at the same time, an increased number of points per grain could also help to better describe the grain shape as well as interior sub-grain structures. The EBSD SEM settings used for the present work are shown in Table 2.
Texture heterogeneity is widely observed in microstructural features of AM parts. This is mainly due to different temperature distribution in the as-built parts and different cooling rates in the various parts. Since the differences of textural in various parts of the as-built samples were not investigated in the presented research, EBSD scanning was performed on the surface around and near the middle of the sectioned samples. The distribution of crystallographic orientations of the scanned samples were acquired and produced in the HKL channel 5 software. Post processing of data for distribution of orientations in the form of (.ctf) files was conducted in MTEX tool box 5.0.3 (Technische Universität Chemnitz, Saxony Germany), a free MatLab tool box for analysing and modelling crystallographic textures from EBSD data. Orientation maps were coloured and analysed using pole figures (PFs), inverse pole figures (IPFs) and Euler maps. The PFs were generated for various key crystallographic orientations for both the α-phase and β-phase. The scattered PFs were used to indicate the orientation of specific crystal planes, while a contouring step clustered the data to indicate regions of preferred orientations.

2.3. Reconstruction of the Orientations of Prior β-Grains

As discussed in the introduction section, the high temperature β-phase (bcc) of Ti6Al4V transform to the α′/α-phase upon cooling down to room temperature and this transformation obeys the BOR of ( 110 ) β | |   ( 0002 ) α and   [ 111 ] β | | [ 11 2 ¯ 0 ] α . During diffusional transformation, the β-phase is concealed by the α-phase formed due to its relatively low volume. Thus, the retained β-phase may not be sufficient to study and characterise the texture of the parent β-grains. In fact, the retained β-phase is not present during the displacive transformation, but, using the BOR, it is possible to reconstruct the parent grain’s (β-phase) orientation-based solely on the knowledge of the room temperature daughter grain’s (α′/α) phase orientations.
ARPGE 2.4 is a computer program developed by Cayron [21] (LITEN, Grenoble, France) for grain reconstruction of parent grains using the orientations measured from daughter α′/α variants in EBSD scans, by considering every triplet of neighboring α′/α-grains from the dataset. In the present study the ARPGE 2.4 program was used to carry out the automatic reconstruction of the β-phase. A typical interface screen of the program is shown in Figure 4. The α′/α invariants inherited from the same mother β-grain are normally assumed to have a specific misorientation related to the BOR. Five possible characteristic special misorientation types between α′/α inherited from the same β-grain are possible and are shown by the operators in Figure 4. Details of these misorientation angles and axes can be found in Gey and Humbert [22]. During reconstruction using this program, the Euler angles of the daughter invariants are checked, while determining if the misorientation between them is close to any of the six theoretical operators shown in Figure 4. First, the program starts by identifying daughter invariants, such that, if misorientation between two neighbouring EBSD points are 5 ° the points belong to different variants. Then if the deviation of misorientation angle between the neighbouring variants is within a tolerance of   3 ° 6 ° to any of the theoretical operators, there is a likelihood that the variants belong to the same β-grain. However, if the deviation is above the mentioned value ( 6 ° ), the variants are deemed to belong to different β-grains.
The reconstructed data of β-grains was then exported to a file compatible with Mtex (.ctf) for further post processing. The (0001) pole figures of the daughter grains (α′/α) and the (110) pole figures of parent (β) grains were then constructed on the same plot for comparison. This was done for at least 3 prior β-grains in each sample analysed.

3. Results and Discussion

The Ti6Al4V (ELI) samples were indexed with the cell parameters of the respective phases: (a) for Ti-Hex as a = 0.2954 μm and c = 0.4729 μm, and (b) for Ti-cubic as a = 0.3192 μm. The sample coordinates were defined by X, Y and Z directions. The Z-coordinate was the normal to the sample surface (out of plane) which was the direction of the EBSD scan vectors, while the X–coordinate was aligned to the build direction of the sample during the DMLS process. 
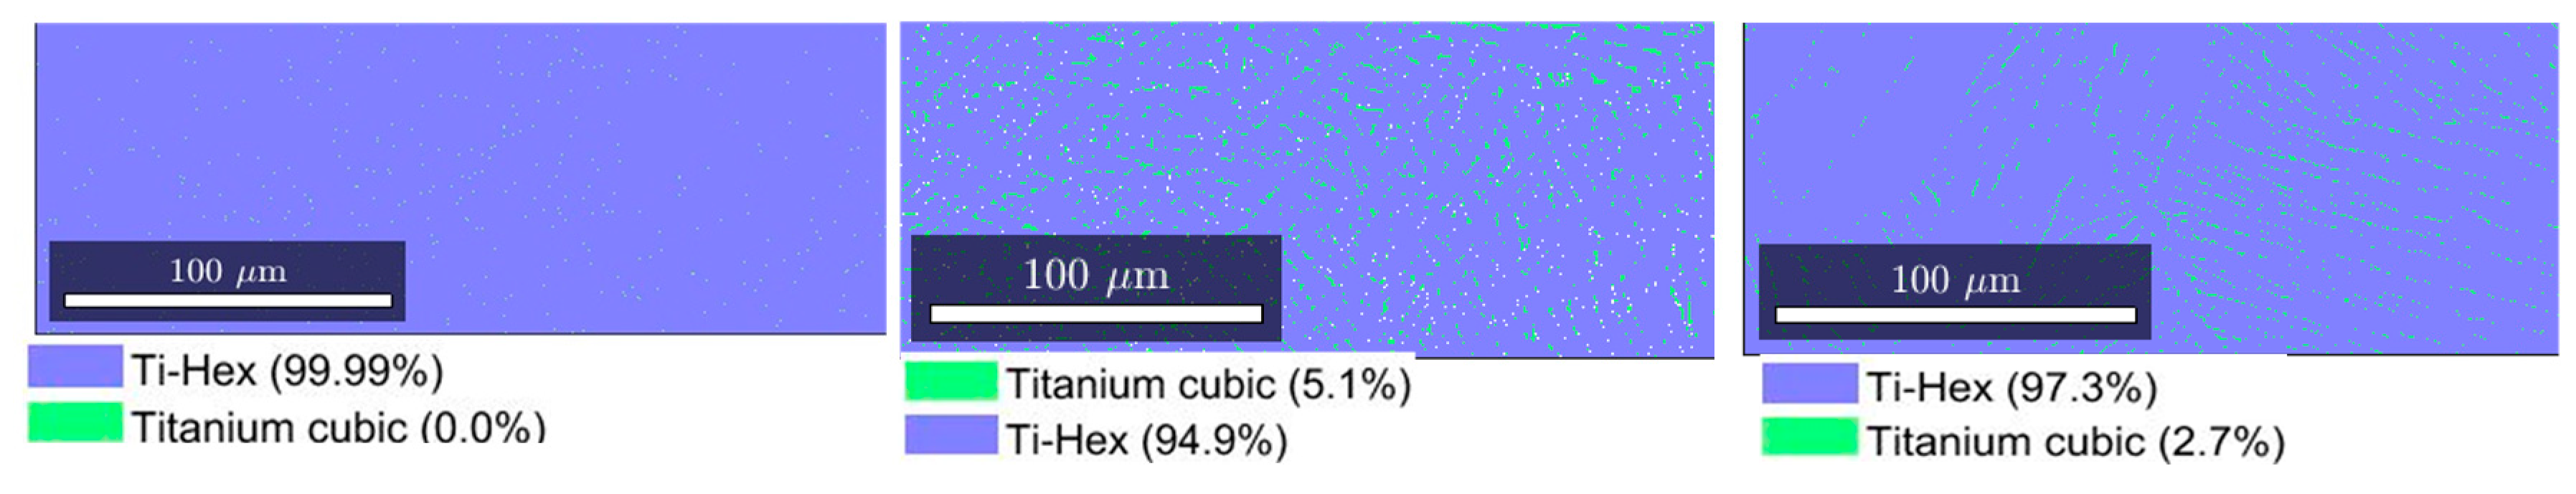
Figure 5 shows the EBSD phase maps of the as-built and heat-treated DMLS Ti6Al4V (ELI) samples. This figure highlights the absence of the β-phase in the Ti6Al4V (ELI) alloy microstructure, immediately after production in the as-built state. A small proportion of about 5.1% and 2.7% of β-phase was detected in the heat-treated samples B and C, respectively.
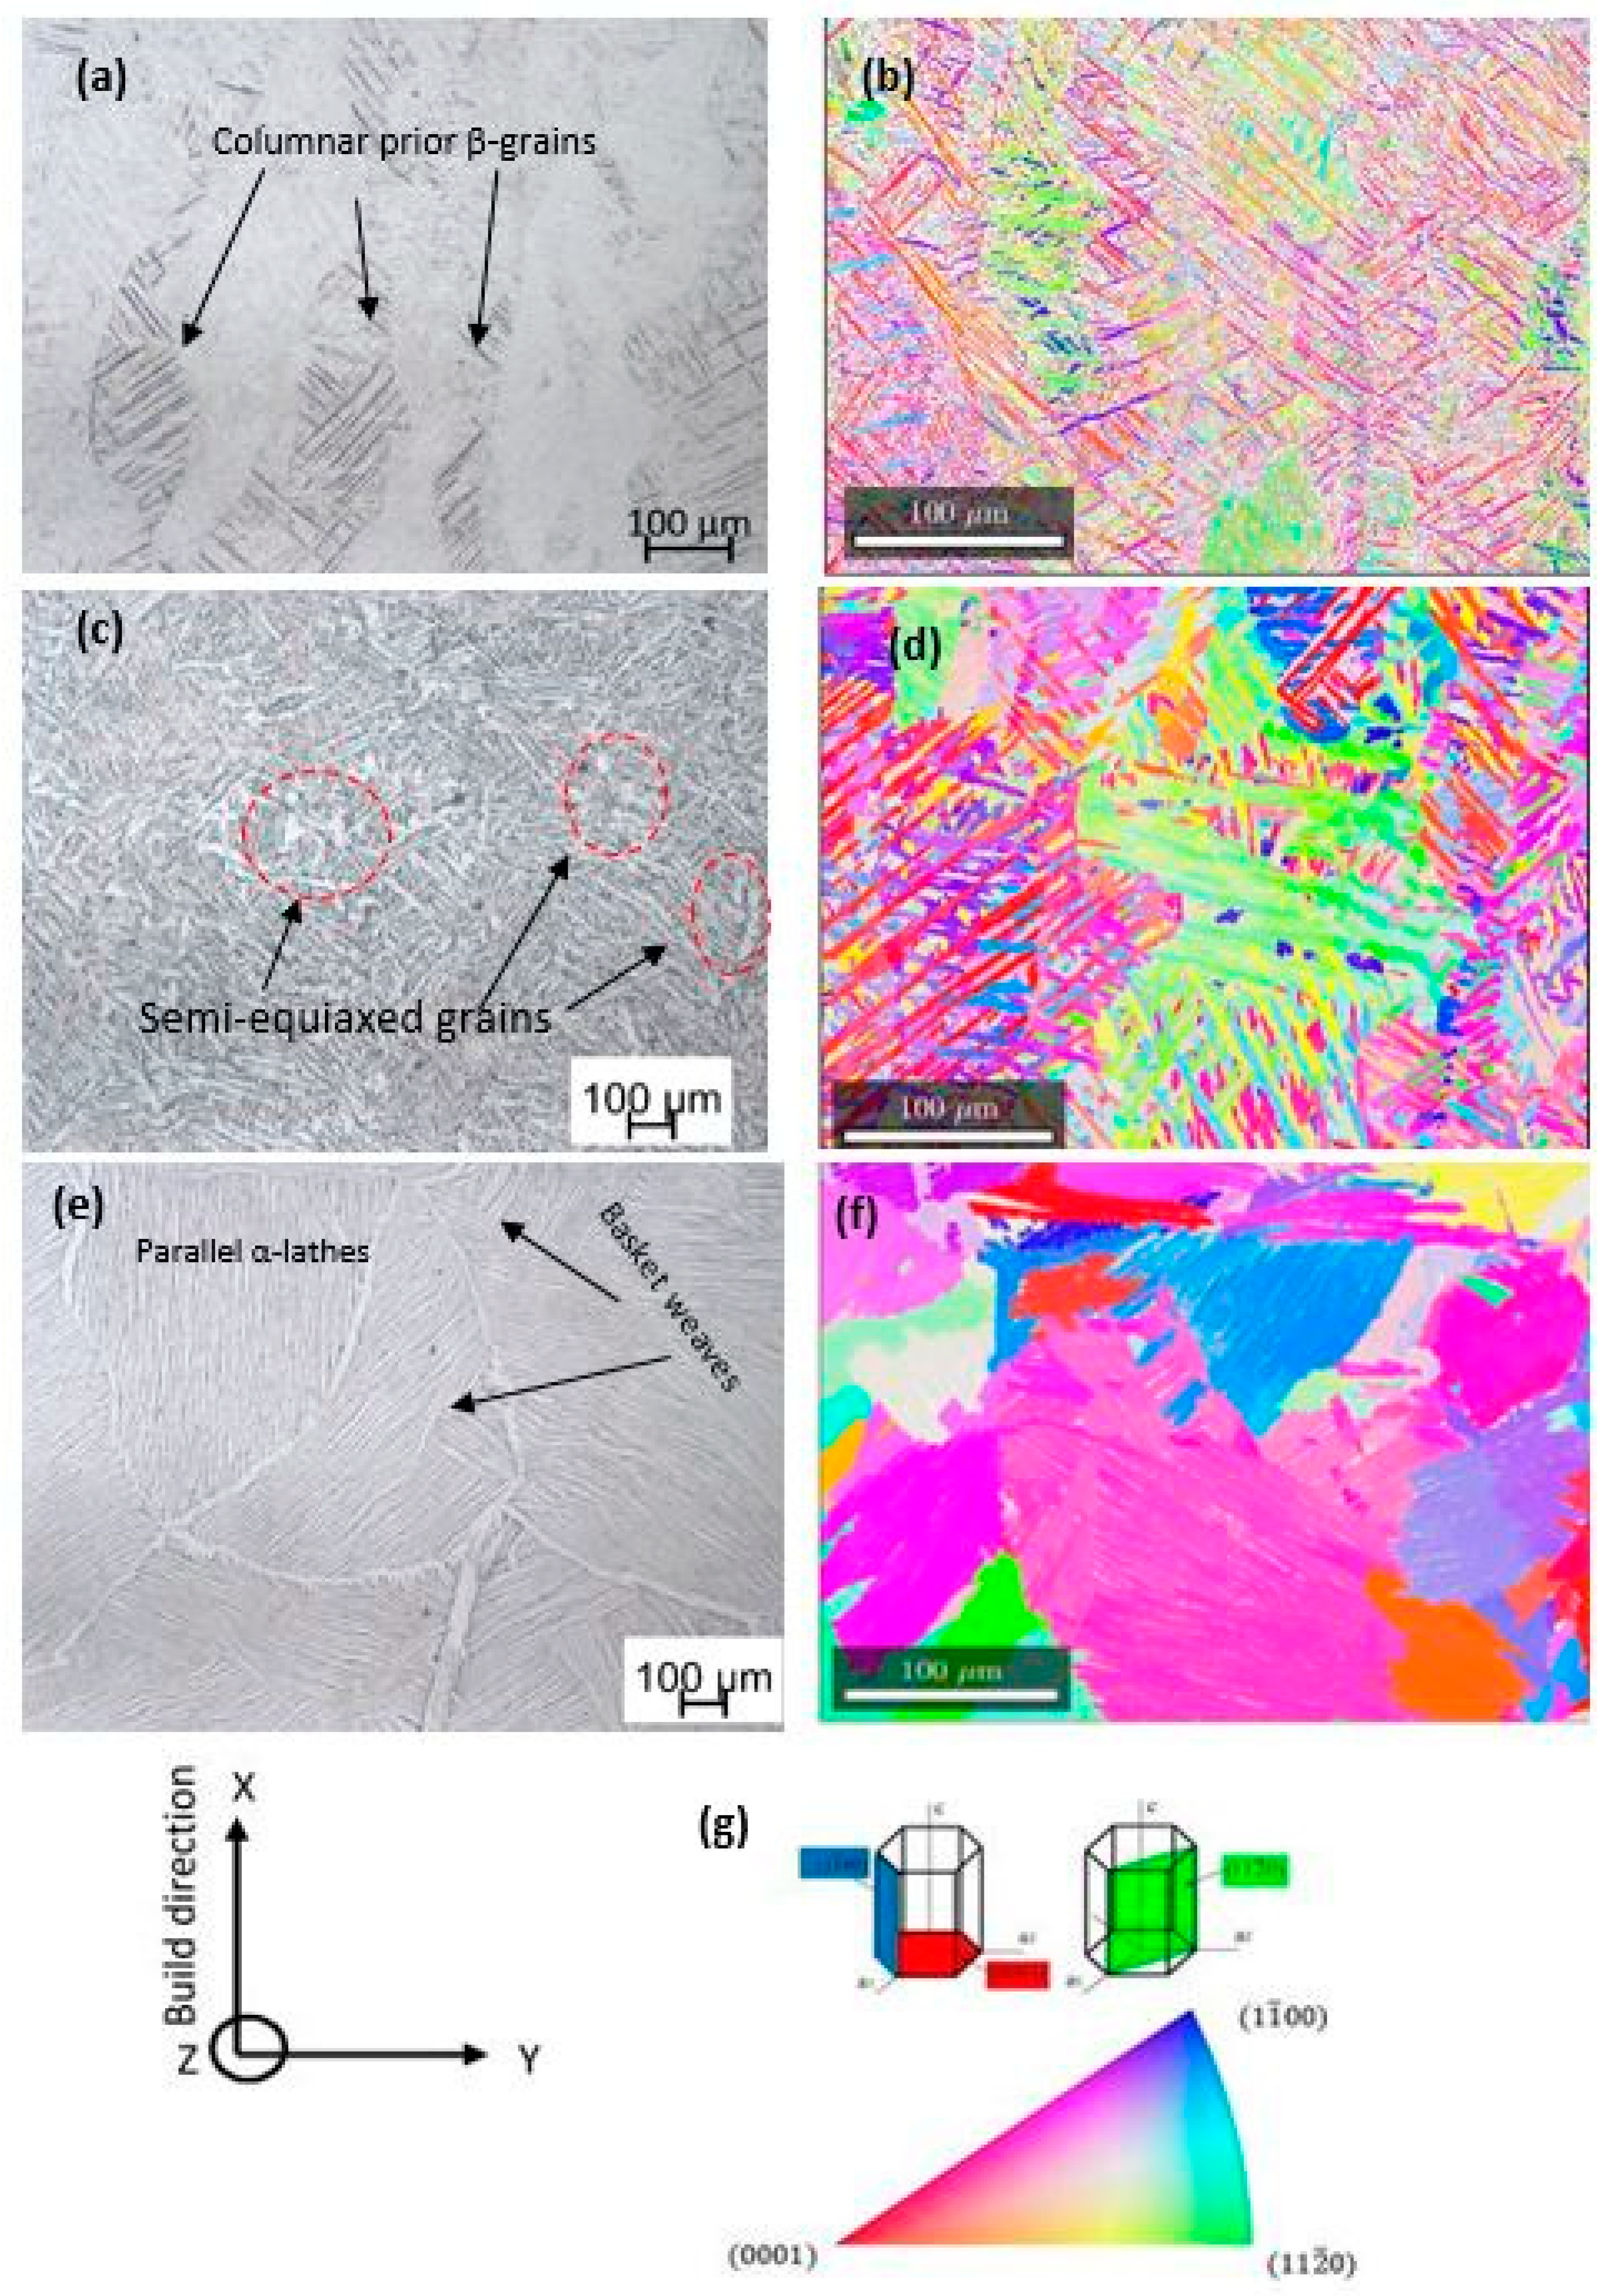
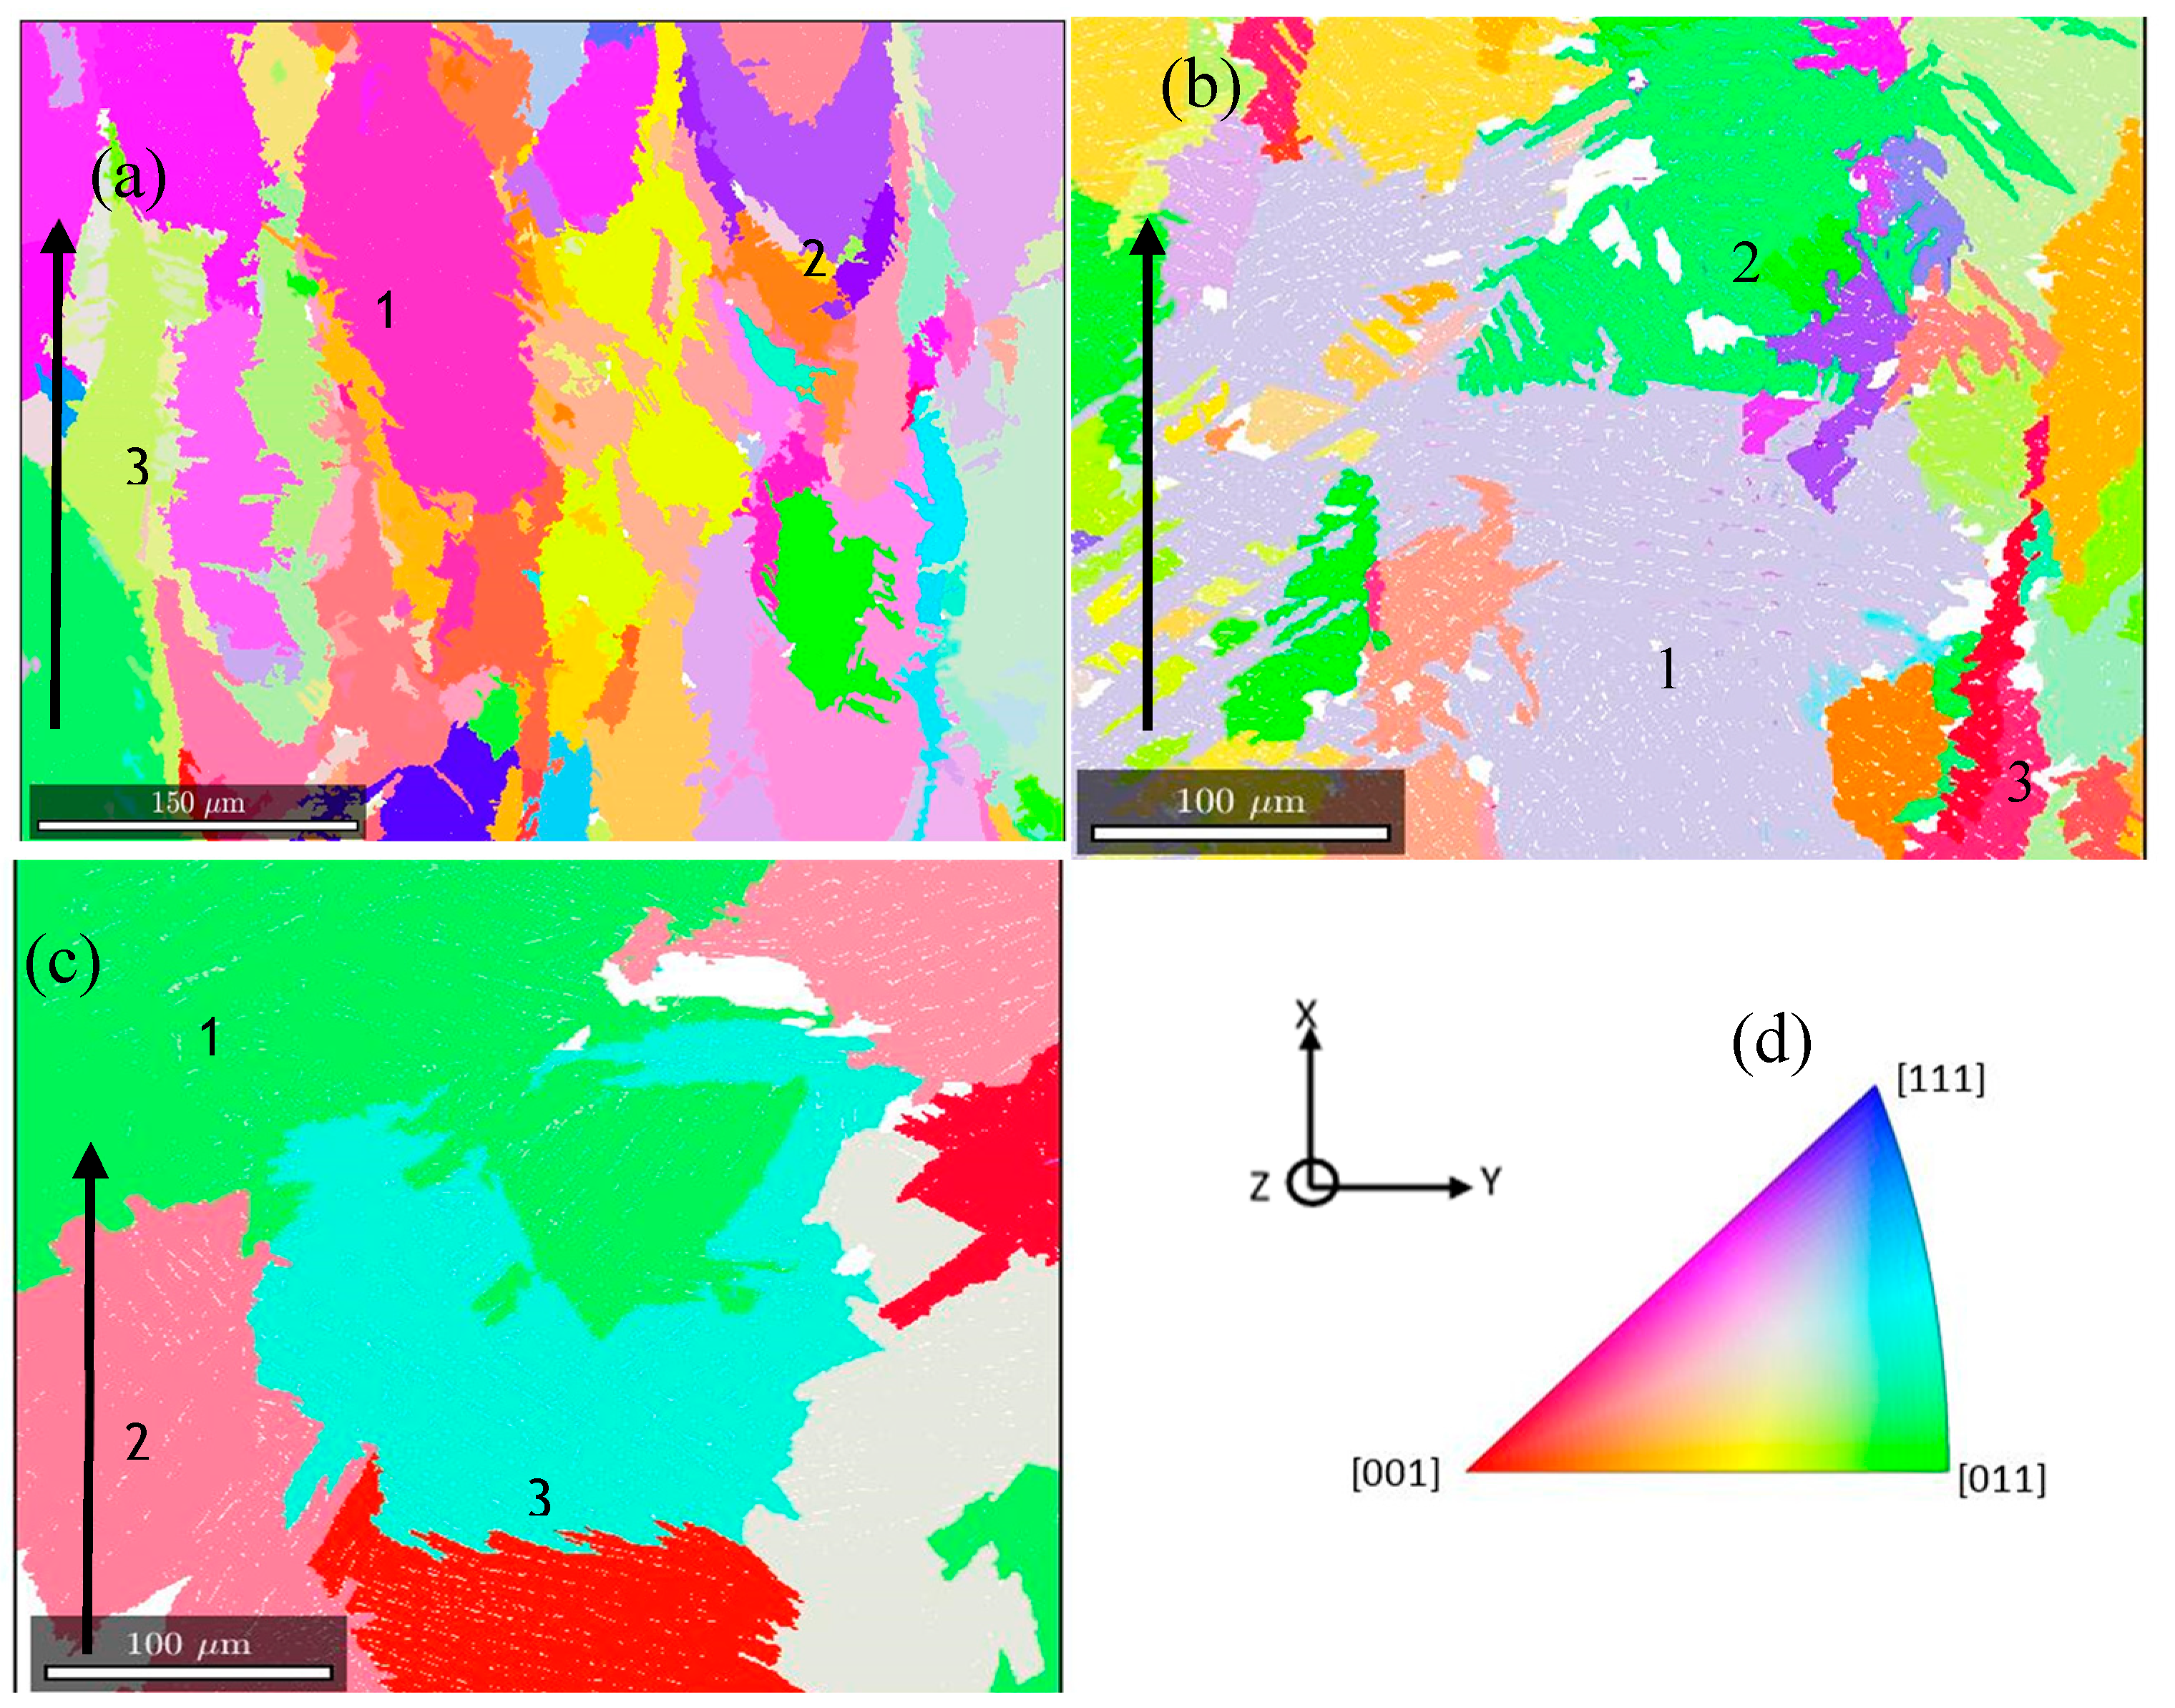
The optical images obtained and EBSD orientation maps for samples A, B and C are shown in Figure 6. The optical microstructure of non-heat-treated DMLS Ti6Al4V (ELI) as shown in Figure 6a is characterised by columnar β-grains, with a width of about 100–200 μm, epitaxially growing through multiple layers along the build direction. The α′ needle-like lathes with thicknesses of about 0.5–1.5 μm form in the interior of these elongated prior β-grains and extend to several hundreds of micrometres while confined to the width of prior β-grains. Samples B that were exposed to duplex annealing (940 °C/FC followed by 750 °C/FC) resulted in a coarse bi-phasic microstructure. The α-lathes in this case have an average thickness and length of about 6 μm and 150 μm, respectively. The shape of the α/β-grains as seen in Figure 6c is lamellae-like and the lathes cross over each other to form a basketweave-like network. A few patches of semi-equiaxed grains are observed in this micrograph, while a larger portion of the microstructure consists of lamellar α and β-grains. Stefansson et al. [23] suggested that to achieve at least 50% globularization of the α-phase in this heat treatment regime, a residence time of approximately 8 hours is necessary. However, in their work, the starting microstructure was equiaxed and deformed at local strains of 0.49. Therefore, for a starting fine martensitic microstructure of as-built DMLS Ti6AL4V (ELI), the globularization time is expected to be higher.
Samples C that were heat-treated above the α→β transformation temperature have the epitaxial prior β-grains replaced by equiaxed and semi-equiaxed prior β-grains shown in Figure 6e. The diameter of these prior β-grains are in the range of 150–500 μm, indicating extensive growth of β- grains in the as-built material during this heat treatment. Typical Widmanstätten microstructure with large colonies of α-grain characterises this microstructure as seen in Figure 6e. The colonies contain several parallel packed α-plates whose length is limited by the adjacent α-colonies. In some areas within the β-grains some α-lathes cross each other to form a basketweave-like network. The width of the α-lathes within the colonies is in the range of 7–15 μm, while the average width of these lathes determined through the line–intercept method is 9 μm.
Additionally, a much thicker continuous grain boundary comprised of α-phase can be observed in Figure 6e, which has a width in the range of 9–25 μm. The equiaxed and semi-equiaxed grains seen in Figure 6e are normally created by splitting of the columnar prior β-grains at high temperatures in the β-region. These temperatures provide sufficient thermal energy to cause a reduction in the interfacial energy, thus causing the movement of the initial β-grain boundaries. This process induces recovery and nucleation of the new grain boundaries.
The IPF key shown in Figure 6g has colour codes related to specific orientations: red, green and blue representing the family of planes   { 0001 } , { 11 2 ¯ 0 } and   { 1 1 ¯ 00 } , respectively, parallel to the X-Y surface. The martensitic α′ needles with randomly prevailing texture are now conspicuously visible in Figure 6b. High numbers of orientations within each prior β-grain can be observed in this micrograph. The random α′ texture exhibited by samples A has a mixed overall configuration, largely between   { 0001 } , and { 1 1 ¯ 00 } planes. Some α′-grain orientations tend to repeat within the same prior β-grains, as indicated by the repetition of the same colour of these lathes in Figure 6b. As seen in Figure 6d, extensive growth of α-lathes occurred during this cycle 1 heat treatment. In Figure 6f, the equiaxed and semi-equiaxed morphologies of prior β-grains are apparent and have orientation maps showing various colonies, each colony with the same α-grain orientations. Similar to samples A, the overall α-grain configuration in samples B and C is largely between the   { 0001 } , and { 1 1 ¯ 00 } planes.
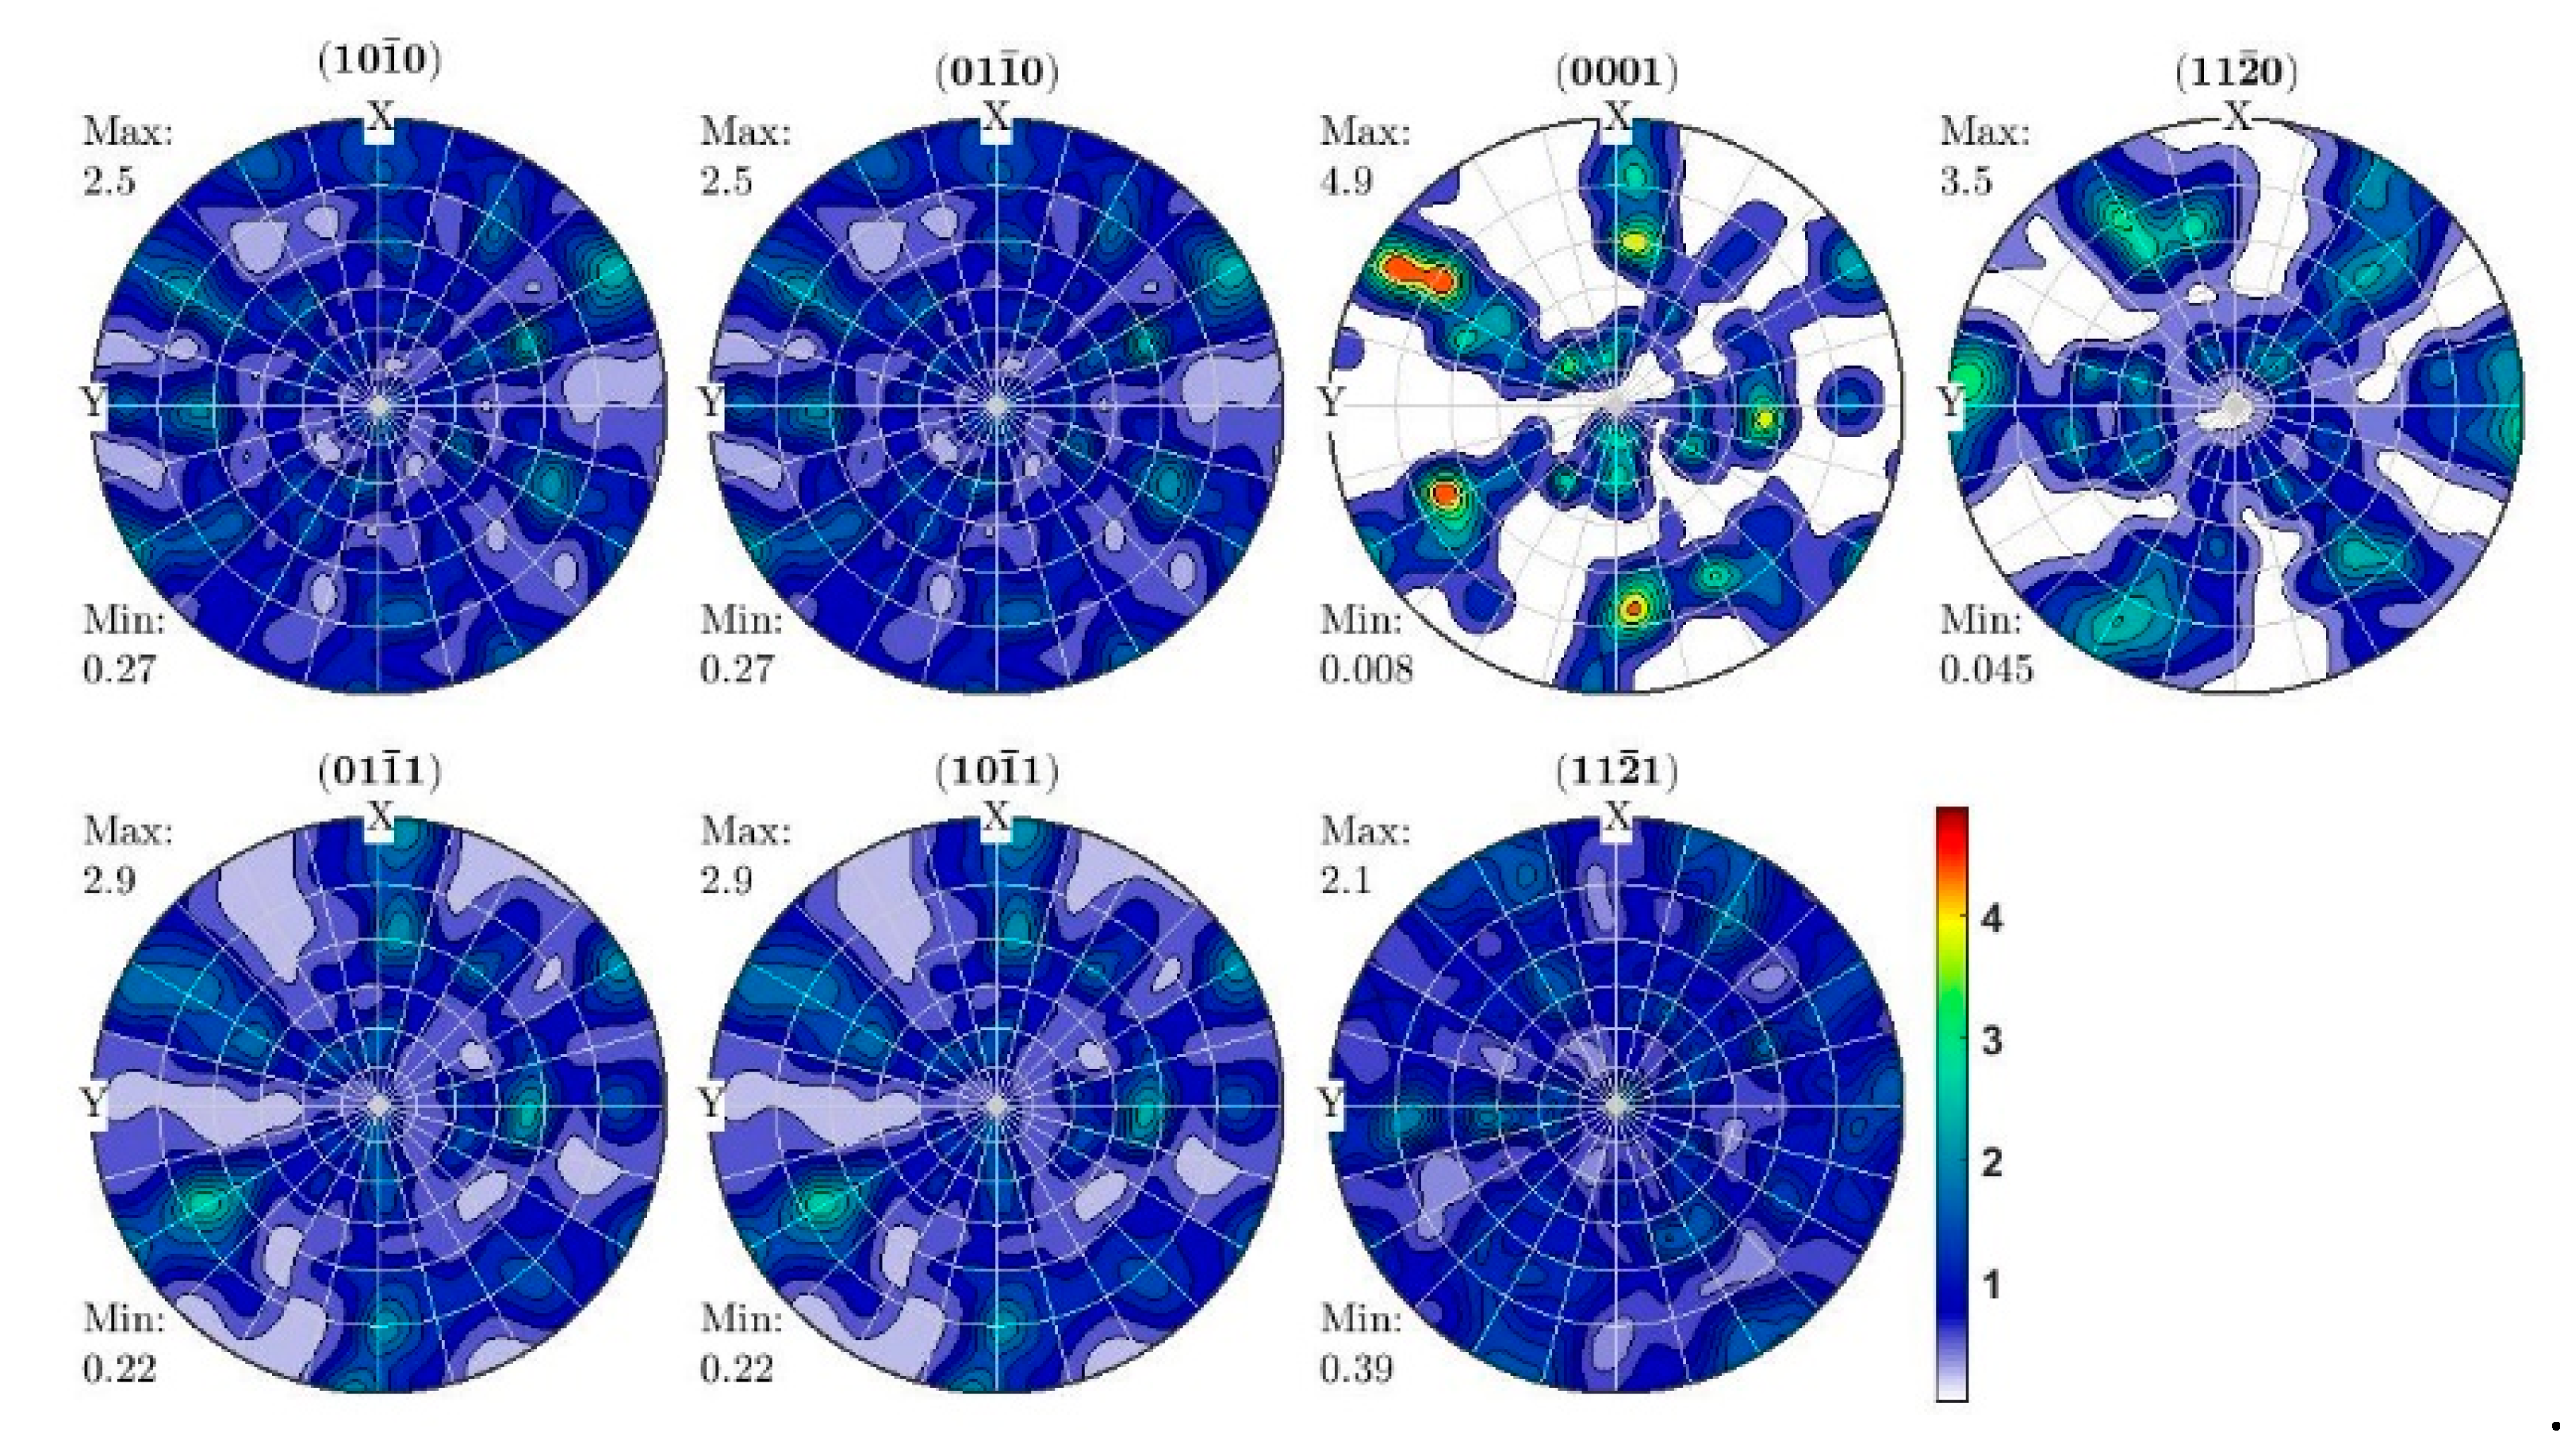
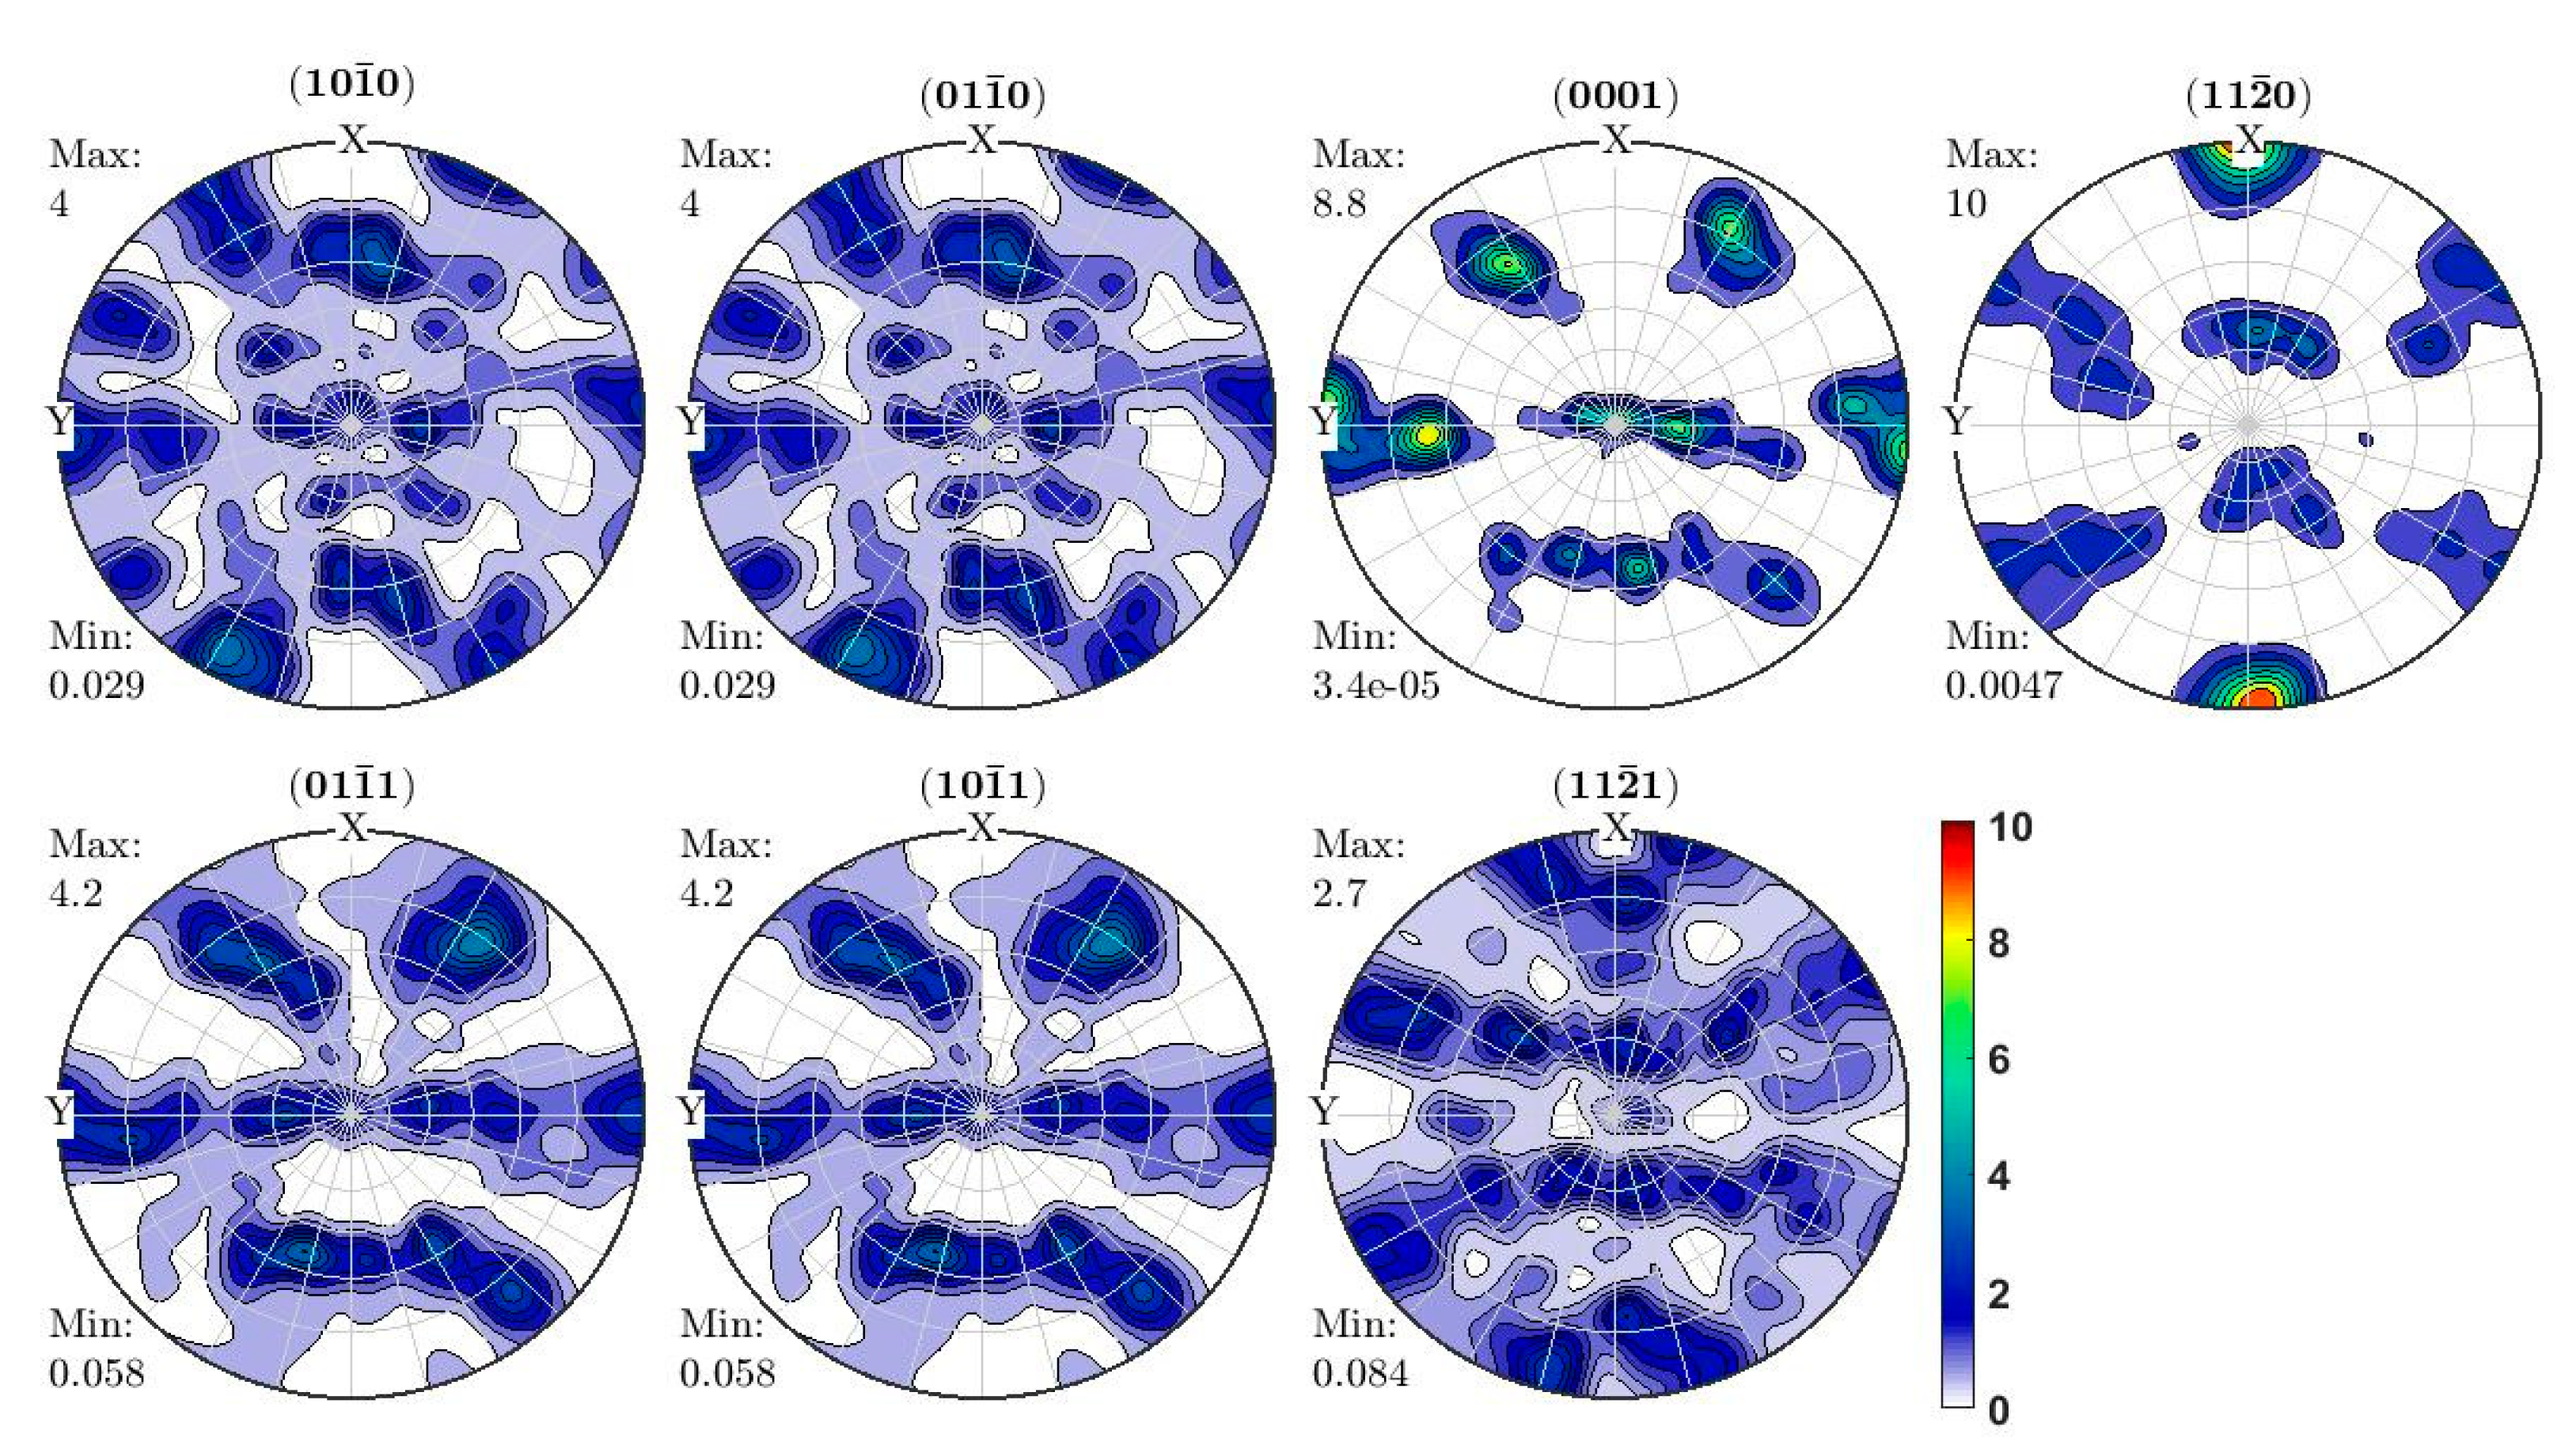
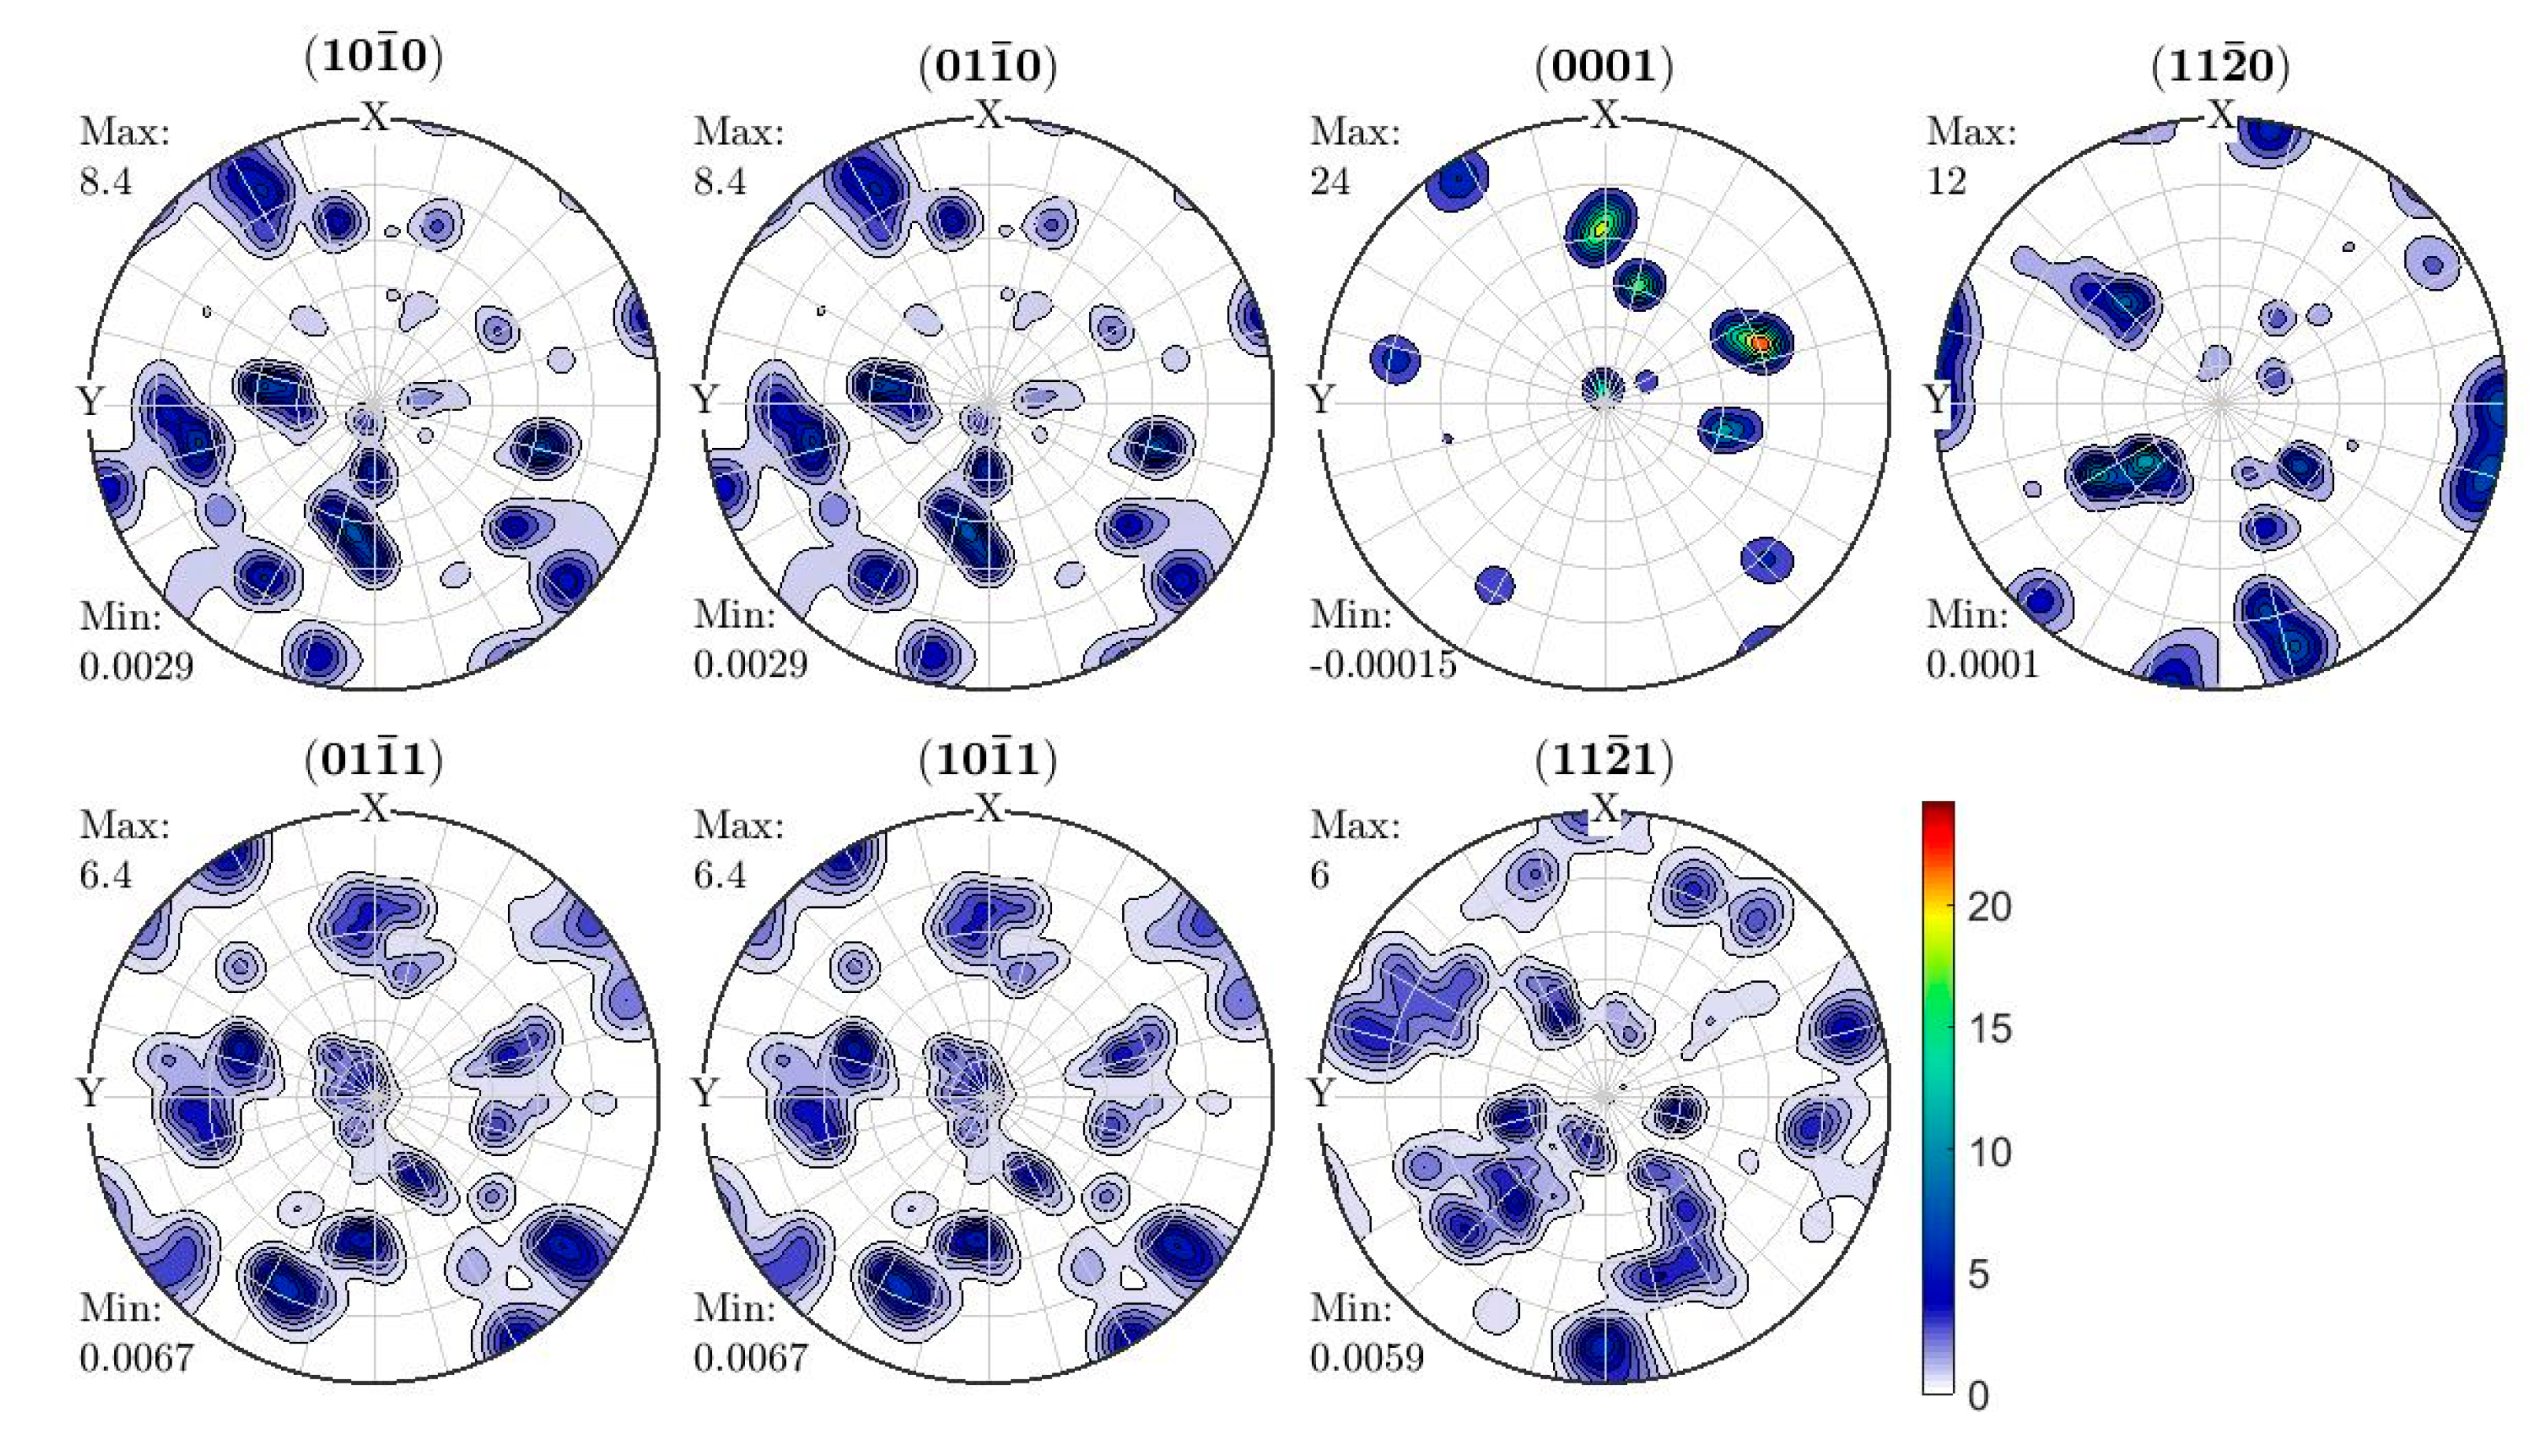
To study and compare the textures of the three forms of DMLS Ti6A4V (ELI) alloy, the orientation density from the various crystal planes of α-phase, namely   ( 10 1 ¯ 0 ) ,   ( 01 1 ¯ 0 ) ,   ( 0001 ) ,   ( 11 2 ¯ 0 ) , ( 01 1 ¯ 1 ) , ( 10 1 ¯ 1 ) and ( 11 2 ¯ 1 ) , were plotted and presented in the form of pole figures (PFs). The intensities were visualised in terms of contours and colours and were expressed as multiple unit density (MUD). Figure 7, Figure 8 and Figure 9 show the α′/α contour pole figures of samples A, B and C, and a summary of the maximum values of the texture in the form of MUD of the different planes is presented in Table 3. It is worth mentioning here that all the EBSD scans were carried out in an equal area for all samples defined by a grid area of 980 μm and 735 μm, and therefore the influence of heat treatment on the micro-texture could be deducted from the results obtained. The α′/α-phase texture intensity of the three different samples is quite different.
The maximum intensities of texture for samples A are significantly weaker in comparison with the maximum intensities of texture for the other samples, with values in the range of 2.1 to 4.9. There is a slight improvement of the maximum texture intensity values in samples B with the values in a range of 4.0 to 10.0. A significant improvement in texture intensity is noted in samples C with maximum values in the range of 6 to 24. This remarkable improvement is a result of colonies of α-grains that contain numerous parallel α-lathes with the same crystallographic orientation shown in Figure 4. This is also an indication that significant effective aggregation of variants occurred after heat treatment.
It can also be argued that while the sampling grid-area is constant, the remarkable growth of α-lathes from about 0.5 μm in the as-built state to about 6μm and 15 μm after heat treatment for samples B and C, respectively, could contribute to the increased frequency of orientations of planes seen in in Figure 4 and Table 3. This inference is based on the fact that an increase in the size of α-grains could mean an increase in the number of α-crystals packed within the grains, since the crystal lattice constants remain unchanged after heat treatment. Of all the planes the maximum values of MUD of the ( 0001 ) plane is the highest for samples A and C, while for samples B it is highest in the ( 11 2 ¯ 0 ) plane. A remarkable change in position of the {0001} and {11 2 ¯ 0} poles is evident after heat treatment as seen in Figure 8 and 
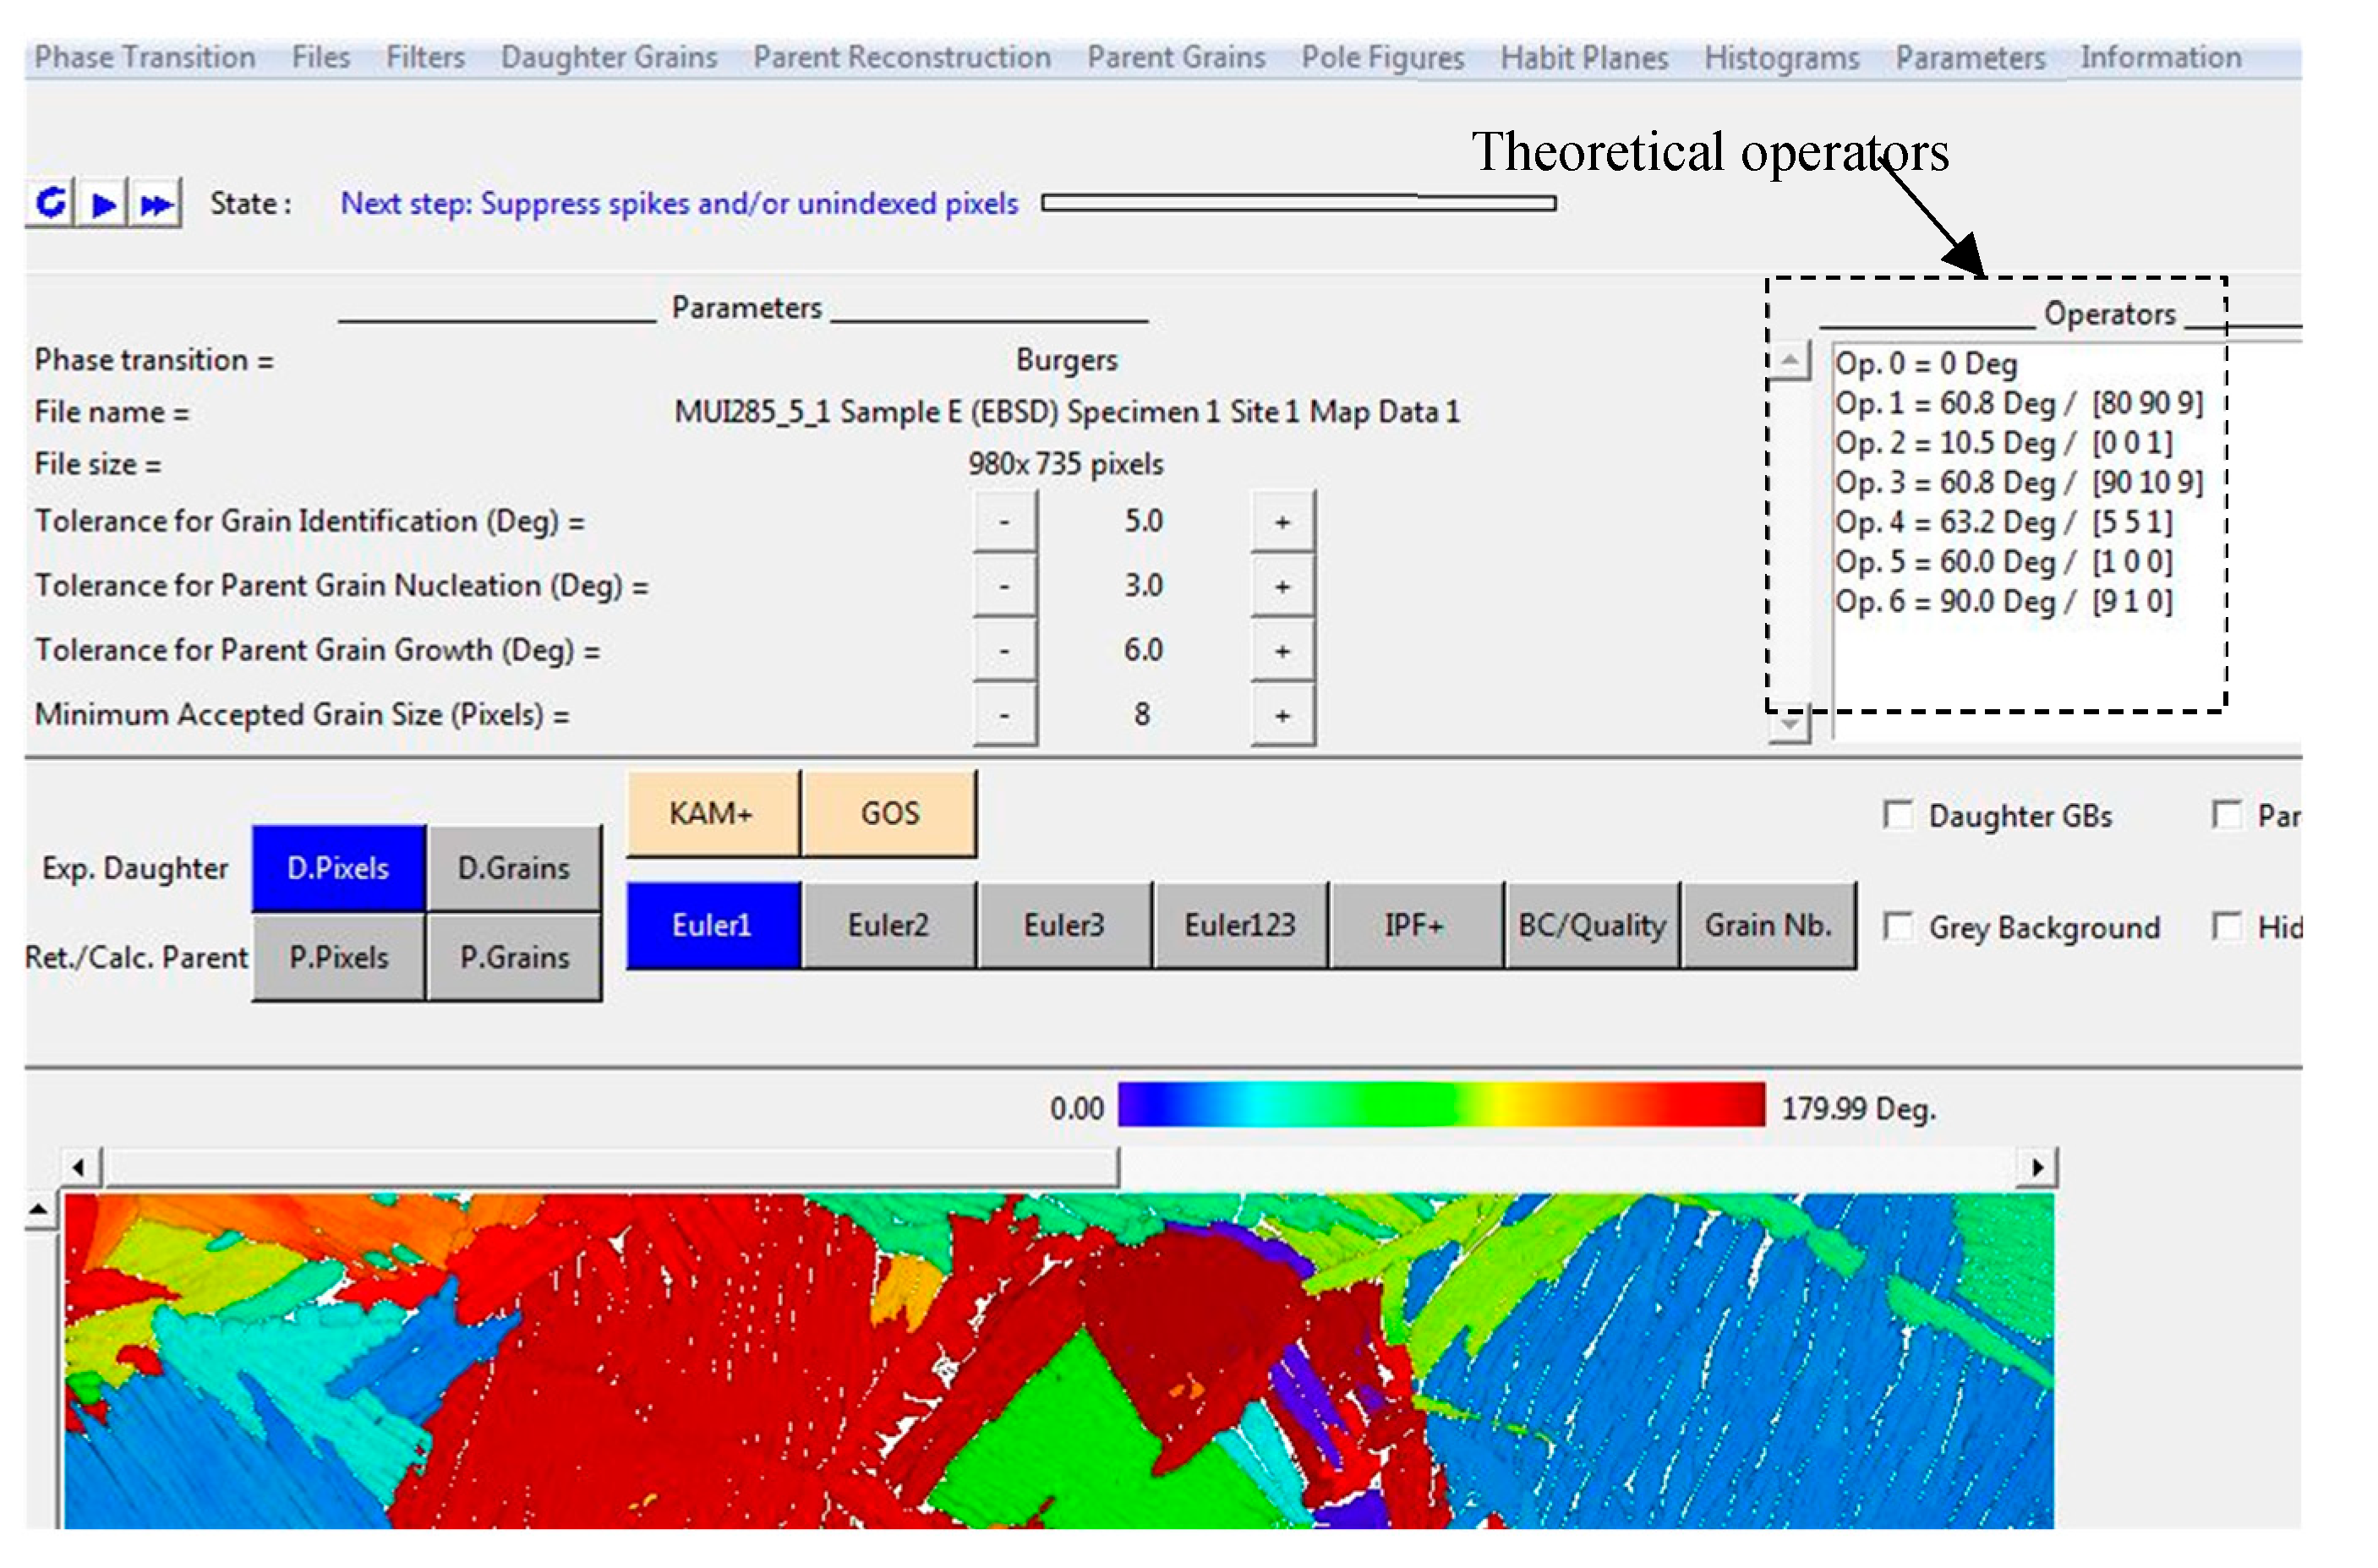
Figure 9. This is possibly due to restoration of the microstructure that took place after heat treatment and furnace cooling to room temperature. The orientation, texture and the statistics of α′/α-grains that could help understand the variant selection mechanism in the β→α transformation were determined after reconstruction of parent β-grains from EBSD data using ARPGE.
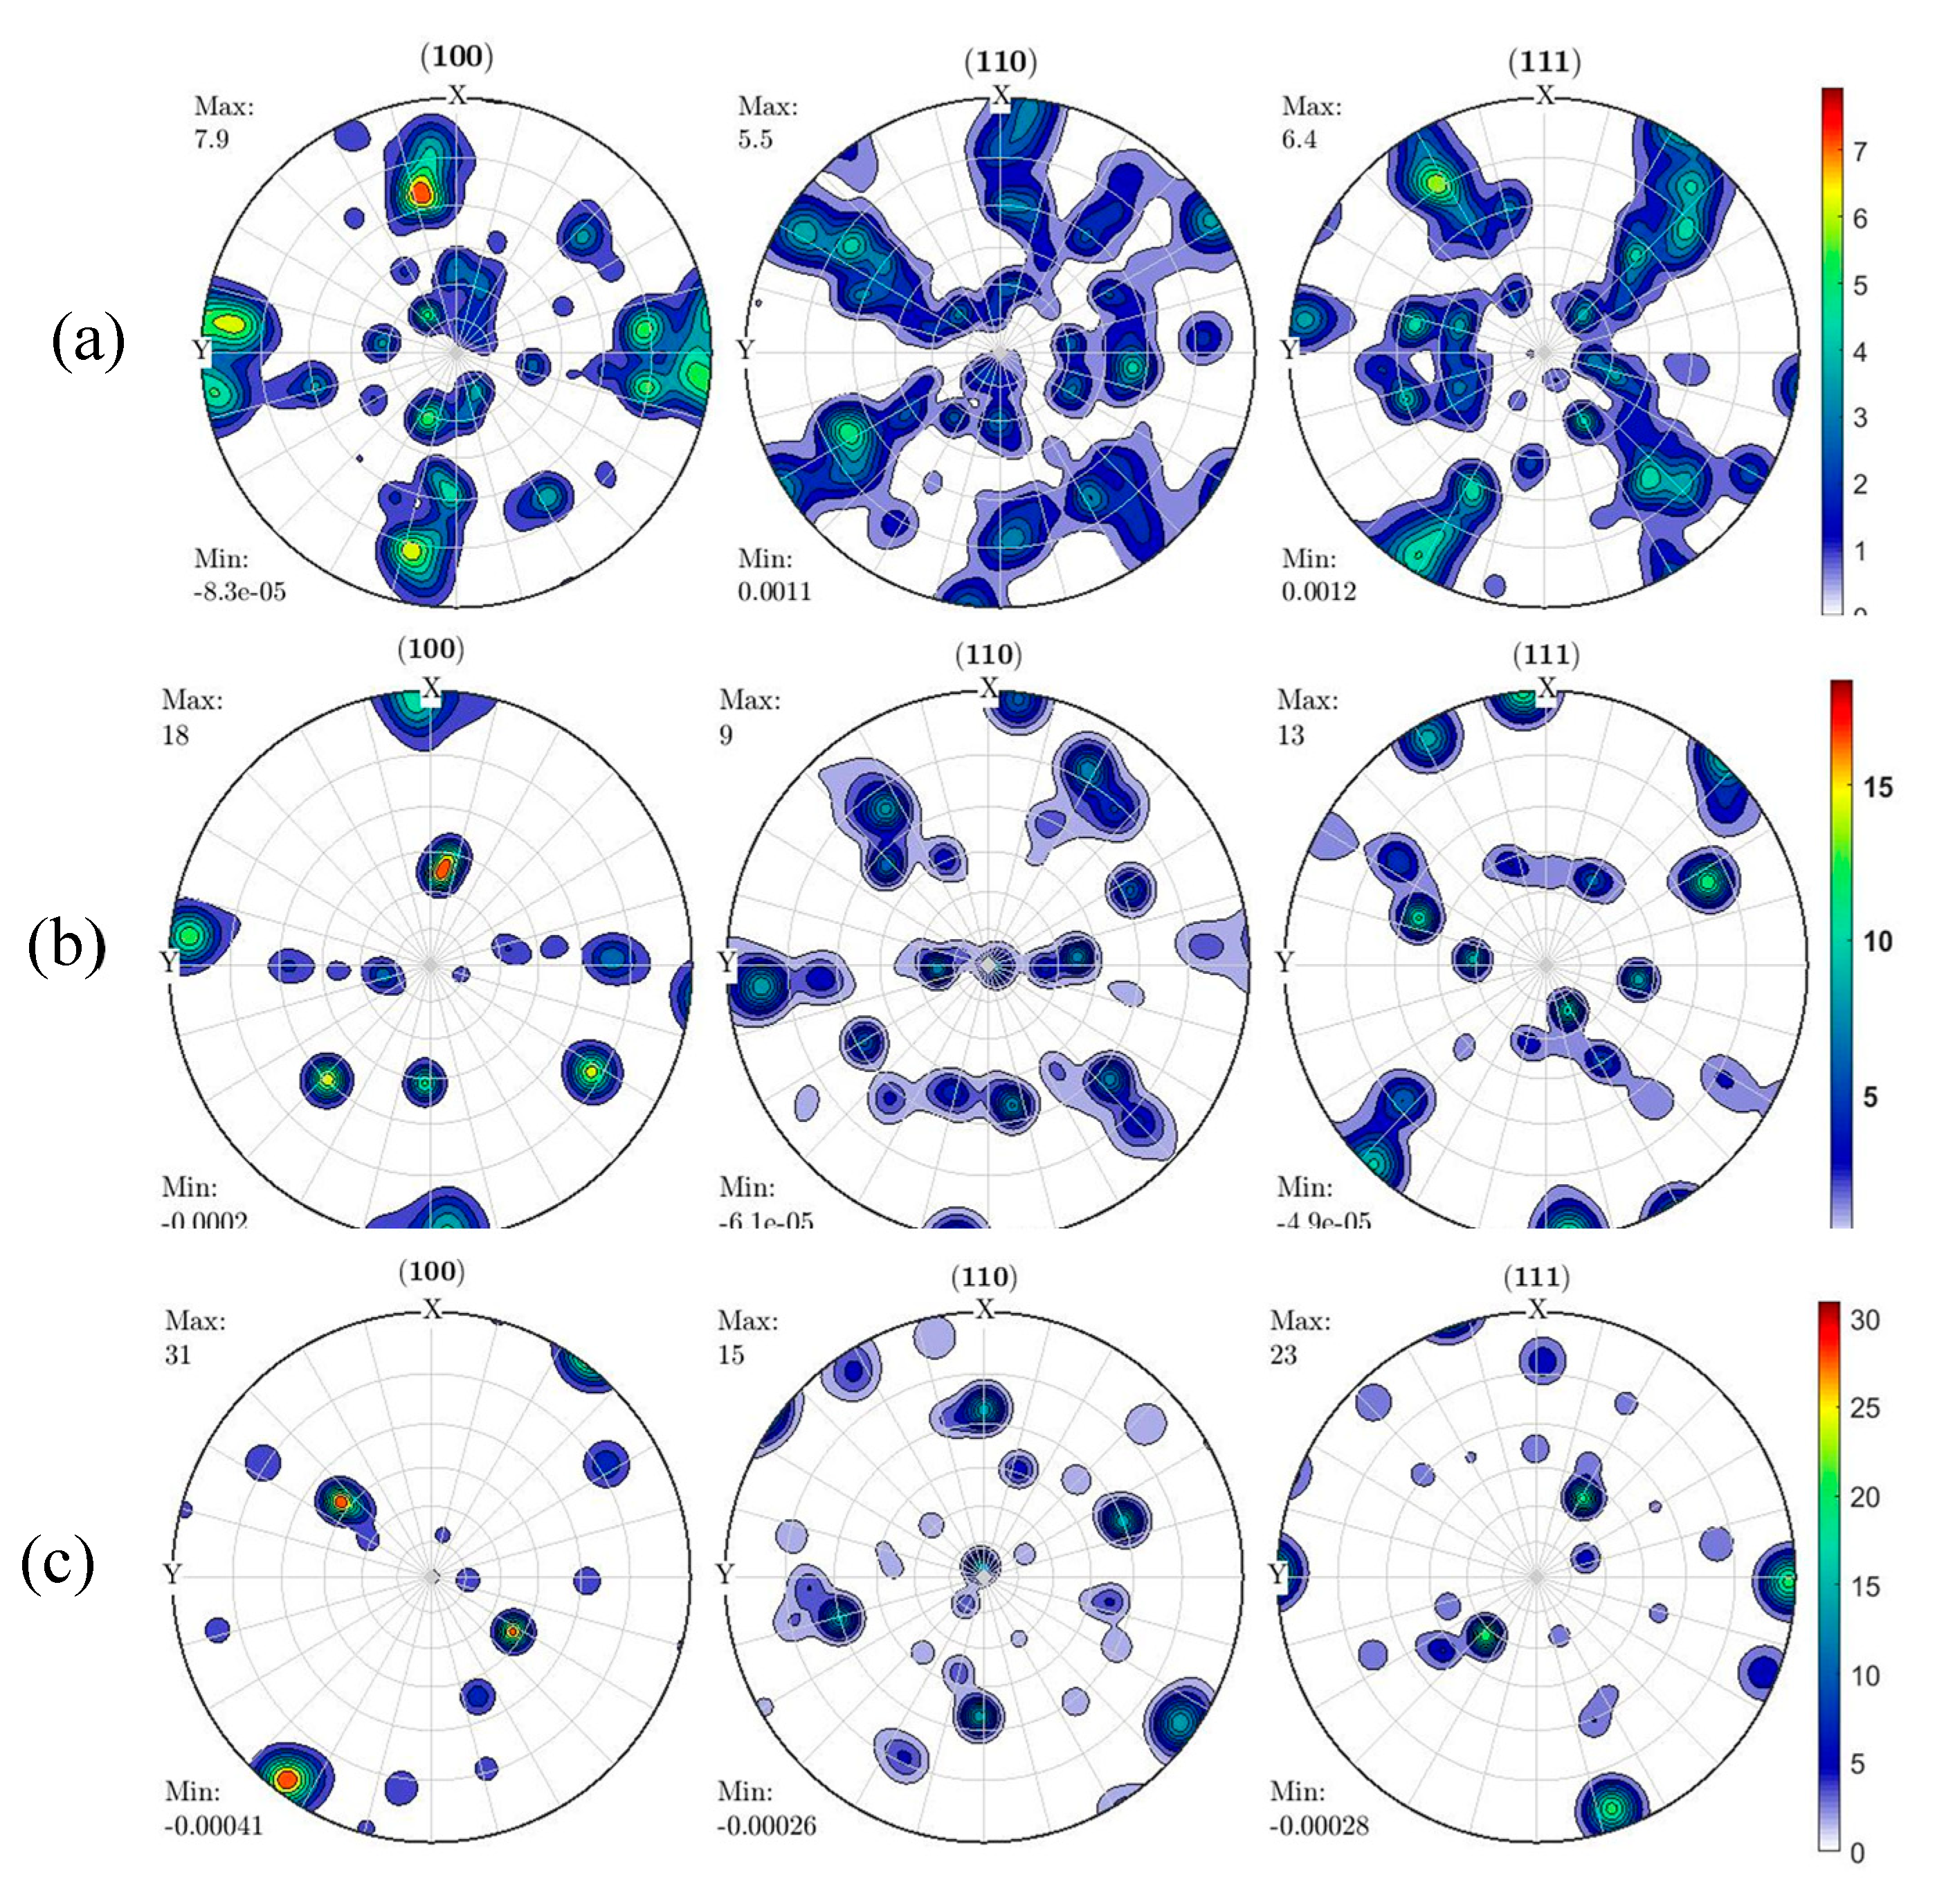
 Figure 10 and Figure 11 show the Euler orientation maps and pole figures of the reconstructed prior β-grains, respectively, from the EBSD data set of Figure 6b,d,f.
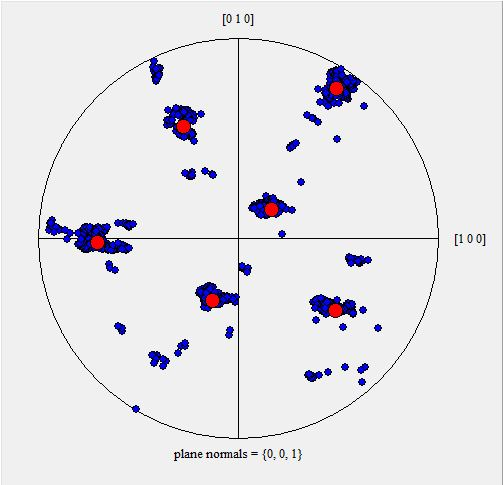
Pole analysis of samples A and B presented in Figure 11a,b, respectively, shows the (100) poles to be mainly concentrated in the X-build direction as the intensity of these planes is higher than the rest. The development of this typical fibrous texture of the β-grains with the ⟨ 100 ⟩ directions parallel or near parallel to the build direction has also been reported in the recent literature for Ti6Al4V AM material [24,25,26]. Grain re-orientation has been reported to occur during columnar growth of the β-phase, giving rise to a preferred ⟨ 100 β orientation aligned with the maximum thermal gradient [10,14,22].
For the DMLS process, the base plate and subsequent prior deposited layers act as heat sinks during deposition, while the laser beam provides the source of heat from above. Consequently, the maximum thermal gradient during the building process is along the build direction. While this elucidates the alignment of the fibrous texture in the build direction of the prior β-grains in DMLS parts, this fibrous texture disappeared in samples C. This was a result of decomposition of columnar prior β-grains upon heat treatment. However, these planes showed a stronger ⟨ 100 β texture with an intensity of about 31 in comparison to samples A and B with a texture intensity of 7.9 and 18, respectively. As seen in Figure 10, and for equal EBSD scan area, samples B and C contained fewer prior-β-grains in comparison to samples A, which is due to growth and lateral expansion of prior β-grains after heat treatment. This explains the stronger texture intensity in samples B and C in comparison to sample A. As seen in Figure 7, Figure 8, Figure 9 and Figure 10, the overall texture of transformed α′/α-grains were weaker than those of the β-grain texture. Undoubtedly, this suggests that there was variant selection during the β→α-grain transformation. Thus, the α-grain texture was diluted, as there are 12 possible variants that could possibly form from a single prior β-grain.
There are six β-grain poles for the β-phase, namely ( 110 ) β, ( 1 1 ¯ 0 ) β, ( 101 ) β, ( 10 1 ¯ ) β, ( 011 ) β, ( 0 1 ¯ 1 ) β, that share the Burgers orientation with α′/α-grains. Two ( 0001 )α poles among the 12 possibilities share a common { 110 } 
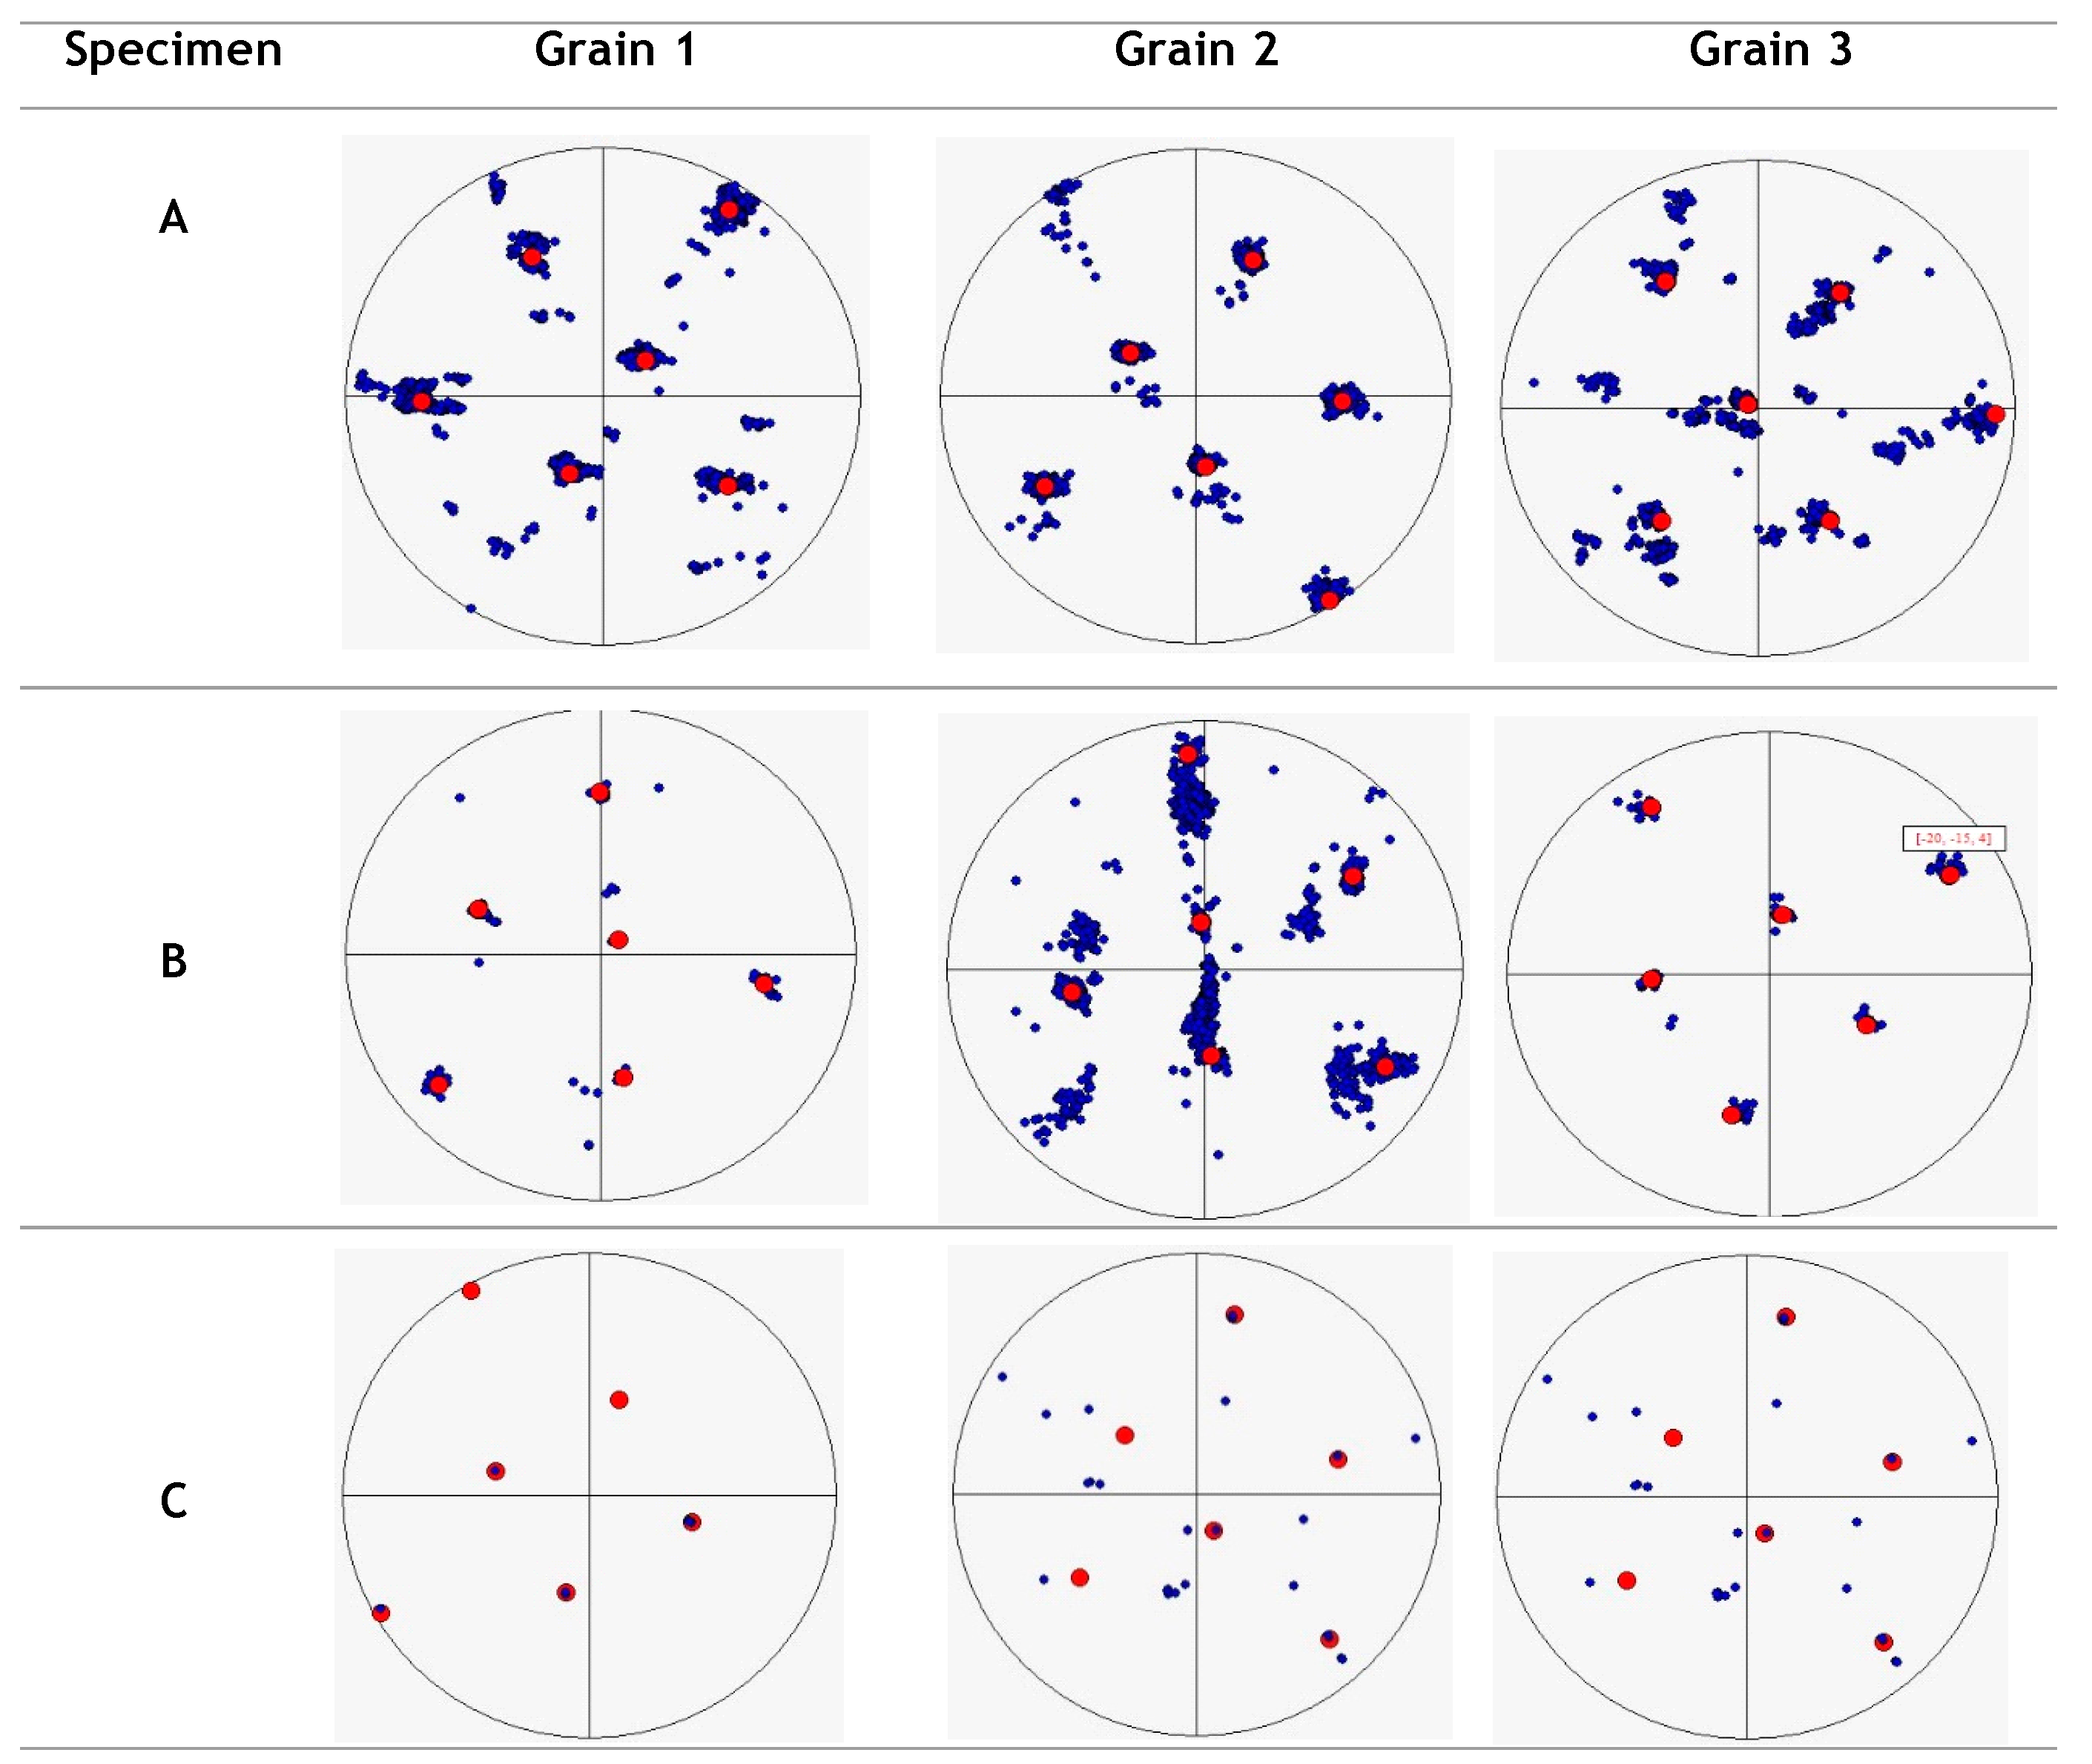
β pole. Therefore, six equivalent β-variants can be gathered from the defined α′/α variant orientations. The discrete pole figures of the α’/α and prior β-grains, and frequency distribution of α′/α-grain variants of at least three reconstructed parent grains labelled 1, 2 and 3 in Figure 10 were obtained for the three samples and are presented in Figure 12.
Analysis of these pole figures shows that even though the   ( 0001 )α poles are clustered around ( 110 ) β poles for samples A and B, there is a significant spread in the orientations in between for the two phases. Interestingly, the BOR orientation spread in samples C are reduced drastically, with the ( 0001 )α and ( 110 ) β poles being perfectly superimposed. This shows there is a deviation from the known BOR in samples A and B. Since the β→α-grain transformation is known to respect the BOR during α-phase precipitation, the observation made in Figure 12 could indicate that orientations were gradually distorted due the high cooling rate experienced in the DMLS process. The high cooling rate leads to accumulation of thermal residual stress and strain, which cause deformation and slight rotation of crystalline lattices due to lattice strain [24].
When the Ti6Al4V alloy is heat-treated near or above the α→β transformation temperature followed by a moderate to slow cooling rate, the microstructure is characterised by competitive growth of α-grains, and large percentages of secondary α Widmanstätten structure, as seen in Figure 6e,f. This type of structure accounts for homogenous orientations, and thus, together with the growth of α-grains, could explain how the cooling rate contributed to the high preferential nucleation of certain variants more than others, which consequently dominated the texture of the transformed microstructure.

4. Conclusions

The crystallographic texture of three different microstructures of DMLS produced Ti6Al4V (ELI) were analysed and discussed, and the following conclusions deduced:
  • Of all the planes of the α′/α-phase, the maximum values in MUD of the ( 0001 ) plane was highest for samples A and C, whereas in samples B it was the ( 11 2 ¯ 0 ) plane.
  • The α′ grain texture of the as-built parts was found to be weak (random) with the ( 0001 ) α plane showing the highest MUD of 4.9. Remarkable improvement of maximum intensity of the texture was noted after heat treatment with the texture of the ( 0001 ) α plane in MUD increasing to 8.8 and 24 in samples B and C, respectively.
  • The texture of (100)β planes of the reconstructed prior-β-grains was the highest among all different planes for the three different samples and the intensity in MUD increased from 7.9 in samples A after heat treatment to 18 and 31 in samples B and C, respectively.
  • Samples A and B showed a stronger fibrous texture of the reconstructed β-grains with the ⟨ 100 ⟩ directions almost parallel to the build direction. The alignment of the fibrous texture in the build direction disappeared after heat treatment above the α→β-grain transformation temperature (samples C).
  • Samples A, B and C were found to obey the well-known BOR. However, there was a significant spread between the   ( 0001 )α and ( 110 ) β orientations in samples A and B, while in samples C, the two phases were perfectly superimposed.

Author Contributions

Conceptualization, A.M., M.M., and W.d.P.; methodology, A.M.; formal analysis, A.M.; writing—original draft preparation, A.M.; writing—review and editing, A.M., M.M., W.d.P.; supervision, M.M., W.d.P.; funding acquisition, W.d.P. All authors have read and agreed to the published version of the manuscript.

Funding

This research was funded by the South African Department of Science and Innovation (DSI) through the Council for Scientific and Industrial Research (CSIR), for the Collaborative Program in Additive Manufacturing, Contract No.: CSIR -NLC-CPAM-18-MOA-CUT-01.

Acknowledgments

All the Ti6Al4V (ELI) specimens for analysis were produced by the Centre for Rapid Prototyping and Manufacturing (CRPM) of the Central University of Technology, Free State (CUT), for which the authors express their gratitude. The Centre for High Resolution Transmission Electron Microscopy (HRTEM) of Nelson Mandela University is also acknowledged for providing the SEM where the EBSD analyses were performed. Johan Westraadt of HRTEM is also acknowledged for assistance during the EBSD work.

Conflicts of Interest

The authors declare no conflict of interest.

References

  1. Thejane, K.; Chikosha, S.; du Preez, W.B. Characterisation and monitoring of TiAl4V (ELI) powder used in different selective laser melting systems. SAJIE 2017, 28, 161–171. [Google Scholar] [CrossRef] [Green Version]
  2. Mugwagwa, L.; Dimitrov, D.; Matope, S.; Venter, A.M. Residual stress distributions within components manufactured using selective laser melting. In Proceedings of the 18th Rapdasa Conference Proceedings, Durban, South African, 7–10 November 2017. [Google Scholar]
  3. Patterson, A.E.; Messimer, S.L.; Farrington, P.A. Overhanging features and the slm/dmls residual stresses problem: Review and future research need. Addit. Manuf. Technol. 2017, 5, 15. [Google Scholar] [CrossRef]
  4. Van Zyl, I.; Yadroitsava, I.; Yadroitsev, I. Residual stress in Ti6Al4V objects produced by direct metal laser sintering. SAJIE 2016, 27, 134–141. [Google Scholar] [CrossRef]
  5. Mierzejewska, Ż.A. Effects of laser energy density, internal porosity and heat treatments on mechanical behaviour of biomedical Ti6Al4V alloy obtained with DMLS technology. Materials 2019, 12, 2331. [Google Scholar] [CrossRef] [PubMed] [Green Version]
  6. Qian, M.; Xu, W.; Brandt, M.; Tang, H. Additive manufacturing and post processing of Ti6Al4V for superior mechanical properties. MRS Bull. 2019, 41, 775–784. [Google Scholar] [CrossRef] [Green Version]
  7. Suwas, S.; Ray, R.K. Crystallographic Texture of Materials; Springer: London, UK, 2014. [Google Scholar] [CrossRef]
  8. Donoghue, J.; Antonysamy, A.A.; Martina, F.; Colegrove, P.A.; Williams, S.W.; Prangnell, P.B. The effectiveness of combining rolling deformation with wire–arcadditive manufacture on β-grain refinement and texture modification in Ti-6Al-4V. Mater. Charact. 2016, 114, 103–114. [Google Scholar] [CrossRef]
  9. Thijs, L.; Verhaeghe, F.; Craeghns, T.; Humbeeck, J.V.; Kruth, J.-P. A study of the microstructural evolution during selective laser melting of Ti6Al4V. Acta Mater. 2010, 58, 3303–3312. [Google Scholar] [CrossRef]
  10. Simonelli, M.; Tse, Y.Y.; Tuck, C. On the texture formation of selective laser melted Ti-6Al-4V. Metall. Mater. Trans. A 2014, 45, 2863–2872. [Google Scholar] [CrossRef]
  11. Facchini, L.; Magalini, E.; Robotti, P.; Molinari, A.; Hoeges, S.; Wissenbach, K. Ductility of a Ti-6 Al-4 V alloy produced by selective laser melting of pre-alloyed powders. Rapid Prototyp. J. 2010, 16, 450–459. [Google Scholar] [CrossRef]
  12. Sercombe, T.; Jones, N.; Day, R.; Kop, A. Heat treatment of Ti-6Al-7Nb components produced by selective laser melting. Rapid Prototyp. J. 2008, 14, 300–304. [Google Scholar] [CrossRef]
  13. Burgers, W.G. On the process of transition of the cubic body centered modification into the hexagonal close packed modification of zirconium. Physica 1934, 1, 561–586. [Google Scholar] [CrossRef]
  14. Obasi, G.C.; Birosca, S.; Quinta da Fonseca, J.; Preuss, M. Effect of β grain growth on variant selection and texture memory effect during α→β→α phase transformation in Ti–6Al–4V. Acta Mater. 2012, 60, 1048–1058. [Google Scholar] [CrossRef]
  15. Romero, J.; Preuss, M.; Quinta, F.J. Texture memory and variant selection during phase transformation of a zirconium alloy. Acta Mater. 2009, 57, 5501–5511. [Google Scholar] [CrossRef]
  16. Gokuldoss, P.; Kolla, S.; Eckert, J. Additive manufacturing processes: Selective laser melting, electron beam melting and binder jetting-selection guidelines. Materials 2017, 10, 672. [Google Scholar] [CrossRef] [Green Version]
  17. Els, J. Optimal Process Parameters for Direct Metal Laser Sintering of Ti6Al4V for Medical Implant Production. Master’s Thesis, Department of Mechanical Engineering, Central University of Technology, Free State, South Africa, January 2016. [Google Scholar]
  18. Analox Sensor Technology. Available online: https://www.analoxsensortechnology.com/blog/2016/12/13/argon-used-3d-printing/ (accessed on 24 October 2019).
  19. Bauristhene, A.M.; Mutombo, K.; Stumpf, W.E. Alpha case formation mechanism in Ti6Al4V alloy investment castings using YFSZ shell moulds. SAIMM 2013, 113, 357–361. [Google Scholar]
  20. Oxford Instruments, EBSD. Available online: http://www.ebsd.com/ebsd-explained/calibrating-an-ebsd-system (accessed on 3 May 2019).
  21. Cayron, C. ARPGE: A computer program to automatically reconstruct the parent grains from electron backscatter diffraction dat. J. Appl. Cryst. 2007, 40, 1183–1188. [Google Scholar] [CrossRef] [Green Version]
  22. Wang, Y.; Fraser, H.; Dixit, V.; Shi, R. Variant selection of grain boundary α by special prior β grain boundaries in titanium alloys. Acta Mater. 2014, 75, 156–166. [Google Scholar]
  23. Stefansson, N.; Semiatin, S.; Eylon, D. The kinetics of static globularization of Ti-6Al-4V. Metall. Mater. Trans. A 2002, 33, 3527–3534. [Google Scholar] [CrossRef]
  24. Charlotte, A.; Sébastien, M.; Rigo, O.; Germain, L.; Stéphane, G. Electron beam melted Ti6Al4V: Microstructure, texture and mechanical behaviour of the as-built and heat-treated material. Mater. Sci. Eng. A 2016, 652, 105–119. [Google Scholar] [CrossRef]
  25. Zhao, Z.; Chen, J.; Lu, X.; Tan, H.; Lin, X.; Huang, W. Formation mechanism of the α variants and its influence on the tensile properties of laser solid formed Ti6Al4V titanium alloy. Mater. Sci. Eng. A 2017, 691, 16–24. [Google Scholar] [CrossRef]
  26. Beladi, H.; Chao, Q.; Gregory, S. Variant selection and intervariant crystallographic planes distribution in martensite in a Ti6Al4V alloy. Acta Mater. 2014, 80, 478–489. [Google Scholar] [CrossRef]
Figure 1. Schematic illustration of the BOR between the β (bcc) and α (hcp) phases in Ti6Al4V [14].
Crystals 10 00699 g001
Figure 2. The Ti6Al4V phase transformation diagram, resultant phases and typical morphology of microstructures formed after water quenching and air cooling.
Crystals 10 00699 g002
Figure 3. The heat treatment cycles 1 and 2 applied to some of the as-built DMLS Ti6Al4V (ELI) samples.
Crystals 10 00699 g003
Figure 4. Typical ARPGE program main menu with set parameters for reconstruction of prior β-grains in Ti6Al4V (ELI).
Crystals 10 00699 g004
Figure 5. The EBSD phase maps showing the typical α and β-phase distributions and percentage fraction in (a) samples A, (b) samples B, and (c) samples C.
Crystals 10 00699 g005
Figure 6. The (a,c,e) optical image and (b,d,f) Euler orientation maps of (a,b) samples A, (c,d) samples B, and (e,f) samples C, respectively, while (g) is the α- hcp principle planes and their depiction in IPF key.
Crystals 10 00699 g006
Figure 7. The ( 10 1 ¯ 0 ) ,   ( 01 1 ¯ 0 ) ,   ( 0001 ) ,   ( 11 2 ¯ 0 ) ,   ( 01 1 ¯ 1 ) ,   ( 10 1 ¯ 1 ) and ( 11 2 ¯ 1 ) PFs of the α-phase for samples A.
Crystals 10 00699 g007
Figure 8. The ( 10 1 ¯ 0 ) ,   ( 01 1 ¯ 0 ) ,   ( 0001 ) ,   ( 11 2 ¯ 0 ) ,   ( 01 1 ¯ 1 ) ,   ( 10 1 ¯ 1 ) and ( 11 2 ¯ 1 ) PFs of the α-phase for samples B.
Crystals 10 00699 g008
Figure 9. The ( 10 1 ¯ 0 ) ,   ( 01 1 ¯ 0 ) ,   ( 0001 ) ,   ( 11 2 ¯ 0 ) ,   ( 01 1 ¯ 1 ) ,   ( 10 1 ¯ 1 )   and ( 11 2 ¯ 1 ) PFs of the α-phase for samples C.
Crystals 10 00699 g009
Figure 10. Orientation maps of reconstructed β-phase of (a) samples A, (b) samples B, and (c) samples C, while (d) is the IPF key for β-bcc principle planes. The black arrows indicate the build direction.
Crystals 10 00699 g010
Figure 11. The (100), (110), and (111) pole figures of the reconstructed β-phase of (a) samples A, (b) samples B, and (c) samples C.
Crystals 10 00699 g011
Figure 12. Superimposed discrete pole figures of (110) poles of reconstructed β-grains (the red dots) and the (0001) poles of clustering α/α′ lathes (the blue dots) for samples A, B and C.
Crystals 10 00699 g012
Table 1. DMLS process parameters.
Process ParameterValue
Laser power setting175 W
Laser diameter80 μm
Hatch spacing100 μm
Layer thickness30 μm
Scanning speed1400 mm/s
Table 2. SEM settings used for EBSD data acquisition.
VariableValue
Spot size3–5 μm
Accelerating voltage 15 kV
Working distance14 mm
Magnification 200X
Sampling Grid (X, Y)980, 755
Step Size0.5 μm
Table 3. A summary of the max-MUD densities of different planes for samples A, B and C.
Plane ( 10 1 ¯ 0 ) ( 01 1 ¯ 0 ) ( 0001 ) ( 11 2 ¯ 0 ) ( 01 1 ¯ 1 ) ( 10 1 ¯ 1 ) ( 11 2 ¯ 1 )
SamplesMax-MUD
A2.52.54.93.52.92.92.1
B4.04.08.810.04.24.22.7
C8.48.424.012.06.46.46.0

