Article

Chemical Vapor Deposition of IrTe2 Thin Films

1
CAS Key Laboratory of Standardization and Measurement for Nanotechnology, CAS Center for Excellence in Nanoscience, National Center for Nanoscience and Technology, Beijing 100190, China
2
School of Nanoscience and Technology, University of Chinese Academy of Sciences, Beijing 100049, China
*
Authors to whom correspondence should be addressed.
Crystals 2020, 10(7), 575; https://doi.org/10.3390/cryst10070575
Submission received: 23 May 2020 / Revised: 21 June 2020 / Accepted: 2 July 2020 / Published: 3 July 2020

Abstract

:
Two-dimensional (2D) IrTe2 has a profound charge ordering and superconducting state, which is related to its thickness and doping. Here, we report the chemical vapor deposition (CVD) of IrTe2 films using different Ir precursors on different substrates. The Ir(acac)3 precursor and hexagonal boron nitride (h-BN) substrate is found to yield a higher quality of polycrystalline IrTe2 films. Temperature-dependent Raman spectroscopic characterization has shown the q1/8 phase to HT phase at ~250 K in the as-grown IrTe2 films on h-BN. Electrical measurement has shown the HT phase to q1/5 phase at around 220 K.

1. Introduction

IrTe2 has attracted much interest for its intriguing properties such as structure phase transitions, charge density wave (CDW) ordering and superconductivity arising from the strong spin-orbit coupling (SOC) [1,2,3,4,5,6]. With these unique properties, IrTe2 can be used in memory, oscillator, superconductor devices [7,8,9], etc.
IrTe2 has a layered hexagonal structure and each layer is a sandwich-like structure with three layers of Te-Ir-Te atoms. At room temperature, IrTe2 has a trigonal phase (high temperature phase, HT), in which each iridium atom is coordinated with six tellurium atoms, forming edge-shared IrTe6 octahedrons [10]. As the temperature lowers to about 280 K, the crystal structure changes from the trigonal phase to the monoclinic phase. In the monoclinic phase, charge ordering is formed due to the charge transfer from Ir 5d to Te 5p, forming Ir4+-Ir4+ dimers. This dimerization suppresses the structure of the IrTe6 octahedron. This monoclinic phase is also called the q1/5 phase, in which Ir3+ gives an electron to Te23-, forming the periodic structure of the 33344 (3 refers to Ir3+, 4 refers to Ir4+) arrangement of Ir atoms (Figure 1b) with the modulation vector q = ( 1 / 5 ,   0 , 1 / 5 ) (Figure 1e). As temperature further lowers down to 180 K, the periodic structure of 34433344 forms, i.e., the q1/8 phase with the modulation vector q = ( 1 / 8 ,   0 , 1 / 8 ) appears (Figure 1c,f) [11]. In the warming process, IrTe2 changes from the q1/8 phase to the HT phase directly without an intermediate q1/5 phase, which is due to the extra pinning energy that existed in the q1/8 phase. Phase transition is accompanied by a change of resistance and magnetic susceptibility, which is of great research interest [12].
Additionally, IrTe2 has a metastable superconducting state. In IrTe2, the striped charge order competes with the superconducting state [13]. The phase transition from the HT phase to the striped charge-ordered phase of IrTe2 would be suppressed as the sample thickness decreases, which is favorable for the appearance of the hexagonal superconductive phase [14]. Besides, Pt or Pd doping can also suppress the charge order phase, making the superconductive phase appear [15]. IrTe2 is diamagnetic, which is anormal for metallic compounds. This is because that the valence state of Ir3+ can form more closed shells. When T < Tc (CDW transition temperature, ~280 K), diamagnetism is further strengthened because the density of state near EF decreases, reducing the Pauli paramagnetism [16,17].
Growth of IrTe2 single crystals is reported using the chemical vapor transport (CVT) [10] and self-flux technique [13,16,18]. Mechanical exfoliation is further used to obtain nanometer thick IrTe2 [14]. Mechanical exfoliation is of low yield and poor reproducibility. CVD can grow large-area 2D materials with high uniformity. Graphene and transition metal chalcogenides (TMDs) have been grown by CVD [19,20,21,22,23,24], showing excellent physical properties similar to those obtained from mechanical exfoliation.
Here in this work, we have successfully synthesized the IrTe2 thin films using the CVD method. Different Ir precursors (including Ir(acac)3, IrCl3 and Ir) and different substrates (including h-BN, SiO2/Si, mica and sapphire) have been investigated. At optimized conditions, polycrystalline IrTe2 films with thickness of ~20 nm and domain size of ~200 nm have been obtained on h-BN. Temperature-dependent Raman spectroscopic characterization demonstrated the transition from the q1/8 phase to the HT phase at ~250 K. Electrical measurement has also shown the phase transition from the HT phase to the q1/5 phase at around 220 K.

2. Materials and Methods

2.1. Materials

IrCI3 (99.99%) and Te (99.999%) were purchased from Beijing Inokai Technology Co., Ltd., Beijing, China. Ir(acac)3 (≥97%) was purchased from Shanghai Aladdin Biochemical Technology Co., Ltd., Shanghai, China. Ir (99.95%) was purchased from Beijing Zhongnuo New Material Technology Co., Ltd., Beijing, China. All the starting materials were analytical grade and were used without further purification.

2.2. CVD Growth of IrTe2 Films

Hexagonal-BN (h-BN) crystalline powders (PT110, Momentive) were mechanically exfoliated on SiO2/Si wafers to prepare h-BN flakes. The h-BN flakes on SiO2/Si were annealed at 500 °C for 1–2 h in air to remove the possible polymer residues. Sapphire flakes were annealed at 1000 °C for 1–2 h. Mica flakes were freshly peeled before usage.

2.2.1. IrTe2 Growth Using Ir(acac)3 Precursor

An alumina boat containing Ir(acac)3 precursors (10–20 mg) was put outside of the furnace and heated to 170 °C. Another alumina boat containing Te (~20 g) powder was placed in the upstream of the furnace at a temperature of ~500 °C. Substrates were placed in the center of the furnace with a temperature of 700 °C. 20 SCCM Ar and 20 SCCM H2 was used as the carrier gas and the total pressure was maintained at ~5 kPa. The experimental conditions including reaction time, reaction temperature, Ir precursor heating temperature, flux rate and proportion of carrier gas were optimized for growth.

2.2.2. IrTe2 Growth Using IrCl3 Precursor

An alumina boat containing Te (about 4 g) was put in the first temperature zone of the two-temperature-zone furnace at 500 °C. Another alumina boat containing SiO2/Si substrates with IrCI3 was placed in the second temperature zone at a temperature of 700 °C (Figure S3a). 100 SCCM Ar and 20 SCCM H2 was used as the carrier gas and the total pressure was maintained at atmospheric pressure.

2.2.3. IrTe2 Growth Using Element Ir as the Precursor

Metal iridium films of about 20 nm thickness on SiO2/Si wafers were deposited by the vacuum-evaporating method. An alumina boat containing Te (about 4 g) was put in the first temperature zone of the two-temperature-zone furnace at 500 °C. Another alumina boat containing substrates was placed in the second temperature zone at a temperature of 800 °C (Figure S3b). 100 SCCM Ar and 20 SCCM H2 was used as the carrier gas and the total pressure was maintained at atmospheric pressure.

2.3. Characterization

Scanning Electron Microscopic (SEM) images were taken on a Hitachi S4800. AFM images were captured on a veeco M-Pico microscope. Raman spectra were measured on a home-built vacuum, variable temperature, low-wavenumber Raman system with 532 nm excitation. An attoDry 800 optical stat (attocube systems AG, Germany) was used for sample cooling. A NA = 0.82 low temperature objective (LT-APO/VIS/0.82, attocube systems AG, Germany) was used for laser focusing and signal collection. In the electrical measurement, IrTe2/h-BN flakes were transferred on a new SiO2/Si substrate using a PDMS stamp and then a copper TEM grid was used as a shadow mask for the metal contact evaporation. A total of 5 nm Ti and 50 nm Au was electron-beam evaporated for contacts. Low temperature resistance measurements were performed in a physical property measurement system (PPMS, Quantum Design, Inc., San Diego, CA, USA) under He-purged conditions.

3. Results and Discussion

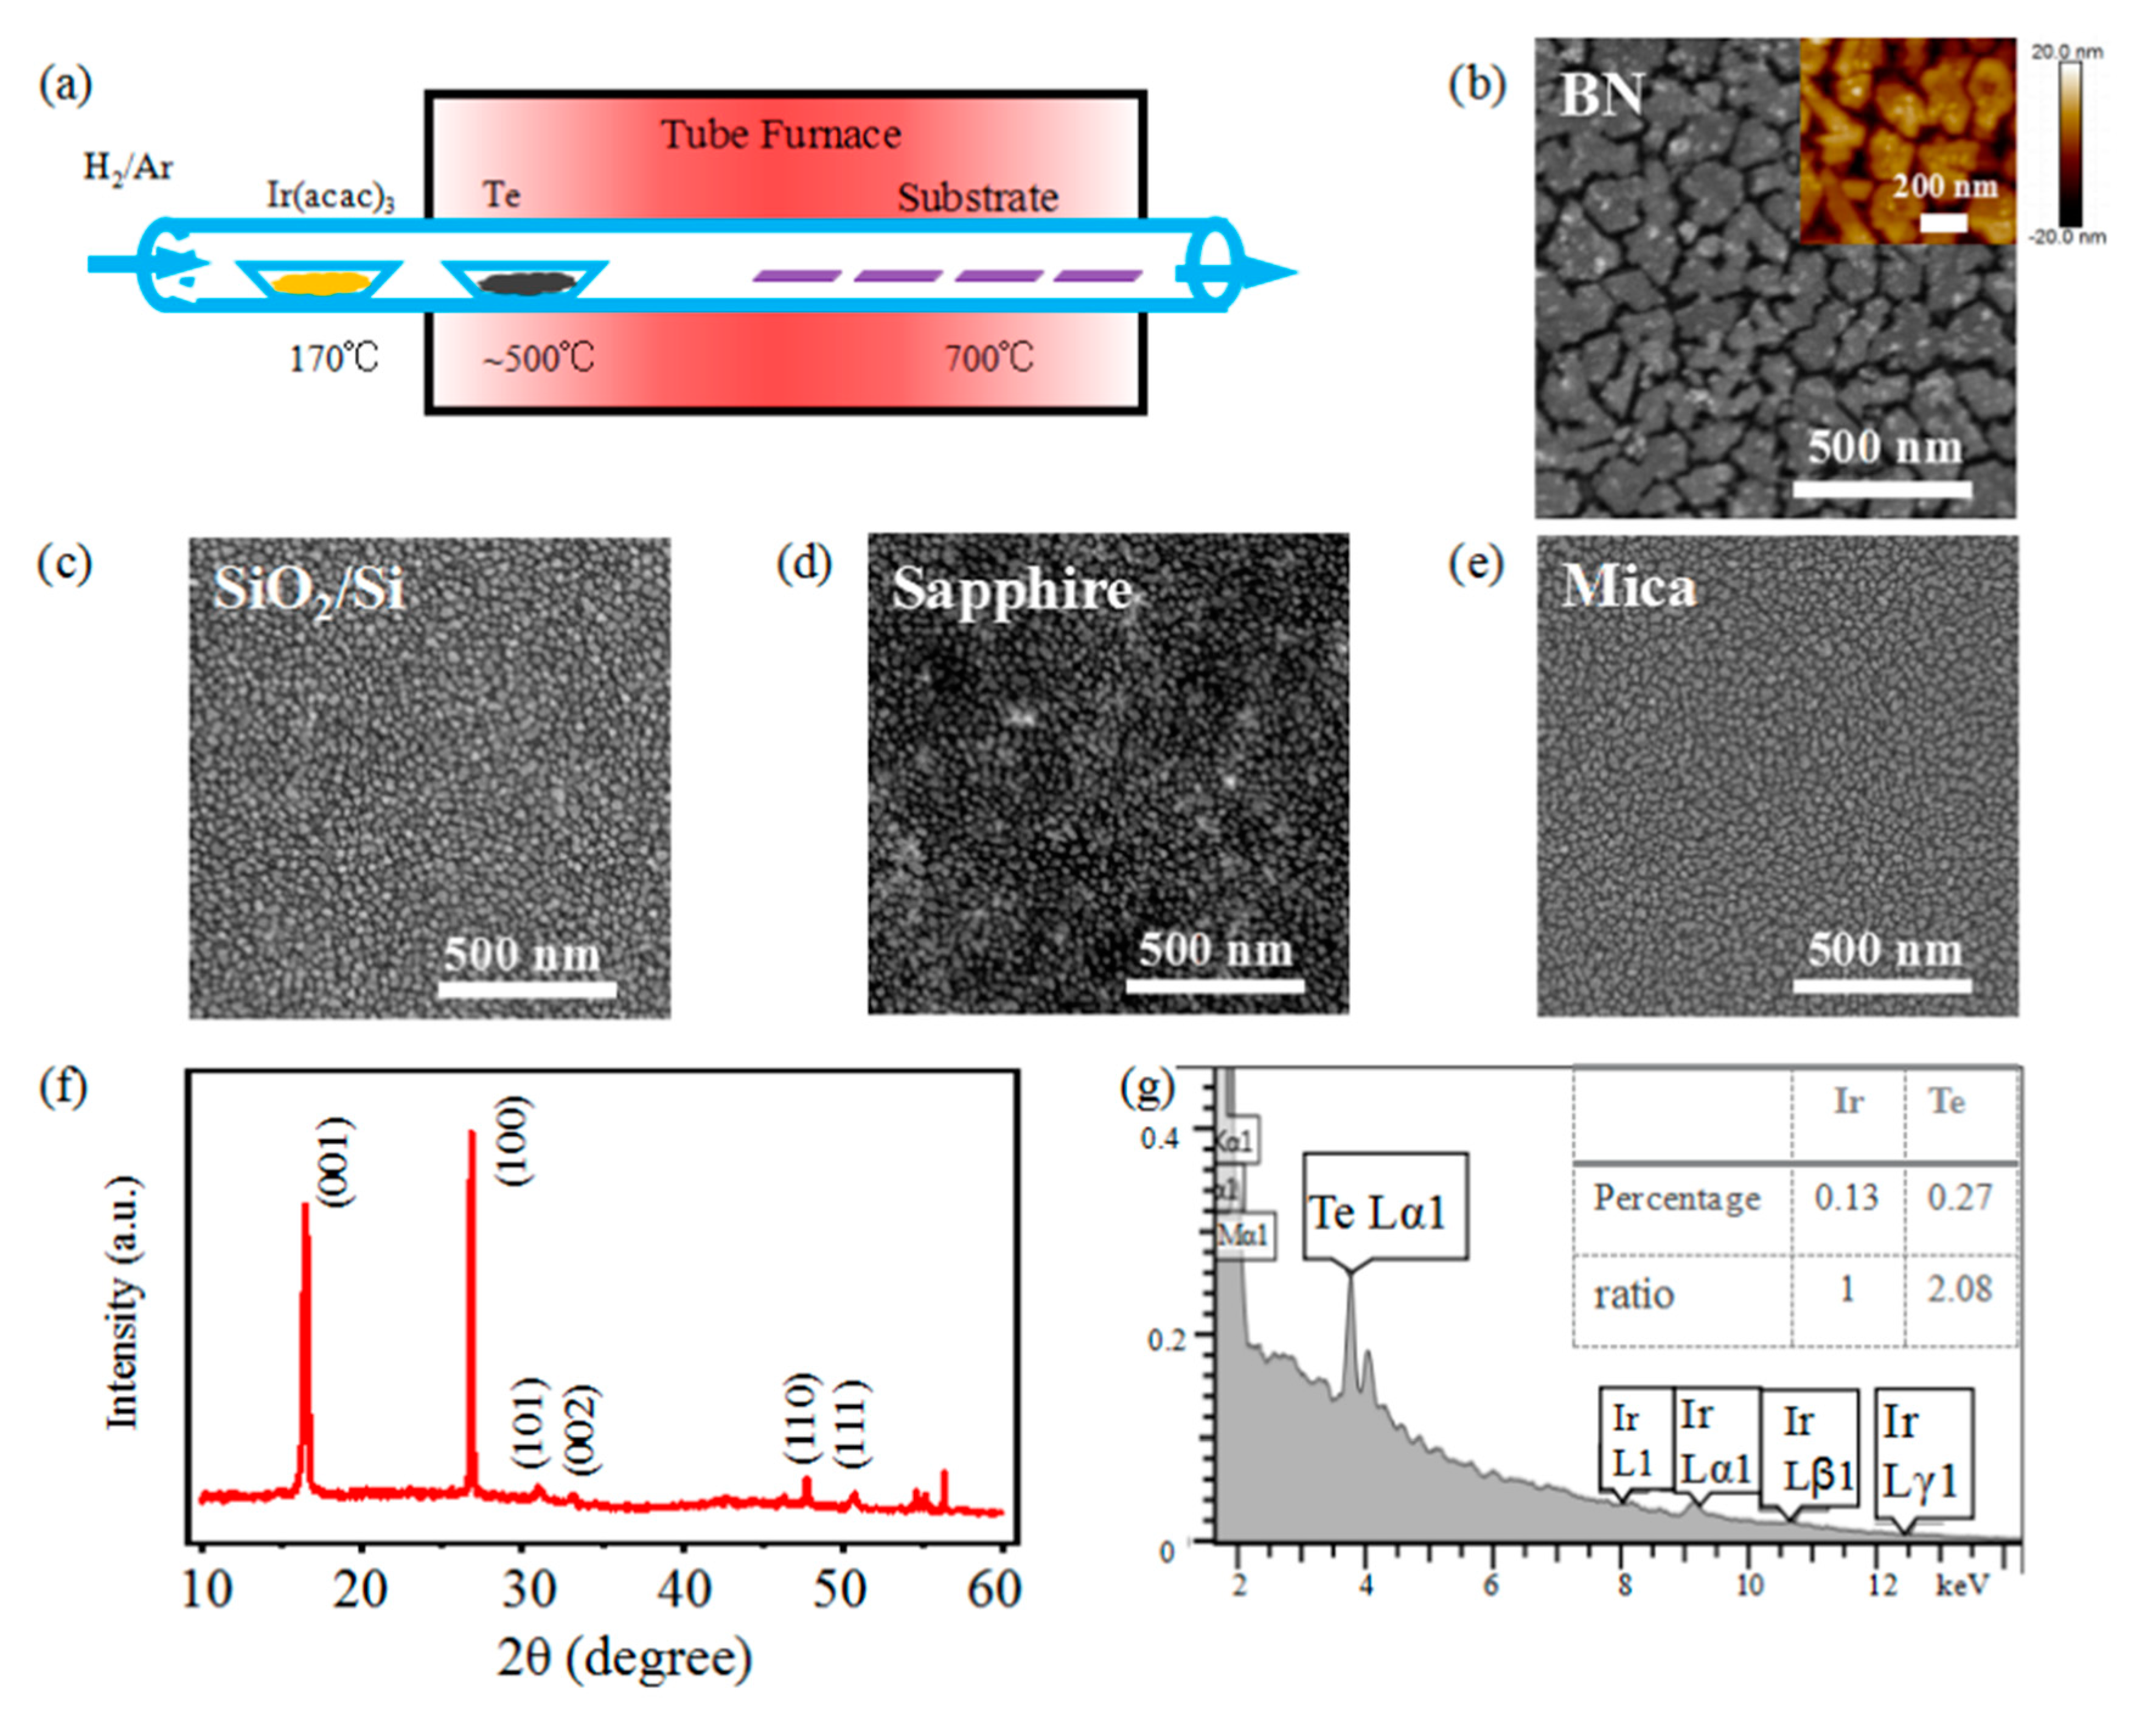
The CVD setup for IrTe2 growth using Ir(acac)3 as precursor is shown in Figure 2a. Figure 2b–e show the SEM images of as-grown IrTe2 films on h-BN, SiO2/Si, sapphire and mica substrates. The domain size of IrTe2 films grown in h-BN substrate is about ~200 nm, which is larger than that on other substrates. This is because the atomic smoothness and free dangling of bonds of the h-BN surface minimized the nucleation sites and promoted in-plane epitaxy of IrTe2 flakes [21,25,26]. However, SiO2/Si, sapphire and mica lack this advantage, and only smaller crystal domains were obtained on these substrates. Moreover, the as-grown IrTe2 films using Ir(acac)3 as precursor showed a larger grain size and a thinner thickness (~20 nm, inset of Figure 2b) than using inorganic precursors (IrCI3, Ir) (Figure 3). The Eg mode at ~128 cm−1 and A1g mode at ~165 cm−1 are observed from all as-grown IrTe2 films (Figure 3c).
The X-Ray Diffraction (XRD) peaks of as-grown IrTe2 film on h-BN are shown in Figure 2f. The diffraction peaks at 2θ of 16.4°, 26.8°, 31.0°, 33.18°, 48.0°, 50.8° can be assigned to (001), (100), (101), (002), (110), (111) crystal planes (Figure S4), respectively, which is consistent with the trigonal structure of IrTe2 [27]. The Energy Dispersive Spectrum (EDS) measurement revealed a Te/Ir ratio of 2.08 in the as-grown IrTe2 film (Figure 2g), close to the ideal ratio of 2.
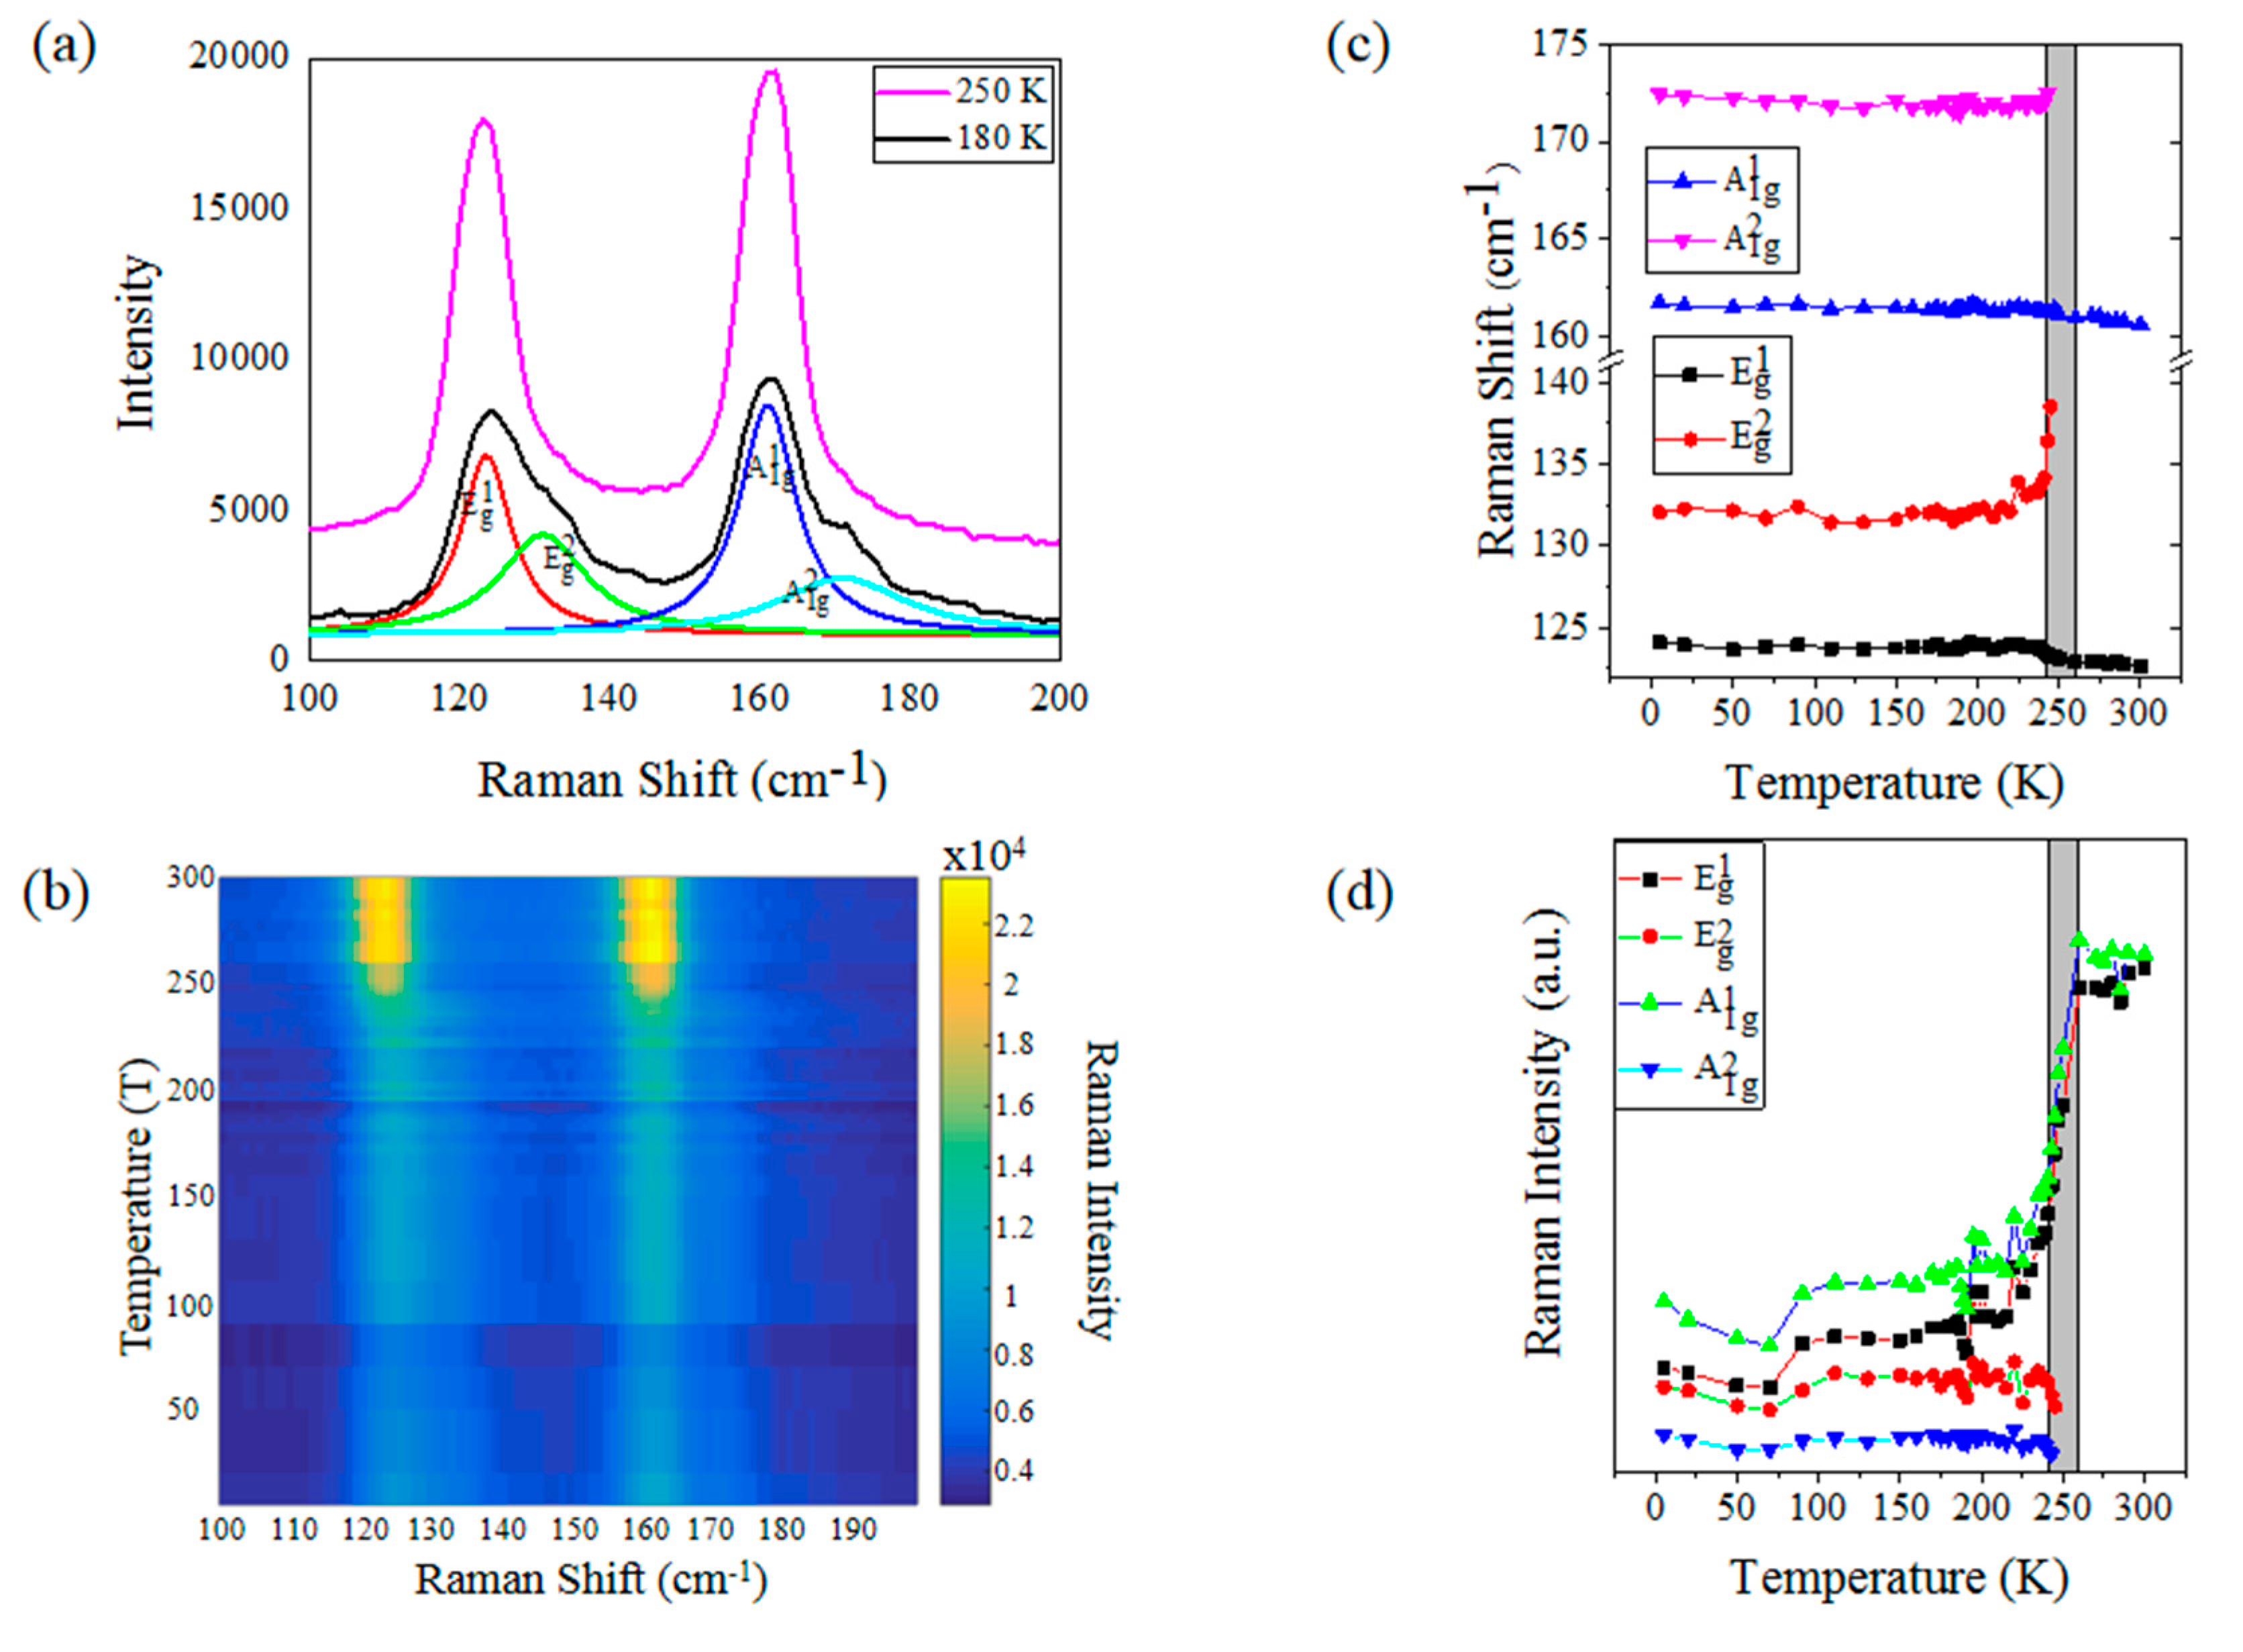
Temperature-dependent Raman spectroscopic characterization was carried out to study the phase transitions in the as-grown IrTe2 films on h-BN. At room temperature, IrTe2 has a trigonal symmetry, and there are two characteristic Raman peaks: Eg (~128 cm−1) and A1g (~165 cm−1) [28]. As shown in Figure S5, Eg and A1g modes refer to the intralayer and interlayer vibration of Te atoms, respectively.
Figure 4b shows the 2D Raman image of as-grown IrTe2 film on h-BN in the temperature range of 4~300 K. The fitted peak position and intensity of Eg and A1g modes are shown in Figure 4c,d. At low temperatures, the crystal structure of IrTe2 is monoclinic, and Eg splits to two peaks: E g 1 (~124 cm−1), E g 2 (~132 cm−1) and A 1 g splits to A 1 g 1 (~161 cm−1), A 1 g 2 (~172 cm−1) (Figure 4a) due to the symmetry breaking. As the temperature increased up to 250 K, both Eg and A1g modes showed a single Lorentzian peak (Figure 4a). Moreover, the splitting of Eg and A1g modes can only be observed when T < ~250 K, so the phase transition temperature should be at about 250 K (Figure S6), which is consistent to that in previous literature [29]. In addition, the Raman peak positions of Eg and A1g shifted to lower frequency at ~123 cm−1 and ~161 cm−1, respectively. In addition, the intensity of A1g and Eg modes increased significantly (Figure 4d). This is because of the strengthening of Te-Te and hence increase of electronic polarizability at high temperatures [28]. We did not observe the Raman feature change in the warming process at about 180 K for the phase transition from q1/8 to q1/5 phase. This phase transition is also not expected in the warming process because of the high pinning energy of the q1/8 phase [10].
The q1/8 to HT phase-transition temperature in the as-grown IrTe2 film (~250 K) is lower than that in the literature (280 K) [28]. This may be due to the fact that the crystal domain in our samples is smaller than that in the literature, which affects the phase transition from the q1/8 phase to the HT phase. We also collected the temperature-dependent Raman Spectra of as-grown IrTe2 film on SiO2/Si, and no Raman change was observed as temperature increased from 4 K to 300 K, which may be due to the much lower quality of the IrTe2 thin film grown on SiO2/Si (Figure S7).
A two-terminal device was fabricated to measure the electric property of as-grown IrTe2 films on h-BN (Figure 5a). As shown in Figure 5b, the electrical measurement result shows that the resistance of the as-grown IrTe2 thin film decreased in the cooling process from 300 K to 225 K, and was stable at 225 K. Then as the temperature lowers further, the R increased from 210 K to 150 K. When the temperature reached 150 K, the resistance reached a peak value, and then decreased for T < 150 K. There was no obvious phase transition from temperature resistance measurement for the as-grown IrTe2 thin film on SiO2/Si (Figure S8), which may due to the much lower quality of IrTe2 crystal grown on SiO2/Si.
The resistance increase from 210 K to 150 K is correlated to the HT phase to q1/5 phase transition [12]. In the q1/5 phase, Ir4+ forms the local spin-orbit Mott state, increasing the gap of the Hubbard gap. The DOS (Density of States) at EF of the q1/5 phase is lower than that of the HT phase due to the break of the Te23− polymeric bond [30]. Then, the resistance of the q1/5 phase is higher than that of the HT phase. The q1/5 to q1/8 phase transition expected at around 180 K was not observed. This may be due to defects and impurities in polycrystalline IrTe2 film, which can inhibit the phase transition.

4. Conclusions

In this paper, we report CVD growth of IrTe2 thin films. At optimized conditions, poly crystalline IrTe2 films with a thickness of ~20 nm and domain size of ~200 nm have been obtained on h-BN using Ir(acac)3 as the precursor. Temperature-dependent Raman spectroscopic characterization has shown the q1/8 phase to HT phase at ~250 K (warming process), and electrical measurement has shown the HT phase to q1/5 phase at around 220 K (cooling process). The phase transition temperature of as-grown IrTe2 thin films is slightly lower than that in the literature for the bulk materials (280 K) [28].

Supplementary Materials

The following are available online at https://www.mdpi.com/2073-4352/10/7/575/s1, Figure S1: Vapor pressure of iridium (III) acetylacetonate in 140–210 °C, Figure S2: Vapor pressure of Te in 360–540 °C, Figure S3: Illustration of growth setups for the growth of IrTe2 films using IrCI3 and Ir precursors. Figure S4: Crystal plane of IrTe2 corresponding to diffraction peaks. Figure S5: Eg and A1g vibration modes of IrTe2. Figure S6: Raman spectra of as-grown IrTe2 film on h-BN using Ir(acac)3 precursor from 170 K to 260 K (warming process). Figure S7: Variable-temperature Raman spectra of as-grown IrTe2 film on SiO2/Si using Ir precursor. Figure S8: R–T curves of as-grown IrTe2 films on SiO2/Si using Ir as precursor.

Author Contributions

L.X. conceived the project; Z.Z. and R.Z. performed the experiments; R.Z., J.W. and L.X. wrote the paper. All authors have read and agreed to the published version of the manuscript.

Funding

This research was funded by NSFC (21673058, 21822502), the Key Research Program of Frontier Sciences of CAS (QYZDB-SSW-SYS031) and the Strategic Priority Research Program of CAS (XDB30000000).

Conflicts of Interest

All of the authors declare no conflict of interest.

References

  1. Pyon, S.; Kudo, K.; Nohara, M. Superconductivity Induced by Bond Breaking in the Triangular Lattice of IrTe2. J. Phys. Soc. Jpn. 2012, 81, 053701. [Google Scholar] [CrossRef] [Green Version]
  2. Kiswandhi, A.; Brooks, J.S.; Cao, H.B.; Yan, J.Q.; Mandrus, D.; Jiang, Z.; Zhou, H.D. Competition between the structural phase transition and superconductivity in Ir1−xPtxTe2 as revealed by pressure effects. Phys. Rev. B 2013, 87, 121107. [Google Scholar] [CrossRef] [Green Version]
  3. Oh, Y.S.; Yang, J.J.; Horibe, Y.; Cheong, S.W. Anionic Depolymerization Transition in IrTe2. Phys. Rev. Lett. 2013, 110, 127209. [Google Scholar] [CrossRef] [PubMed] [Green Version]
  4. Kim, K.; Kim, S.; Min, B.I. Optical and transport properties and the structural identification of IrTe2. Phys. Rev. B 2014, 90, 195136. [Google Scholar] [CrossRef]
  5. Wen, W.; Dang, C.H.; Xie, L.M. Photoinduced phase transitions in two-dimensional charge-density-wave 1T-TaS2. Chin. Phys. B 2019, 28, 058504. [Google Scholar] [CrossRef]
  6. Ootsuki, D.; Wakisaka, Y.; Pyon, S.; Kudo, K.; Nohara, M.; Arita, M.; Anzai, H.; Namatame, H.; Taniguchi, M.; Saini, N.L.; et al. Orbital degeneracy and Peierls instability in the triangular-lattice superconductor Ir1−xPtxTe2. Phys. Rev. B 2012, 86, 014519. [Google Scholar] [CrossRef] [Green Version]
  7. Ma, L.; Ye, C.; Yu, Y.; Lu, X.F.; Niu, X.; Kim, S.; Feng, D.; Tomanek, D.; Son, Y.-W.; Chen, X.H.; et al. A metallic mosaic phase and the origin of Mott-insulating state in 1T-TaS2. Nat. Commun. 2016, 7, 10956. [Google Scholar] [CrossRef] [PubMed]
  8. Liu, G.X.; Debnath, B.; Pope, T.R.; Salguero, T.T.; Lake, R.K.; Balandin, A.A. A charge-density-wave oscillator based on an integrated tantalum disulfide-boron nitride-graphene device operating at room temperature. Nat. Nanotech. 2016, 11, 844–850. [Google Scholar] [CrossRef]
  9. Hor, Y.S.; Williams, A.J.; Checkelsky, J.G.; Roushan, P.; Seo, J.; Xu, Q.; Zandbergen, H.W.; Yazdani, A.; Ong, N.P.; Cava, R.J. Superconductivity in CuxBi2Se3 and its Implications for Pairing in the Undoped Topological Insulator. Phys. Rev. Lett. 2010, 104, 057001. [Google Scholar] [CrossRef] [Green Version]
  10. Ko, K.T.; Lee, H.H.; Kim, D.H.; Yang, J.J.; Cheong, S.W.; Eom, M.J.; Kim, J.S.; Gammag, R.; Kim, K.S.; Kim, H.S.; et al. Charge-ordering cascade with spin-orbit Mott dimer states in metallic iridium ditelluride. Nat. Commun. 2015, 6, 7342. [Google Scholar] [CrossRef] [Green Version]
  11. Eom, M.J.; Kim, K.; Jo, Y.J.; Yang, J.J.; Choi, E.S.; Min, B.I.; Park, J.H.; Cheong, S.W.; Kim, J.S. Dimerization-Induced Fermi-Surface Reconstruction in IrTe2. Phys. Rev. Lett. 2014, 113, 266406. [Google Scholar] [CrossRef] [PubMed] [Green Version]
  12. Matsumoto, N.; Taniguchi, K.; Endoh, R.; Takano, H.; Nagata, S. Resistance and Susceptibility Anomalies in IrTe2 and CuIr2Te4. J. Low Temp. Phys. 1999, 117, 1129–1133. [Google Scholar] [CrossRef]
  13. Ivashko, O.; Yang, L.; Destraz, D.; Martino, E.; Chen, Y.; Guo, C.Y.; Yuan, H.Q.; Pisoni, A.; Matus, P.; Pyon, S.; et al. Charge-stripe order and superconductivity in Ir(1−x)PtxTe(2). Sci. Rep. 2017, 7, 17157. [Google Scholar] [CrossRef] [Green Version]
  14. Yoshida, M.; Kudo, K.; Nohara, M.; Iwasa, Y. Metastable superconductivity in two-dimensional IrTe2 crystals. Nano Lett. 2018, 18, 3113–3117. [Google Scholar] [CrossRef] [PubMed]
  15. Yang, J.J.; Choi, Y.J.; Oh, Y.S.; Hogan, A.; Horibe, Y.; Kim, K.; Min, B.I.; Cheong, S.W. Charge-Orbital Density Wave and Superconductivity in the Strong Spin-Orbit Coupled IrTe2:Pd. Phys. Rev. Lett. 2012, 108, 116402. [Google Scholar] [CrossRef] [Green Version]
  16. Fang, A.F.; Xu, G.; Dong, T.; Zheng, P.; Wang, N.L. Structural phase transition in IrTe2: A combined study of optical spectroscopy and band structure calculations. Sci. Rep. 2013, 3, 1153. [Google Scholar] [CrossRef] [Green Version]
  17. Liu, Y.; Lei, H.; Wang, K.; Abeykoon, M.; Warren, J.B.; Bozin, E.; Petrovic, C. Thermoelectric studies of Ir1-xRhxTe2 (0 ≤ x ≤ 0.3). Phys. Rev. B 2018, 98, 094519. [Google Scholar] [CrossRef] [Green Version]
  18. Li, X.; Yan, J.Q.; Singh, D.J.; Goodenough, J.B.; Zhou, J.S. Synthesis of monoclinic IrTe2 under high pressure and its physical properties. Phys. Rev. B 2015, 92, 155118. [Google Scholar] [CrossRef] [Green Version]
  19. Xu, X.; Zhang, Z.; Dong, J.; Yi, D.; Niu, J.; Wu, M.; Lin, L.; Yin, R.; Li, M.; Zhou, J.; et al. Ultrafast epitaxial growth of metre-sized single-crystal graphene on industrial Cu foil. Sci. Bull. 2017, 62, 1074–1080. [Google Scholar] [CrossRef] [Green Version]
  20. Van Luan, N.; Shin, B.G.; Dinh Loc, D.; Kim, S.T.; Perello, D.; Lim, Y.J.; Yuan, Q.H.; Ding, F.; Jeong, H.Y.; Shin, H.S.; et al. Seamless Stitching of Graphene Domains on Polished Copper (111) Foil. Adv. Mater. 2015, 27, 1376–1382. [Google Scholar] [CrossRef]
  21. Zhang, M.; Zhu, Y.; Wang, X.; Feng, Q.; Qiao, S.; Wen, W.; Chen, Y.; Cui, M.; Zhang, J.; Cai, C.; et al. Controlled Synthesis of ZrS2 Mono layer and Few Layers on Hexagonal Boron Nitride. J. Am. Chem. Soc. 2015, 137, 7051–7054. [Google Scholar] [CrossRef] [PubMed]
  22. Qian, Z.Y.; Jiao, L.Y.; Xie, L.M. Phase Engineering of Two-Dimensional Transition Metal Dichalcogenides. Chin. J. Chem. 2020, 38, 753–760. [Google Scholar] [CrossRef]
  23. Najmaei, S.; Liu, Z.; Zhou, W.; Zou, X.; Shi, G.; Lei, S.; Yakobson, B.I.; Idrobo, J.-C.; Ajayan, P.M.; Lou, J. Vapour phase growth and grain boundary structure of molybdenum disulphide atomic layers. Nat. Mater. 2013, 12, 754–759. [Google Scholar] [CrossRef] [PubMed]
  24. Liu, C.; Wang, L.; Qi, J.; Liu, K. Designed Growth of Large-Size 2D Single Crystals. Adv. Mater. 2020, 32, 2000046. [Google Scholar] [CrossRef] [PubMed]
  25. Yan, A.; Velasco, J.; Kahn, S.; Watanabe, K.; Taniguchi, T.; Wang, F.; Crommie, M.F.; Zettl, A. Direct growth of single- and few-layer MoS2 on h-BN with preferred relative rotation angles. Nano Lett. 2015, 15, 6324–6331. [Google Scholar] [CrossRef] [PubMed] [Green Version]
  26. Okada, M.; Sawazaki, T.; Watanabe, K.; Taniguch, T.; Hibino, H.; Shinohara, H.; Kitaura, R. Direct Chemical Vapor Deposition Growth of WS2 Atomic Layers on Hexagonal Boron Nitride. ACS Nano 2014, 8, 8273–8277. [Google Scholar] [CrossRef]
  27. Zhang, L.; Zhu, X.; Ling, L.; Zhang, C.; Pi, L.; Zhang, Y. Lattice dynamics study of the structural transition in IrTe2. Philos. Mag. 2014, 94, 439–446. [Google Scholar] [CrossRef]
  28. Glamazda, A.; Choi, K.Y.; Lemmens, P.; Yang, J.J.; Cheong, S.W. Proximity to a commensurate charge modulation in IrTe2−xSex (x = 0 and 0.45) revealed by Raman spectroscopy. New J. Phys. 2014, 16, 093061. [Google Scholar] [CrossRef]
  29. Lazarevic, N.; Bozin, E.S.; Scepanovic, M.; Opacic, M.; Lei, H.C.; Petrovic, C.; Popovic, Z.V. Probing IrTe2 crystal symmetry by polarized Raman scattering. Phys. Rev. B 2014, 89, 224301. [Google Scholar] [CrossRef] [Green Version]
  30. Pascut, G.L.; Haule, K.; Gutmann, M.J.; Barnett, S.A.; Kiryukhin, V. Dimerization-Induced Cross-Layer Quasi-Two-Dimensionality in Metallic IrTe2. Phys. Rev. Lett. 2014, 112, 086402. [Google Scholar] [CrossRef] [Green Version]
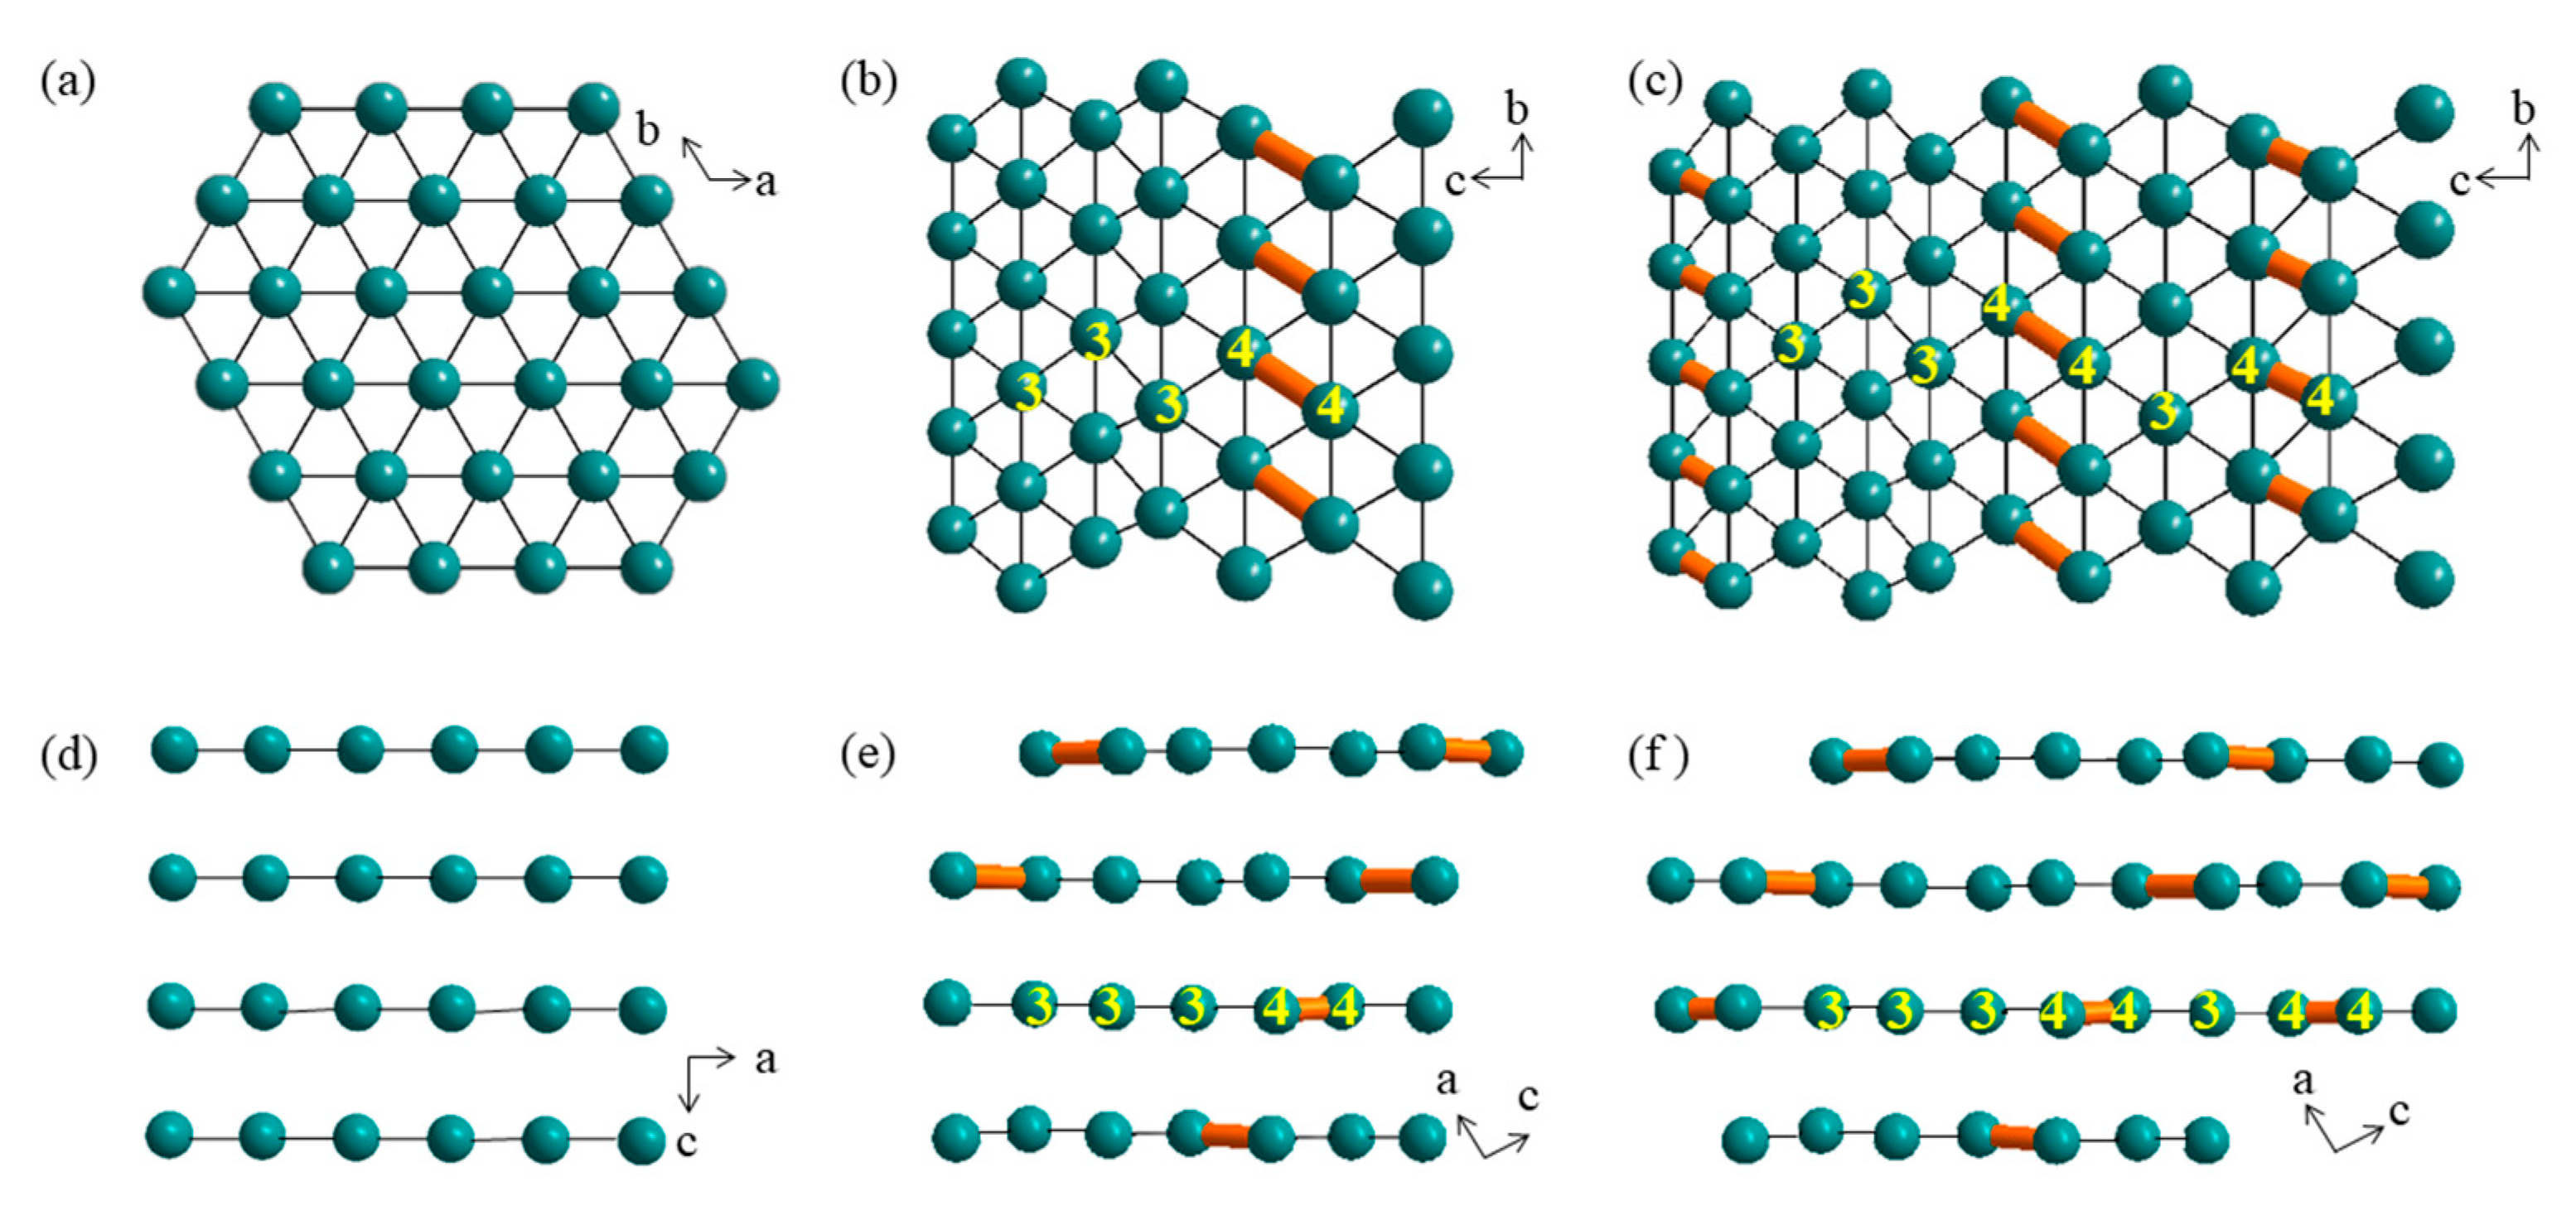
Figure 1. Crystal structure of IrTe2 in (a,d) high temperature (HT) phase, (b,e) 1/5 phase and (c,f) 1/8 phase. Only Ir atoms are shown in the structures. (ac) are views perpendicular to the ab plane; (df) are side views. Ir4+-Ir4+ dimers are connected with yellow lines, other Ir-Ir bonding is shown in black lines.
Crystals 10 00575 g001
Figure 2. (a) Illustration of tube furnace for the growth of IrTe2 films; (be) SEM images of as-grown IrTe2 films on h-BN, SiO2/Si, sapphire and mica substrates, (f) XRD and (g) EDS spectra of as-grown IrTe2 films on h-BN adopting Ir(acac)3 precursor.
Crystals 10 00575 g002
Figure 3. (a,b) SEM images of as-grown IrTe2 films using (a) IrCI3 and (b) Ir precursors, (c) Raman Spectra of as-grown IrTe2 using Ir(acac)3 (red line), IrCI3 (black line) and Ir (blue line) precursors.
Crystals 10 00575 g003
Figure 4. (a) Raman spectra of as-grown IrTe2 film on h-BN using Ir(acac)3 precursor at 250 K (magenta line) and 180 K (black line). The red, green, blue and cyan solid lines are the fitted peaks using Lorentz functions. (b) Variable-temperature Raman spectra of as-grown IrTe2 film (warming process). (c) Raman shift and (d) intensity of Eg and A1g modes as a function of temperature.
Crystals 10 00575 g004
Figure 5. (a) Illustration of a two-terminal IrTe2 device used in temperature-dependent resistance (R-T) measurement (cooling precoss). (b) R-T and (c) dR/dT-T curves of as-grown IrTe2 film on h-BN using Ir(acac)3 precursor.
Crystals 10 00575 g005