1. Introduction
Nucleation is the process in which nuclei with sufficient stability to exist are produced in a solution or a slurry [
1]. Nucleation that occurs in a crystal-free solution is the primary nucleation, while if it takes place in a solution with existing crystals, which are either added manually or produced by primary nucleation, it is the secondary nucleation [
2]. There are presumed to be mainly two sources for secondary nucleation: the fine fragments generated by the collision between crystals, crystals and agitators, and crystals and the kettle body, and the tiny nuclei removed as the solution flows over the crystal surface [
3]. Primary nucleation is usually difficult to control, therefore, crystal seeds can be added to avoid primary nucleation [
4]. However, secondary nucleation cannot be avoided in crystallisation and could exert a substantial effect on the crystal size distribution (CSD) of the crystalline product [
5]. In continuous crystallisation, where a certain amount of the product crystal is likely to be always present, understanding the secondary nucleation could be particularly important [
6,
7].
In early experimental studies on secondary nucleation, samples were frequently and intermittently collected manually out of the crystalliser to analyse the CSD off-line, and the secondary nucleation process was examined through numerical regression analysis [
8,
9]. Some researchers have even observed the threshold of the secondary nucleation of γ-dl-methionine with the naked eye [
10]. The interference with the crystallisation process and the errors of the above methods are apparent, therefore, in later studies, process analytical technology was applied to the methodology. Frawley et al. [
11] combined an online infrared spectrometer and focused beam reflectance measurement (FBRM) to record the solution concentration, CSD and crystal number in the suspension, and correlated the secondary nucleation dynamics of paracetamol in an ethanol solution. Wang et al. [
12] and Leyssens et al. [
13] also used FBRM to obtain information about the crystals during the crystallisation process. At high solid concentration, FBRM may have difficulty in recognising whether a particle is a single crystal or an agglomerate [
14], which causes measurement errors. Some researchers have applied on-line microscopic imaging to the study of crystallisation, such as [
12,
15,
16,
17,
18,
19,
20,
21,
22,
23,
24,
25,
26], with the majority studying crystal morphology, polymorph and aggregation, with the exception of Briuglia et al. [
26] studied the secondary nucleation kinetics using the parallel crystallisation equipment
Crystalline, which is equipped with an on-line camera; the volume of the crystalliser was 1.5 ml and a single crystal seed was used.
On modelling the secondary nucleation, an empirical power formula is often used [
27,
28,
29]. It assumes that the secondary nucleation rate has power relationships with supersaturation, the stirring rate and particle suspension density. More sophisticated models were also derived to consider surface nucleation at high supersaturation [
30,
31], and to take collisions into consideration [
30,
32]. The sophisticated model structure contains parameters that are difficult to measure, for instance, the collision frequency and the number of nuclei produced by one collision energy.
2,2-azobisisobutyronitrile (AIBN) with a formula ((CH
3)
2C(CN))
2N
2 is a self-reactive organic material that is widely used as a foaming agent and as a reaction initiator [
33,
34]. High-quality crystals which have high purity and good morphology are preferred for industrial use, since it was found that impurity and elongated crystal shape could cause caking of the crystal product during storage.
In this study, on-line imaging and image analysis were applied to study the secondary nucleation in the seeded crystallisation of AIBN in methanol. Models were built to correlate the average secondary nucleation rate, induction time, agglomeration, and final crystal suspension density, with crystallisation conditions including initial supersaturation, temperature, crystal seed number, and stirrer speed.
2. Experimental Section
The AIBN used in this study was purchased from Shanghai Aladdin Bio-Chem Technology Co. Ltd., China, with 99% purity. Methanol (analytically pure) was provided by Sinopharm Chemical Reagent Co., Ltd., China.
2.1. Calibration of the Particle Suspension Density in Solution
An on-line imaging device, the 2D Vision Probe, and an image analysis software tool, all from PharmaVision Intelligent Technology Ltd, China, were applied to monitor the seeded AIBN crystallisation process in methanol, for the purpose of studying the secondary nucleation process. As the device only obtains information about the crystals in the field of view of the camera, not in the whole solution, to calculate the crystal suspension number density in solution, Nρ, from the crystal number in the 2D images taken by the camera, Cv, a calibration line must be built. Polystyrene microspheres with diameters of 50 ± 2.5 μm (Wuxi Ruige Bio-technology Co., Ltd., China) were used to build the calibration line. After quantification, polystyrene microspheres were added to 250 mL of water, and the suspension system was stirred for another 30 minutes at a rate of 200 rpm, under which it was assumed that the whole system was well mixed. Afterwards, at least 30 images of the suspension system were obtained using the imaging probe at a speed of one image per second. In each batch of experiments, the particle suspension number density of the system and the average particle number in images were calculated to derive the calibration line.
2.2. Preparation of 2,2-azobisisobutyronitrile (AIBN) Solution
The experimental conditions and concentrations of AIBN solutions are shown in
Table 1. The initial supersaturation level was calculated using Equation (1),
where
s,
, and
represent the relative supersaturation, real concentration and the solubility of the AIBN solution, respectively. The solubility of AIBN was reported in our previous study [
35].
Approximately 200 g of methanol and the appropriate amount of AIBN were placed in a round-bottomed flask and stirred for 30 min, at a temperature 5 degrees above the saturation temperature, to completely dissolve the AIBN. Next, the AIBN solution was filtered with a 0.22 μm organic filter membrane to minimise the existence of insoluble impurities in the solution.
2.3. Seeding Experiments
Two hundred and fifty millilitres of the filtered AIBN solution were accurately injected into a jacketed reactor equipped with a temperature controller and incubated at 5 degrees above the saturation temperature for 30 min. The solution was then cooled and incubated at the set temperature in two minutes, a few seconds after which the selected seeds with a size of approximately 0.5 × 0.5 × 0.5 mm3 were quickly placed in the solution, and the camera was immersed in the solution to begin to capture images. Notably, the primary nucleation should not occur before the addition of the crystal seeds. The experiments should be conducted until the particle suspension density has reached a stable value, i.e., the end of the secondary nucleation process. Throughout the experiment, the solution was stirred continuously using an up-place stirrer, and the temperature of the solution was monitored with an immersed temperature probe. Three experiments were repeated at each experimental condition. Importantly, although all equipment used in the experiment was carefully cleaned before the experiments, the solution pictures taken by ‘2D Vision’ indicated that a small amount of insoluble impurities still existed in the solution, which were not involved in the counting of crystals.
3. Results and Discussion
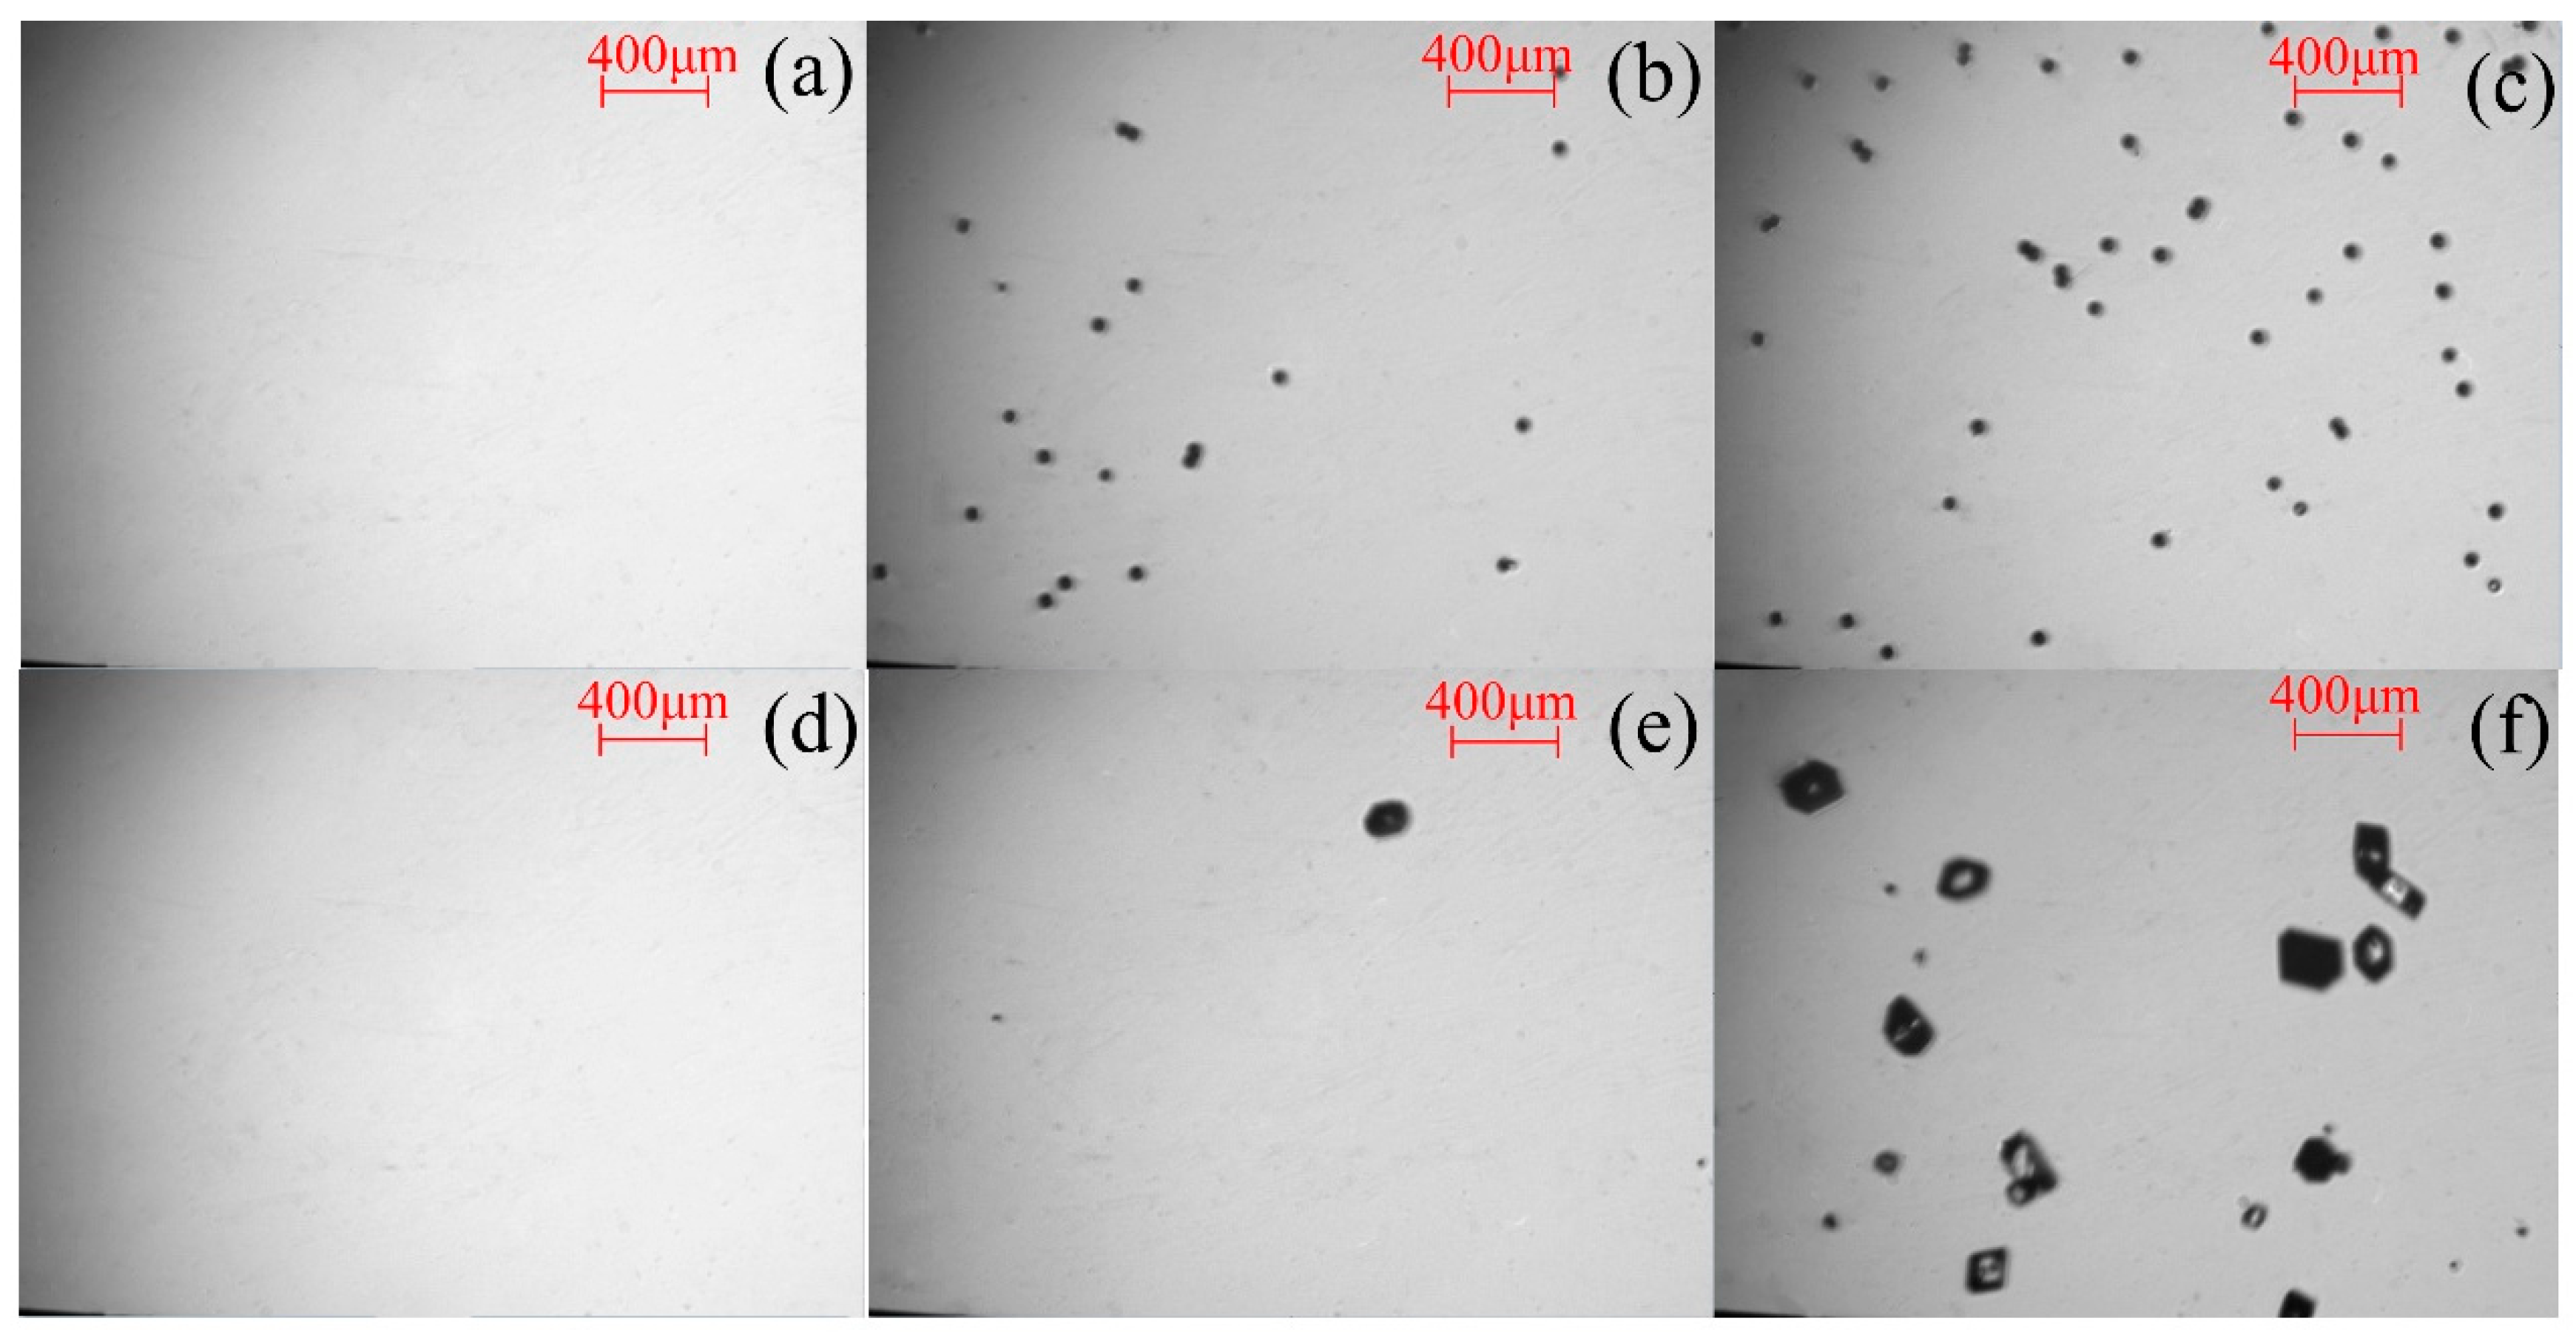
The images captured in the calibration experiments and seeding experiments are shown in
Figure 1a–c and
Figure 1d–f, respectively. At least 30 images from each batch of experiments were processed using Image-Pro Plus software (Version 6.0, Media Cybernetics, USA) to derive the calibration line. In the secondary nucleation measurements, the images of the first fifteen seconds in every two-minute interval were selected, analysed using Image-Pro Plus software, and calibrated visually.
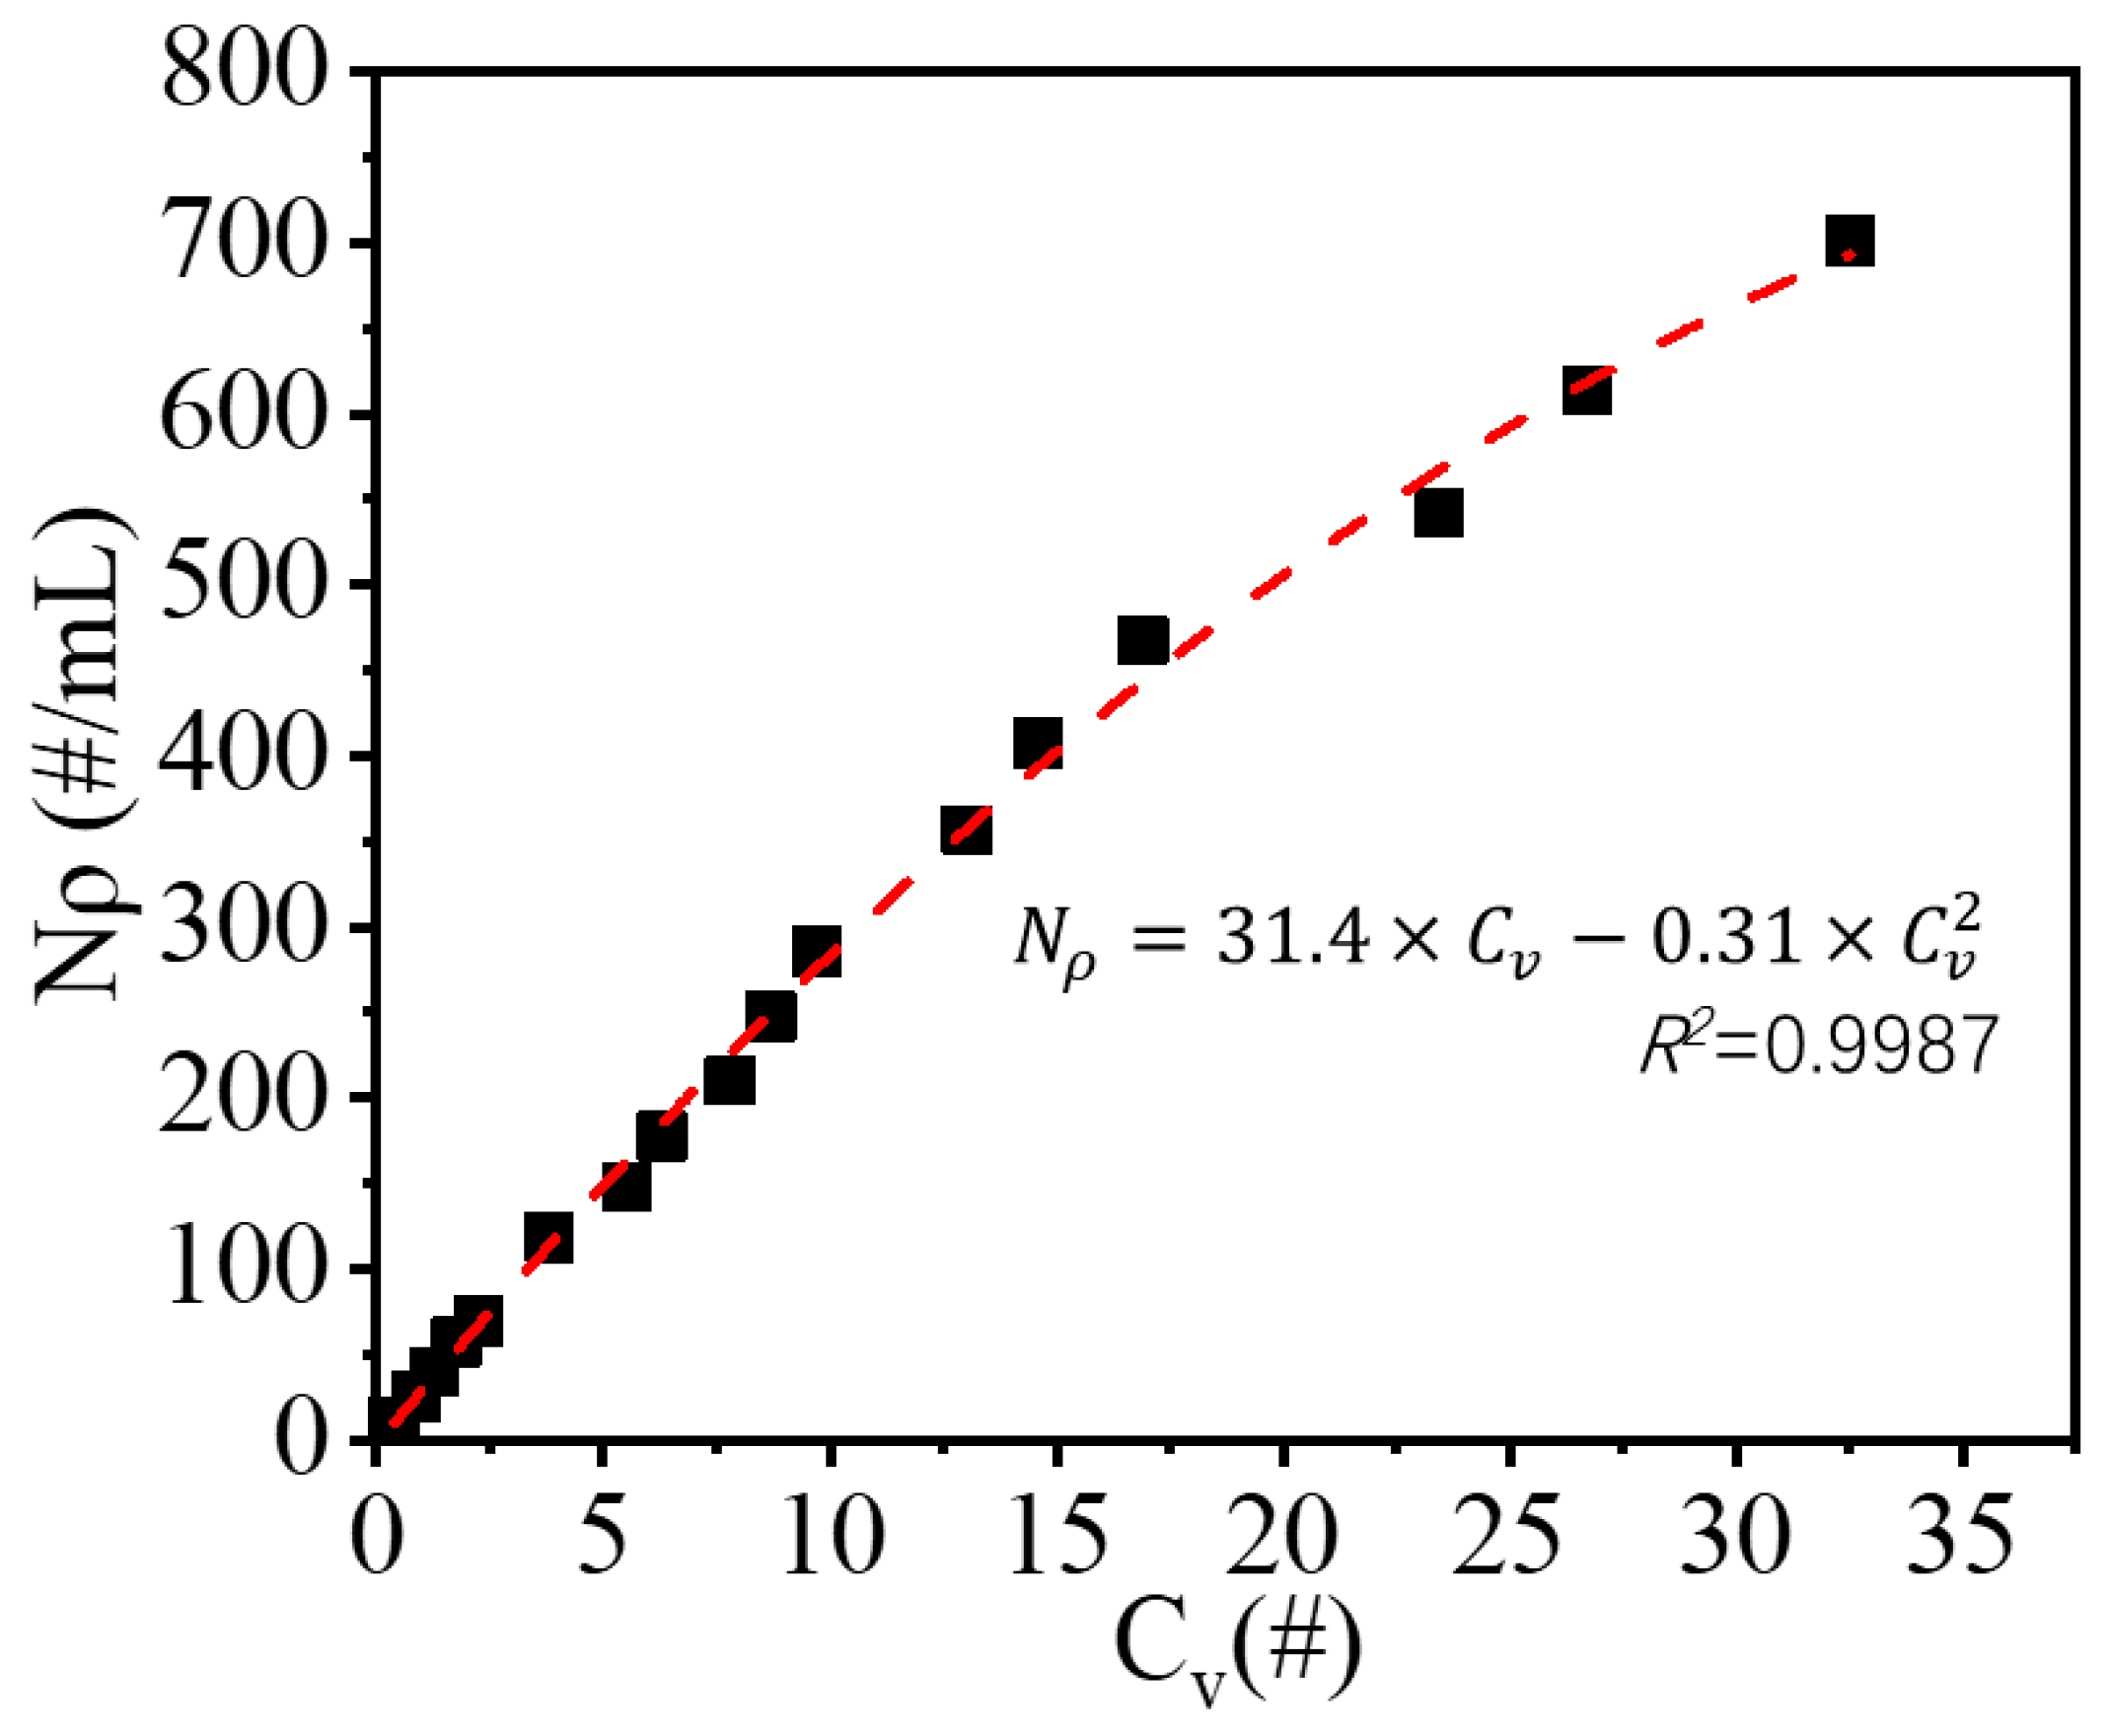
3.1. Calibration Line
The polystyrene microspheres had a monodisperse size of 50 μm and a density of 1.050 g/cm
3; therefore, the particle suspension number density was calculated based on the number and properties of polystyrene microspheres. The number of crystals in the camera view was set as the average number of particles in 30 images of each condition. The calibration line is shown in
Figure 2 and fitted using the following quadric Equation (2):
where
and
denote the particle suspension density in solution and particle number in camera view, respectively.
As shown in
Figure 2,
Nρ exhibits a roughly linear relation with
Cv at low
Nρ. However, at higher values of
Nρ, it displays a negative deviation. The design of the 2D vision probe might be the source of the deviation. A 10 mm thick duct was placed under the camera to reduce the thickness of the solution from which images were captured, and to capture clear images; the suspension system must flow into the duct to allow images to be taken. The existence of the duct may alter the flow condition of the suspension system and increase the number of particles entering the duct, which may be more evident at a high suspension density. The detection range of the calibration line was 10–700 #/mL in real particle suspension density.
3.2. Nucleation Rates
Based on the analysis, the agglomeration ratio and crystal number at specific time points were calculated using Equations (3) and (4), respectively,
where
Ka,
Ntol, and
Nagg are the agglomeration ratio, total number of AIBN crystals, and the number of AIBN single crystals and aggregates, respectively. A larger agglomeration ratio indicates a more substantial agglomeration of particles.
where
Nρ and
F(x) are the particle suspension density and calibration formula, respectively.
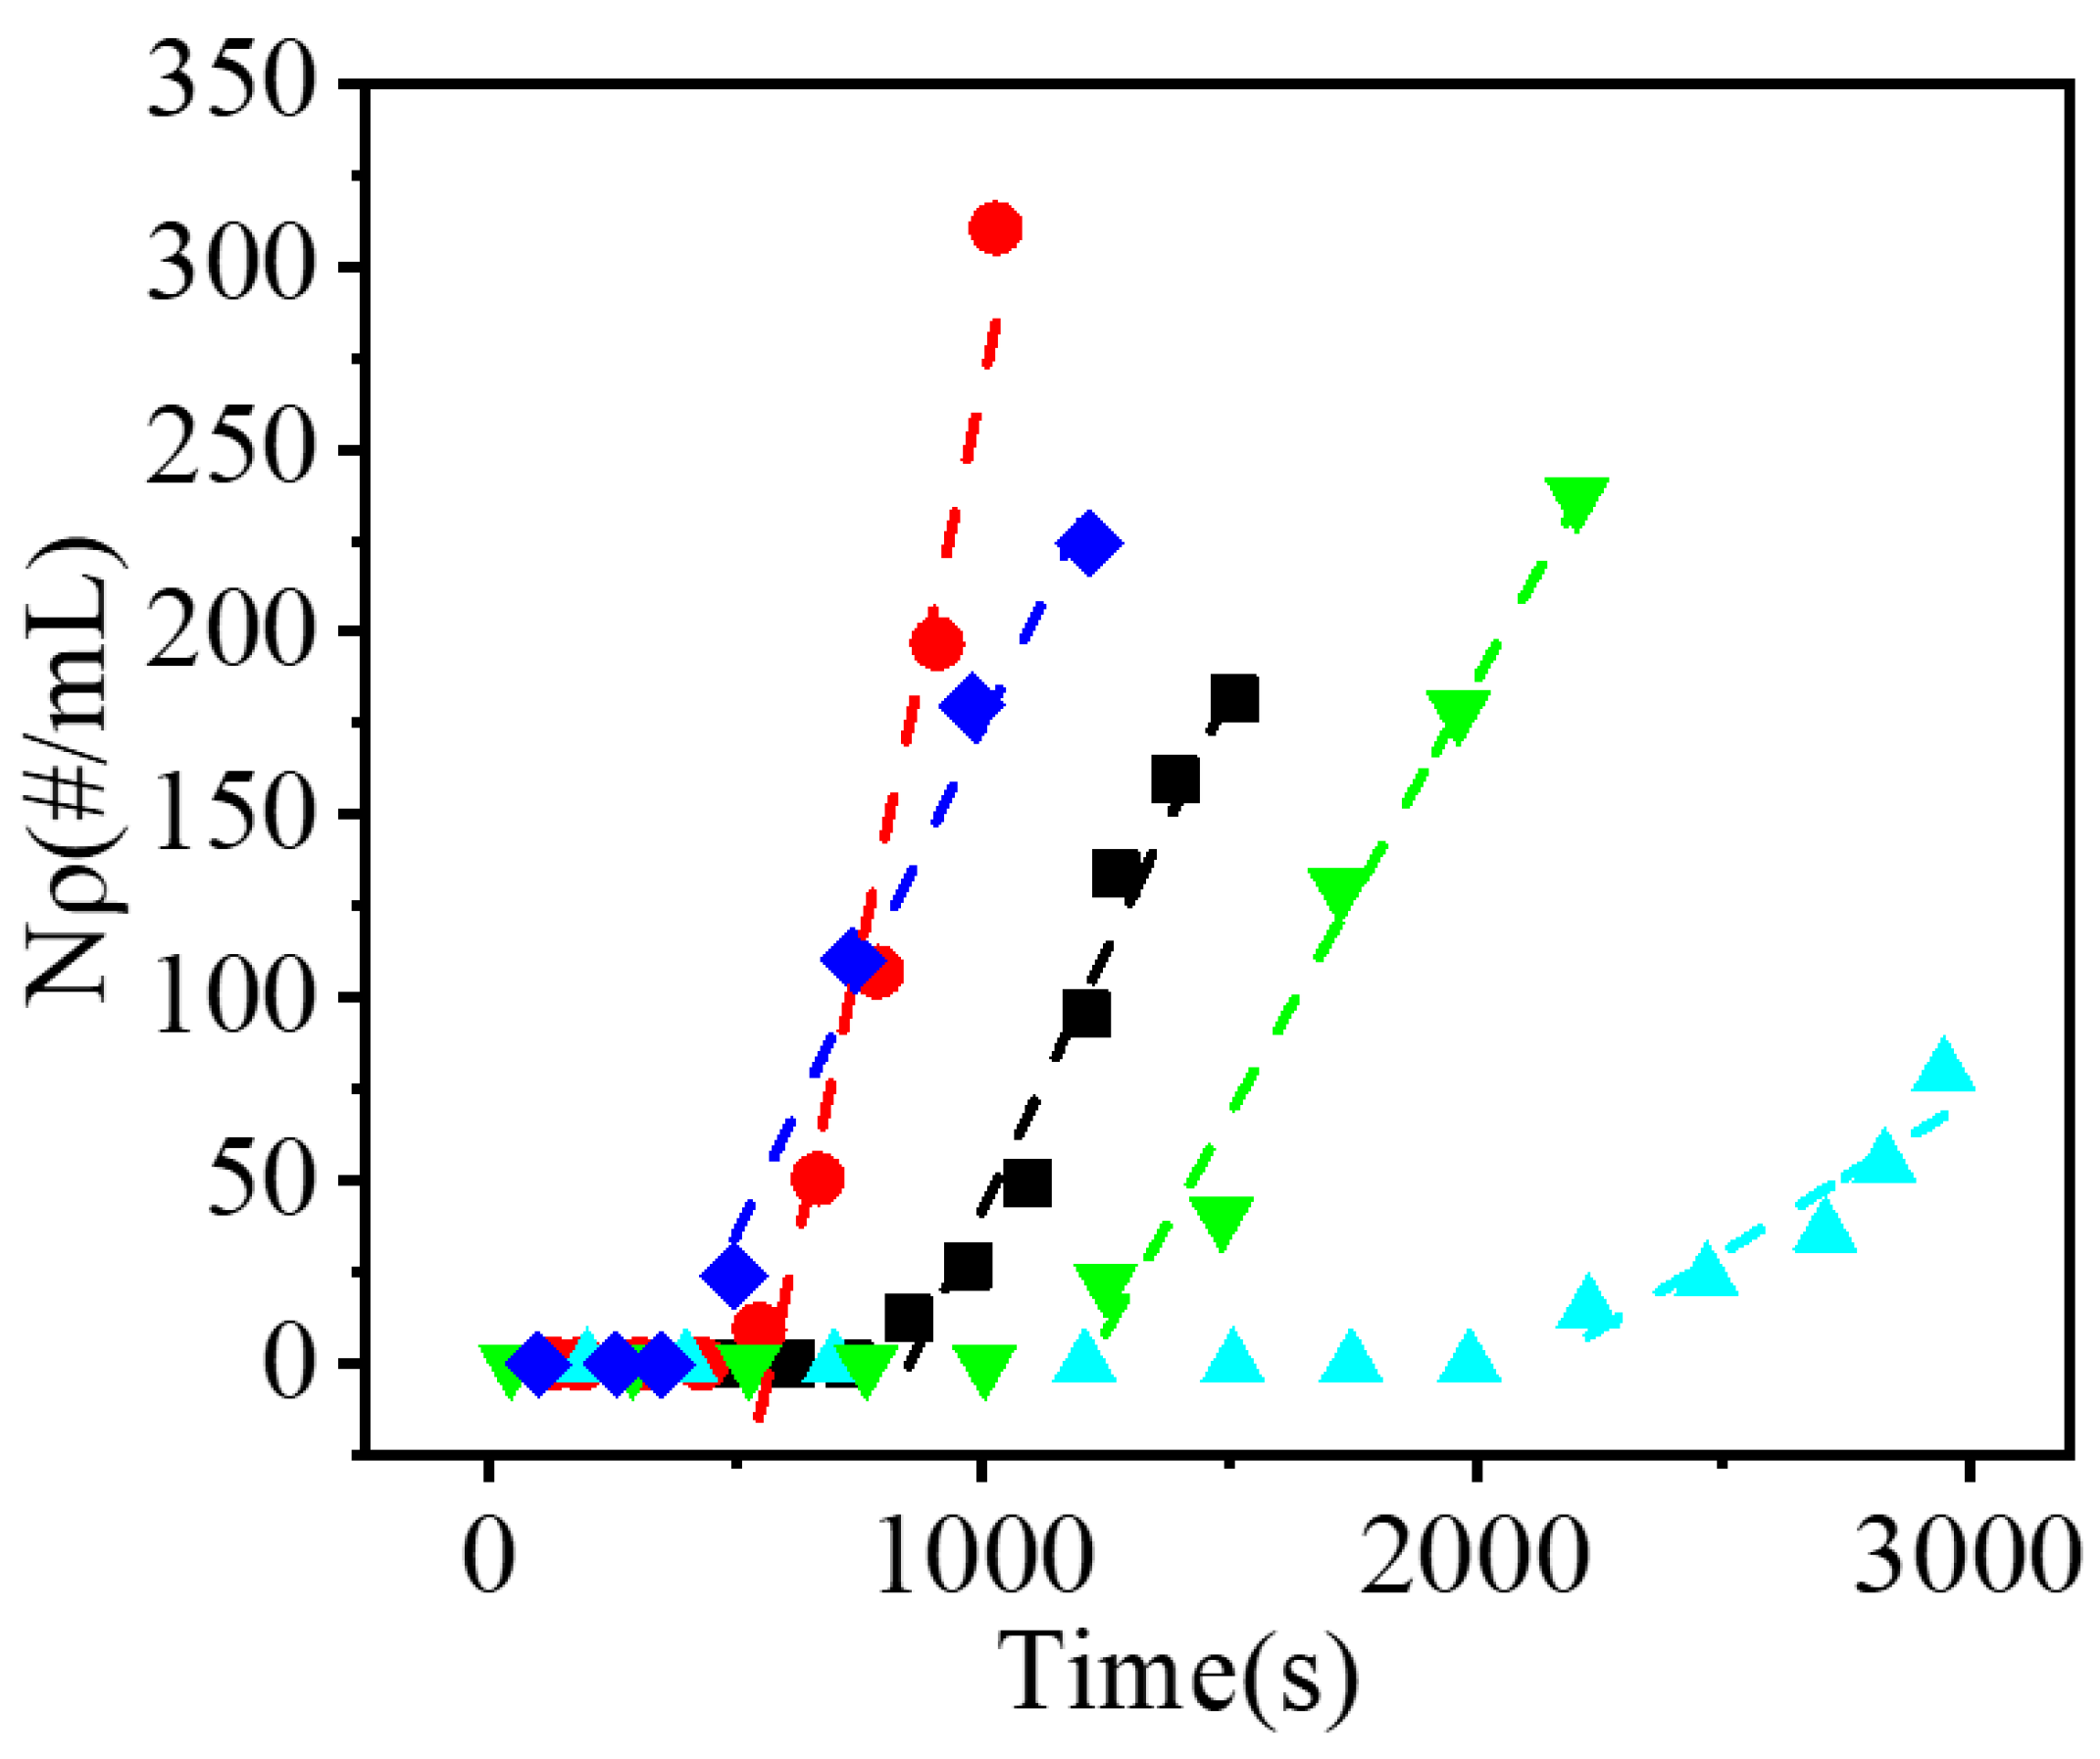
The changes in the suspension density of AIBN crystals during the secondary nucleation process are shown in
Figure 3. The particle suspension density of AIBN increased in a similar linear manner, therefore, the average secondary nucleation rate was obtained by fitting the crystal suspension density in the secondary nucleation stage, and the crossover of the fitting line and baseline was postulated to represent the initiation of secondary nucleation. The difference between the time of seed addition and the initiation of secondary nucleation was considered the induction time. It should be noted that the maximum suspension density of added crystal seeds was 0.08 #/mL, which was much lower than the minimum detection limit of the calibration line, so the effect of the seeds on the determination could be ignored.
In this part, the relationship between the average secondary nucleation rates in the seed adding process and the initial supersaturation level, temperature, crystal seed number, and stirrer speed were investigated.
3.2.1. Supersaturation and Temperature
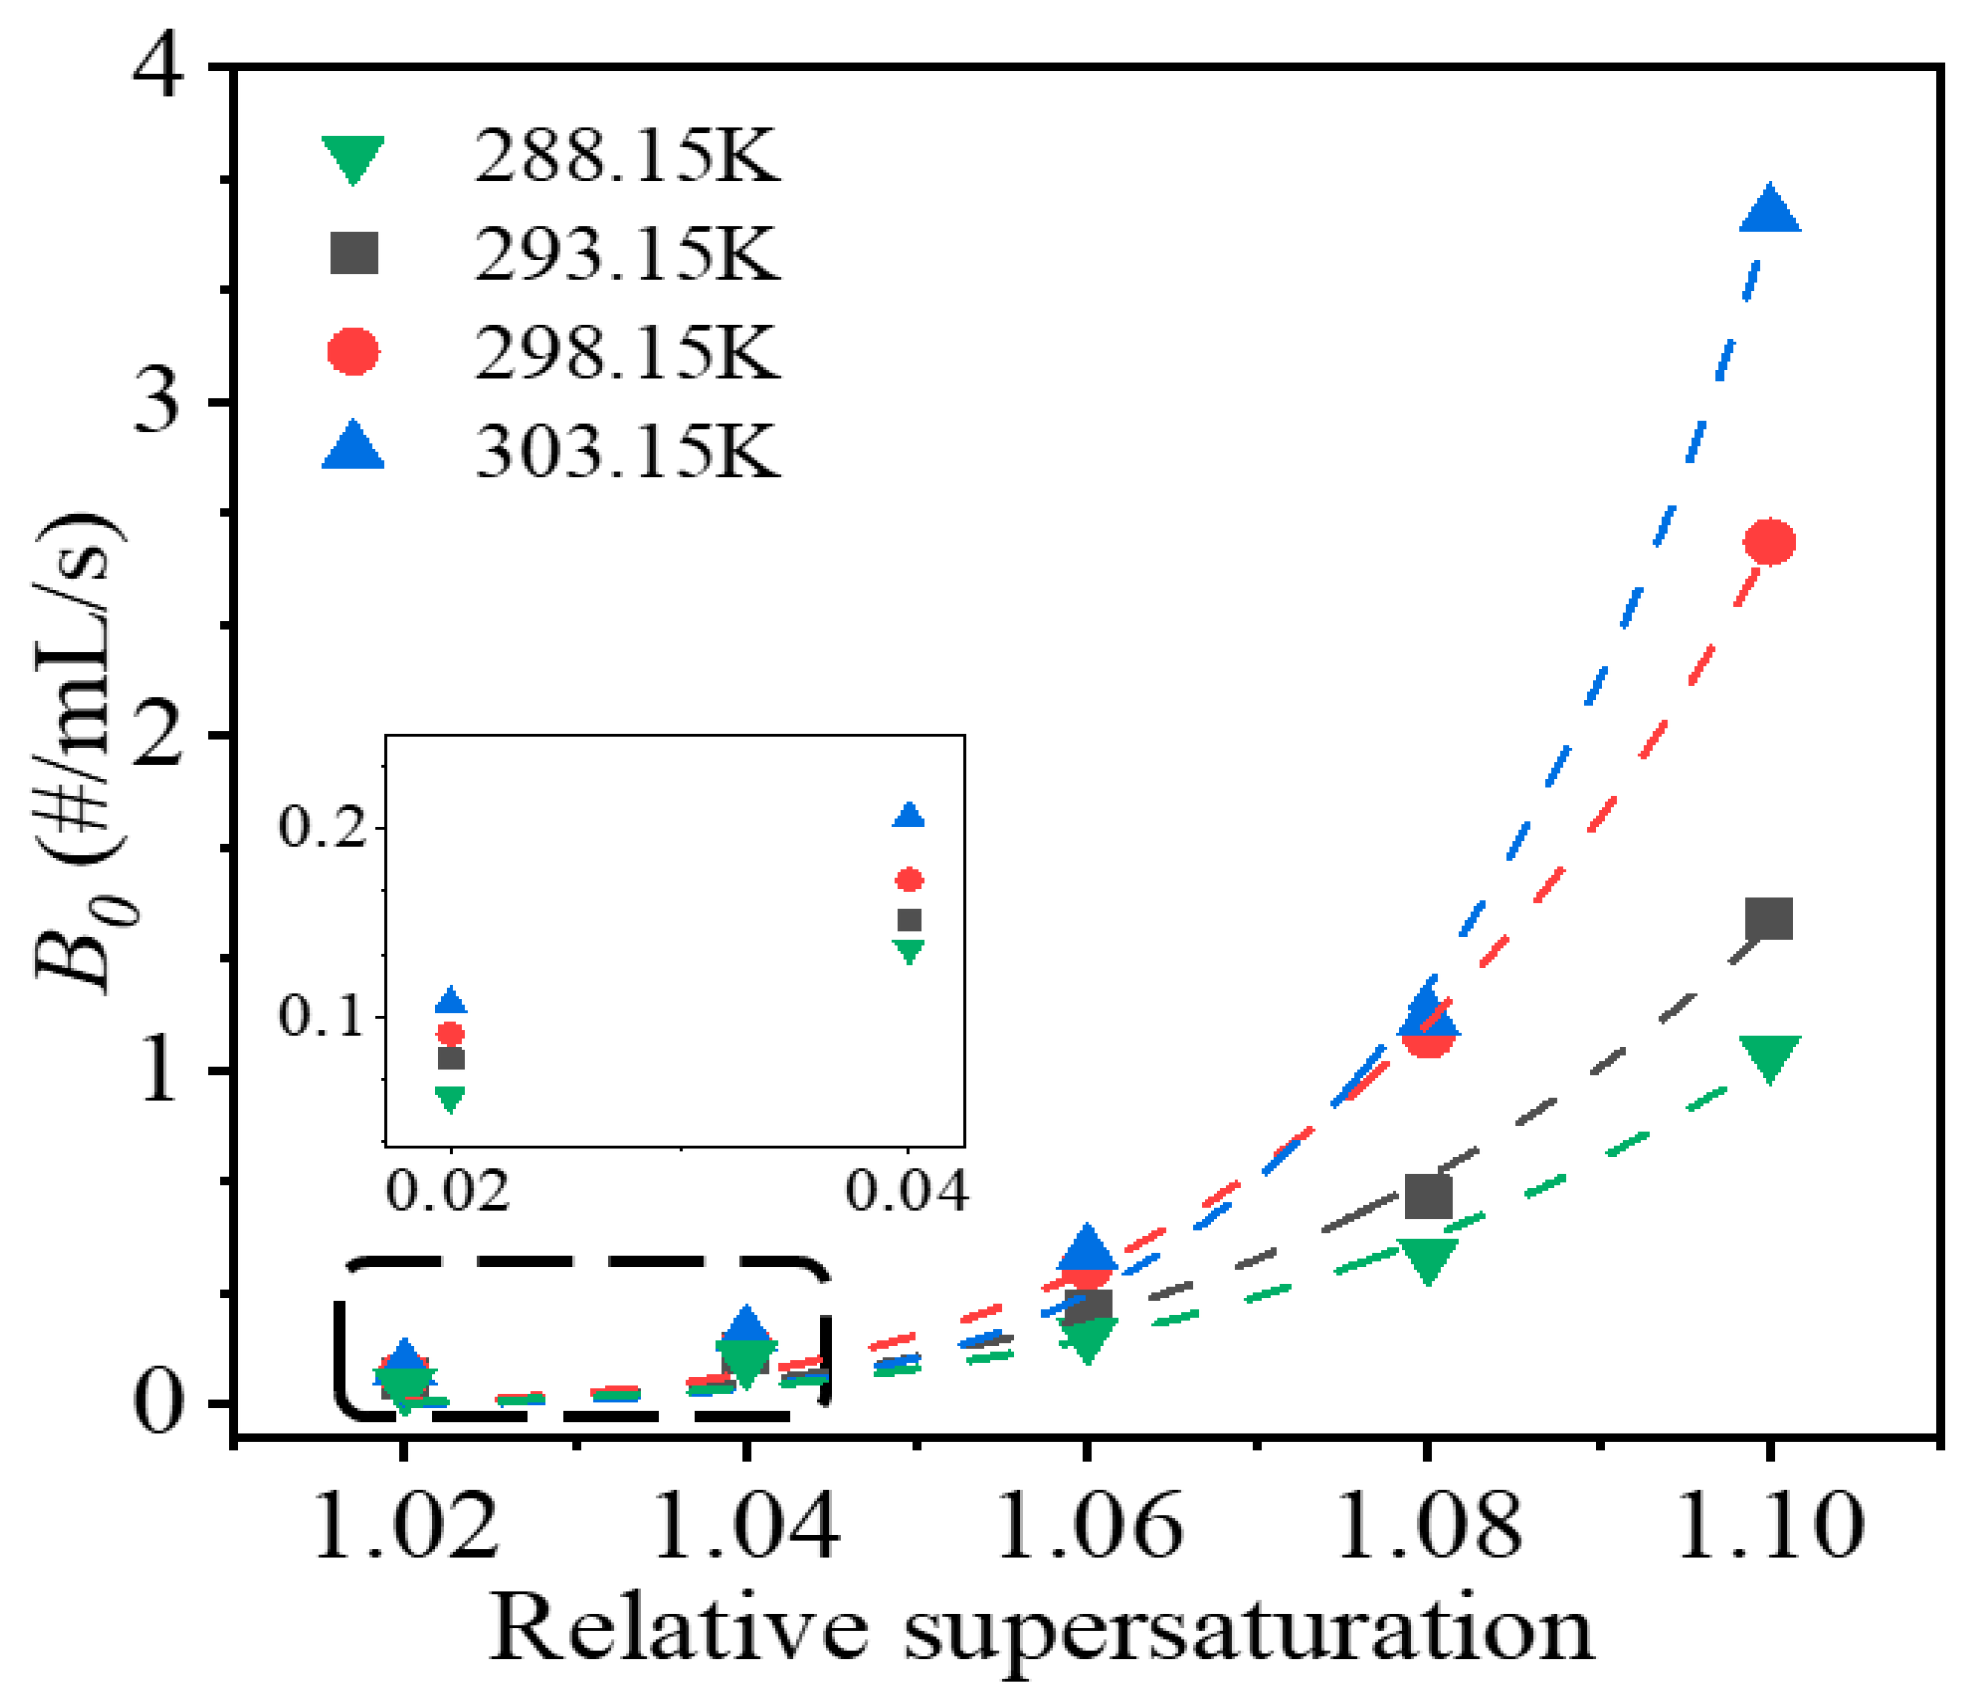
Figure 4 shows the secondary nucleation rates at different relative supersaturation levels and temperatures. The secondary nucleation rate increased as the supersaturation and temperature were increased. For supersaturation, the secondary nucleation rate increased in a power or exponential manner. The potential explanation for the increase in the secondary nucleation rate is that an increase in supersaturation produces more crystals, which increases the probability of collisions between crystals, and between crystals and the agitator, subsequently increasing the crystal area available for secondary nucleation.
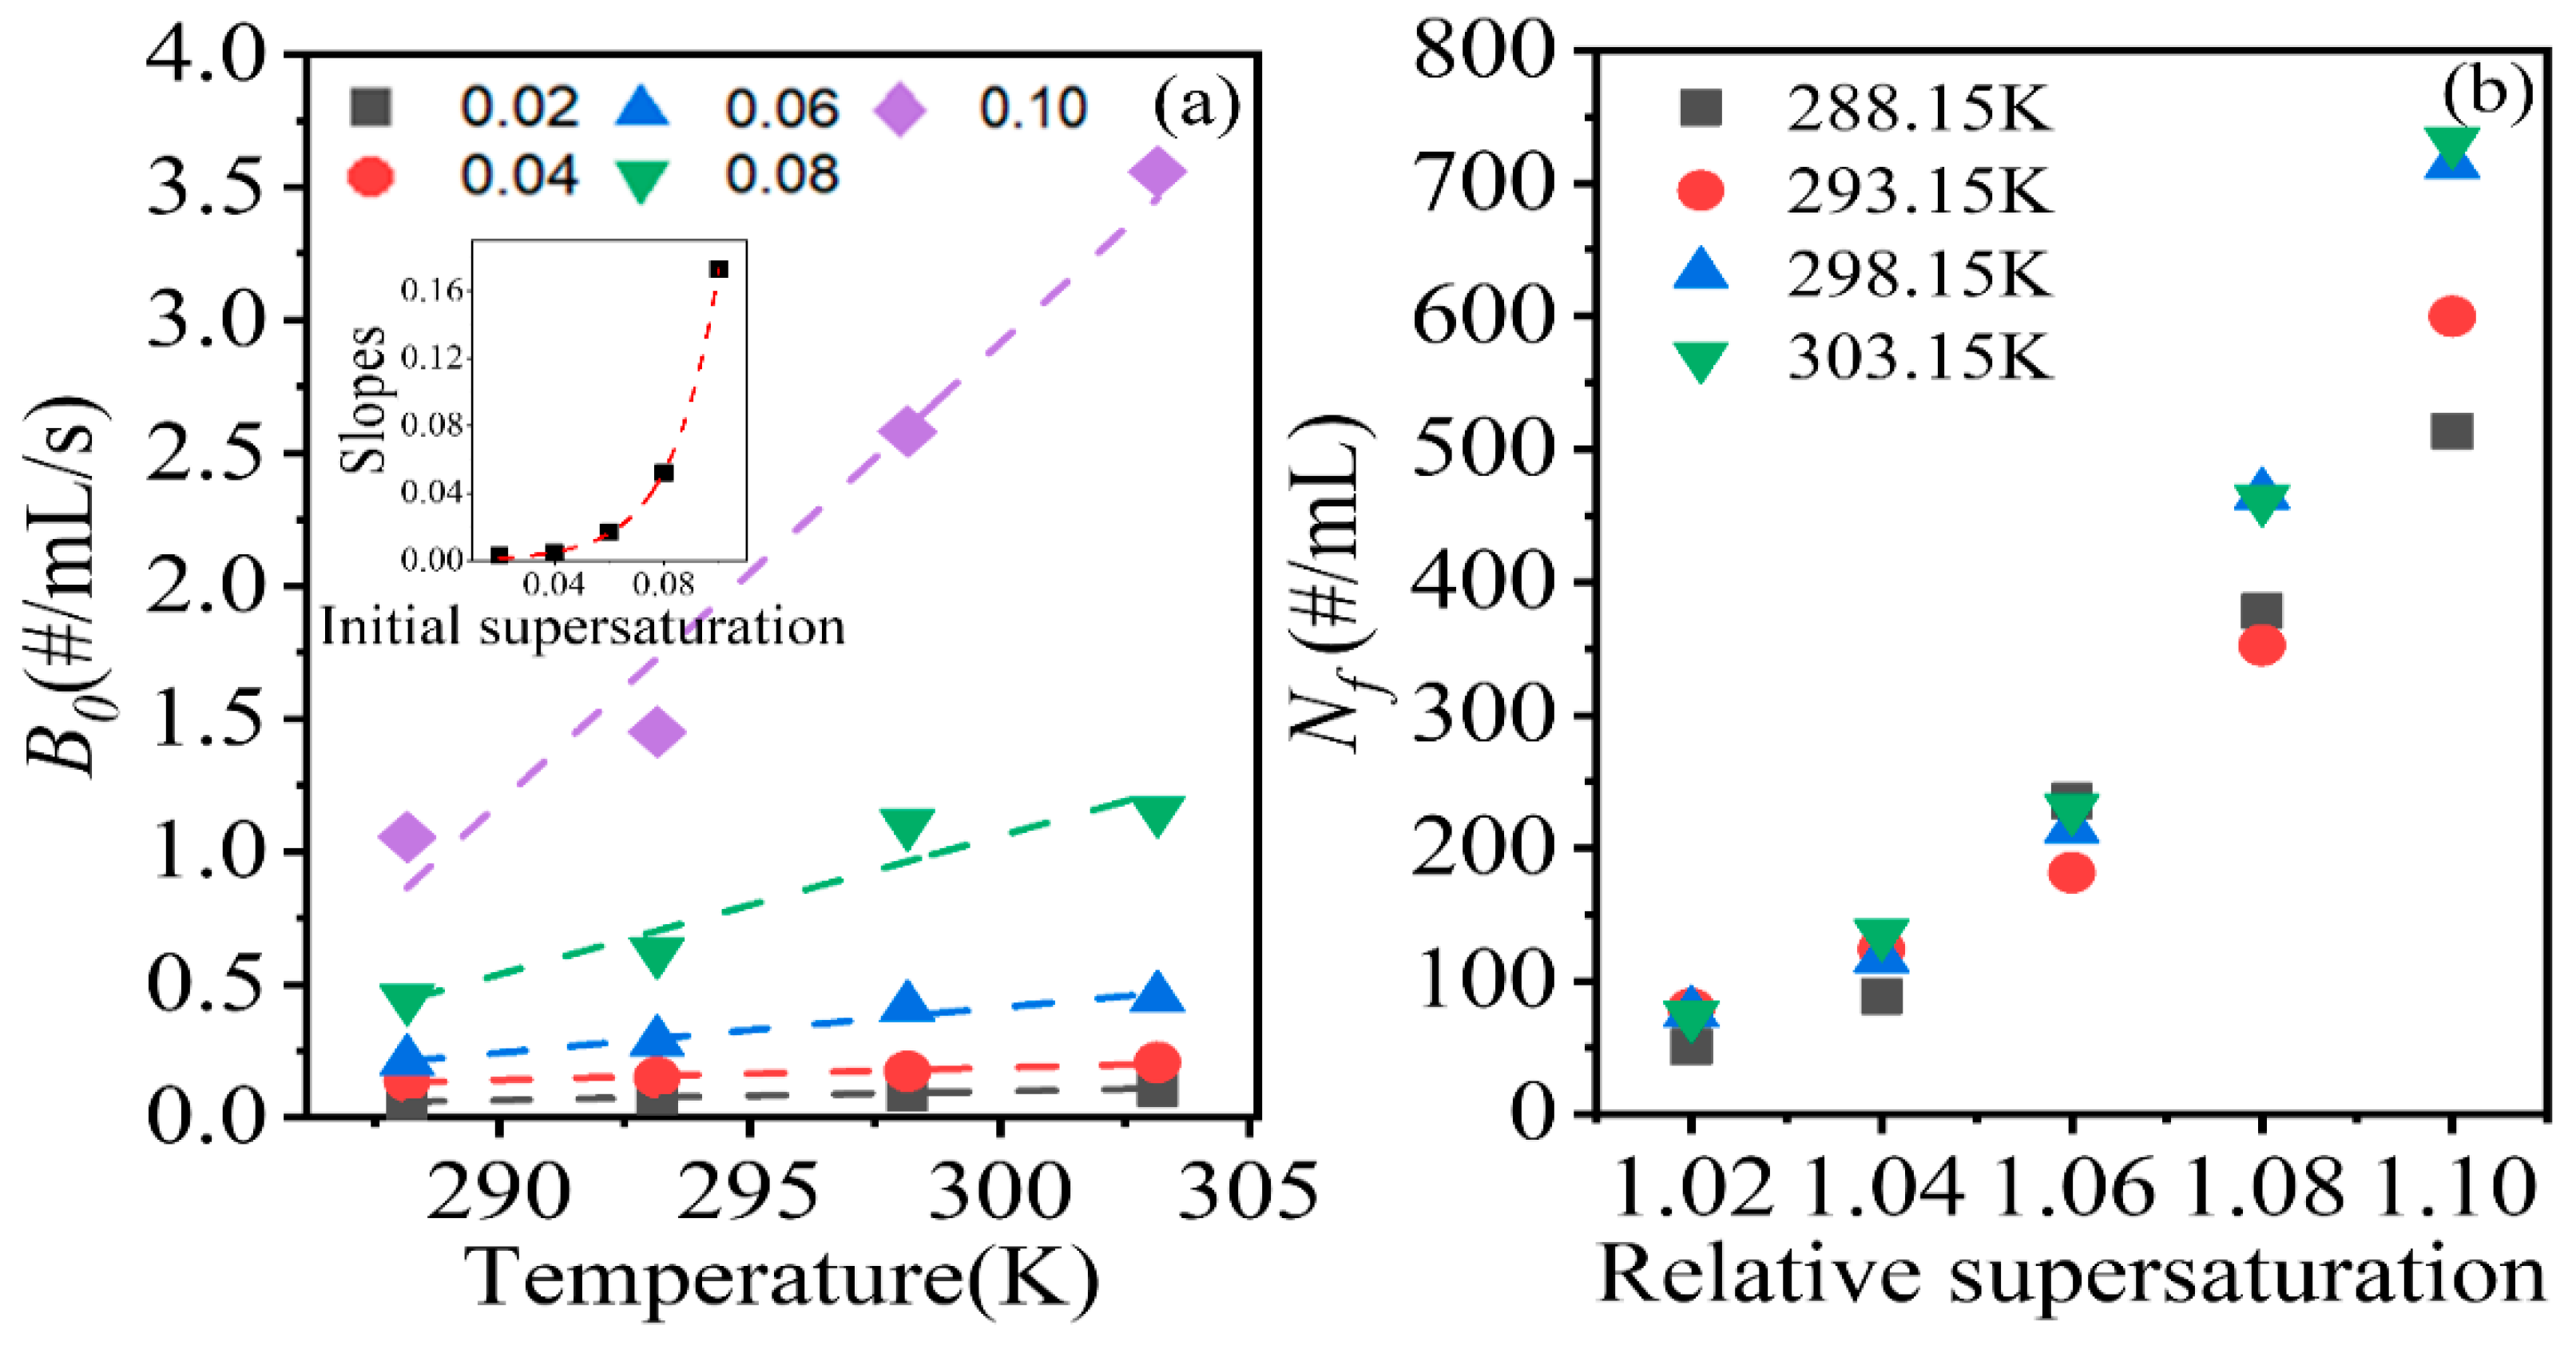
Regarding the temperature, the secondary nucleation rate increased with temperature in a linear manner at the same supersaturation level, which is shown in
Figure 5a. Additionally, as shown in
Figure 5a inset, the slopes of the fitting lines exhibited an exponential relationship with the initial supersaturation level. The phenomenon may be attributed to a number of factors. First, according to the classical crystal growth theory, an increase in temperature can promote the growth of crystals [
36,
37], thus increasing the available area for secondary nucleation. Second, larger crystals have lower flowing features, which will increase the possibility and strength of collisions between crystals and the impeller. Third, the absolute supersaturation level, corresponding to the relative supersaturation increases with temperature, will increase the number of crystals produced. As the crystal number increases, the possibility of collisions between crystals, and between crystals and the agitator, increases. Increases in the crystal size and crystal number both enhance the secondary nucleation rate.
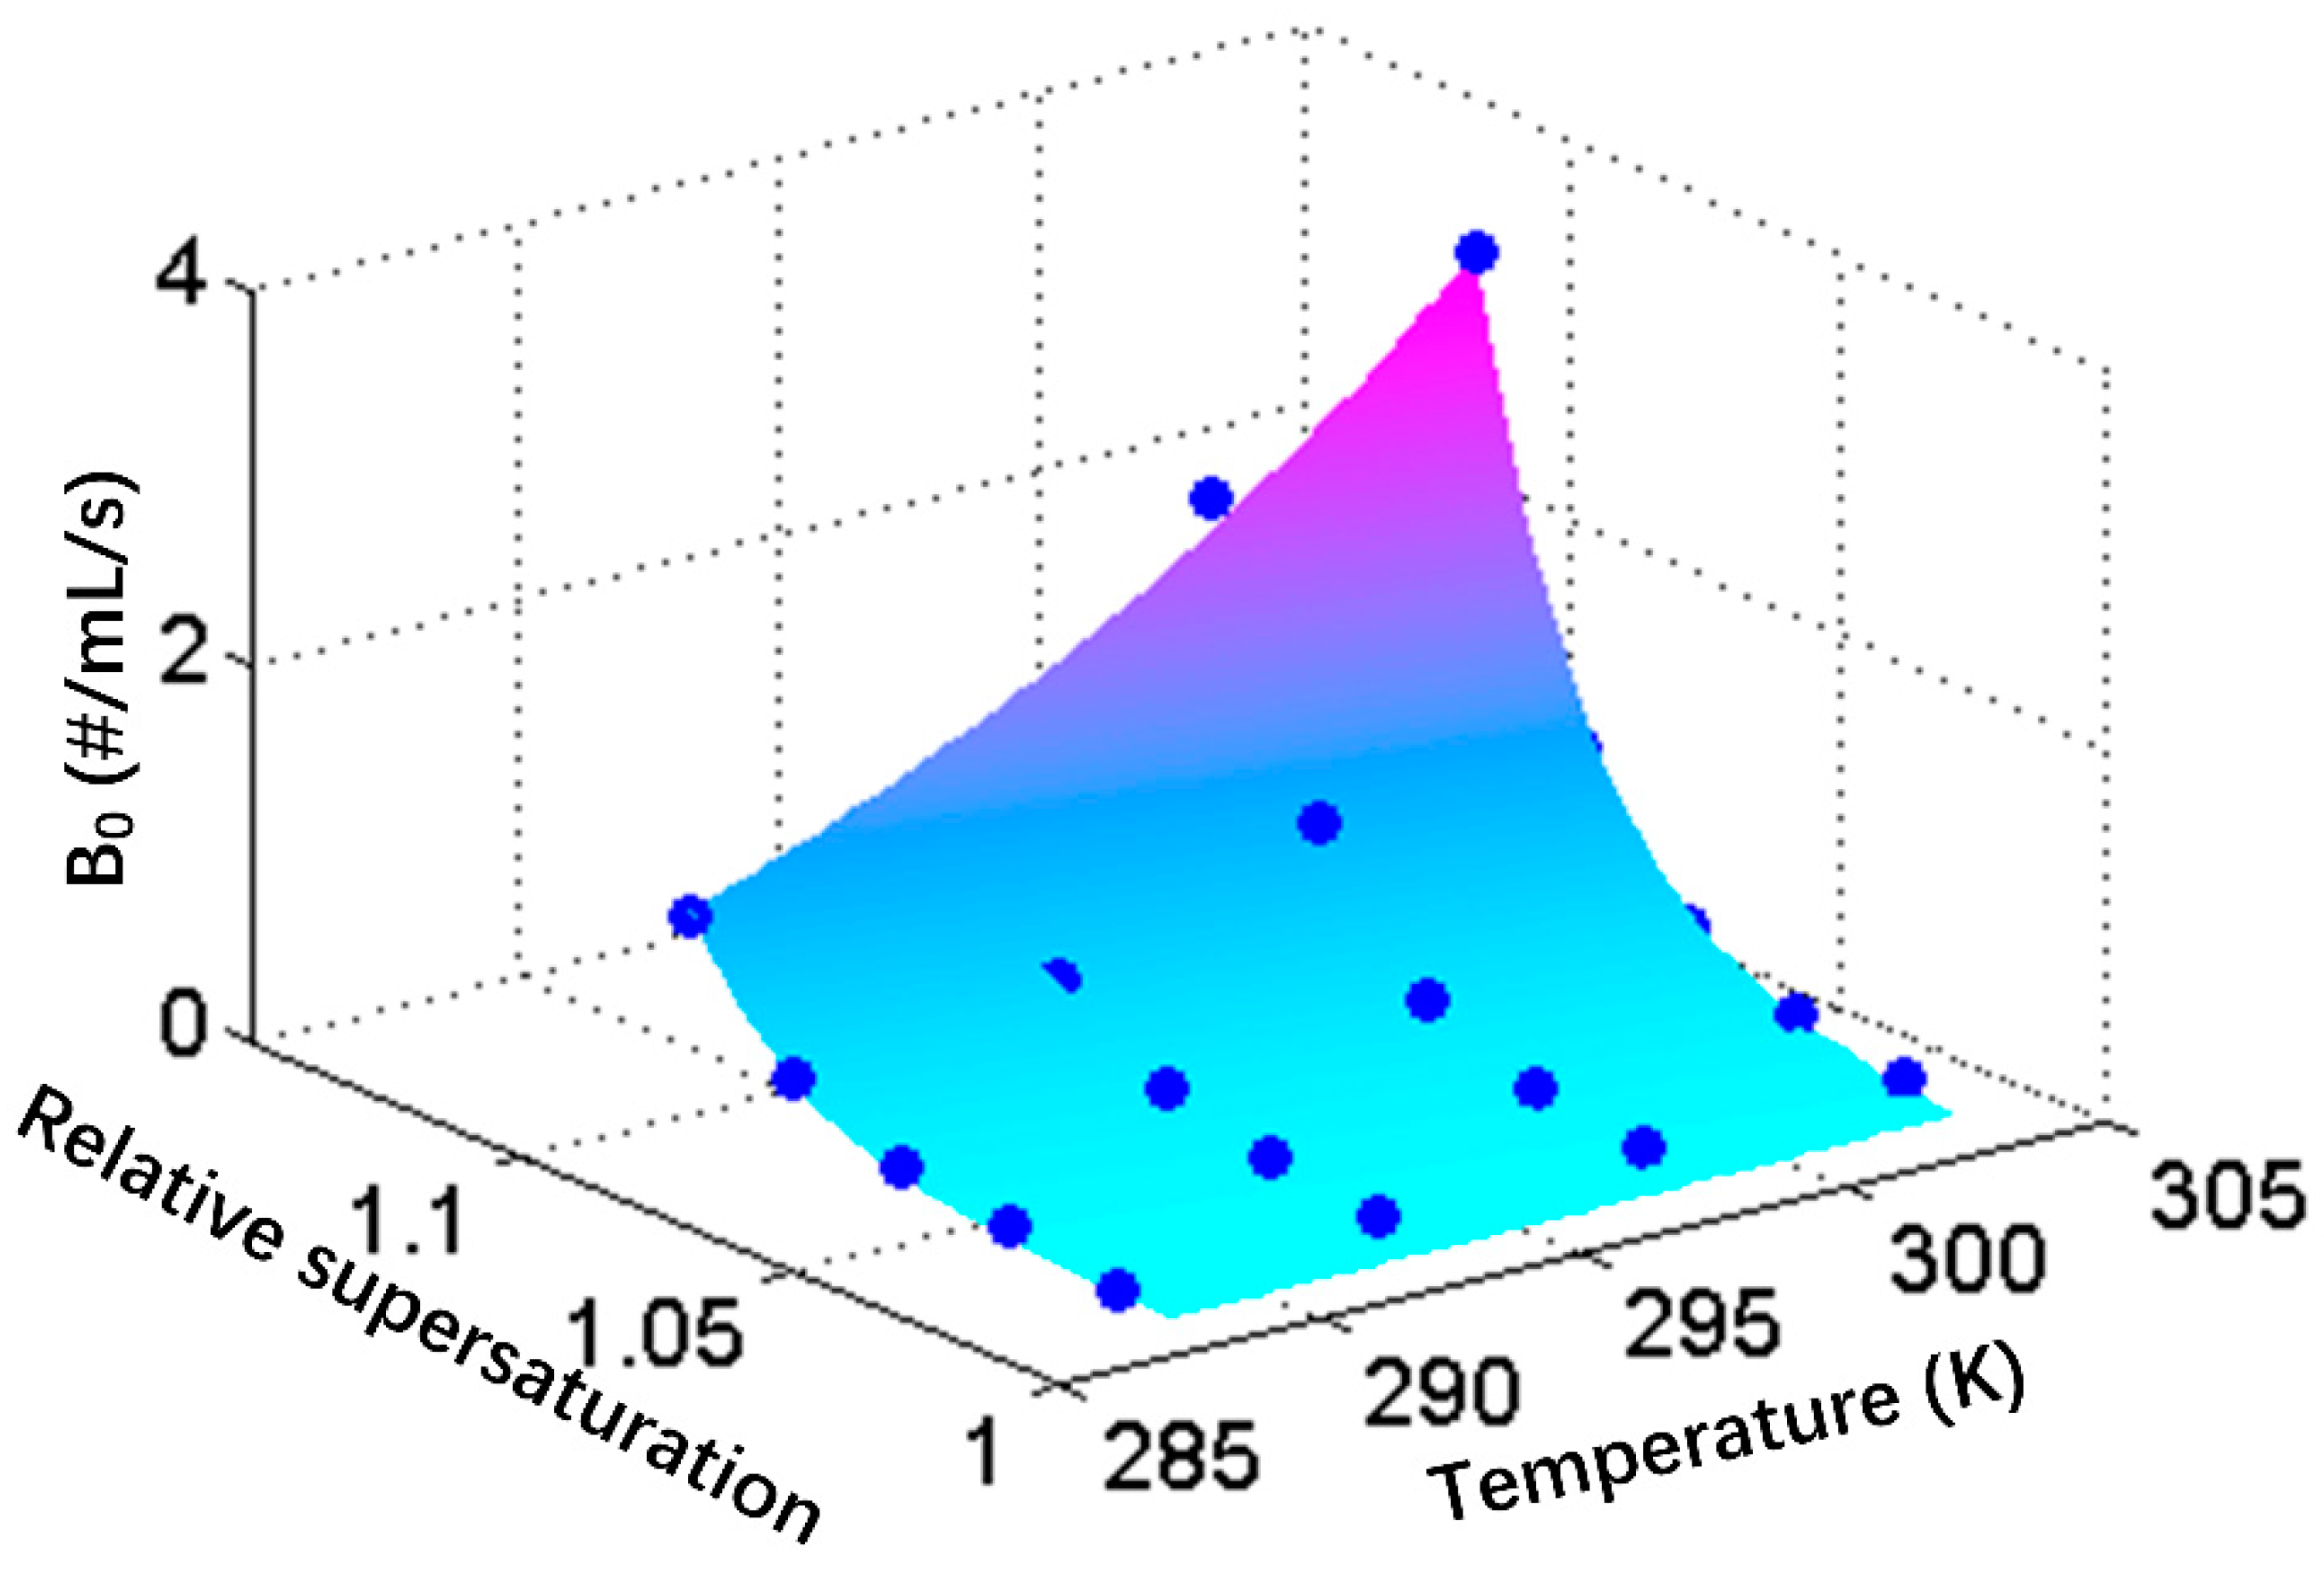
The final crystal suspension density,
Nf, of the system was calculated to explore the contributions of the two factors in promoting secondary nucleation, and the results are shown in
Figure 5b. At the same relative supersaturation level and different temperatures, the number of crystals varied slightly below the relative supersaturation level of 1.04. When the relative supersaturation level exceeded 1.06, the variation in the crystal number increased. Therefore, when the supersaturation was less than 1.04, the effect of temperature on secondary nucleation was mainly mediated by the increase in the crystal size; meanwhile, when the supersaturation exceeded 1.06, the increase in the number of crystals started to promote secondary nucleation rates as the crystal size increased.
3.2.2. Number of Crystal Seeds
In the present study, the average secondary nucleation rate and crystal seed number did not display an obvious correlation. The potential explanation for this finding is that the range of variation in the seed number was too small, i.e., 1–20 seeds, to exert a significant effect on the nucleation rate throughout the system. However, some researchers [
11,
38] have found that the increase in the number of seeds was presumed to exert a positive effect on the secondary nucleation rates. As the crystal growth competes with secondary nucleation in the consumption of the supersaturated solution, the presence of an excess number of seeds will shorten the nucleation process and reduce the number of nuclei.
3.2.3. Stirrer Speed
The secondary nucleation rates were found to increase with the stirrer speed, in a roughly linear manner. As the stirrer speed increased, the probability and strength of collisions between crystals, and between the crystals and agitator increased, which is a positive factor contributing to the increase in the secondary nucleation rates. Additionally, when the stirrer speed is greater than 275 rpm, the suspension system is mixed with bubbles. The interface between bubbles and the solution may more readily produce nuclei, which may also increase the secondary nucleation rates [
39].
3.3. Induction Time
3.3.1. Temperature and Supersaturation
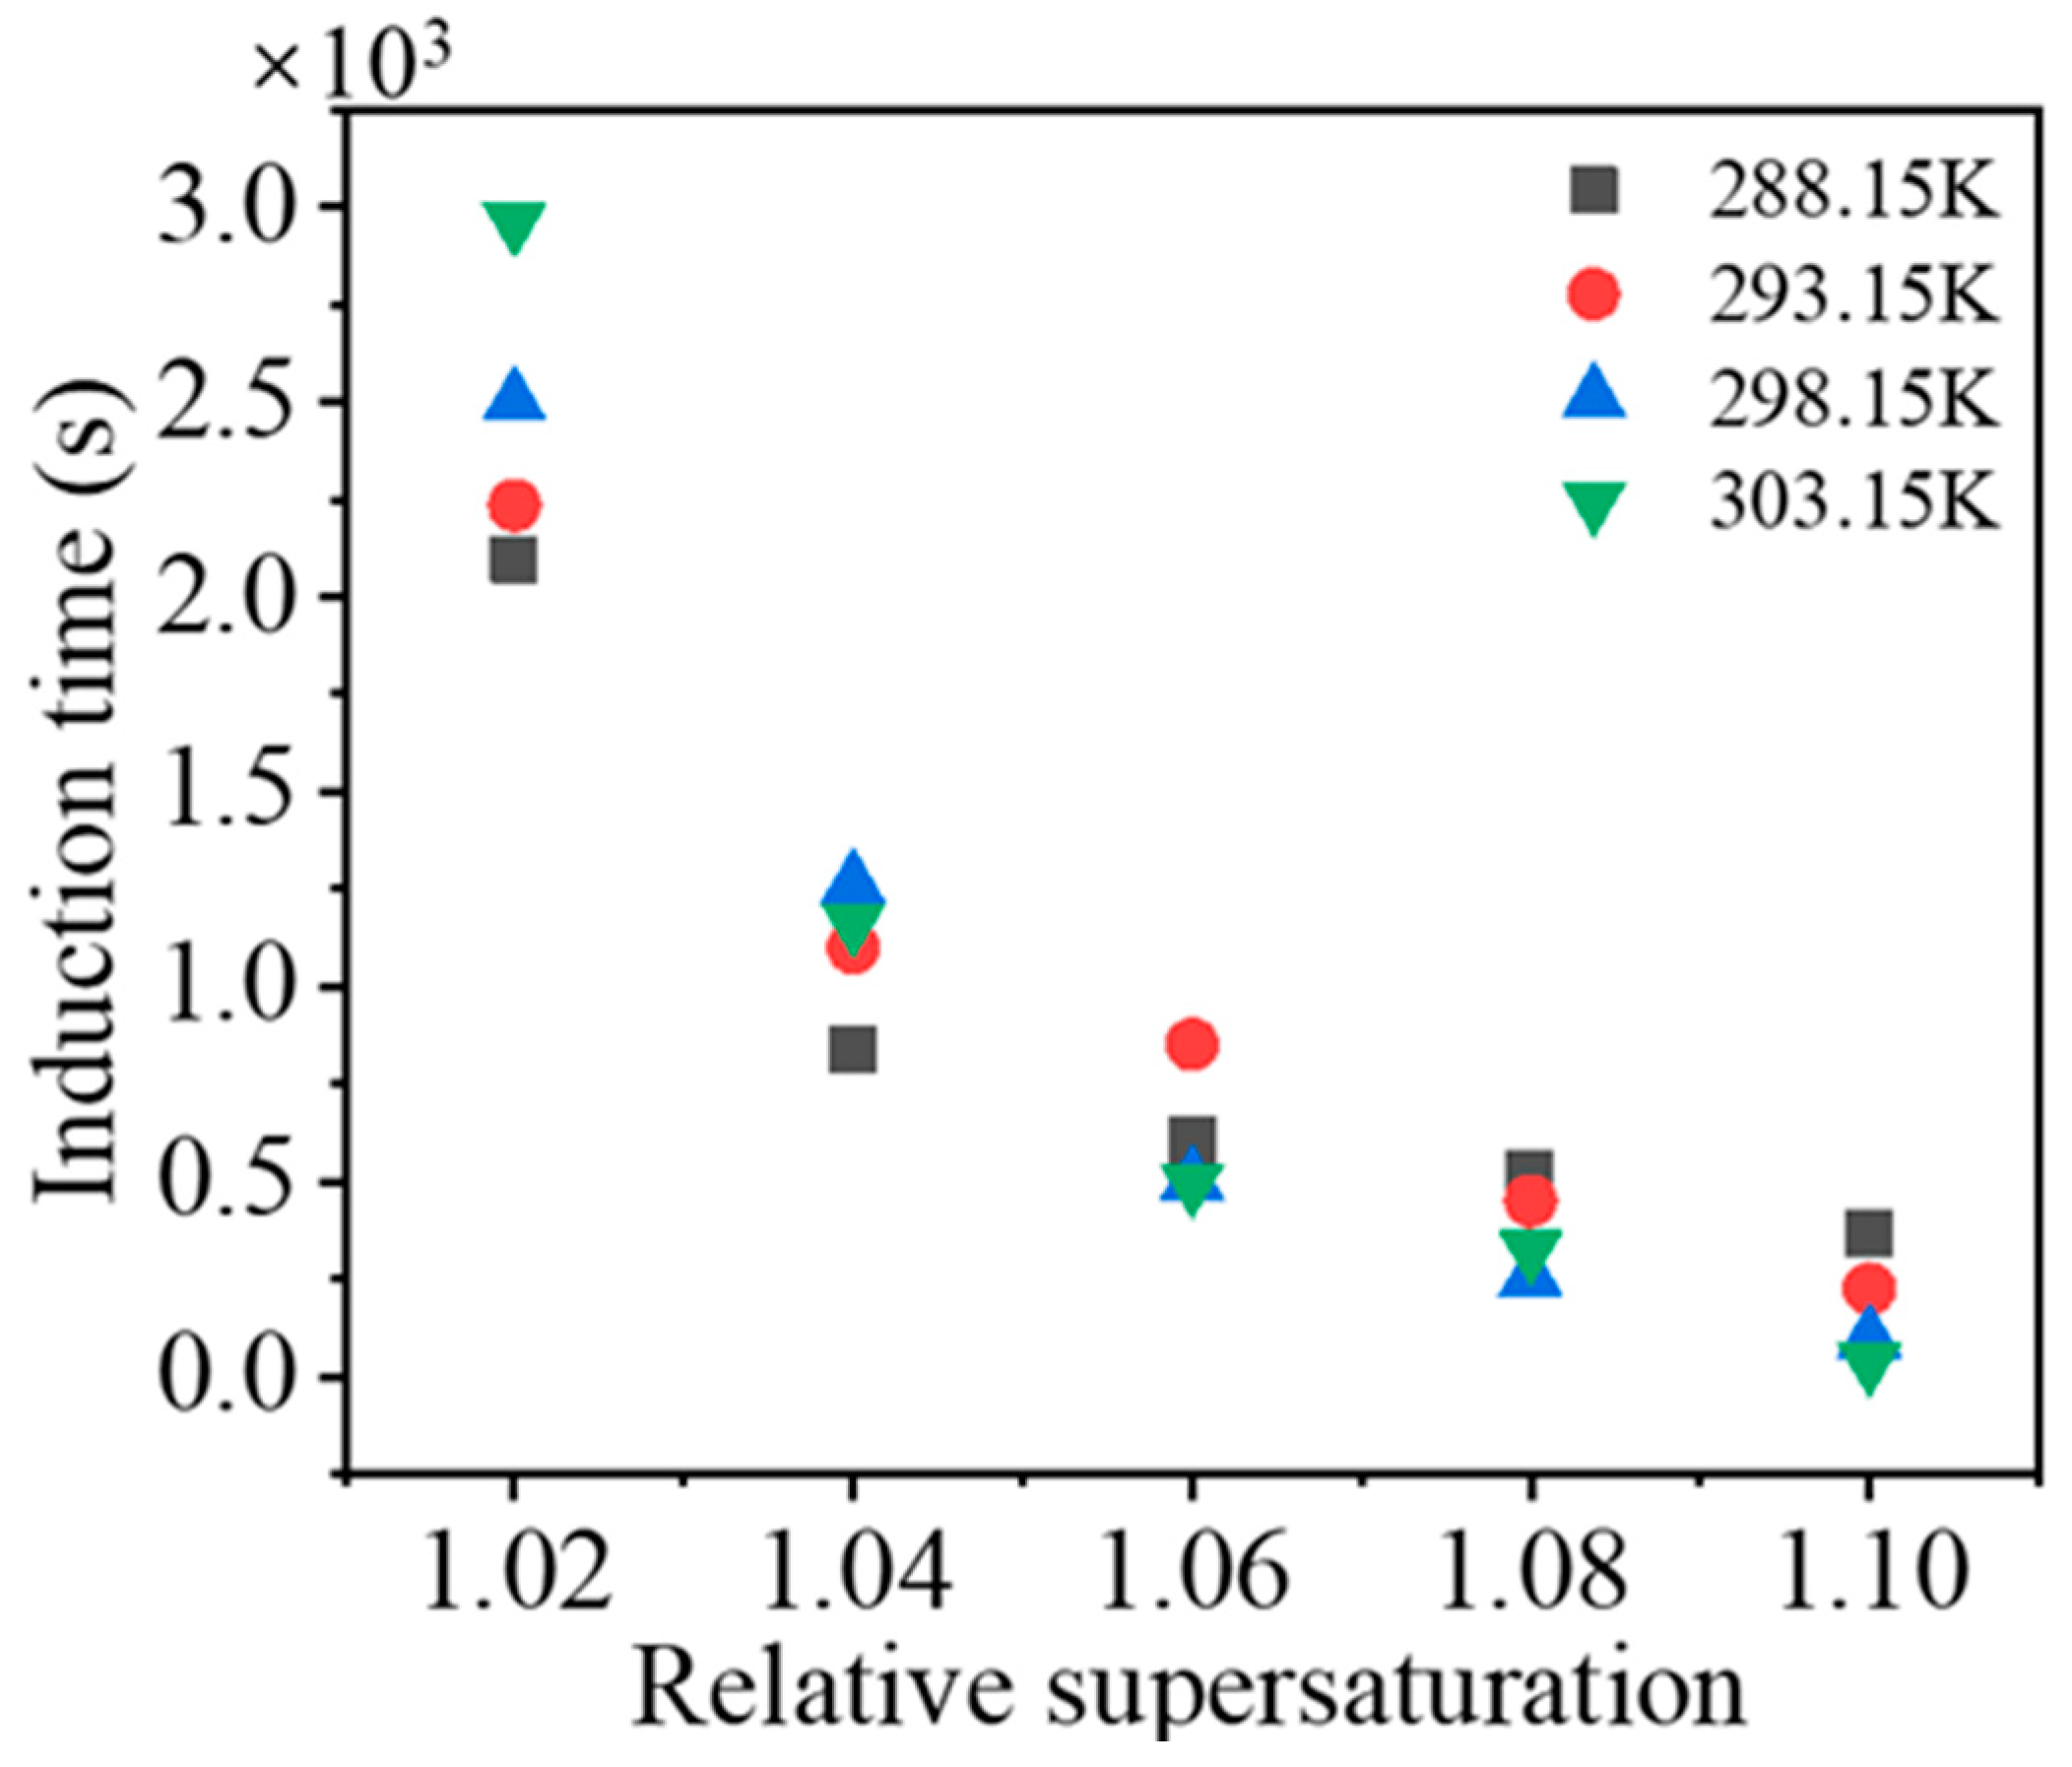
The induction times at different supersaturation levels and temperatures are plotted in
Figure 6. Before secondary nucleation occurs, the crystal seeds must go through a growth process. As the size of the seeds increases, the number of sites that can produce a small nucleus and strengthen the collisions between seeds and the agitator increases. Moreover, a higher supersaturation level facilitates surface nucleation. When the size or number of crystals increases to a certain value, a large number of nuclei appears, i.e., secondary nucleation occurs. At a certain temperature, the increase in supersaturation increases the growth rate of seeds, and thus the induction time is shorter. However, temperature exerts a complex effect on the induction time. At a low relative supersaturation level, an increasing temperature exhibits a positive correlation with the induction time, while the opposite result is observed for a high supersaturation level. At a high supersaturation level, surface nucleation may occur during secondary nucleation, and thus the positive effect of temperature on the growth of seeds promotes the initiation of secondary nucleation. However, the explanation for the effect of an increase in temperature on prolonging the induction time under low supersaturation conditions is not clear. The possible reason is that at low supersaturation levels, the probability of surface nucleation decreases. The higher density of the solution, caused by increasing the concentration of the solution at higher temperatures, increases the subsequent performance of crystals in the solution, which decreases the probability of collisions between crystals and the impeller.
3.3.2. Number of Crystal Seeds
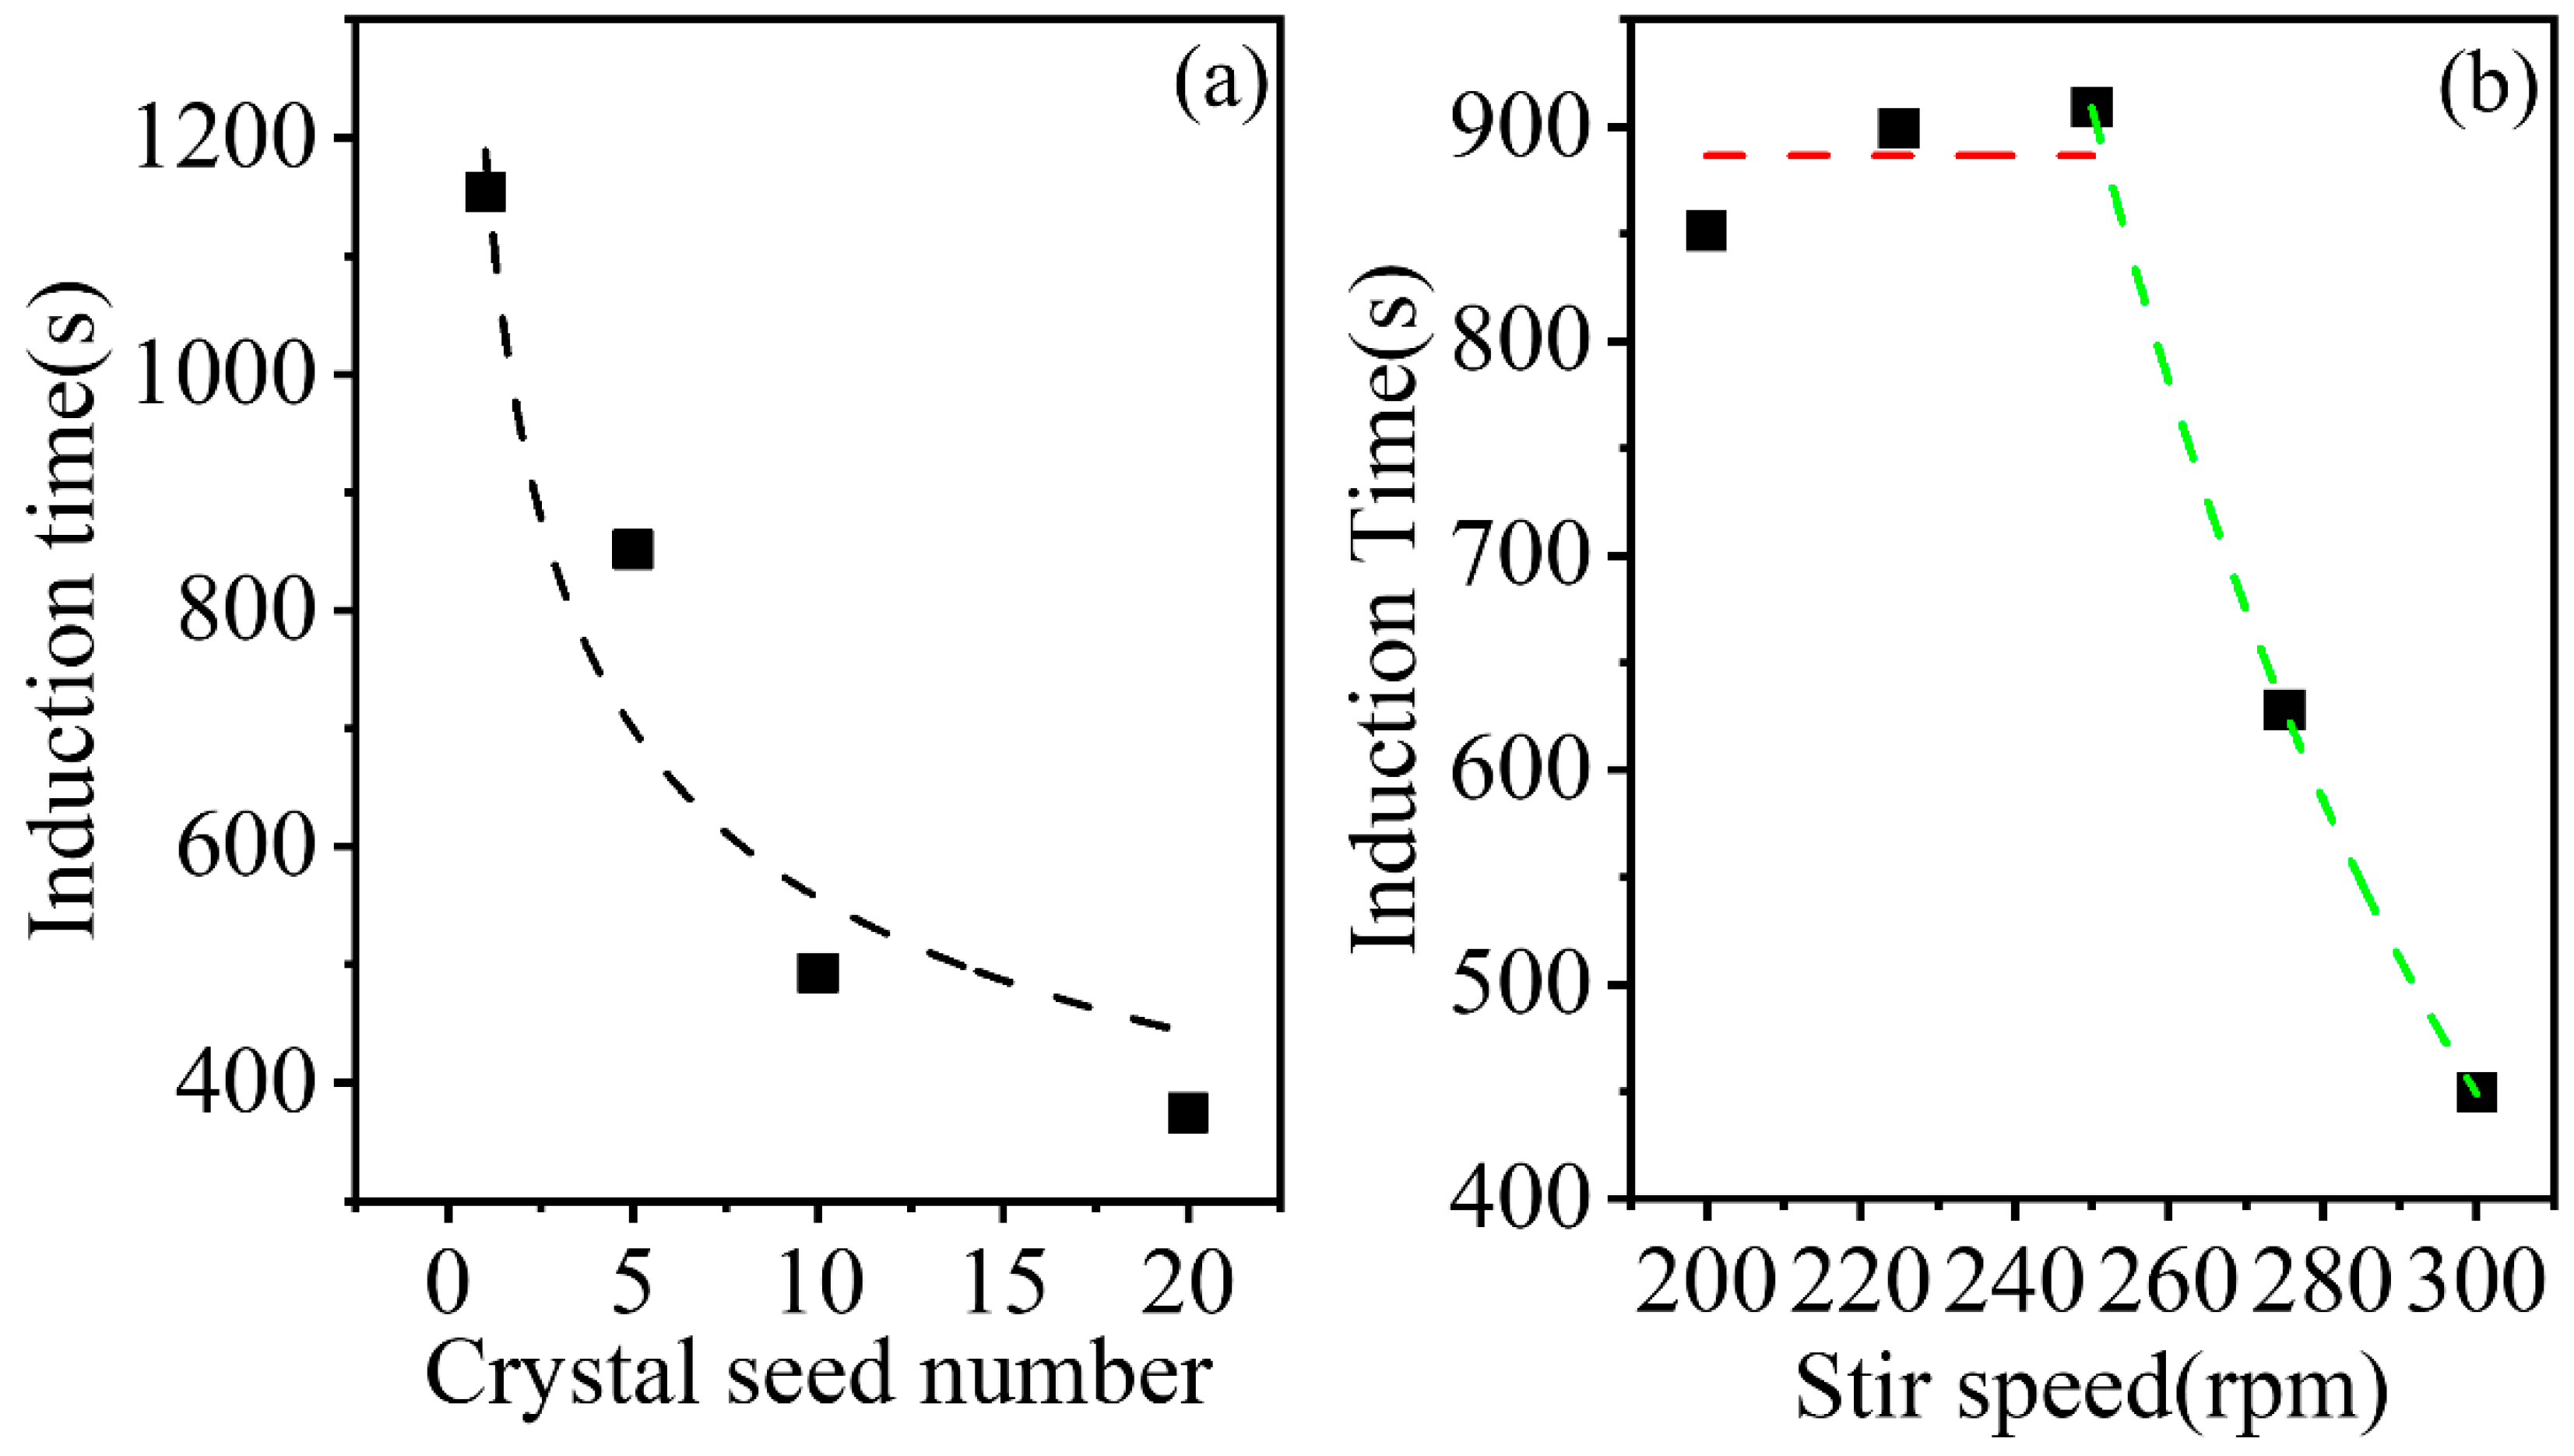
At a relative supersaturation level of 1.06 and a temperature of 293.15 K, the induction time of the solution with different seed numbers is shown in
Figure 7a. The slight increase in the number of crystal seeds did not affect the average secondary nucleation rate, but significantly reduced the induction time. As a few crystal seeds were added to the 250 mL solution, the collisions between crystals, and between crystals and the agitator, could be ignored prior to secondary nucleation. However, the available area for generating nuclei increases as the crystal seed number increases, which may be responsible for the decrease in the induction time observed. Based on these findings, the available crystal area for generating nuclei plays an important role in inducing secondary nucleation.
3.3.3. Stirrer Speed
The effect of the stirrer speed on the induction time is shown in
Figure 7b. At a stirrer speed less than 250 rpm, a slight increase in the induction time was observed as the stirrer speed increased, which was postulated to be due to the error between experiments in this study. At a stirrer speed greater than 250 rpm, the induction time decreased as the stirrer speed increased. The result is in aggrement with that of Barata [
40] and Kobari [
41]. Kobari thought the crystal proportion formed by secondary nucleation reaches a certain proportion of the total crystal that can be detected, the induction time will decrease by power law with the increase of stirring rate. When the stirrer speed is low, the crystals can only be formed on the surface of crystal seeds, which may not influence the induction time a lot. However, when the agitation strength are large enough, the collisions can also produce enough nuclei to reduce the induction time. For the AIBN-methanol system analysed in the present study, the critical agitation rate is 250 rpm.
3.4. Final Crystal Suspension Density
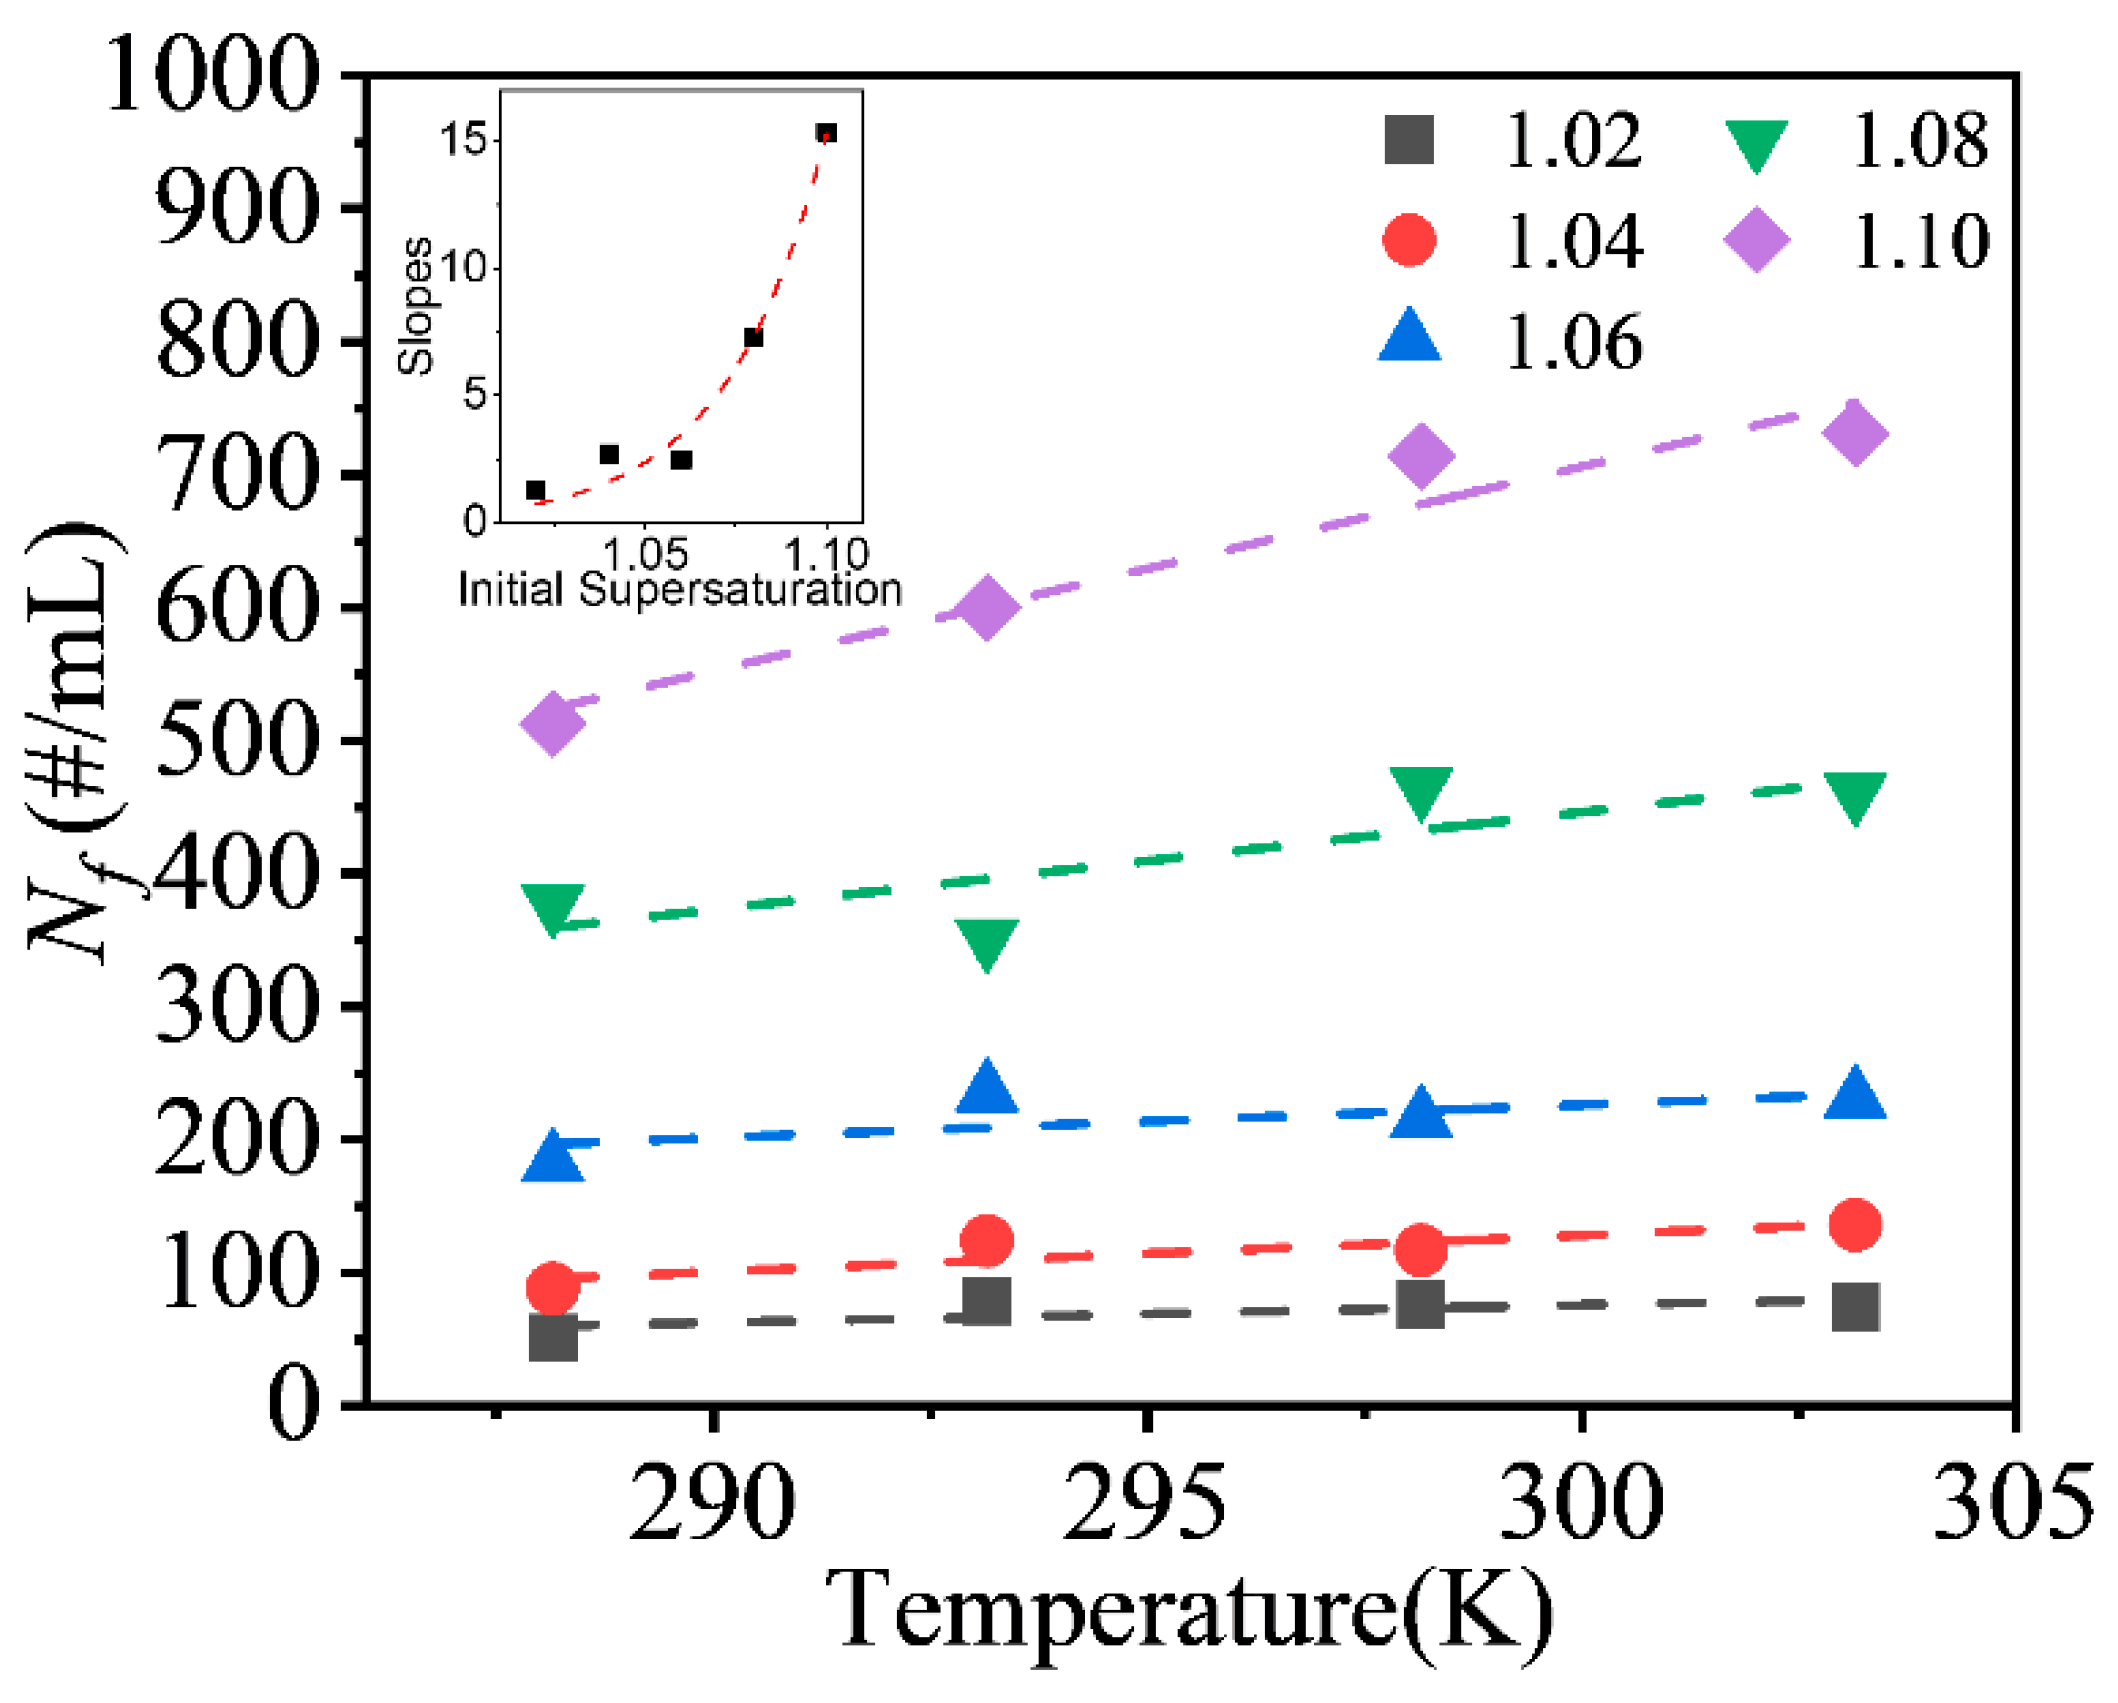
The effect of the operating parameters of the experiments on the final crystal suspension density, Nf, will be discussed in this section. The initial supersaturation level and the temperature of solution exerted obvious effects on the final crystal suspension density. The crystal seed number and stirrer speed did not exert obvious effects on the final crystal suspension density at the range tested in the experiment.
The final crystal suspension density determined in the experiments conducted at different temperatures and supersaturation levels are already shown in
Figure 5b. As discussed in
Section 3.2.1,
Nf substantially increased with the supersaturation level. The temperature also exerted a positive effect on the final crystal suspension density, but the effect increased at a relative supersaturation level greater than 1.06. As shown in
Figure 8, the effect of temperature on the final crystal suspension density was linear, and the strength of the effect, i.e., the slopes of the linear fitting line, increased with increasing supersaturation. At higher supersaturation levels, the increase in the absolute supersaturation of solutions per unit temperature increase was greater, which might be responsible for the increase in the effect.
Assuming that the supersaturation was completely consumed in each experiment, with a known initial supersaturation level and final crystal suspension density, the average mass of a signal crystal can be estimated, as shown in
Figure 9. In
Figure 9, the average mass or volume of the single crystal reached the largest value at the supersaturation level of 1.04 for each temperature. When the supersaturation level was greater than 1.04, the average mass of the single crystal decreased with supersaturation. Based on these findings, the competition between crystal growth and secondary nucleation depends on the relative supersaturation level, but not the absolute supersaturation level. When the relative supersaturation level was less than 1.04, the increase in supersaturation favoured crystal growth, but the opposite result was observed for a relative supersaturation level greater than 1.04. The crystal mass tended to increase with the temperature, indicating that an increase in temperature substantially increases the crystal volume compared to the final crystal suspension density. In other words, the increasing temperature promotes crystal growth during competition. The rule is in aggrement with that of Ishikawa et al. [
42] and Barlow et al. [
43]. Notably, the positive correlation was not strong. The masses of single crystals in experiments conducted at 293.15 K and relative supersaturation levels of 1.02 and 1.04 were lower than that in experiments conducted at 288.15 K and the corresponding supersaturation levels, indicating that some other influencing factors might exist in this study.
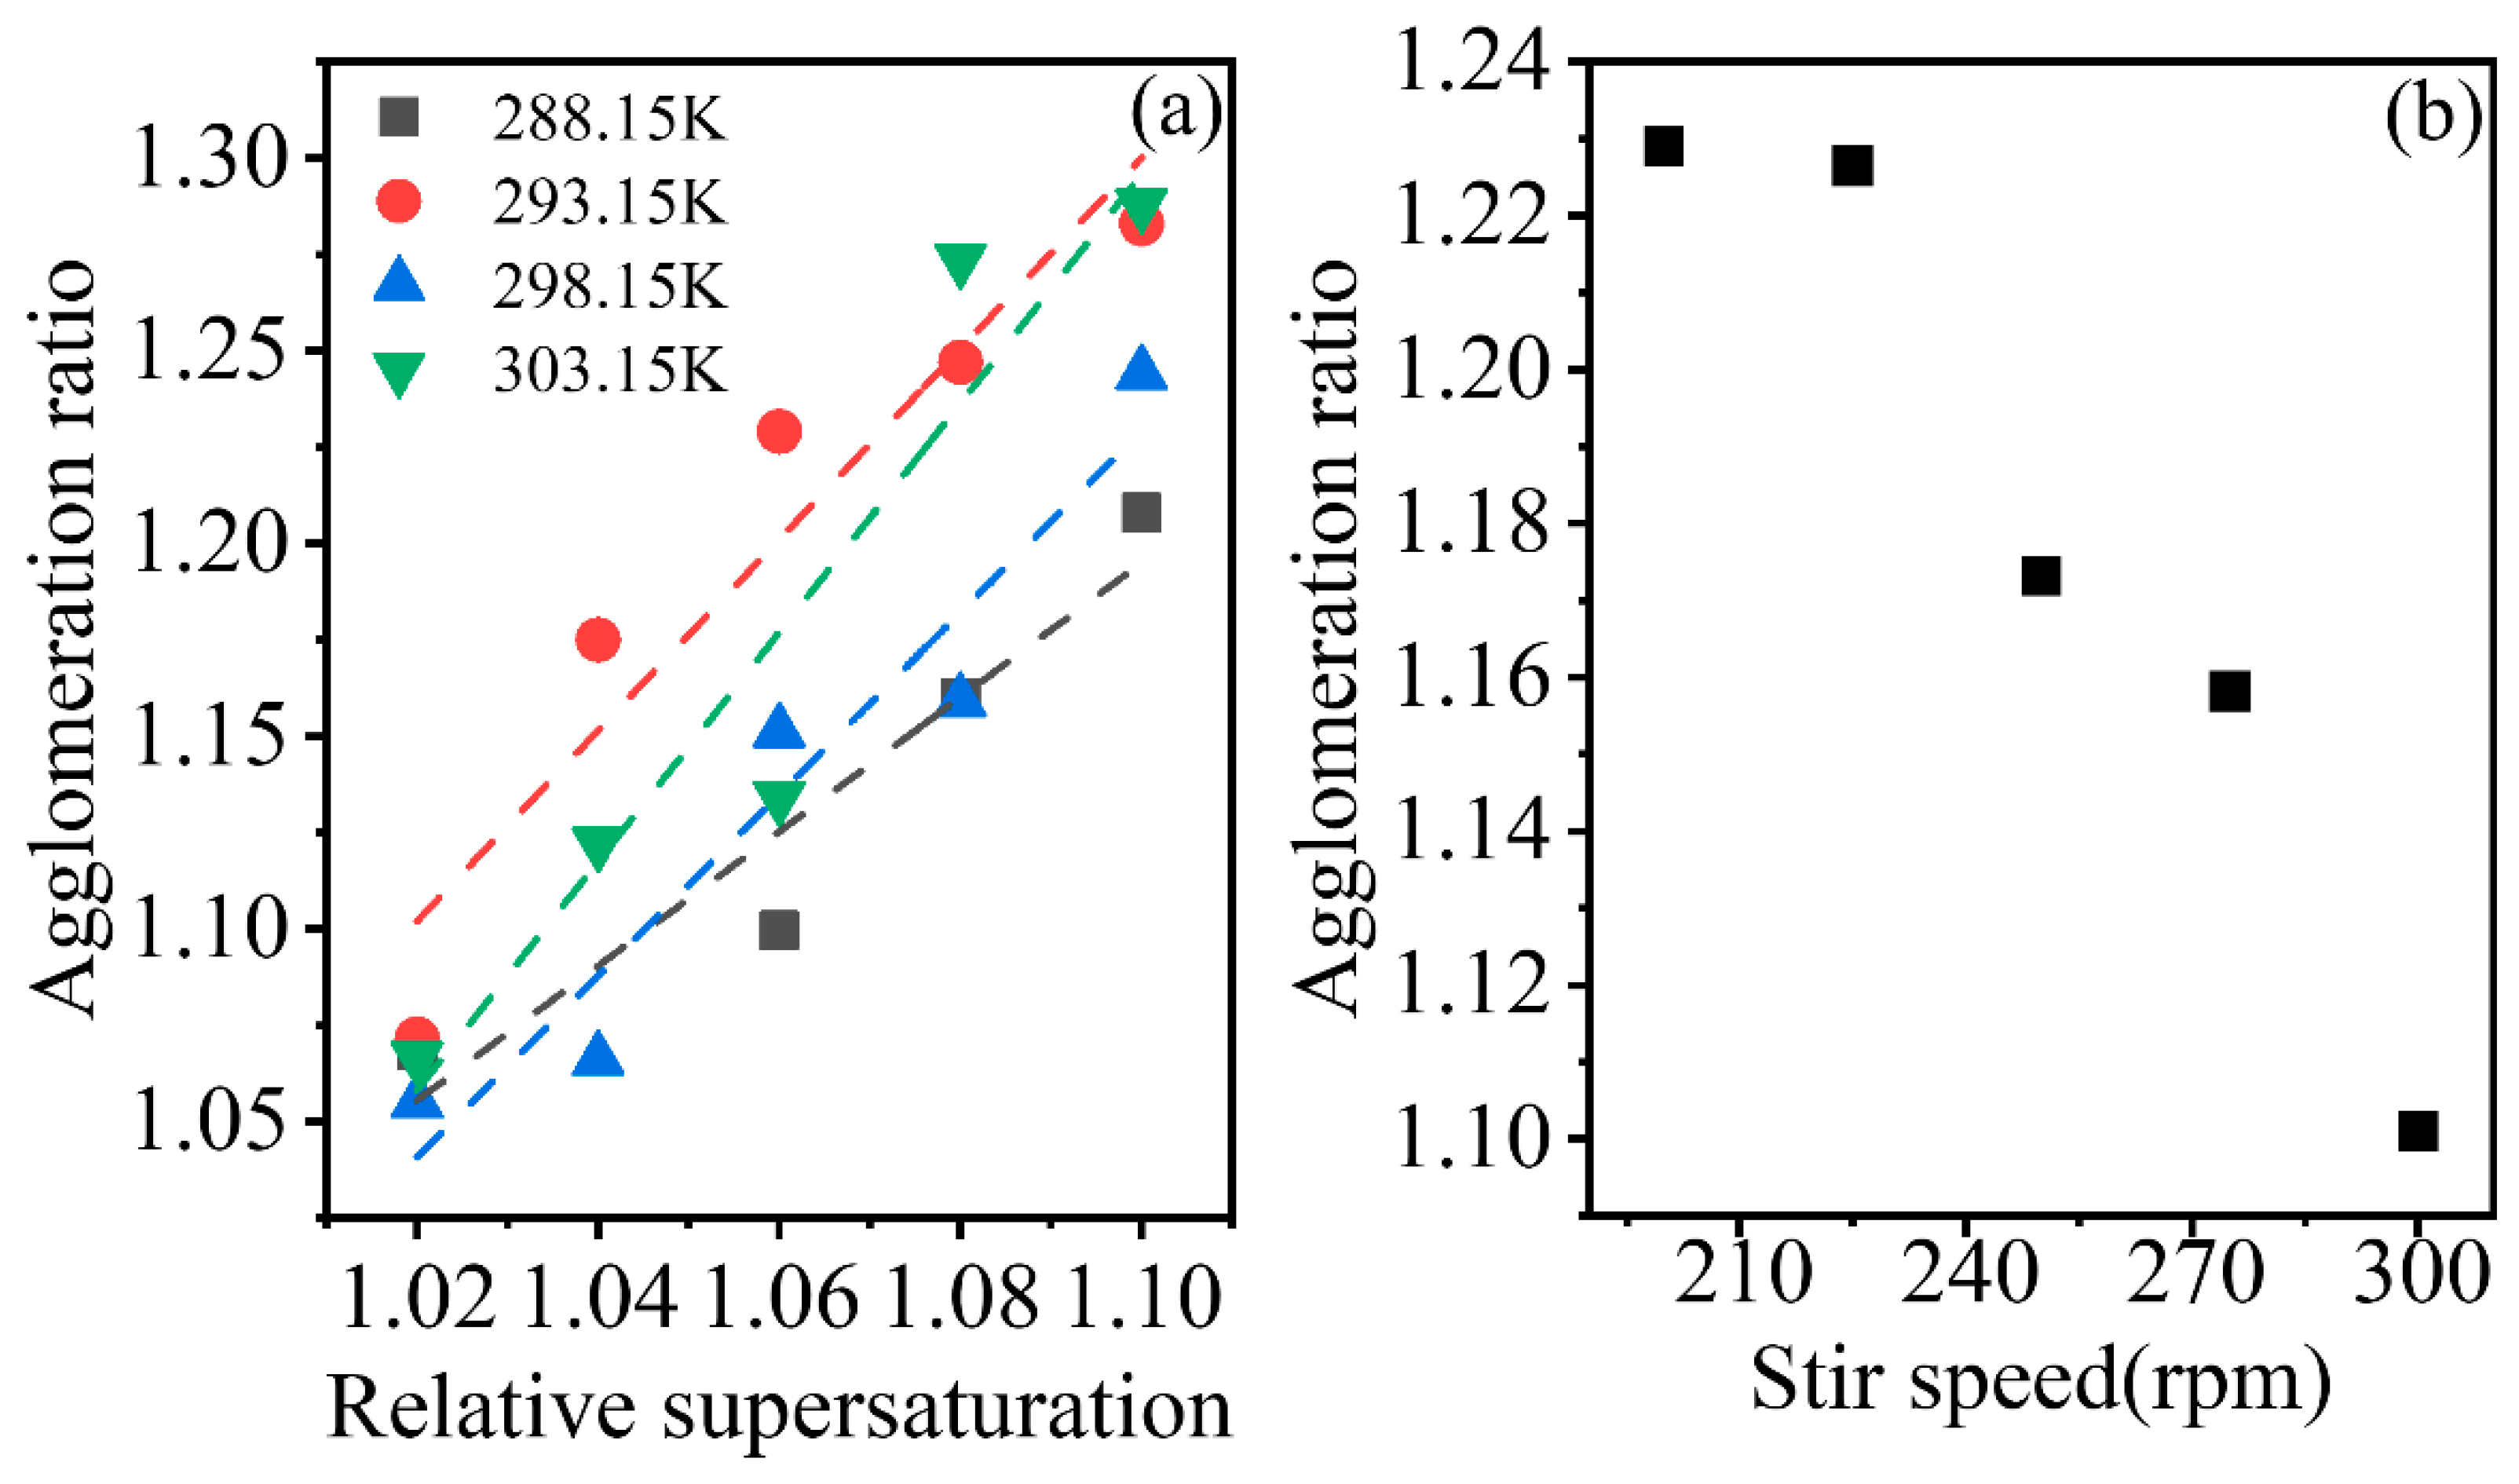
3.5. Agglomeration Behaviour
As shown in
Figure 10a, the agglomeration ratio has shown to increase with the initial supersaturation. At higher initial supersaturation, the increased crystal number led to the possibility of increased collisions between crystals, and larger crystal growth rate enables the crystals to adhere easily during collision. The two factors could have increased crystal agglomeration behaviour in crystallization.
The negative effect of the stirrer rate on the agglomeration ratio was shown in
Figure 10b. At high crystal suspension density, an increase in the strength of collisions disrupted the aggregates easily and shortened the contact time of crystals, which might lead to the decrease of agglomeration ratio as stirrer speed was increased.
4. Models
The measured secondary nucleation rates, induction time and final crystal suspension density, can be correlated with operational conditions, but based on the experimental results, the agglomeration ratio showed more disorder. Thus, the randomness of agglomeration behaviour was stronger, or other factors that were not analysed in this study influenced the agglomeration behaviour, and therefore the agglomeration ratio was not fitted in this study.
4.1. Secondary Nucleation Rates
Among the models describing secondary nucleation, surface nucleation model [
30,
31,
44] and crystal groth rate scale model [
45,
46] considered the effect of temperature on secondary nucleation.
The surface nucleation model [
30,
31,
44] was proposed to express the secondary nucleation caused by crystal surface, and indicates that the secondary nucleation rate increases with the temperature and supersaturation level according to Equation (5),
where
,
T, and
s denote the secondary nucleation rates caused by surface nucleation, absolute temperature, and relative supersaturation, respectively.
and
are parameters to be fitted.
Some researchers have postulated the crystal growth rate scale model, which insists that the secondary nucleation rate is proportional to the crystal growth rate [
45,
46,
47], as shown in Equation (6),
where
,
, and
σ are the secondary nucleation rates, nucleation activation energies, relative supersaturation level defined by ‘s-1’, which can be replaced by initical supersaturation, s.
In the simulation of the average nucleation rate at fixed crystal seeds and stirrer speed, Equation (6) has a better performance with a RMSE = 0.0909, while Equation (5) has a RMSE = 0.3049. However, Equation (6) has a premise that the secondary nucleation occurs at a fixed agitation rate. In fact, the secondary nucleation has a power law relationship with stirrer speed according to the empirical power law equation [
27,
28]. So finally the average secondary nucleation rate can be expressed as Equation (7),
The fitting results of Equation (7) is summarised in
Table 2. The nucleation activation energy
= 57.42 kJ/mol.
The measured and predicted secondary nucleation rates of AIBN in methanol at fixed crystal seeds number and stirrer speed using Equation (7) are plotted in
Figure 11. Most predicted secondary nucleation rates have an error of less than 20%. At low supersaturation levels, the relative errors of the predicted values are larger, up to 62.4%. At low supersaturation levels, the insoluble impurities might lead to larger errors in the crystal counting process, which might be responsible for the large error at low supersaturation levels.
4.2. Induction Time
Kubota [
48] thought that in the seeded crystallization under a certain temperature, induction time is in such a relationship with supercooling as
. At small temperature range, the solubility can be approximately considered linear, and therefore
can be replaced by initial supersaturation,
s. After formula transformation, Equation (8) can be obtained,
where
b represent the strength of the influence of initial supersaturation on induction time.
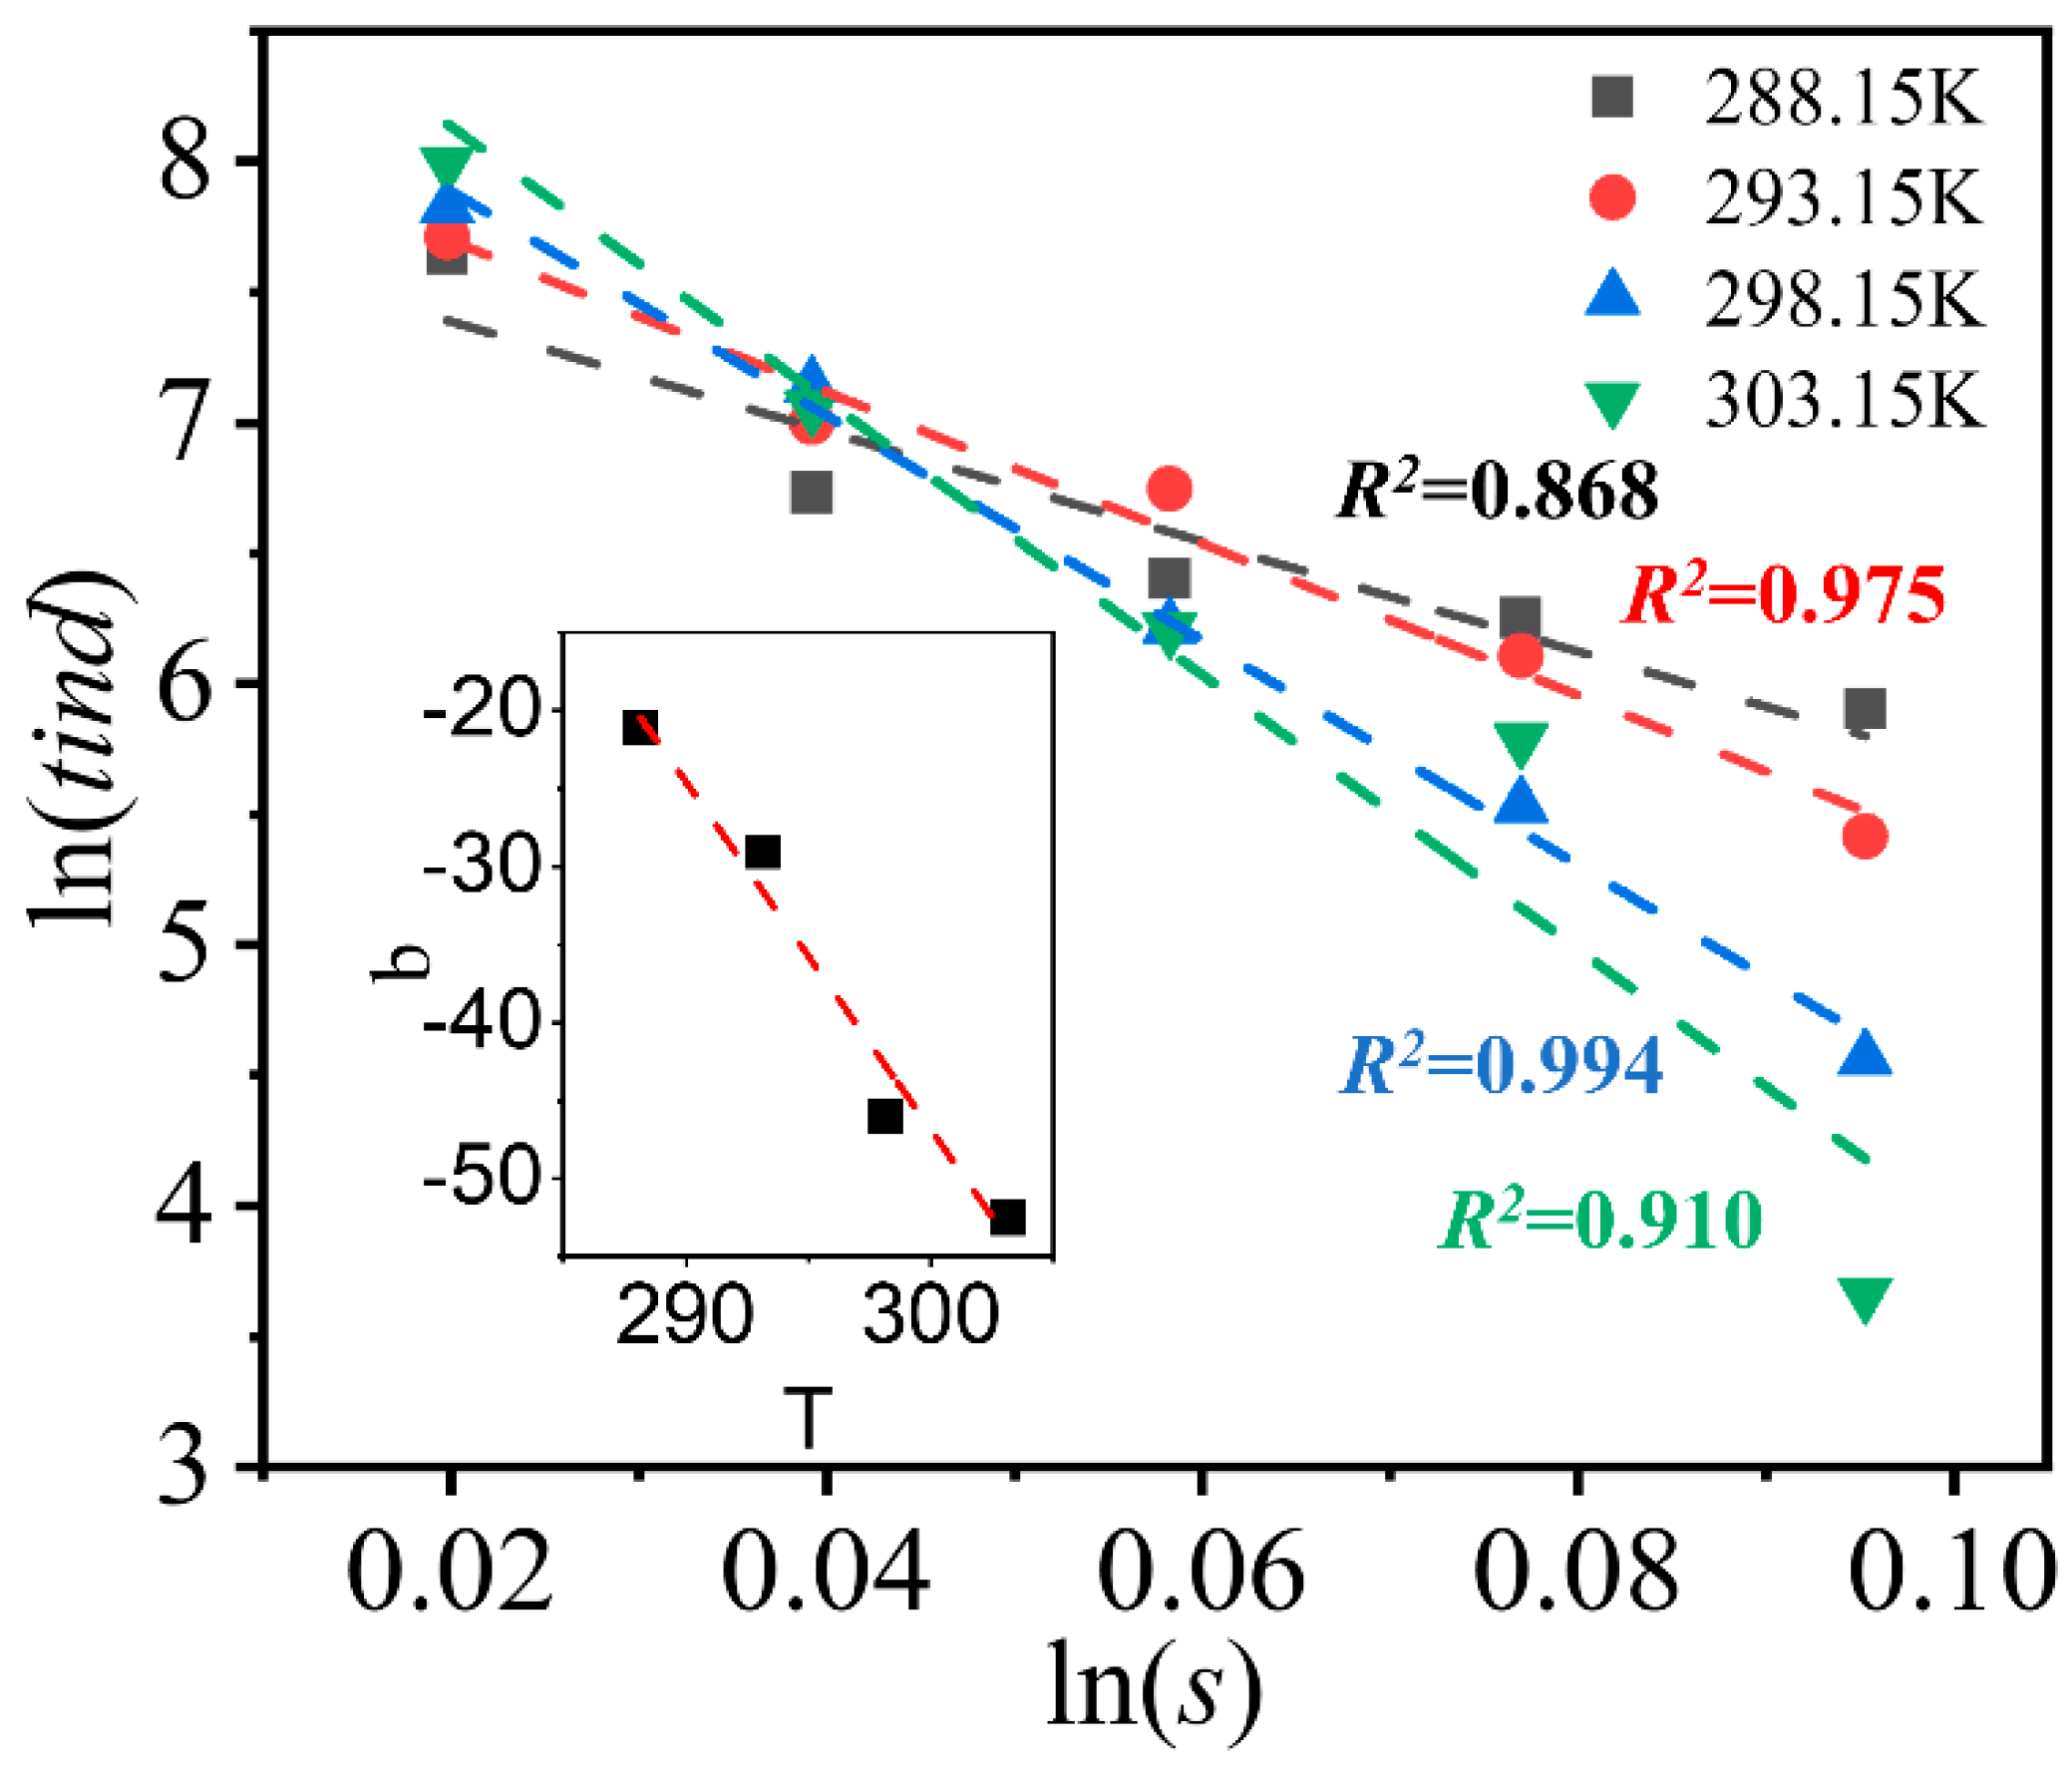
Figure 12 shows the relationship between
and ln(
s) under different temperature. The slope,
b, is linear with the temperature, and the intercept, a, is less affected by temperature. The increasing effect of initial supersaturation on induction time at higher temperature may be caused by that the high molecular kinetic energy enhances the frequency and intensity of atoms at high temperature. Adding the influence of temperature on induction time and make a transformation, we obtain the following formula,
The induction time is thought to have a power relation with the crystal seeds number based on the analysis of the results in the studies of us, Chien et al. [
49] and Choi et al. [
50]. According to the study of Kobari et al. [
41], a stirrer speed greater than a value, i.e., 250 rpm here, exerts a power-law effect on the induction time. The final formula used to calculate the induction time is shown in Equation (10),
where N, V,
T and
W denote the crystal seed number, solution volume, absolute temperature and stirrer speed, respectively.
K,
A,
B,
K’, γ and
are parameters to be fitted. To be noticed, the critical stirrer speed might be different for different system and operation.
The fitted parameters are shown in
Table 3.
Finally, the fitting results for the induction time are shown below in Equation (11):
The predicted induction time has an error of less than 15% when it is greater than 1000 s, but when the induction time is less than 1000 seconds, the deviation of the fit becomes larger, indicating that the self-built induction time model is a better quality model at low supersaturation levels. At high supersaturation levels, the effect of the insoluble impurities on the induction time becomes more obvious, which may lead to the larger error in the self-built induction time model at high supersaturation levels.
4.3. Final Crystal Suspension Density
The crystal seed number and stirrer speed do not exert obvious effects on the final crystal suspension density within the experimental range, and thus, only the relationships between the final crystal suspension density and initial supersaturation level and temperature were fitted here using self-built final crystal number model.
The new formed nuclei are usually regard to have the same size [
11,
51], thus the final crystal suspension density can be calculated by Equation (12),
where
,
,
V and
represent the absolute supersaturation, the proportion of
used for secondary nucleation, crystal density, solution volume and volume of single crystal nucleus, respectively.
In the narrow temperature range, the solubility curve can be regard as linear.
Figure 5b shows that the final crystal suspension density seems to have a power relationship with the initial supersaturation level, indicating that
has a power law relationship with initial supersaturation. Thus, Equation (12) can be transformed to Equation (13);
where
is the slope of solubility curve at the range from
T0 to
T*.
T0 and
T* are experimental and saturated temperature. Thus,
should be a function of temperature. According to
Figure 8, the temperature exhibits a linear relationship with the final crystal suspension density at each supersaturation level, thus we can obtain the final expression of
as Equation (14),
where
Nf,
s and
T are final crystal suspension density, initial relative supersaturation level and absolute temperature, respectively.
A,
B, and
C are parameters to be fitted.
The fitted parameters are shown in
Table 4. The predicted
Nf values display an error of less than 23% at the range over 70 #/mL. For the
Nf values greater than 250 #/mL, the error was reduced to approximately 15%, which was thought to be acceptable in this study.
Based on the predicted induction time, average secondary nucleation rates and final crystal suspension density, the time required for the whole seed addition and the supersaturation-consuming process can be estimated. Additionally, the self-built secondary nucleation rate model and self-built final crystal number model may also be appropriate for the unseeded crystallizaiton at a certain supersaturation level, because the primary nucleation process was recently proposed to be a process in which one or more stable crystal species are initially formed in solution, and then the formed small crystals produce a large number of crystals through secondary nucleation [
2,
52]. However, additional studies are needed to confirm this hypothesis.
5. Conclusions
Based on the calibration line between the number of crystals in the camera view and crystal suspension density in the suspension system, the induction time for the secondary nucleation process, after seed addition, was observed using on-line microscopic imaging technology. Some kinetic parameters of the secondary nucleation process, such as the average nucleation rate, induction time, and agglomeration ratio, were measured. Increases in the initial supersaturation level, temperature and stirrer speed exerted positive effects on the average secondary nucleation rate, and a slight variation in the number of crystal seeds amount did not produce an obvious effect. An increase in the initial supersaturation level and crystal seed number decreased the induction time, and the stirrer speed only promoted the initiation of secondary nucleation when it was greater than 250 rpm. Increases in the initial supersaturation level and temperature exerted obvious positive effects on the final crystal suspension density, whereas the crystal seed number and stirrer speed did not exert obvious effects. Regarding the agglomeration behaviour, an increase in the initial supersaturation level increased the agglomeration ratio, while the stirrer speed produced the opposite results. Finally, based on the calculated data, the relationships between the average secondary nucleation rate, induction time, final crystal suspension density, and operating conditions, including the initial supersaturation level, temperature, stirrer speed, and crystal seed number, were fitted using self-built models. Based on the predicted induction time, average secondary nucleation rates, and final crystal suspension density, the time required for the whole seed addition and the supersaturation-consuming process was estimated.
The induction time, average secondary nucleation rate and final crystal number in the crystal seed addition process can be predicted using the models built in this study. Some findings could provide help for crystallization optimization. For example, the effect of increasing the initial supersaturation on the final crystal quantity was more significant than changing the stirring rate; a small increase in the number of crystal seeds could greatly reduce the induction time.


