Article

Effect of Chitosan Electrospun Fiber Mesh as Template on the Crystallization of Calcium Oxalate

by
Nicole Butto
1,
Nicole Cotrina Vera
1,
Felipe Díaz-Soler
1,
Mehrdad Yazdani-Pedram
2 and
Andrónico Neira-Carrillo
1,*
1
Department of Biological and Animal Sciences, Faculty of Veterinary and Animal Sciences, University of Chile, Santiago, Santa Rosa 11735. La Pintana, 8820808 Santiago, Chile
2
Department of Organic and Physical Chemistry, University of Chile. S. Olivos 1007. Independencia, 8380544 Santiago, Chile
*
Author to whom correspondence should be addressed.
Crystals 2020, 10(6), 453; https://doi.org/10.3390/cryst10060453
Submission received: 18 March 2020 / Revised: 10 May 2020 / Accepted: 11 May 2020 / Published: 31 May 2020

Abstract

:
Biominerals fulfill various physiological functions in living organisms, however, pathological mineralization can also occur generating mineral pathologies such as the formation of calcium oxalate (CaOx) calculi in the urinary tract. Inspired by the ability of living organisms to generate biogenic minerals using biological organic matrices, and the need to understand the mechanisms of crystallization, three-dimensional fibrillary meshes based on chitosan fibers with random and controlled topology by electrospinning were manufactured. Chitosan was selected due to its active role on in vitro crystallization and its physicochemical properties, which allows the exposure of their functional chemical groups that could selectively stabilize hydrated crystalline forms of CaOx. CaOx crystals were generated on conductive tin indium oxide (ITO) glass substrates modified with electrospun chitosan fibers by using electrocrystallization (EC) technique. The chitosan fibers and the resulting CaOx crystals were analyzed by optical microscopy (OM), scanning electron microscopy (SEM), and X-ray diffraction (XRD) techniques, which demonstrated that the chemical nature and topology of the three-dimensional fibers used as organic template are key factors in the control of type, morphology, and crystallographic orientation of CaOx.

1. Introduction

In nature, there are living organisms capable of generating highly hierarchical hybrid materials formed by minerals and organic components called biominerals with precise control of size, texture, crystallinity, and composition at the molecular level [1,2]. Calcium is the most abundant element among biominerals forming part of carbonates and oxalates [3]. One of the most interesting mineral is calcium oxalate (CaOx) which has three hydrated forms: monohydrated CaOx (COM, CaC2O4⋅H2O), dihydrated CaOx (COD, CaC2O4⋅2H2O), and trihydrated CaOx (COT, CaC2O4⋅3H2O) [4]. CaOx fulfills various functions in living organisms [5], however, COM is involved in kidney stones in the urinary tract in animals [6]. It is known that the presence of this crystal is not attributed exclusively to the pathology since it is also possible to find COM in healthy individuals. This situation occurs due to the inhibitory effect of compounds such as citrate, a molecule rich in carboxyl groups, present in the urine, which interacts with specific crystalline phases preventing the pathological formation of kidney stones [4,5,6,7]. It is known that functional chemical groups of organic templates, the experimental crystallization parameters, as well as the exact control of the interfacial molecular recognition between organic and inorganic nucleus of minerals and the selective stabilization of a particular hydrated form are questions that have not been resolved to this day. Proteins and polysaccharides are biomolecules capable of modulating or controlling the biomineralization process [8,9,10,11]. Chitin (poly-β-N-acetyl-glucosamine) is the polysaccharide presents in the shells of mollusks and crustaceans. Chitosan (poly-2-amino-2-deoxy-β-D-glucose) is the natural polycationic linear polysaccharide derived from partial acidic deacetylation of chitin [12]. Cationic character of chitosan derivative resulting from the protonation of the amino groups (-NH2) [13]. Chitosan has been used in various fields of research, with special interest in biomedicine due to it being biocompatible, biodegradable, and having antibacterial and antitumor properties among others [14]. Indeed, the generation of nanofibers via an electrically charged jet from chitosan solution has shown a favorable outcome for tissue regeneration engineering and regenerative medicine. In this sense, seminal papers of chitosan nanofibers for nerve tissue regeneration [15] and the electrospun composite biomaterials for tissue regeneration applications represent a promising alternative as bioactive polymer for regenerative medicine in order to transfer materials from laboratory to clinical application [16,17,18].
It has been reported that the topographic characteristics and the chemical composition of the polymeric organic template are important factors in the process of mineralization of minerals [19,20]. Moreover, the effect of fibrillar materials on the process of mineralization for biomedical purposes has been studied [21,22,23]. In this regard, the formation of polymer fibers has been intensively studied using the electrospinning (ES) technique due to its ability to produce porous three-dimensional materials based on fibers of micro- or nanometric sizes and their high specific surface area [24,25,26,27]. ES is a beneficial, effective and simple technology to produce continuous nanofibers by electric force. According to the mechanism of the ES process, the basic ES setup contains a high-voltage system, spinneret, and collector. Collector components, where fibers are collected, can be exchanged in order to control the distribution of the polymeric fibers; with a rotary collector, the fibers are deposited in parallel with each other forming a matrix with aligned topology, while in a flat collector the fibers are deposited with a random distribution [25,26]. ES allows using of abundant polymeric electrospun fibers with active functional groups in mineralization, where the large surface area provides numerous interaction sites with other molecules. Therefore, polymeric electrospun fibers are excellent candidates to act as active organic template in mineralization (Xiao et al., 2018). Chitosan–ESM were used as organic three-dimensional template to induce the formation of CaOx crystals by the electrocrystallization (EC) process [4,28].
Herein, we study the effect of the chitosan fibers arrangement on the in vitro EC of CaOx in order to evaluate the ability of solid template to inhibit or promote the process of CaOx precipitation or to form specific hydrated crystalline forms of CaOx.

2. Materials and Methods

2.1. Preparation of Electrospun Chitosan Fibers as Organic Template

Electrospun meshes (ESM) composed of controlled topology of chitosan fibers (chitosan–ESM) was prepared and directly deposited on small pieces of indium tin oxide (ITO) glass substrates. For the preparation of the chitosan–ESM fibers, a 0.1% solution of commercial chitosan (Fluka® Mw 70 KDa, degree of deacetylation > 75%) was prepared in 1,1,1,3,3,3-hexafluoro-propan-2-ol, IUPAC name, (HFIP) solvent (Merck®), which was kept on an orbital shaker for 7 days, stirred on a magnetic stirrer at 40 °C for 2 h and filtered through Swinnex holder (MilliporeSigmaTM) before use it. For the ES process, the resulting chitosan solution was placed in a 10 mL Nipro® luer lock syringe, and electrospun in an eStretching LE-10 Fluidnatek® instrument. One to three pieces of ITO substrates were usually glued on the rotating drum and flat-plate collectors and they act as a working electrode during the EC of CaOx (Figure 1). For all solutions, Milli-Q water was obtained from a water purification system (LabostarTM TWF, Evoqua Water Technologies LLC, Warrendale, PA, USA). The current protocol has not been reported previously. A rotary collector of 10 cm in diameter at 1800 rpm for the manufacture of the chitosan–ESM with controlled topology was used. The collecting plate was located at a distance of 7 cm from the metallic needle covered by aluminum foil on which the ITOs were glued. The flow rate and voltage parameters used for the preparation of chitosan–ESM were 3000 μL/h and 12 kV, respectively. For the deposition of chitosan fibers, small cut pieces of ITO (10 × 25 mm) substrates from commercial (Corning®) ITO glass (12 × 25 mm), 1.1 mm-thick purchased from Delta Technologies (Dallas, TX, USA) were utilized. Commercial ITO glass substrates had sheet surface resistivity in the range of 5–15 Ω/sq.

2.2. Electrocrystallization of CaOx

The in vitro electrocrystallization (EC) of CaOx on ITO substrate was carried out in a galvanostat / potentiostat (BASi Epsilon) (West Lafayette, IN, USA) equipment. ITO substrate was modified with randomly distributed chitosan fibers (R-chitosan) or aligned chitosan fibers (A-chitosan) as chitosan–ESM fibrous template. For the preparation of EC of CaOx, the ITO substrate was immersed in a solution of calcium nitrate (Ca(NO3)2), ethylenediaminetetraacetic acid (EDTA), and sodium oxalate (NaOx) at a pH of 10.5 contained in an electrochemical cell. The experimental parameters of the EC of CaOx were 9 mA for 5 min, and the chronopotentiometry curves during the CaOx formation on the ITO surface were recorded. Indeed, electrospun polymer fiber parameters were kept constant in all in vitro EC essays as previously was reported [4]. In the electrolytic solution of the EC, EDTA molecules binds to the Ca2+ ion inducing the Ca-EDTA complex at alkaline pH (ca. pH = 10.5) medium, so when an electric potential is applied, electrolysis of water occurs generating free O2 and protons [29]. in the vicinity of the ITO surface, with the consequent decrease of pH value and loss of the stability of the Ca-EDTA complex. By this manner, the free Ca2+ ions react with oxalate ions getting CaOx crystals as locally deposited on the working electrode on the ITO surface. The formation of CaOx particles and subsequently deposition on ITO glass generates that its resistance increases during the passage of current, which is reflected in the voltage behavior recorded during the EC of CaOx.

2.3. Characterization of Chitosan Meshes and CaOx Crystals

The CaOx crystals formed by EC essays on the ITO substrates were characterized by Fourier transform infrared spectroscopy (FTIR / ATR) in an Interspec 200-X® (Interspectrum OU, Toravere, Estonia) instrument. The spectroscopic measurements on dried samples were performed directly using the PIKE Miracle TM accessory in a Ge single reflection crystal plate. FTIR spectra were obtained by averaging 20 scans over the spectral range of 650–4000 cm−1. The surface morphology of the resultant CaOx crystals and chitosan–ESM samples were observed by optical microscopy (OM) and scanning electron microscopy (SEM) in a Nikon Eclipse E400® with the morphometric LAZ program (Image Pro-Plus, Media Cybernetics, Melville, NY, USA) and in a JEOL JSM-IT300LV microscope (JEOL USA Inc., Peabody, MA, USA), respectively. For SEM analysis, chitosan–ESM samples were gold-sputter-coated to thickness of 200 nm using a Denton Vacuum Desk V sputtering system in an argon atmosphere to render them electrically conductive. SEM observation was performed using an accelerating voltage of 20 kV. Moreover, X-ray diffraction (PXRD) (Siemens, Munich, Germany) of chitosan–ESM samples was carried out by using a Siemens D-5000X X-ray diffractometer with CuKα radiation (graphite monochromator) and an ENRAF Nonius FR 590 X-ray generator. The crystal structure of CaOx was determined by using CuKα radiation (40 kV), step scan of 0.2°, and the geometric Bragg−Brentano (θ-θ) scanning mode with an angle (2θ) in the range of 5–70°. The DiffracPlus program was used as the data control software.

3. Results

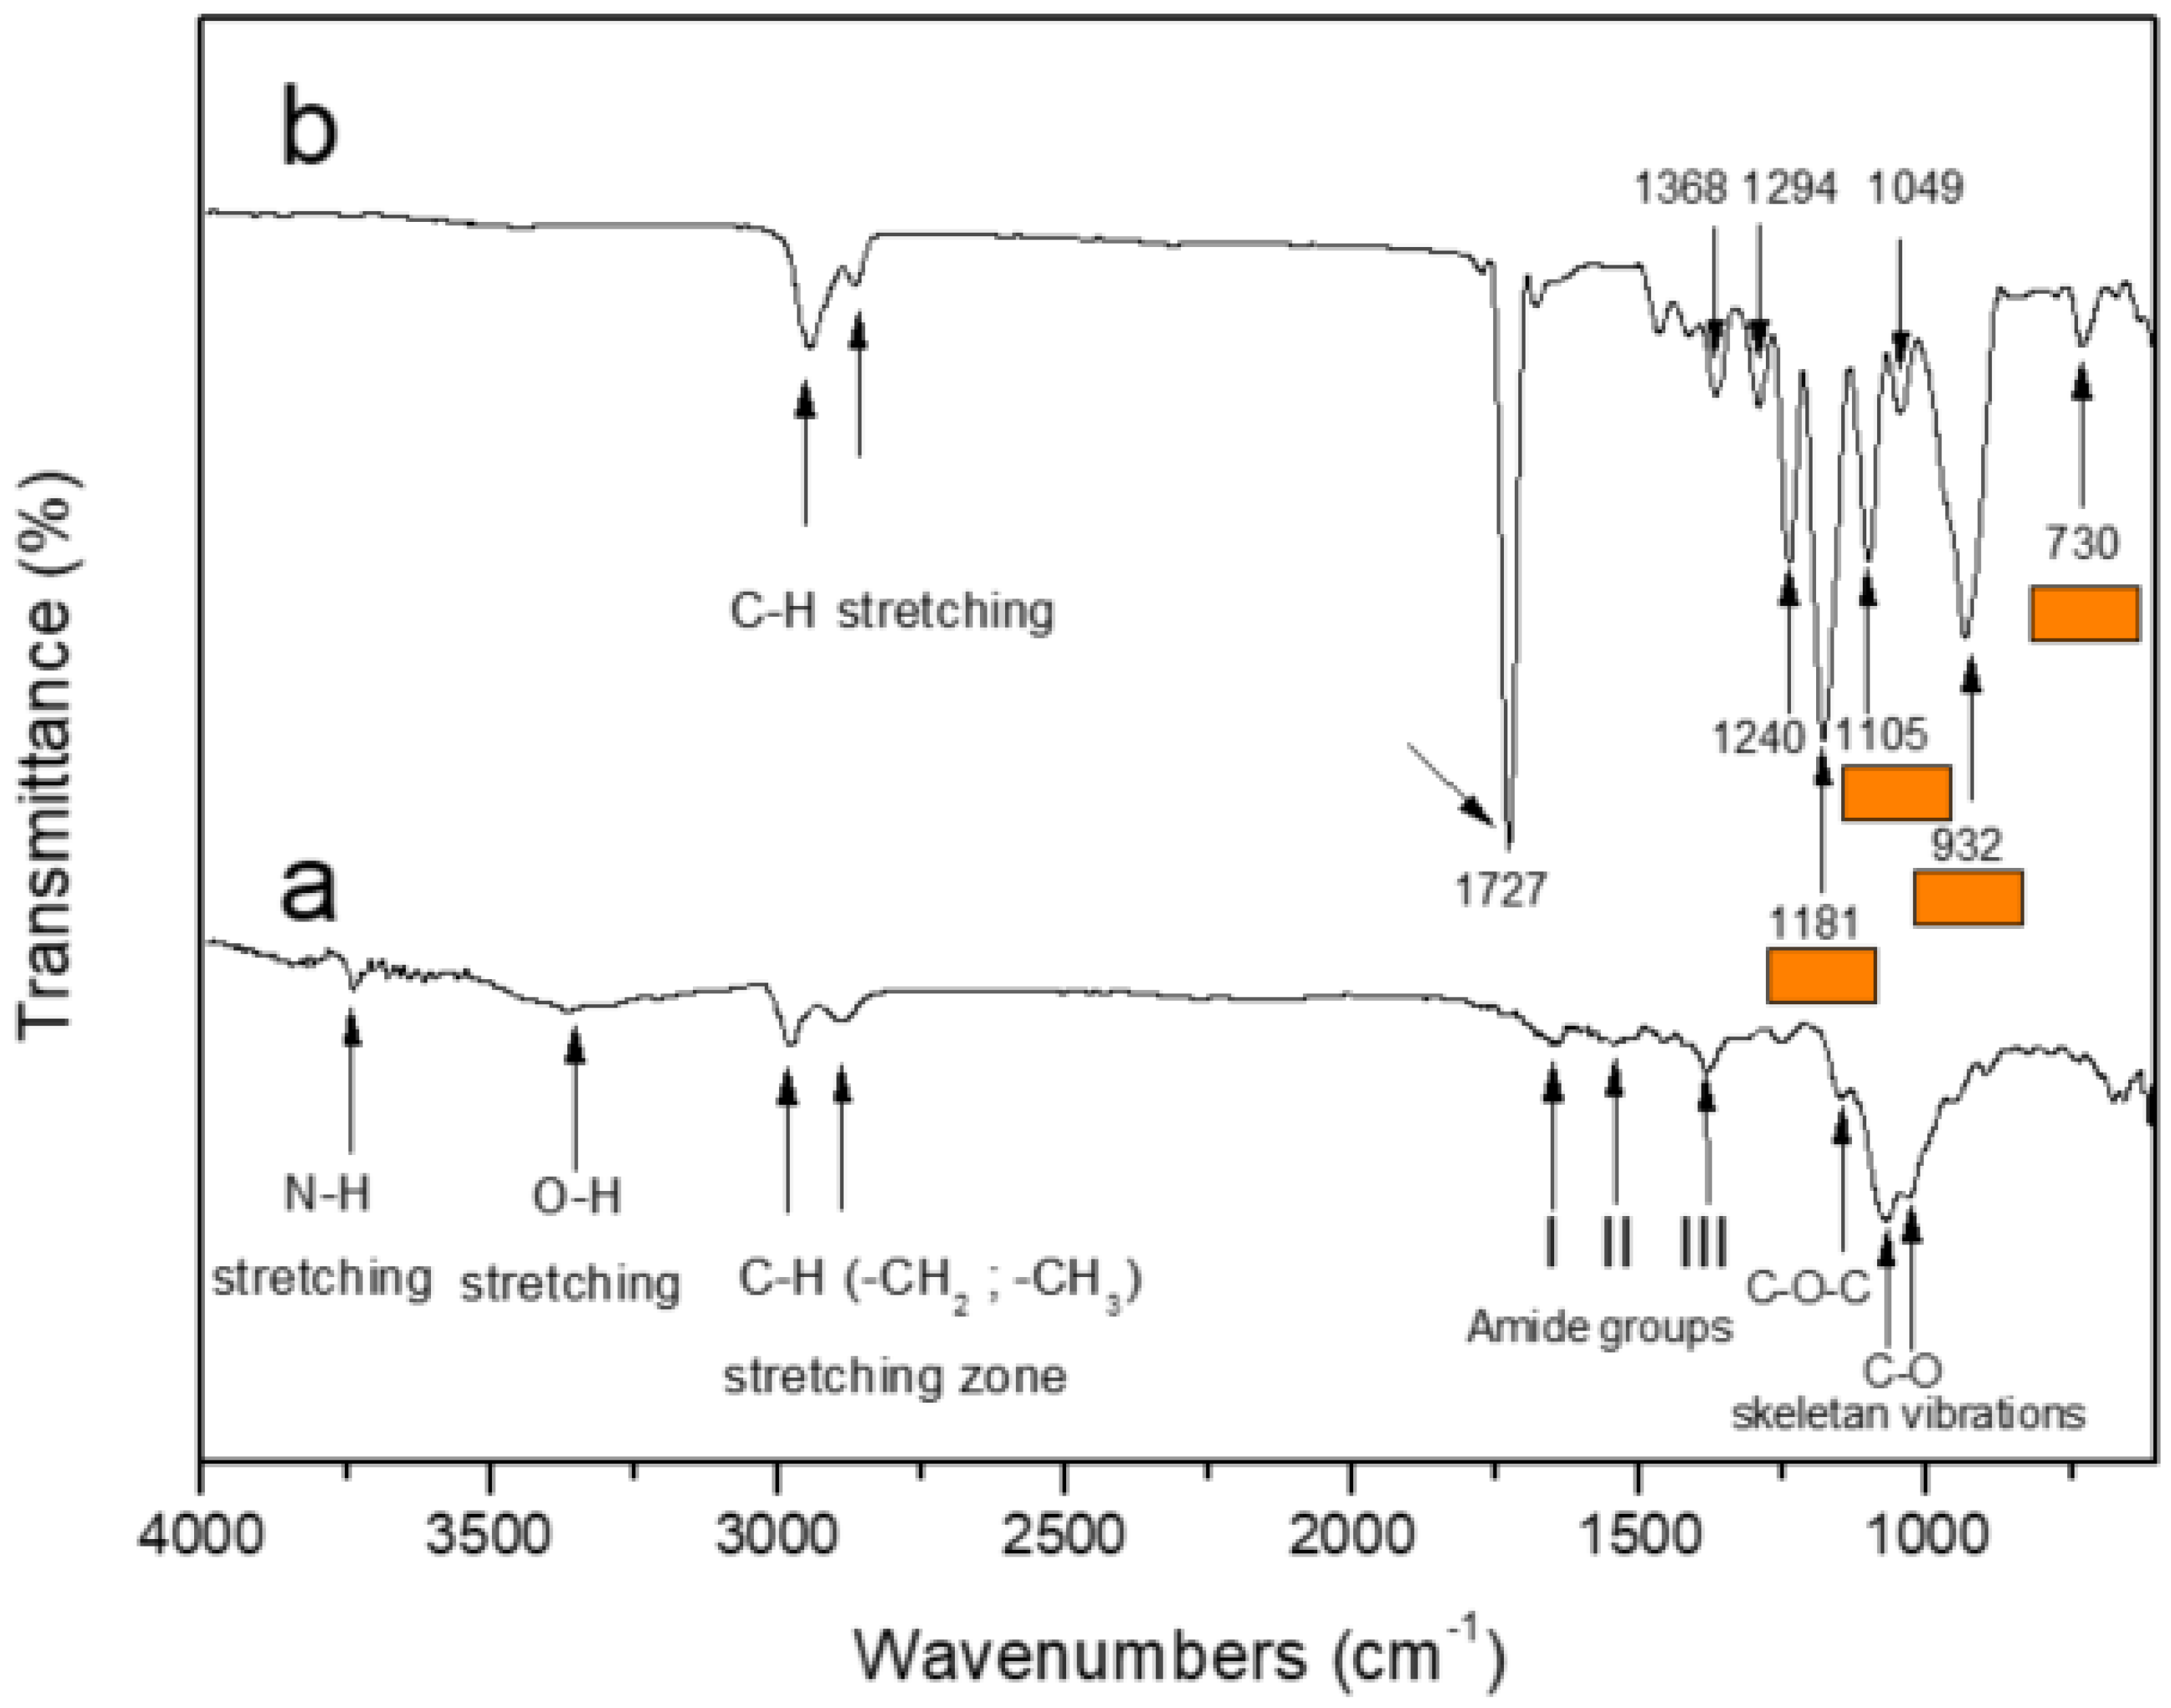
3.1. Fourier Transform Infrared Spectroscopy (FTIR)

FTIR spectra of chitosan powder and chitosan–ESM were performed (the ESM of R-chitosan fibers is shown in Figure 2b). Figure 2a shows the spectrum of chitosan, where the main bands appearing were due to stretching vibrations of OH groups in the range from 3750 cm−1 to 3037 cm−1, which are overlapped to the strectching vibration of N-H (sharp absorption band at 3740 cm−1); and C-H bond in –CH21 = 2945 cm−1) and –CH32 = 2865 cm−1) groups, respectively. This spectrum also exhibits the characteristic absorption bands at 1651 cm−1 (Amide I) and 1550 cm−1 (–NH2 bending) and 1382 cm−1 (Amide III). We can also observe absorption bands at 1155 cm−1 (anti-symmetric stretching of the C-O-C bridge), 1075 and 1032 cm−1 (skeletal vibrations involving the C-O stretching) that are characteristic of its saccharide structure. On the other hand, when R-chitosan analysis was performed (Figure 2b), the absorption bands corresponding to the C-H bond at 2980–2865 cm−1 (CH-stretching) are observed, however, absorption bands between 900 cm−1 and 1727 cm−1 are additionally observed. The absorption bands at 1294, 1105, 1181, 932, and 732 cm−1 highlighted with orange colored lines in Figure 2b can be assigned to residual HFIP solvent [30].

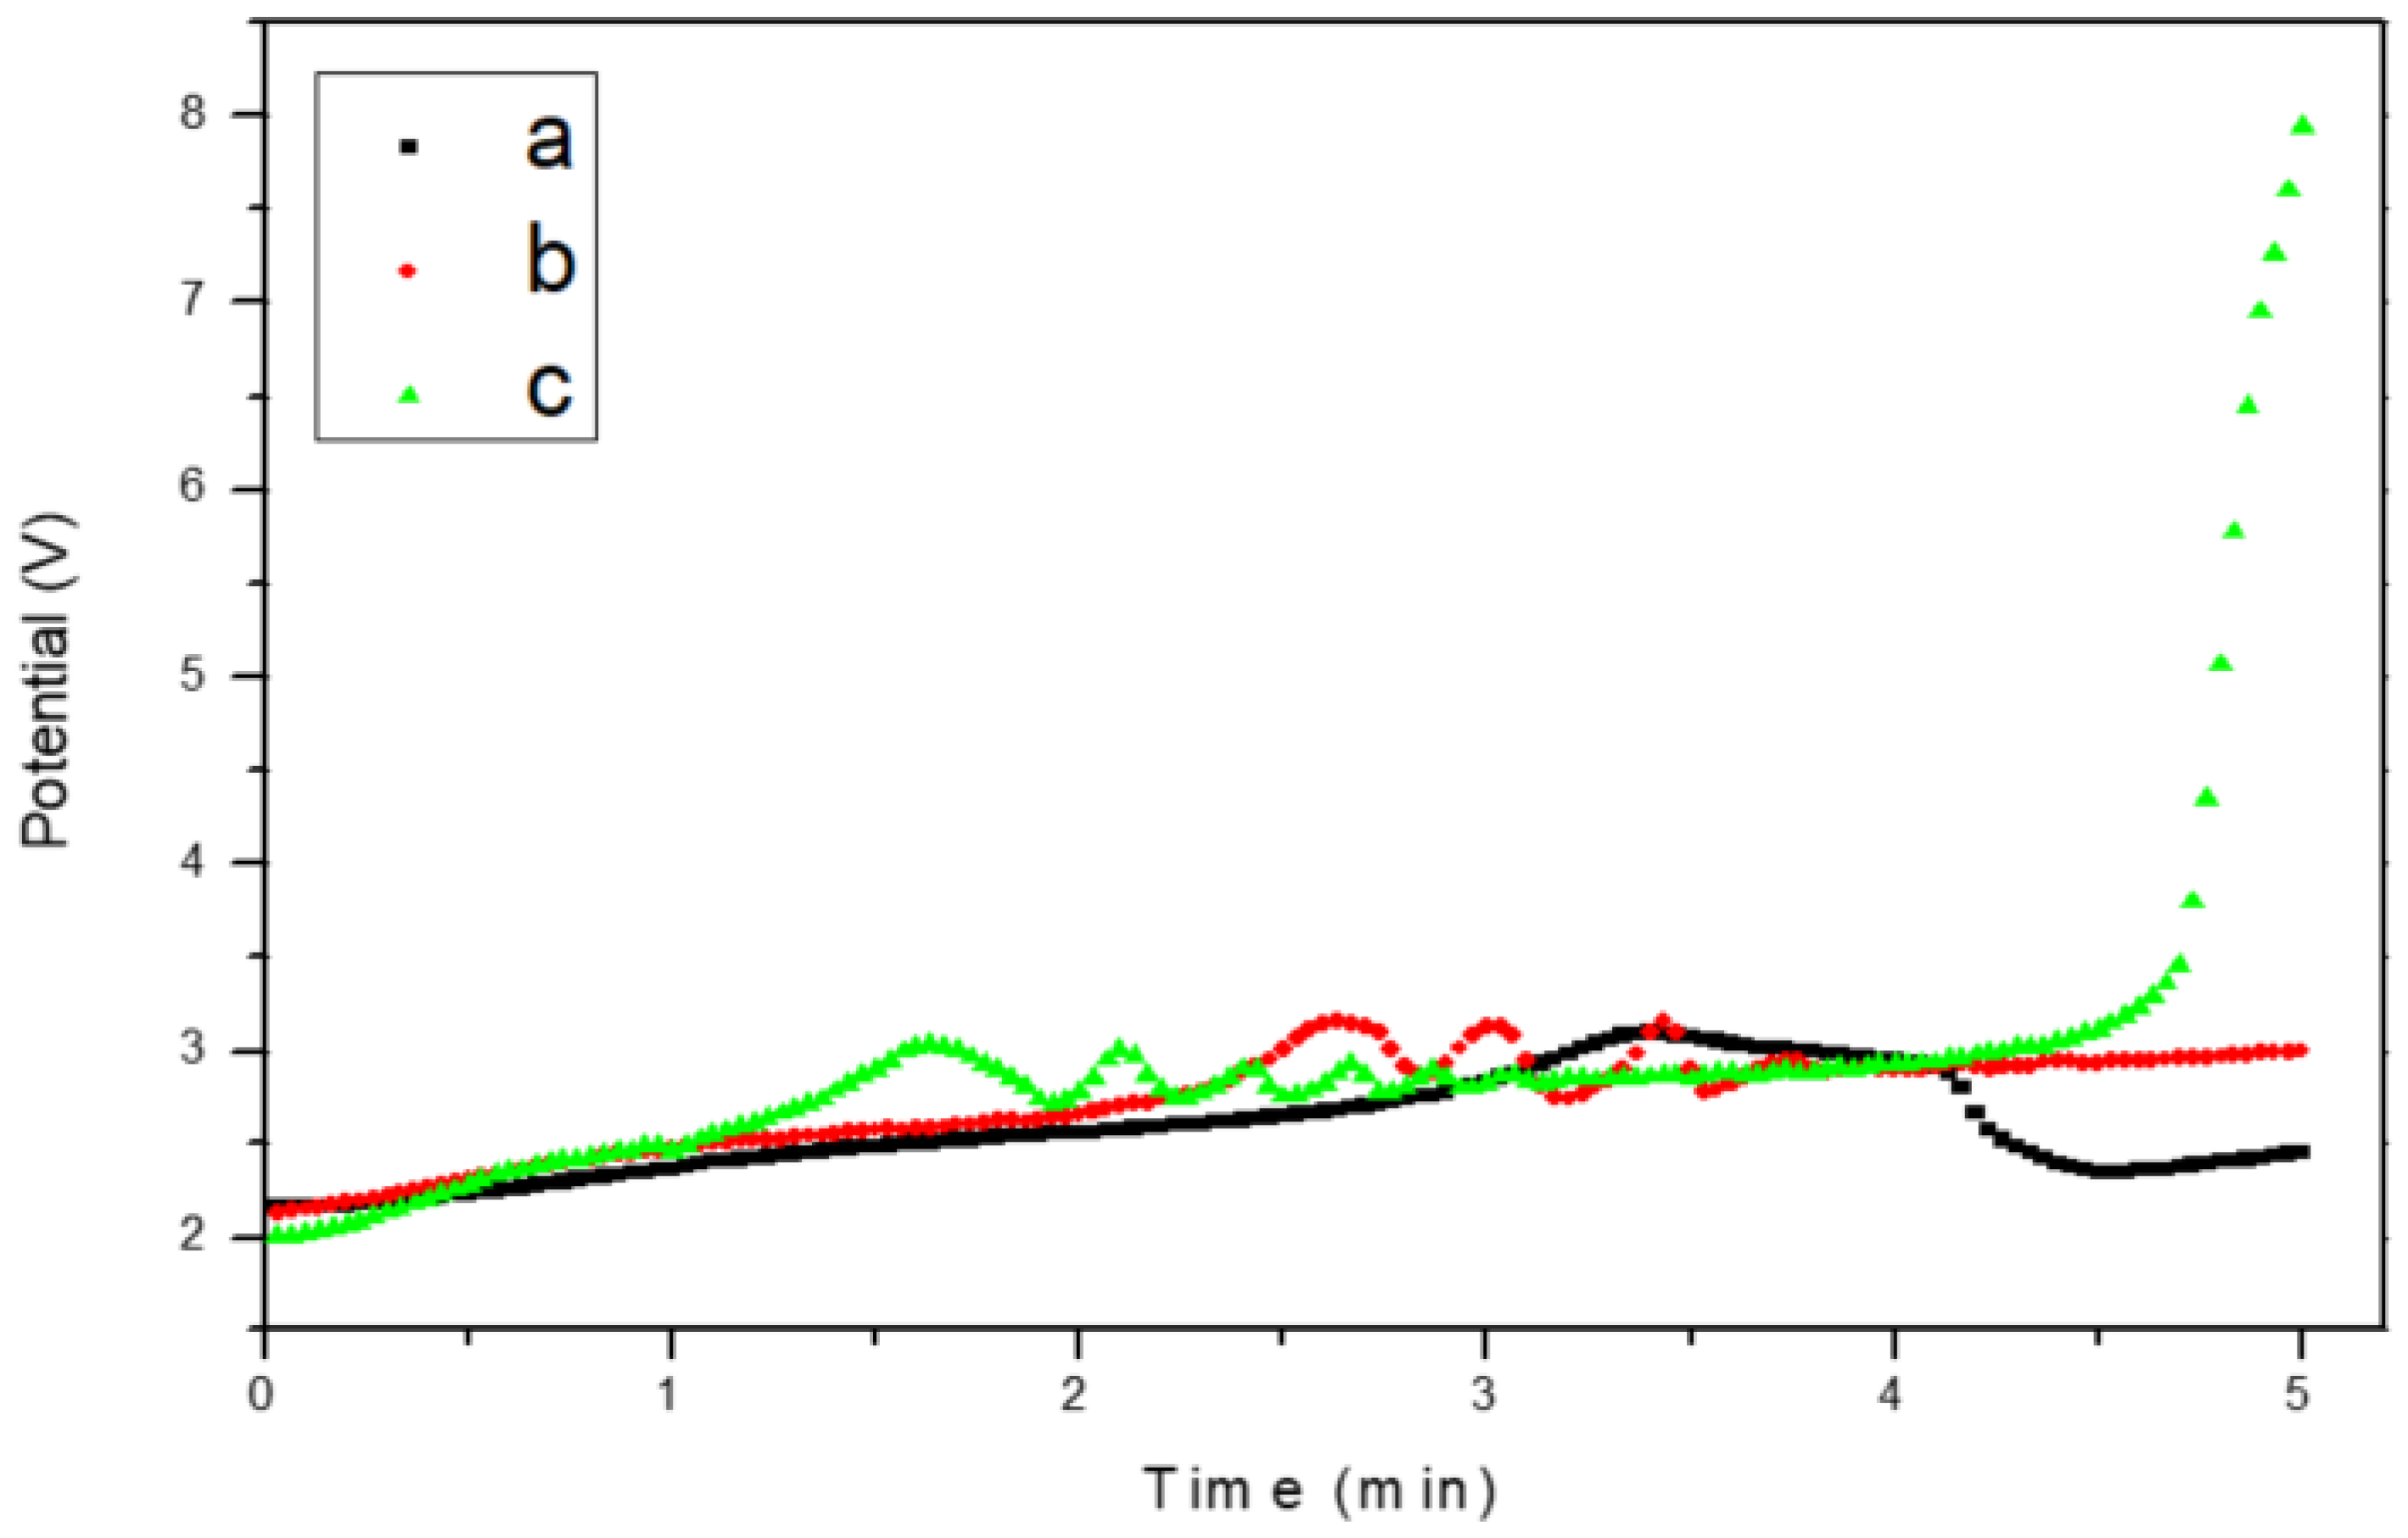
3.2. Chronopotentiometry

Figure 2 shows the chronopotentiometry behavior of the EC of CaOx performed on the ITO bare substrate (control, Figure 3a) and in the presence of the chitosan–ESM (R-chitosan fibers Figure 3b, and A-chitosan fibers Figure 3c). As is known inorganic mineral formed on ITO surface is not a conductive material, therefore its presence reduces the electrode active area, constituting a barrier for oxygen diffusion and by this way the total cathodic current decreases which can be followed by fluctuations of potential measurements [31]. The registered current could be analyzed during EC experiments according to its variations in time, and also to identify when the surface of electrode is covered by the resultant crystal material. With this in mind, we observed that the potential (V) behavior recorded at the initial of the EC in the three EC experiments—that is, without chitosan fibers (control) and in the presence of R-chitosan or A-chitosan fibers—are fairly similar. The EC voltage in the control experiment begins to increase gradually with a noticeable rise at 3 min reaching a maximum of 3.2 V (Figure 3a), however, the potential registered on ITO substrate in the presence of both chitosan–ESM fibers showed potential´s fluctuations associated with the formation of CaOx crystals in the range of 1–4 min (Figure 3b,c). In the case of R-chitosan fibers, the potential behavior is slightly different from that of the control, thus the increase in resistance associated with the formation of CaOx crystals on this ITO substrate begins earlier at 2.5 min reaching a value close to 3.2 V (Figure 3b), while using ITO substrate supported with ESM composed of A-chitosan fibers the chronopotentiometry behavior was more intense beginning the crystalline formation at 1.5 min reaching a value of 3.0 V and then this potential remained constant until a marked increase up to 8 V was recorded at 4.6 min (Figure 3c).

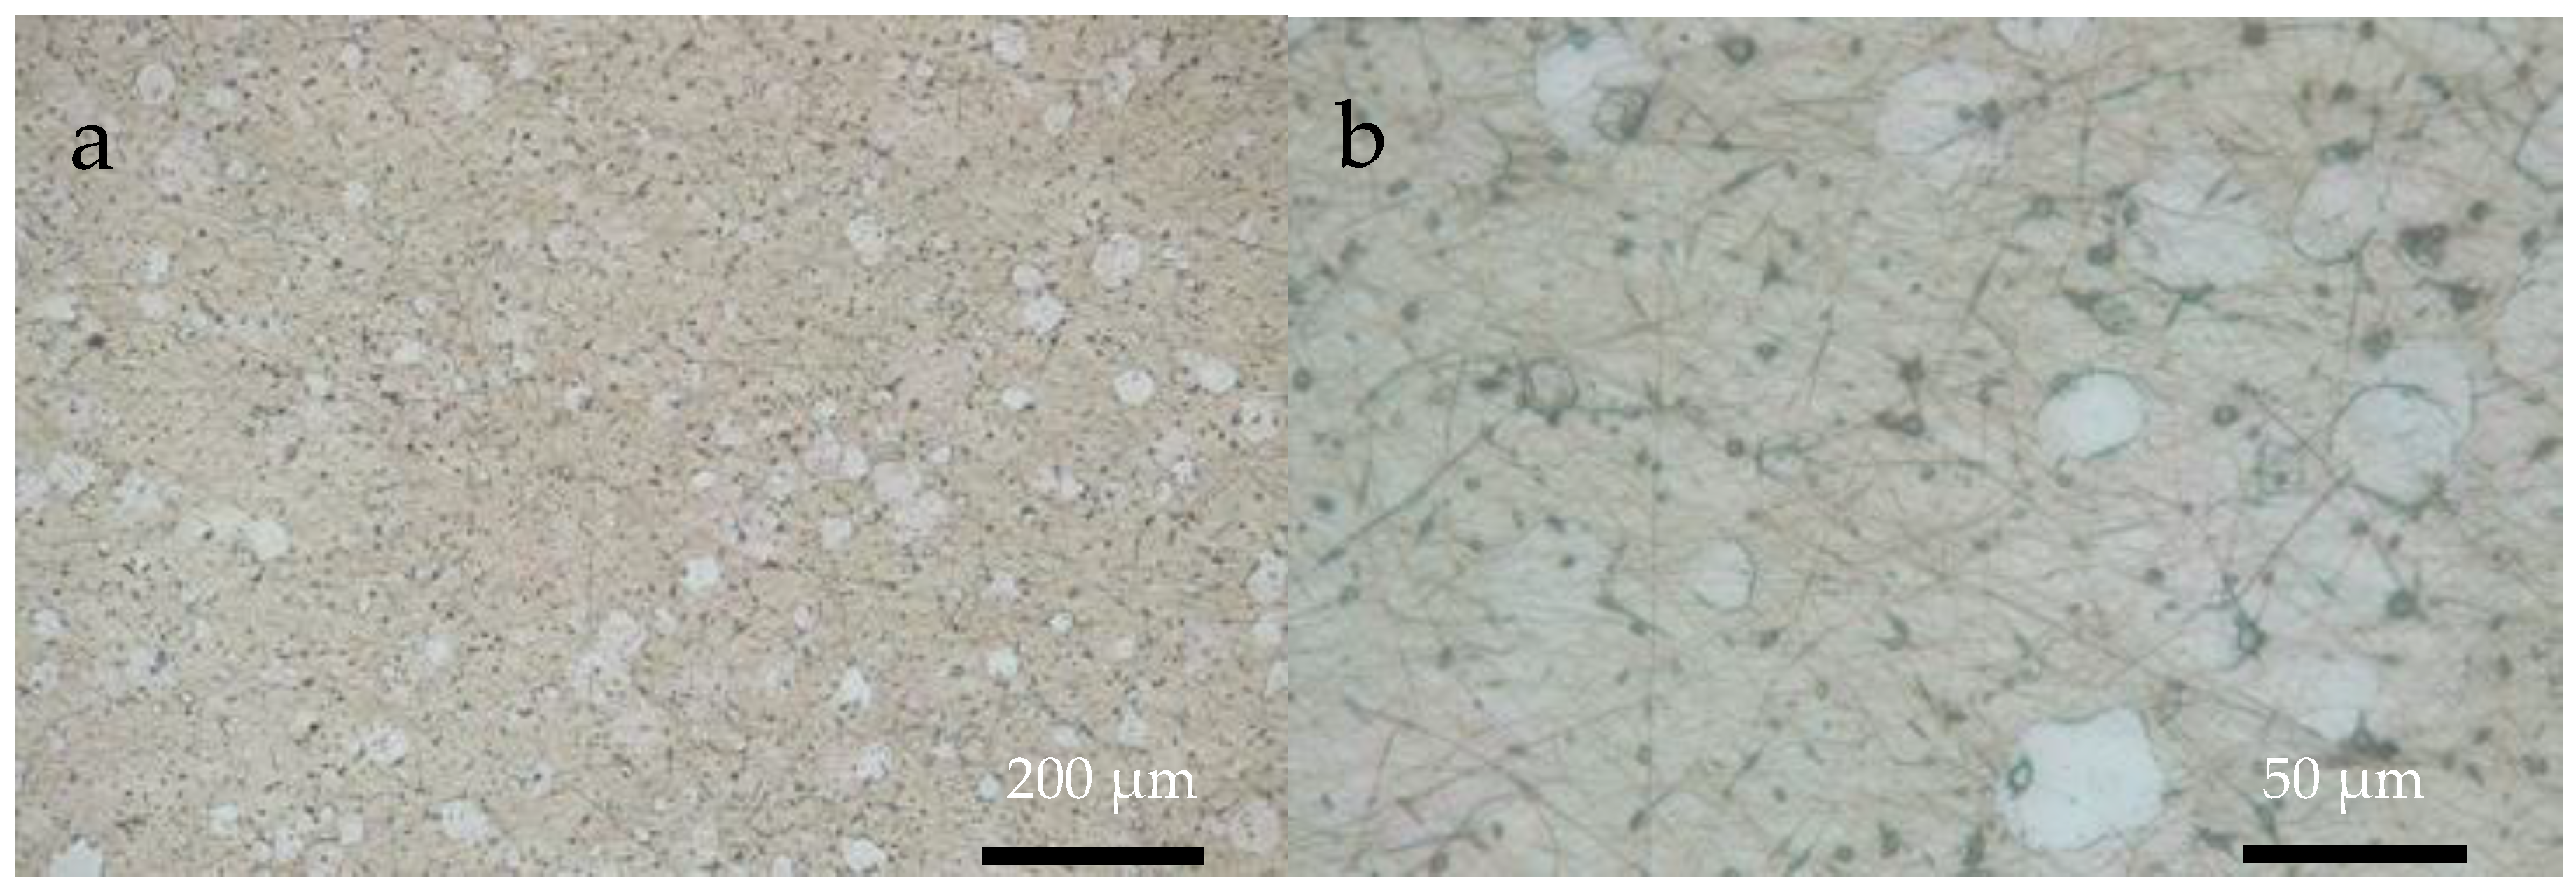
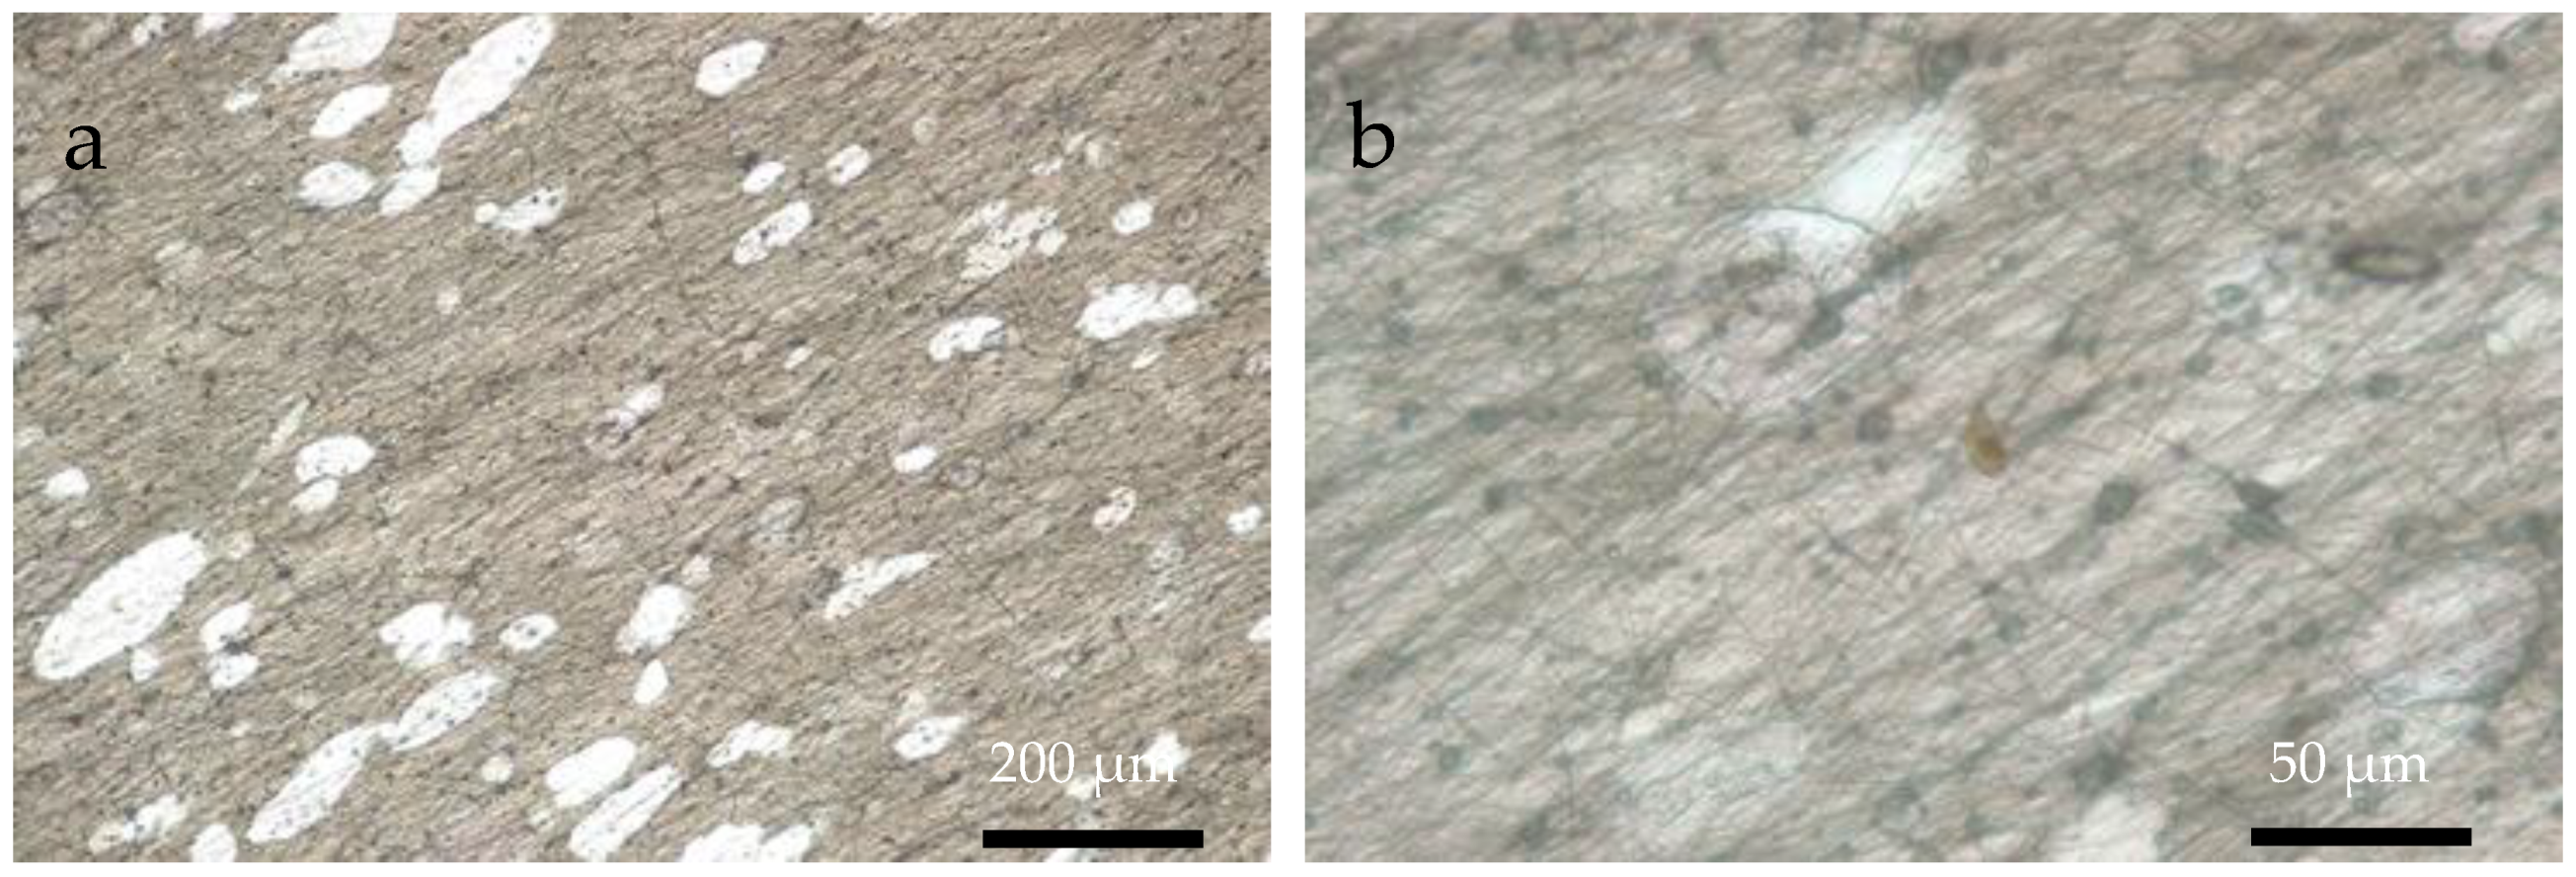
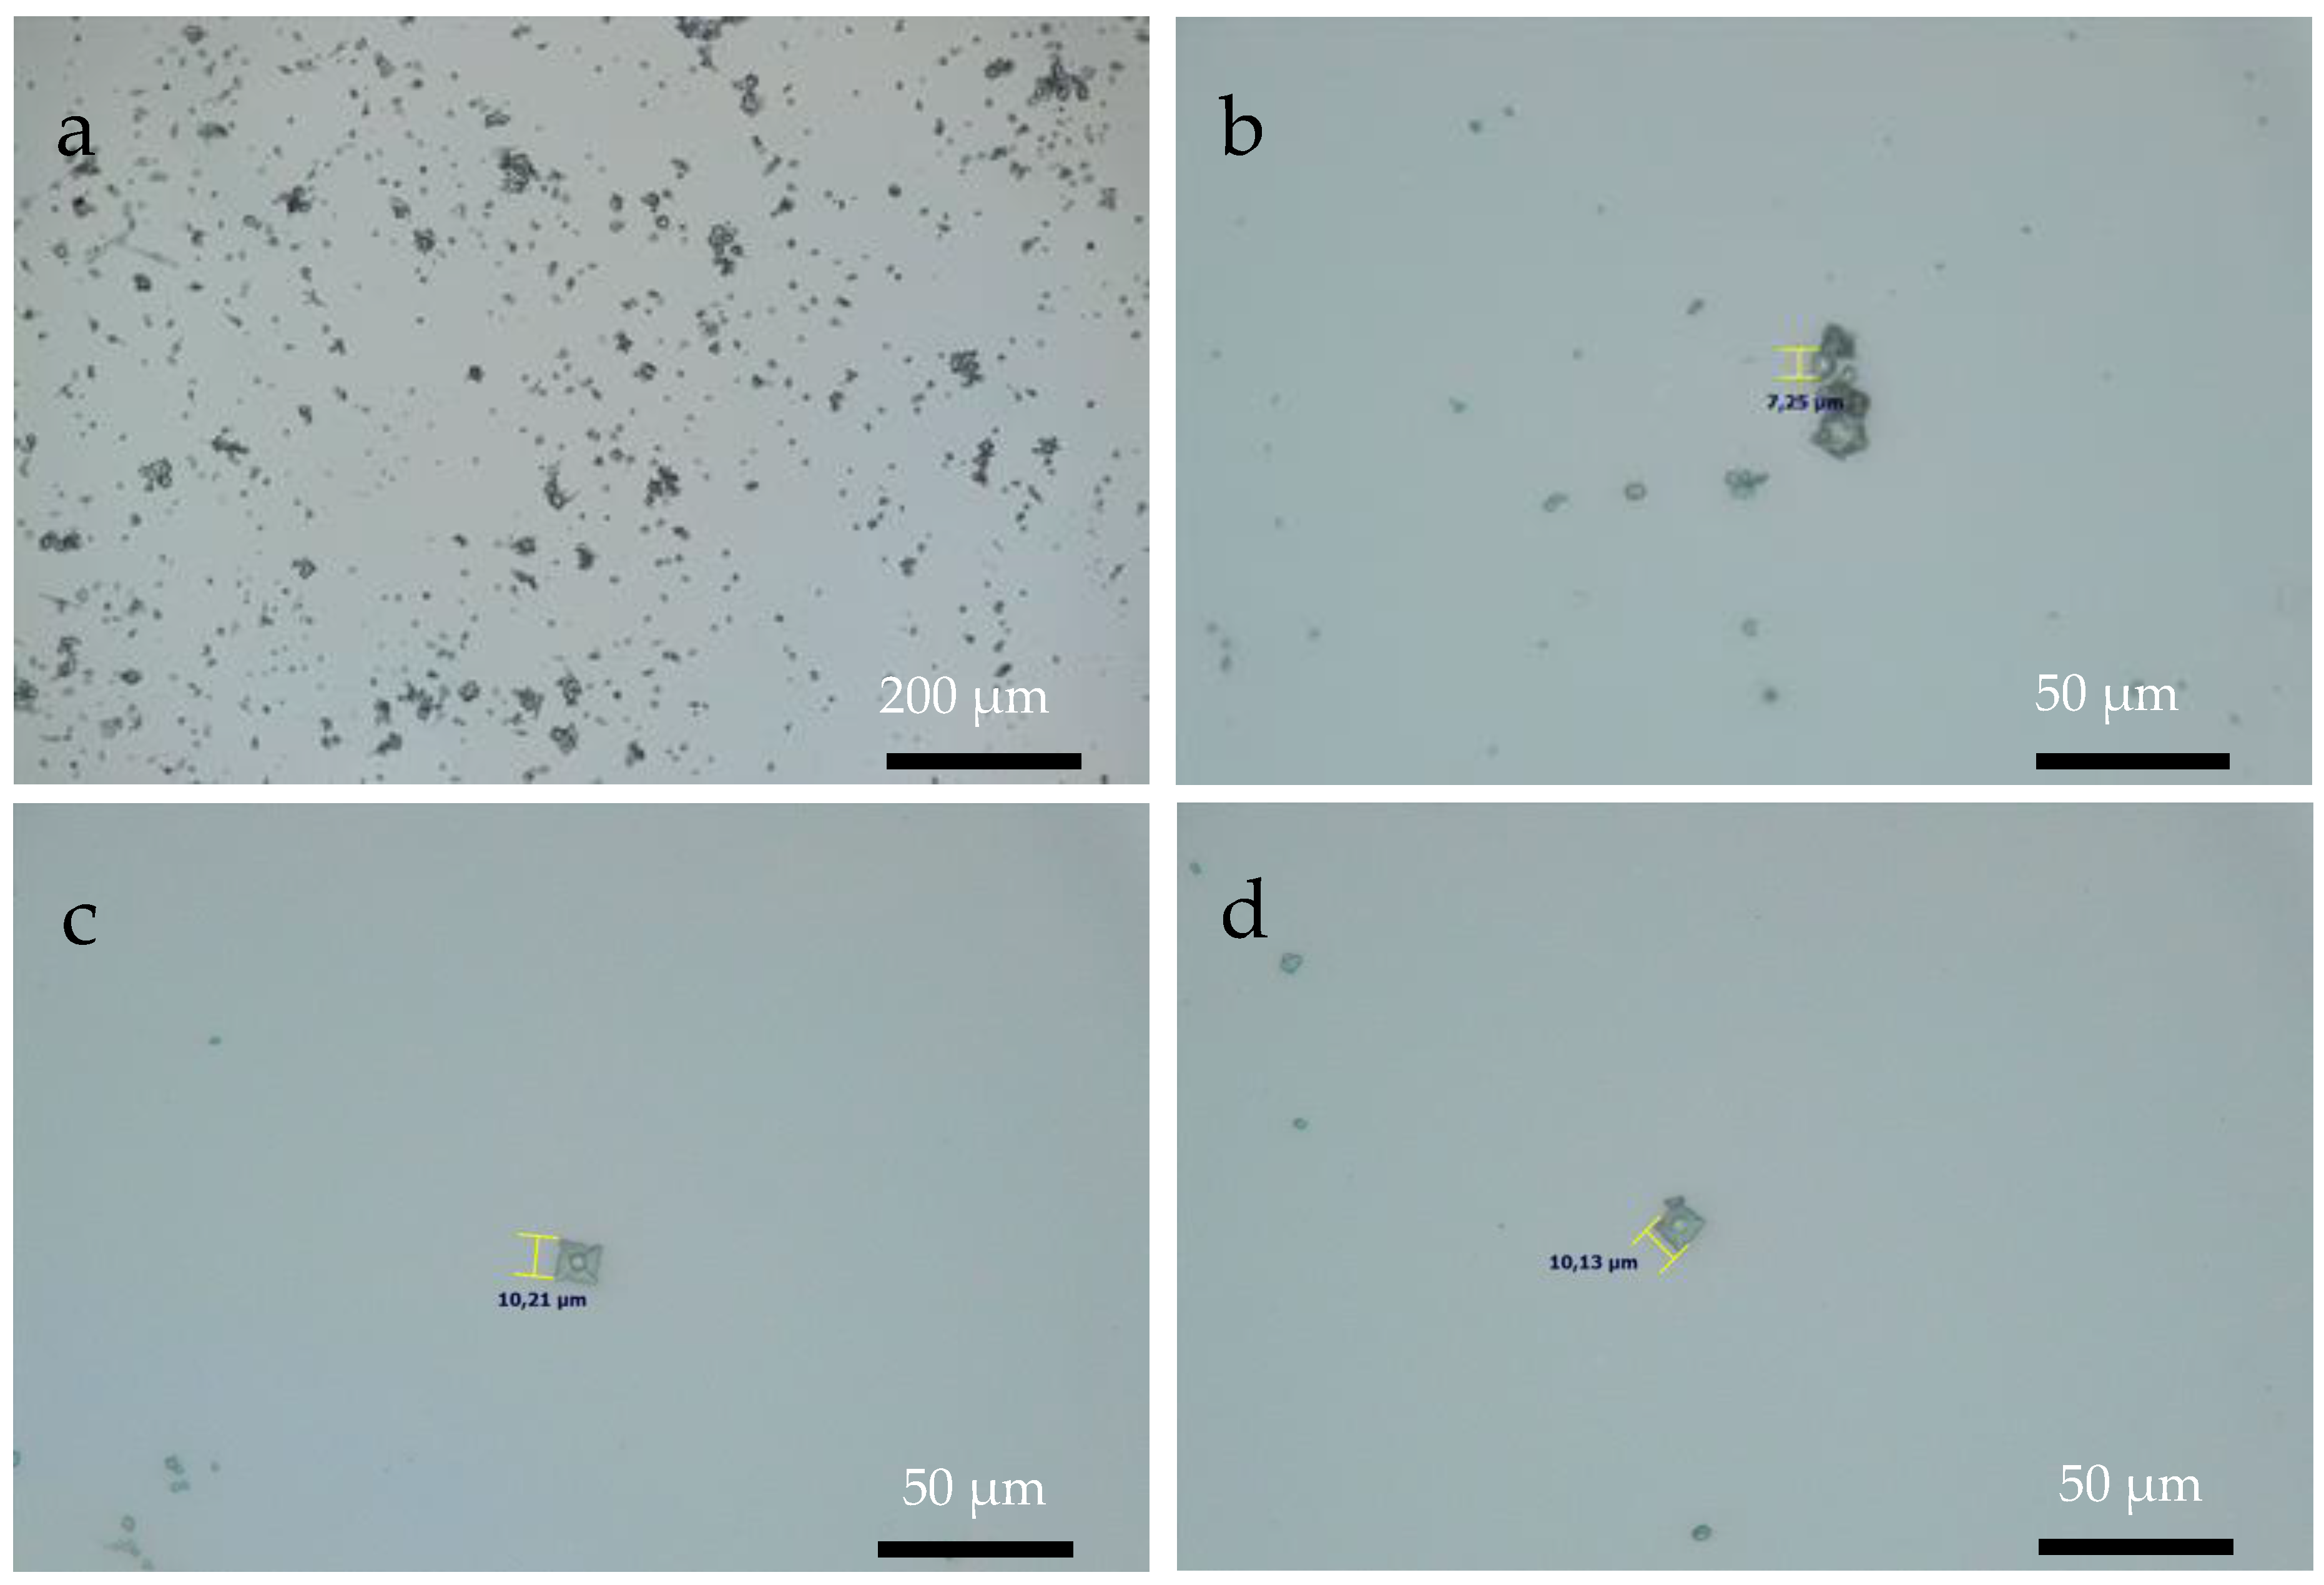
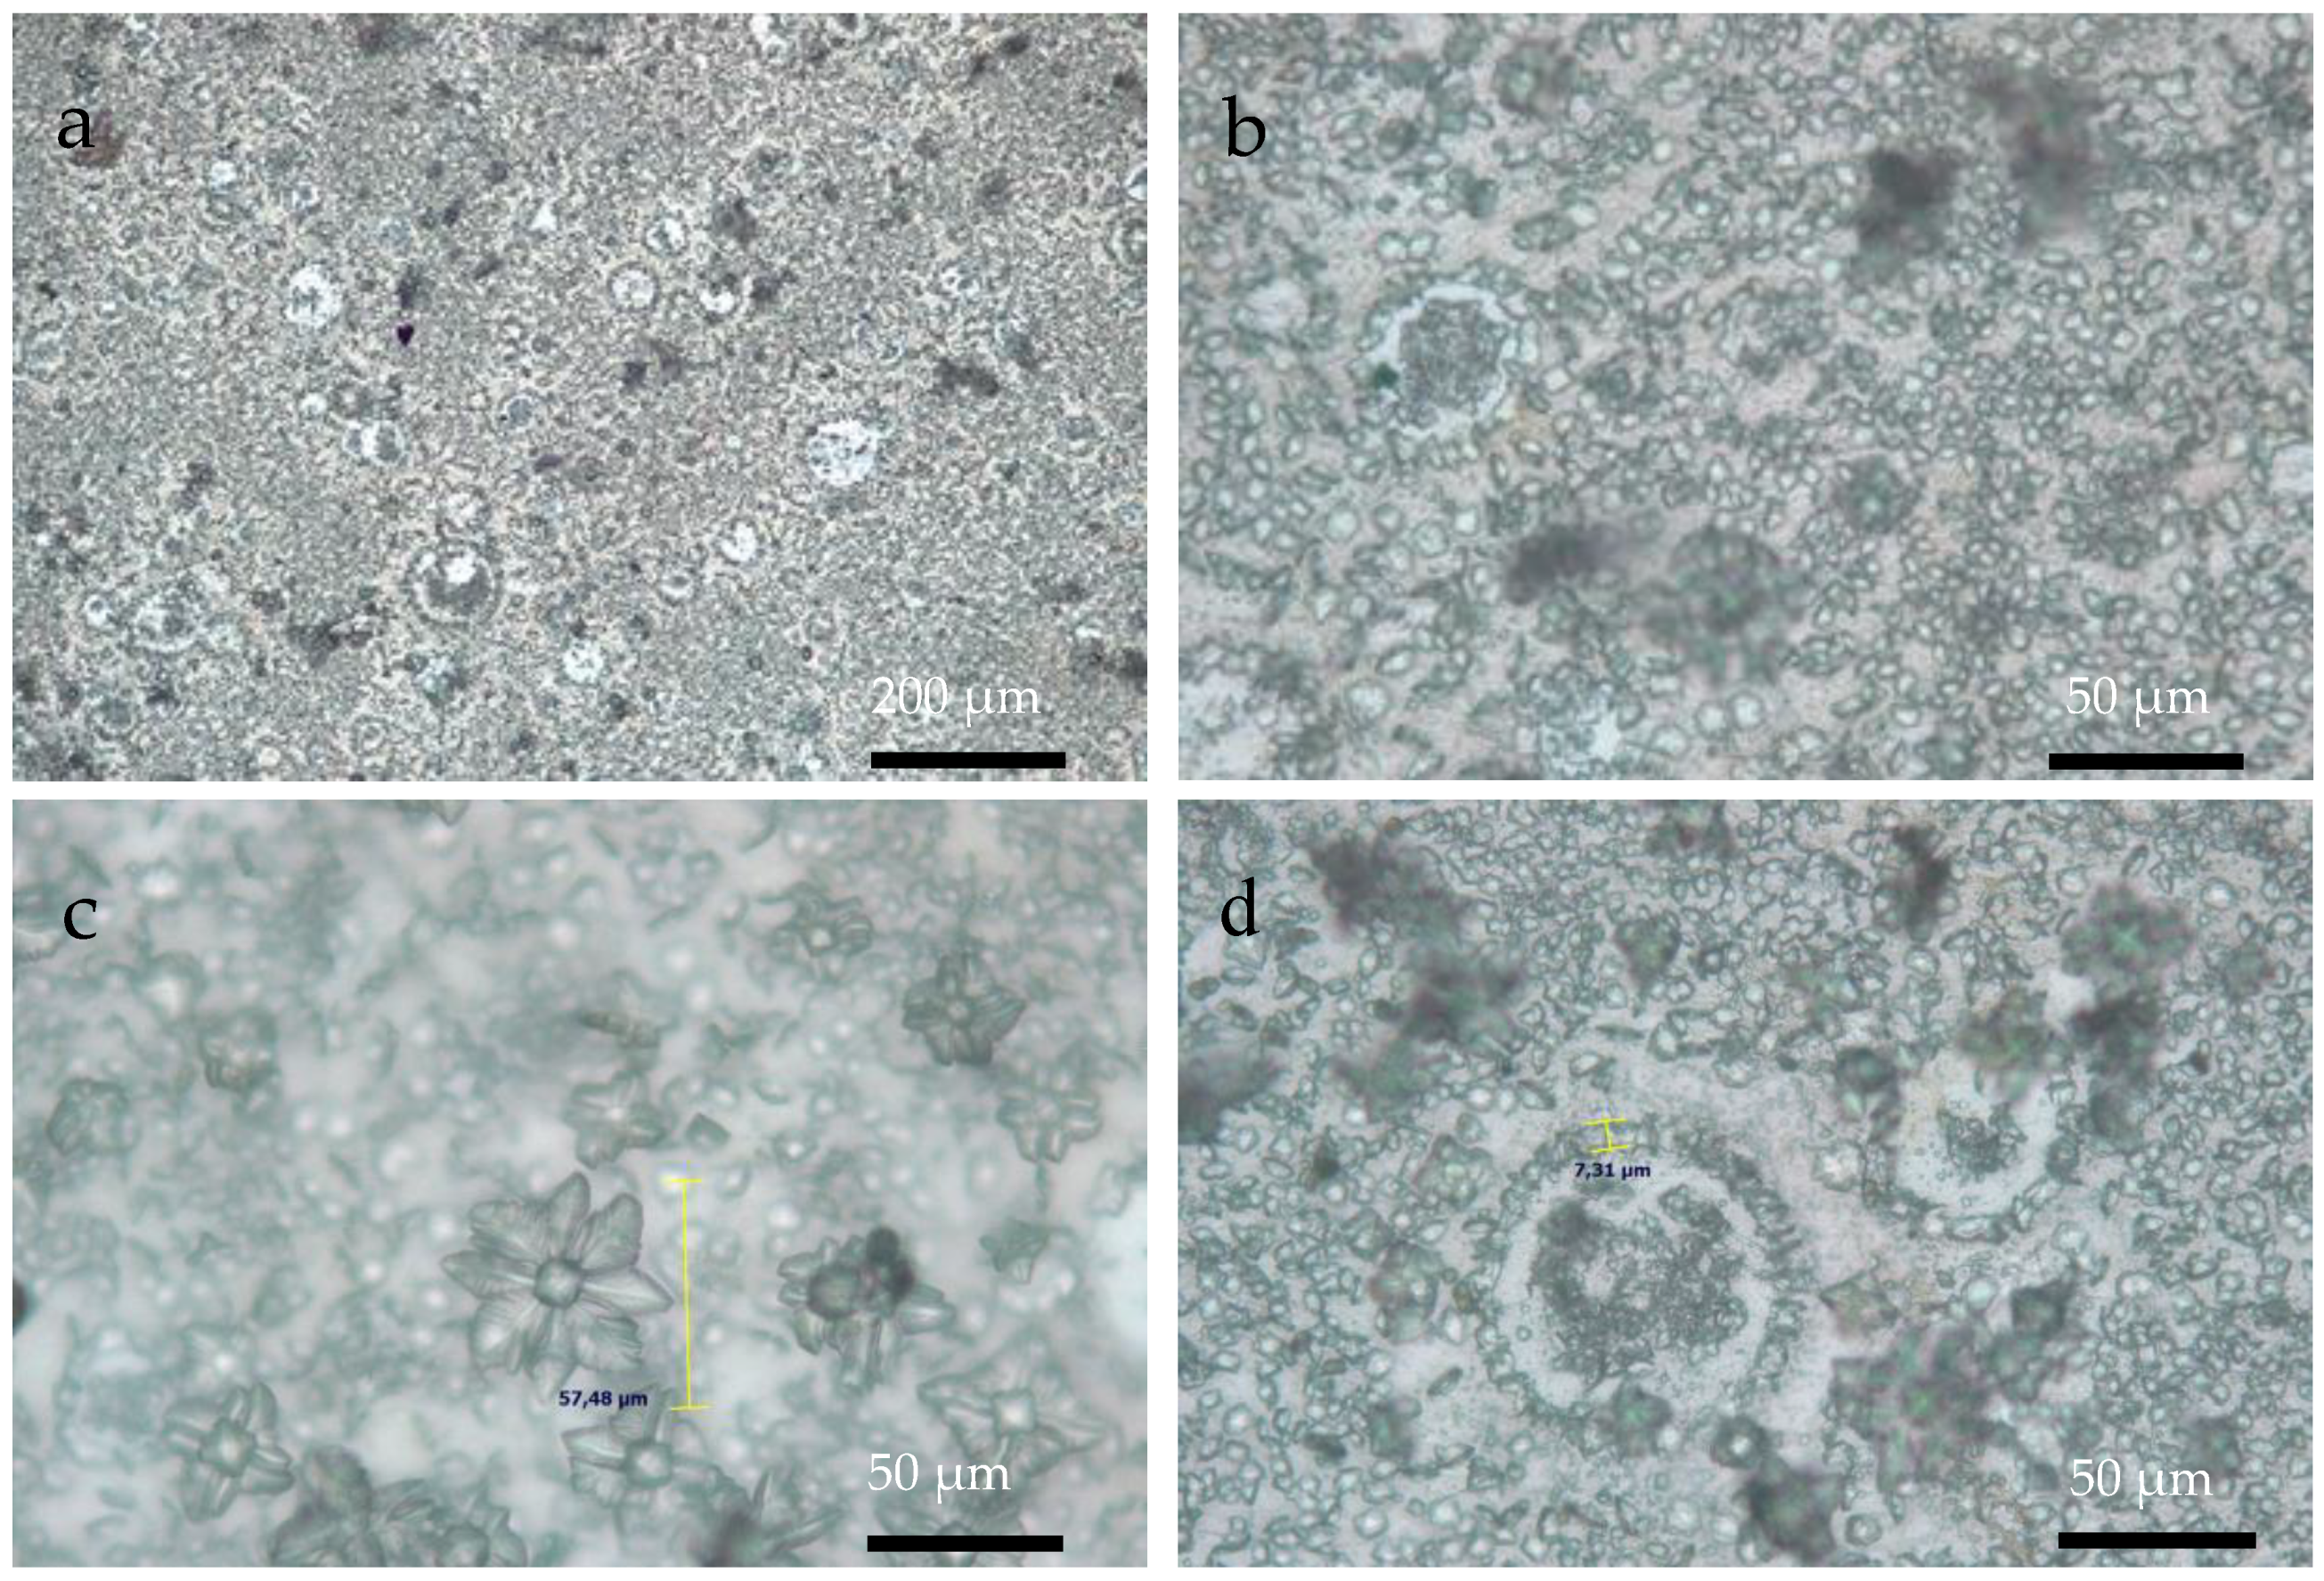
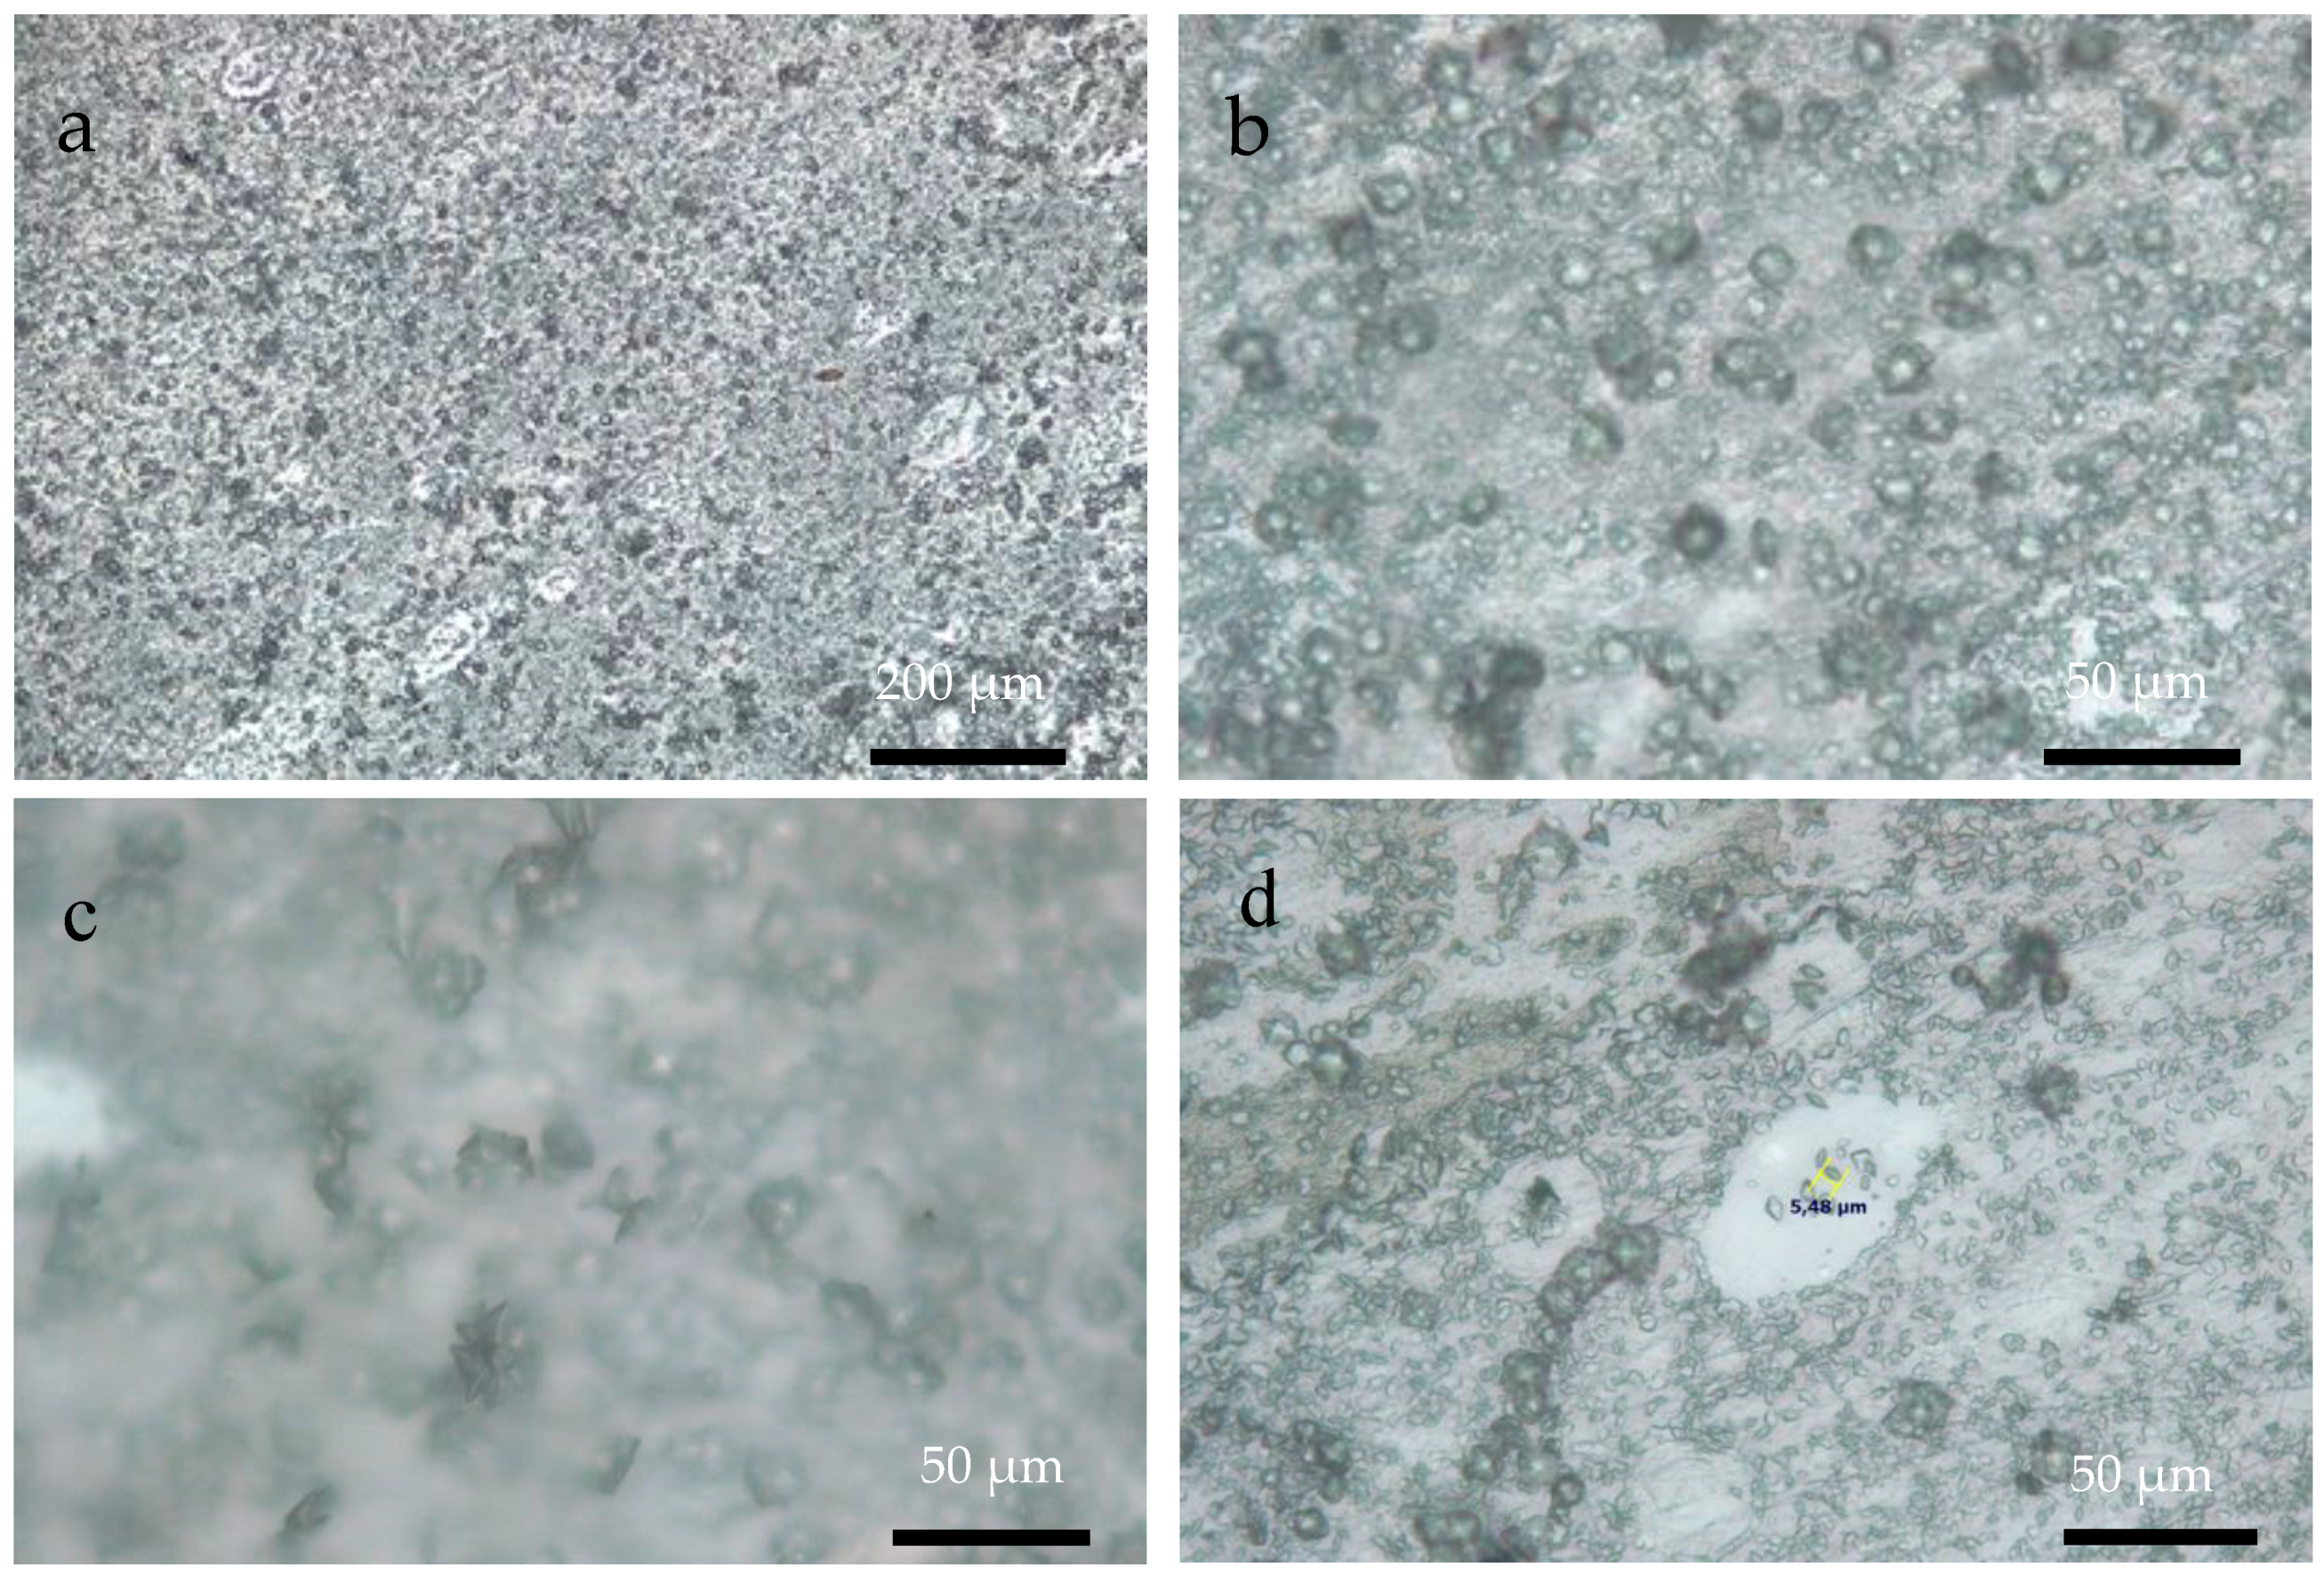
3.3. Optical Microscopy

Using optical microscopy (OM) it was possible to demonstrate the presence of R-chitosan and A-chitosan fibers on the ITO substrates when the flat (Figure 4) and rotary (Figure 5) collectors on the ITO substrate were used, respectively. In both cases, chitosan particles and the bead-chitosan fibers as well as circular or oval shaped chitosan–ESM matrices with lower number of chitosan fibers were also observed.
Figure 6, Figure 7 and Figure 8 show OM images of CaOx crystals obtained on the in vitro EC performed on the ITO bare substrate (control, Figure 6) and in the presence of the chitosan–ESM (R-chitosan fibers Figure 7, and A-chitosan fibers Figure 8). In Figure 6, the size of the crystals on the ITO surface are in the range of 7–10 µm (Figure 6a,b) and it is also possible to clearly observe COD flower-like crystals of size ca. 10 µm (Figure 6c,d). Figure 7 shows CaOx crystals obtained on randomly chitosan–ESM. Here, great abundance of crystals with different morphologies (Figure 7a,b) and a characteristic distribution of circumferential rearrangement (Figure 7c,d) is observed. In general, the smaller crystals are associated with the formation of fibers mostly on their surfaces. Indeed, flower like-crystals with size up to 50 µm are observed corresponding to the hydrated COD (Figure 7c). On the other hand, Figure 8 shows the CaOx crystals grown on aligned chitosan–ESM. Here, we also found abundant crystals with different morphologies (Figure 8a,b), but with crystals less than 30 µm in size are mostly found on the surface of the ESM (Figure 8c) and regarding to the circumferential-shaped pattern, here it was not so regular on the ITO surface (Figure 8d). It is important to highlight that although a low resolution microscopy technique such as OM was used, it was possible to observe and distinguish the morphologies of the crystals and also to notice an oval-shaped crystal arrangement exclusively associated with the use of the chitosan–ESM matrices on ITO substrate.

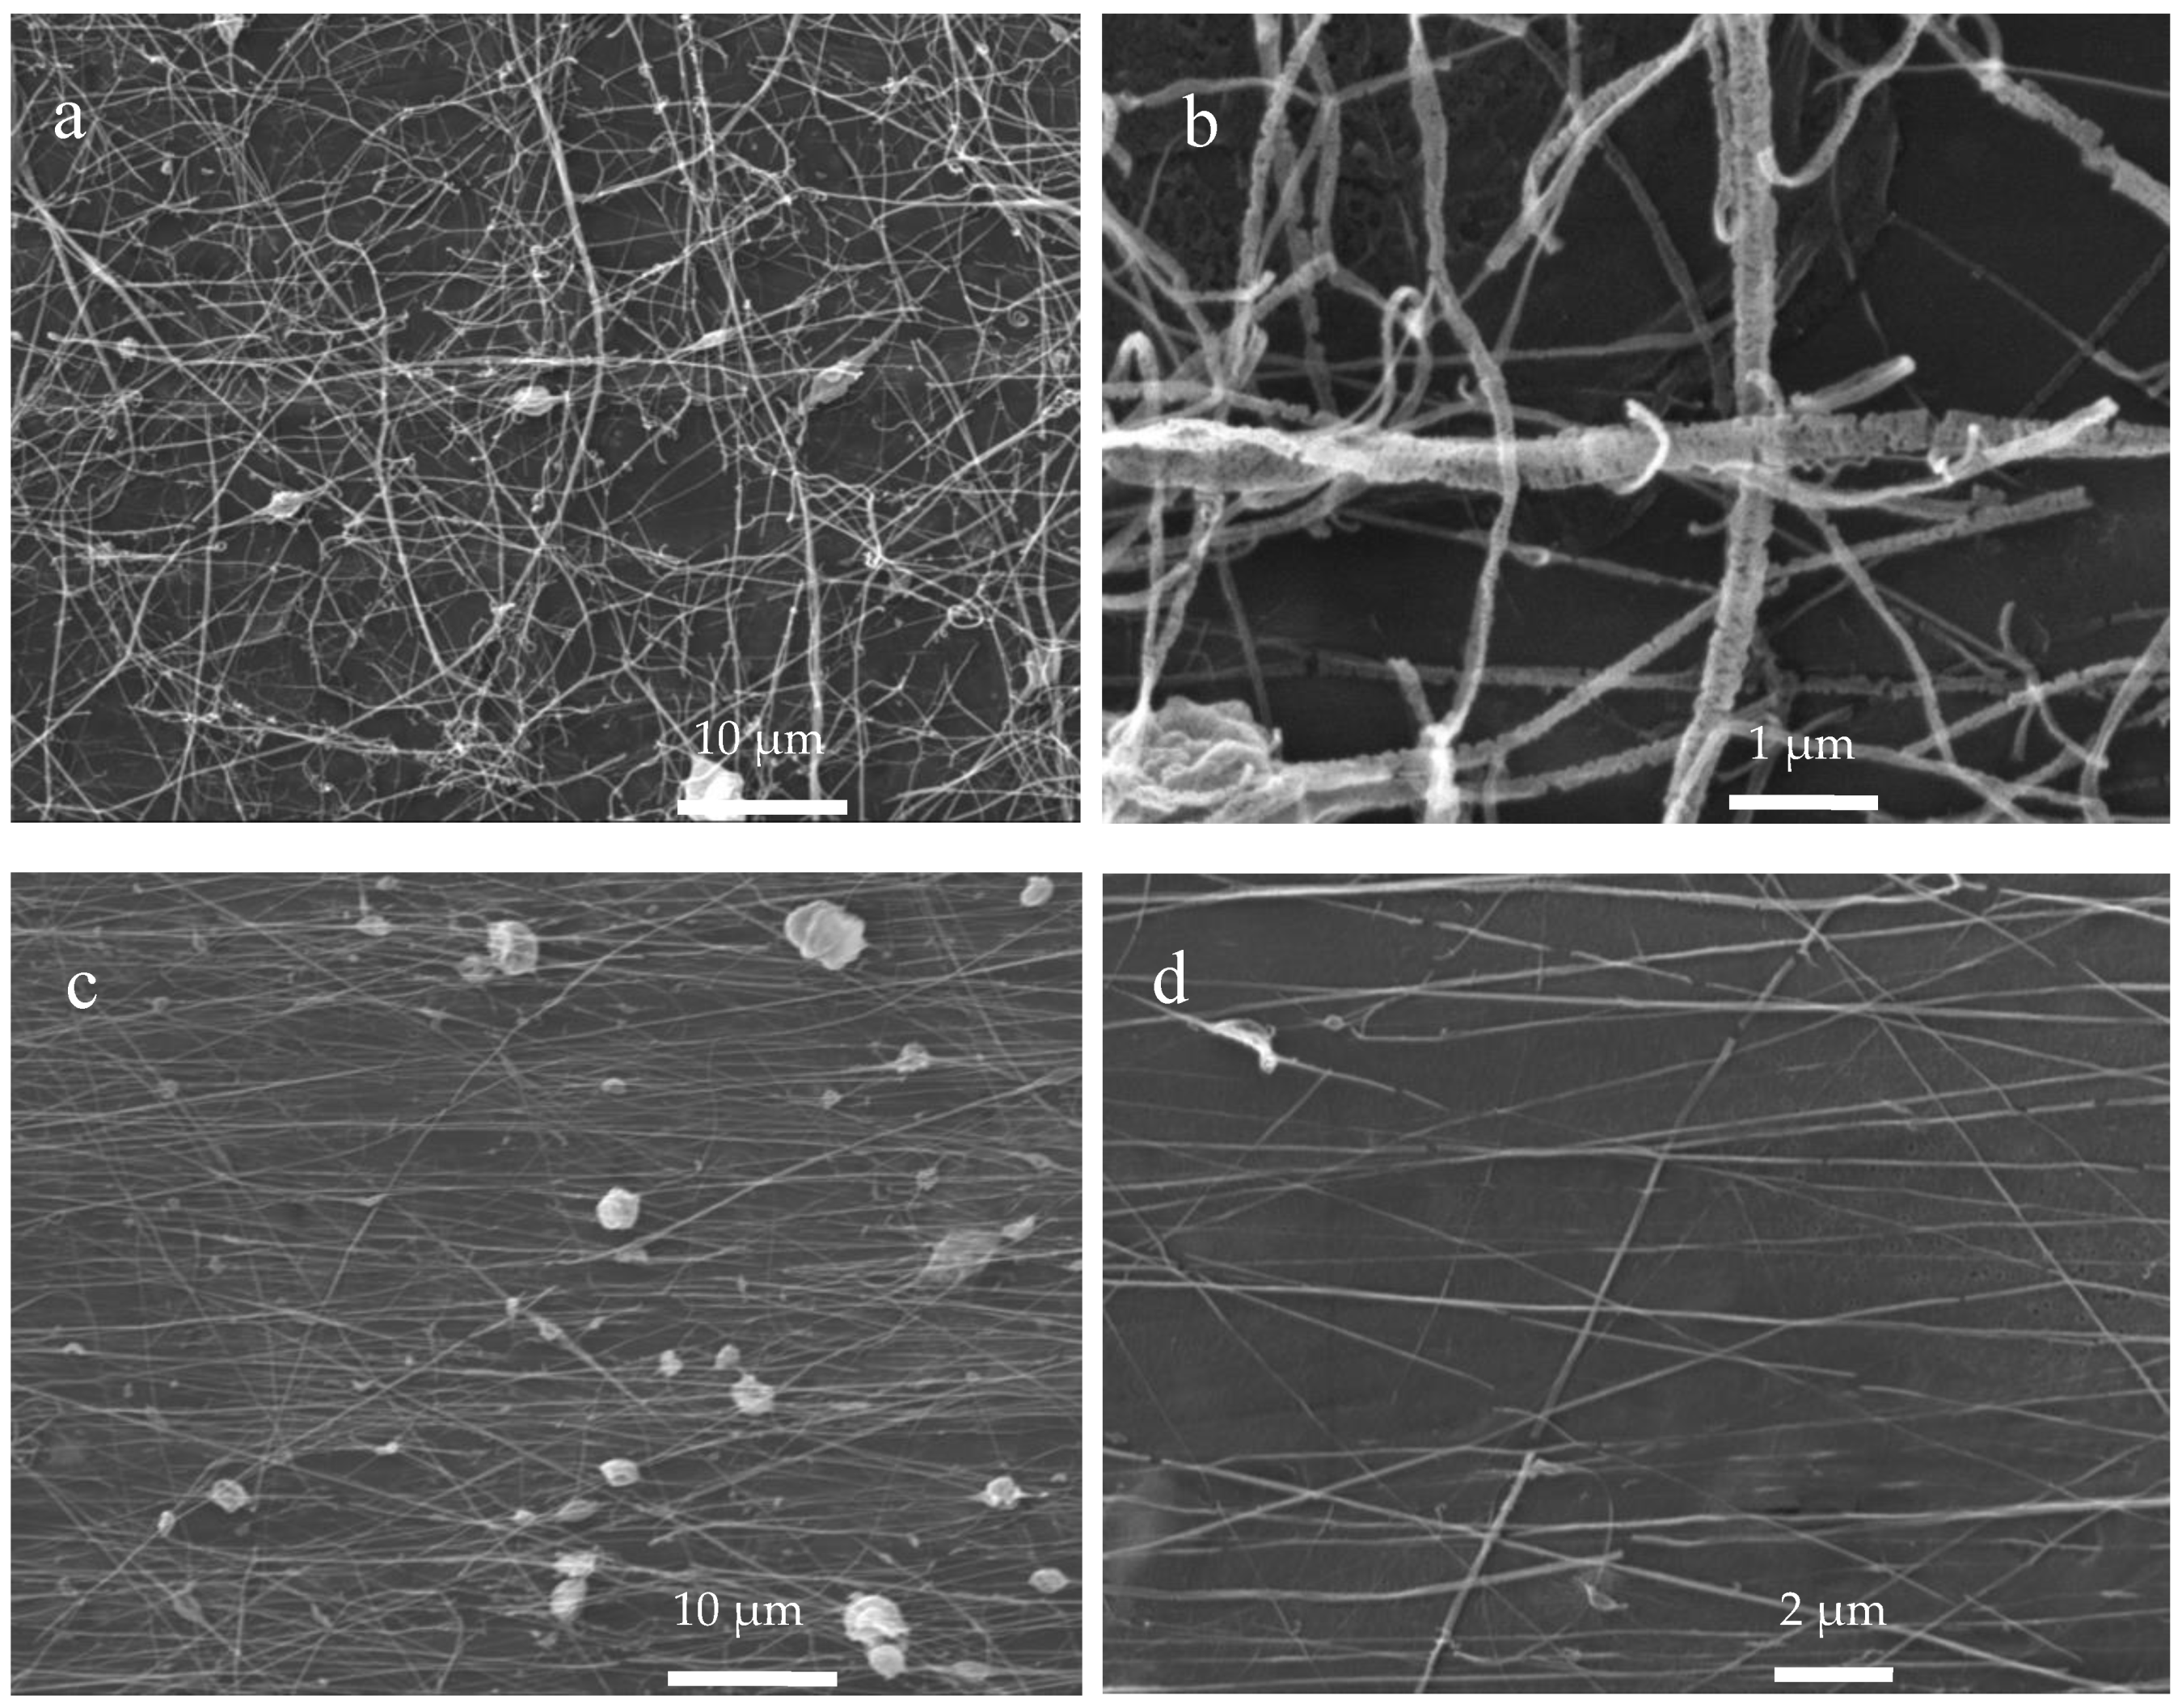
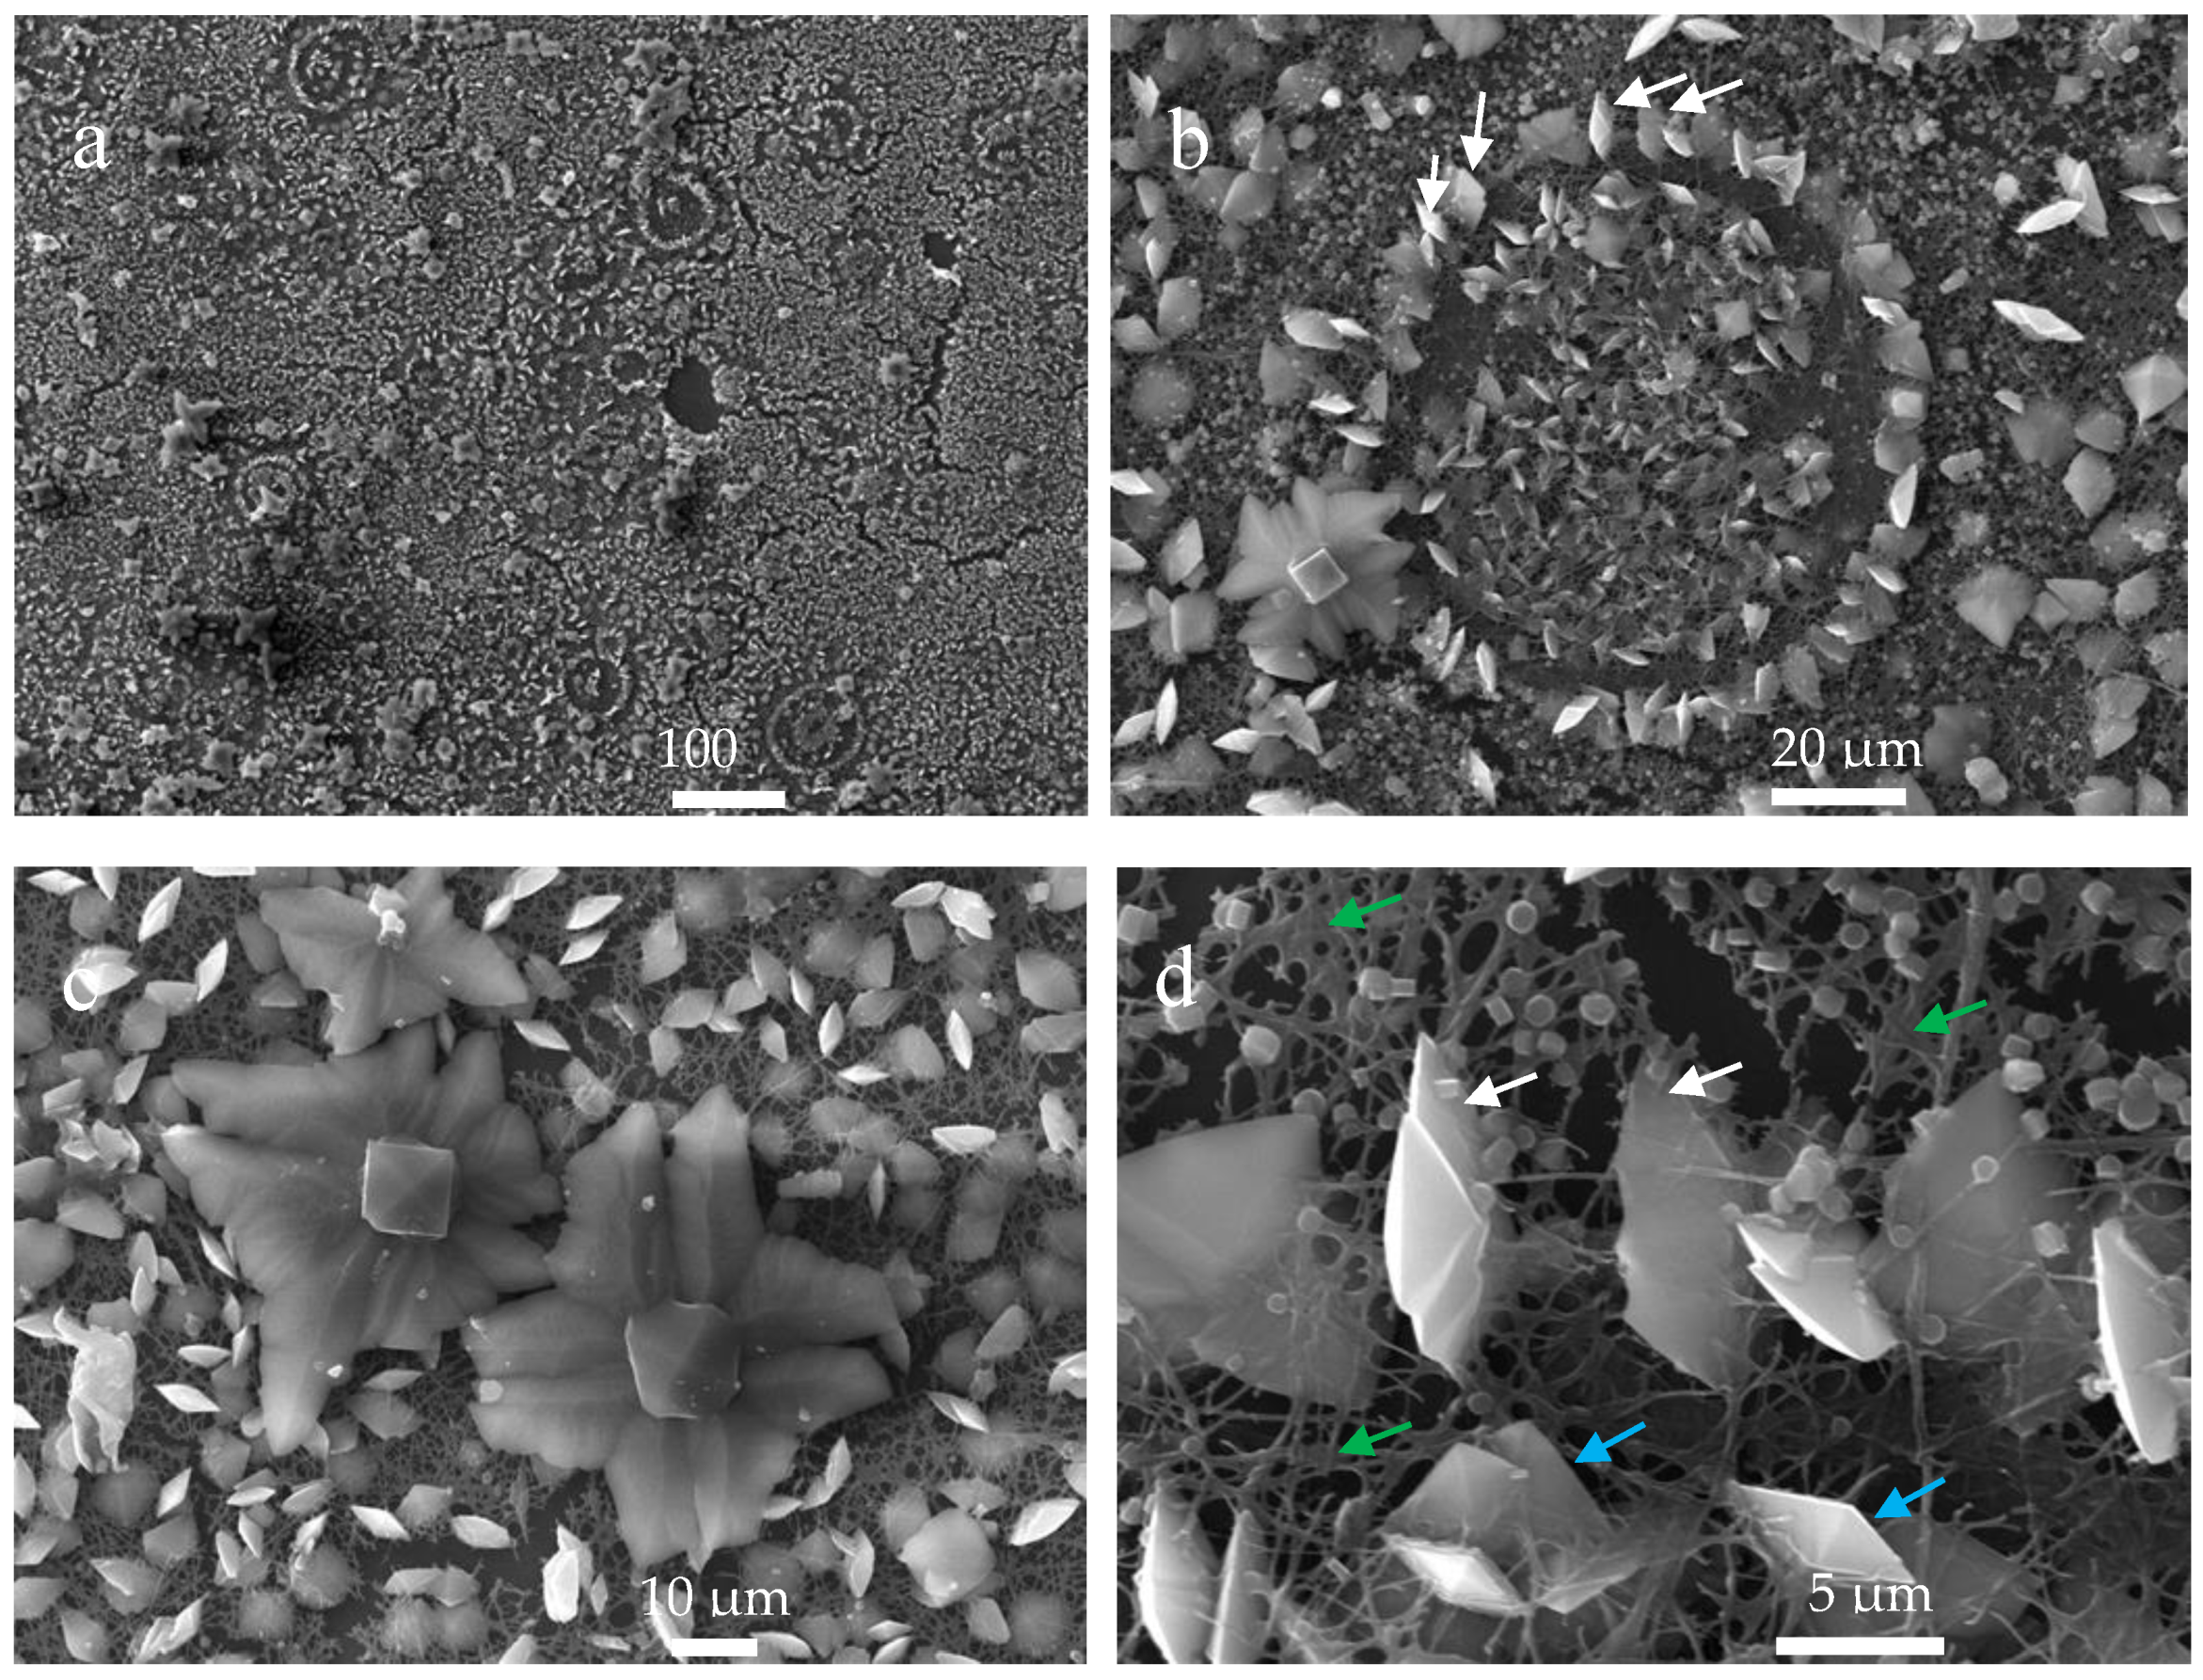
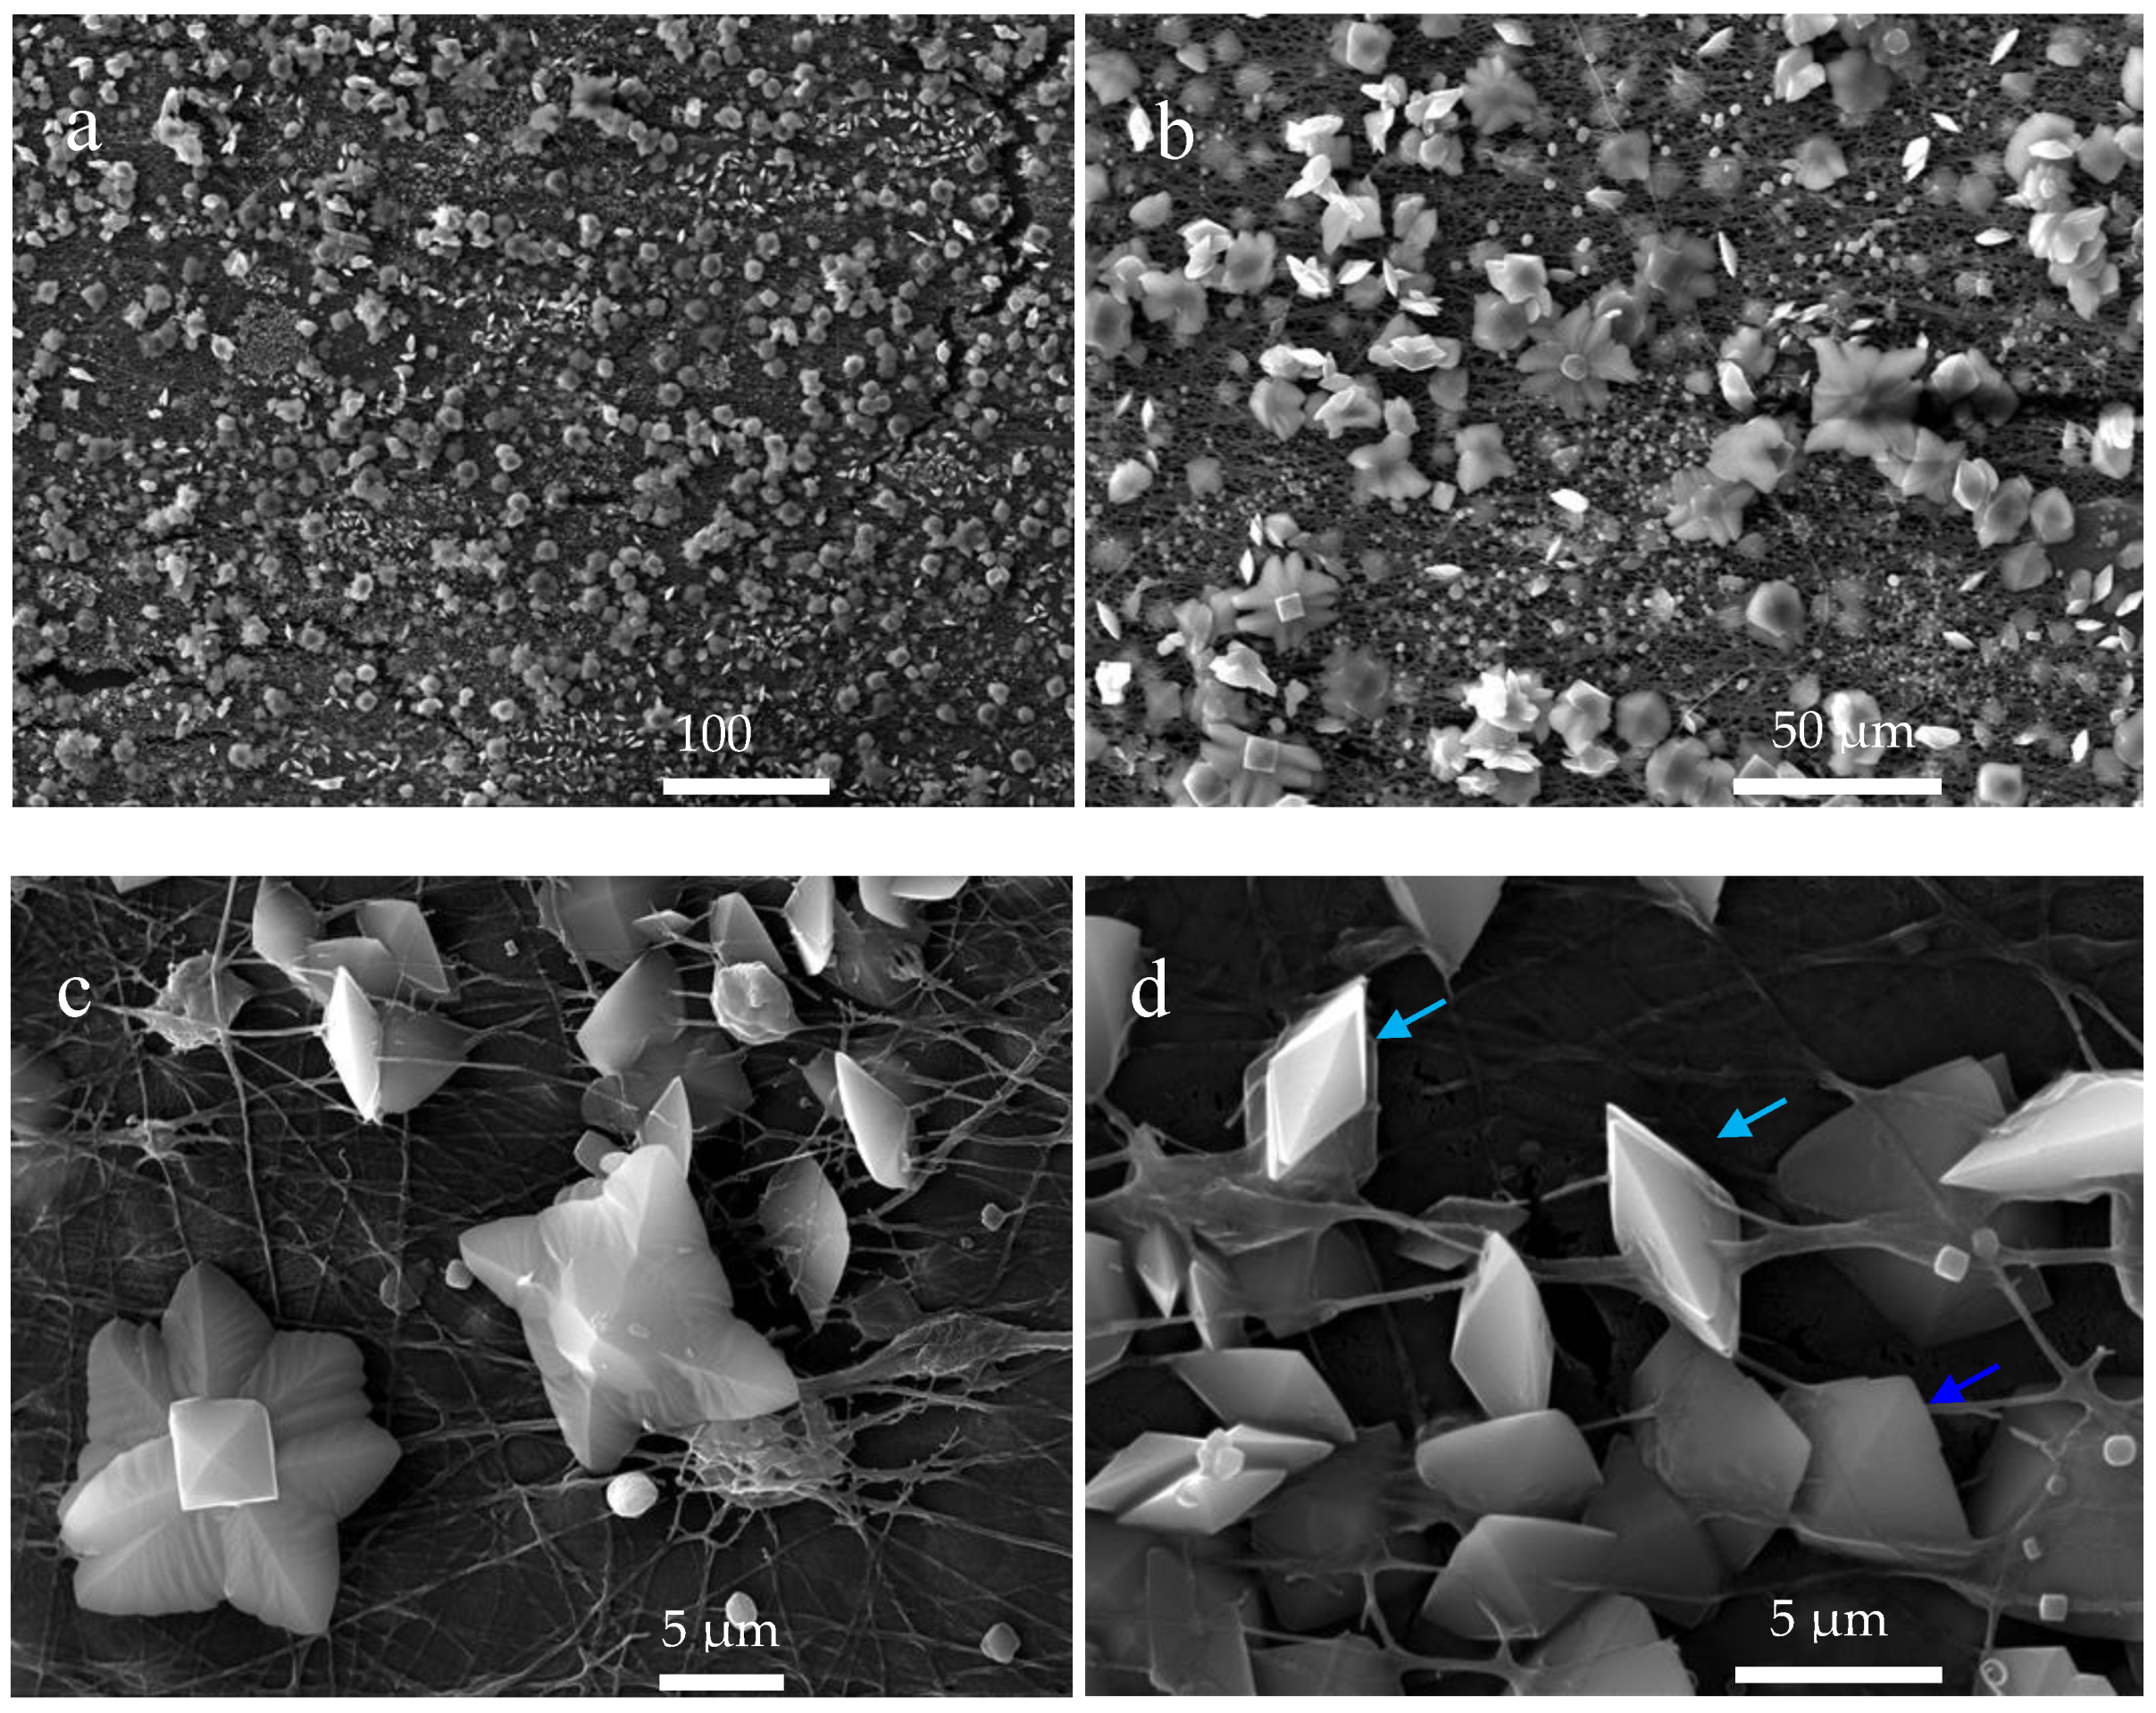
3.4. Scanning Electron Microscopy

Scanning electron microscopy (SEM) was used to observe in more details the morphological aspects of the electrospun R-chitosan (Figure 9a,b) and A-chitosan (Figure 9c,d) fibers obtained on the aluminum-covered collectors and the CaOx crystals grown on the ITO substrate. Figure 9a,b show the rough morphology of R-chitosan fibers surface associated with apparent damage. There was loss of continuity between fibers, but maintaining their fibrillar structure when using the flat collector showing a random arrangement with sizes from 80 to 300 nm. It is also possible to observe fiber agglomeration (beads) of size ca. 2 µm and very little formation of chitosan particles. Figure 9c,d show the morphology and arrangement of the A-chitosan fibers obtained with the rotary collector, where the fibers have a greater order and smoother surface, indicating less damage of A-chitosan than the observed in R-chitosan fibers. Here, we observe the presence of chitosan-particles of size ca. 2–4 µm and bead-chitosan fibers with more regular sizes close to 120 nm.
The SEM analysis of CaOx crystals obtained by EC on R-chitosan fibers as organic template shows a particular distribution of mineral particles. SEM images of the crystals at low magnification shows circumferential rearrangement (Figure 10a) and at higher magnification (Figure 10b–d) show, in certain areas of the sample, how the deposited mineral adopted circumferential shapes delimited with flat crystals, where most of them are positioned in the center of the circumferences. In the center of these shapes, bipyramidal COD crystals are observed (Figure 10b) and some of these crystals follow a radial orientation as is illustrated with the white arrows (Figure 10b,d). Moreover, Figure 10c,d show the presence of large flower-like crystals of size ca. 20 to 50 µm (Figure 10c) and abundant small circular crystals of size ca. 1 µm (Figure 10d) outside these circumferential rearrangements. On the other hand, no significant change was observed in the R-chitosan fibers before and after the EC of CaOx, however, some fibers seemed to be more fused as indicated with the green arrows (Figure 10d). The light blue arrows in Figure 10d indicate clearly the presence of the tetragonal COD phase of size ca. 5 µm as has been reported [32]. It is also seen that chitosan fibers interact with CaOx crystals, even crystals embedded in the chitosan–ESM matrix and some fibers that apparently cross the crystals are also observed.
When the CaOx EC experiment was performed with the ITOs supported with A-chitosan fibers, the SEM images shows CaOx crystals that did not follow the same circumferential-shaped pattern (Figure 11) unlike that observed with the R-chitosan fibers (Figure 10). This indicate that the oval shape adopted on the R-chitosan matrix does not have a direct relationship with a possible evaporation drops phenomenon on the ITO surface but rather is related to the orientation of the chitosan fibers during the EC of CaOx. In general, a greater abundance of smaller crystals (10–25 µm) with flower morphology (Figure 11b,c) and the tetragonal bipyramidal COD crystals (Figure 11d) of size ca. 5 µm were also observed. In Figure 11d, the white and green arrows indicate lateral and top views of the tetragonal COD phase, respectively [32]. As for A-chitosan fibers, it is possible to observe how these fibers apparently cross the CaOx crystals.

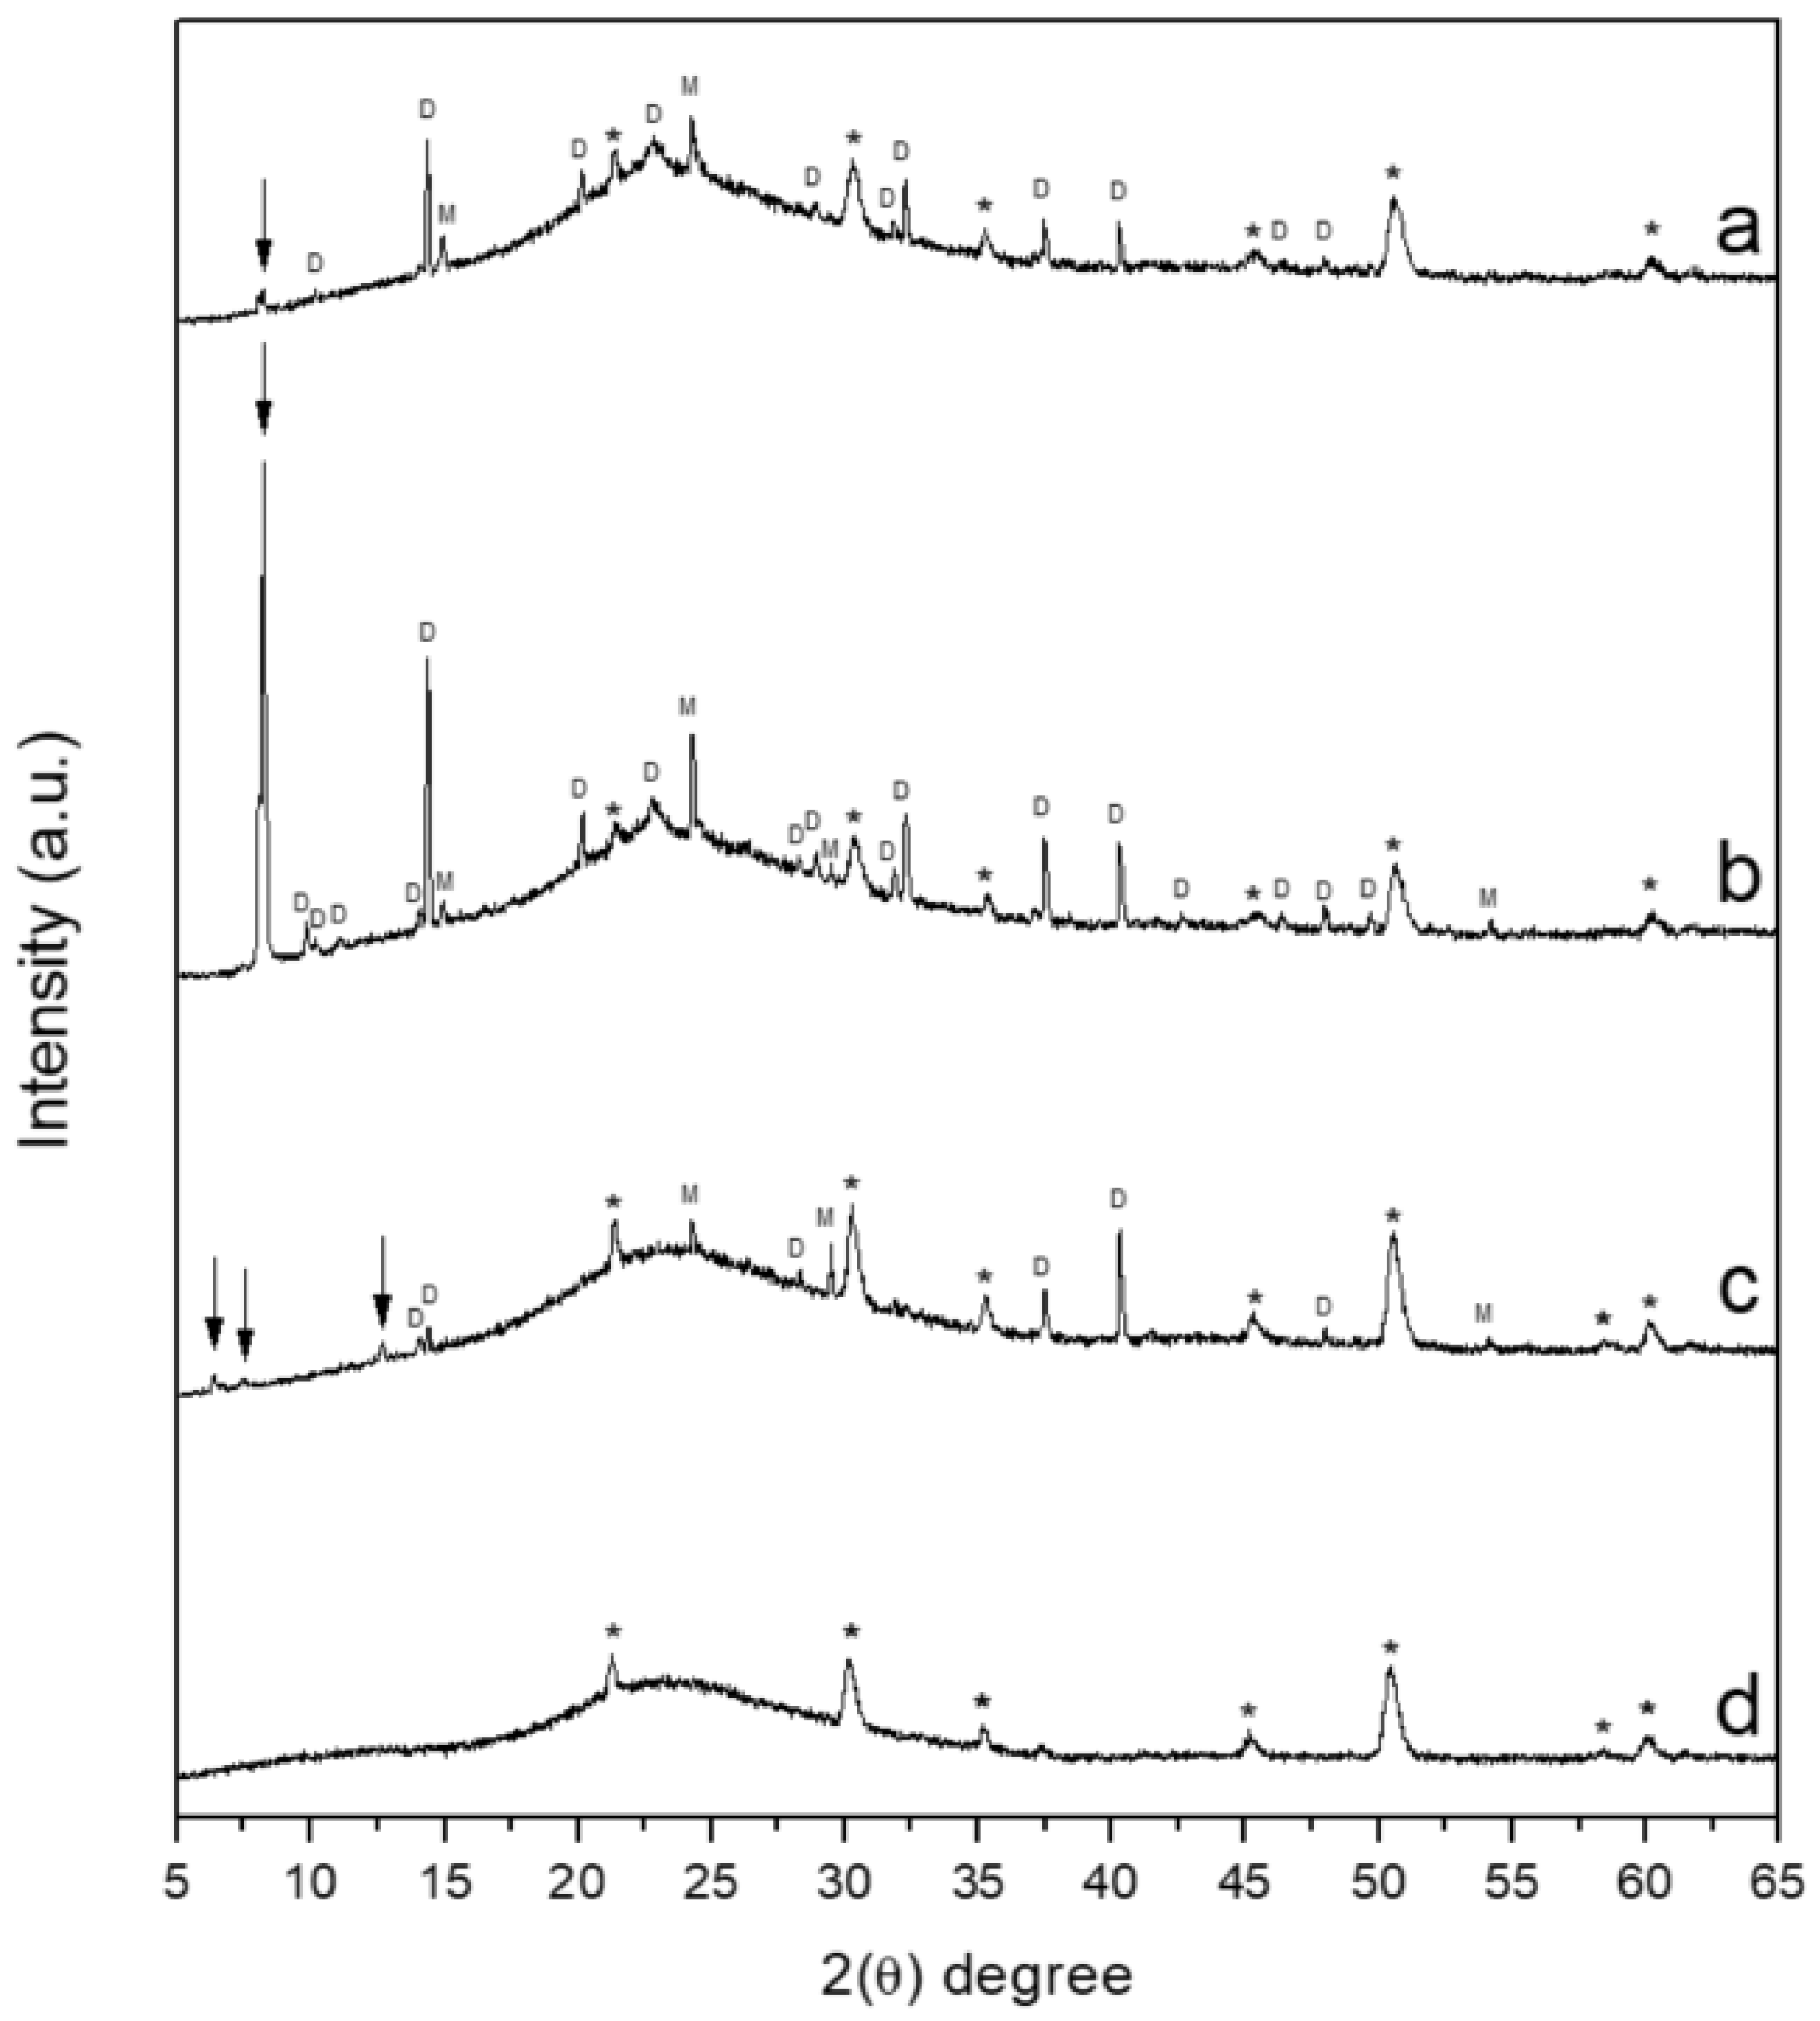
3.5. X-ray Diffraction (XRD)

X-ray diffraction analysis was used to characterize crystalline CaOx phases formed by using different chitosan–ESM matrices on ITO substrate. In general, XRD spectra of CaOx crystals obtained on ITO modified with R-chitosan fibers (Figure 12a), A-chitosan fibers (Figure 12b), and bare ITO substrate (control, Figure 12c) showed diffraction peaks belonging to COD and COM phases. However, more predominant crystallographic peaks were observed when chitosan fibers were used and the major number and even more intense reflections were detected when A-chitosan fibers was utilized. Moreover, some crystallographic peaks from ITO glass substrate in Figure 12a,b and all peaks from ITO glass can be clearly distinguished in Figure 12c, which can be explained by the greater number of CaOx crystals obtained with chitosan-EMS fibers than the bare ITO substrate, respectively. Thus, intense crystallographic peaks (2 Theta degree) at 14.3° (200), 32.2° (411), and 24.3° (020) were observed corresponding to COD and COM in the chitosan–ESM electrospun scaffolds and practically absent when ITO substrate as a control was utilized. In addition, the crystallographic peaks observed at 10.1°, 20.13°, 22.8°, 31.8°, 32.3°, 46.4°, and 49.6° corresponding to the COD crystals and at 14.9° (–101) corresponding to COM crystals were exclusively obtained in both chitosan–ESM scaffolds. In contrast, the crystallographic peaks at 37.46°, 40.28°, and 47.95° corresponding to the COD and 29.4° and 54.17° corresponding to COM, present in both chitosan-fibers, were also observed when ITO substrate was used (Figure 12b). In Figure 12b it is seen that the crystallographic peaks at 9.8°, 11.1°, and 49.6° corresponding to COD were only observed with A-chitosan fiber mesh as template. XRD results also showed unidentified diffraction peaks, where some of these are present in both chitosan–ESM fibers, while others are associated with one type of chitosan fibers and also to the ITO bare substrate (control, at 2θ = 6.3°, 7.4°, 12.6°). An unidentified phase at 2θ = 8.2° was observed in the presence of R-chitosan fibers (Figure 12a). This diffraction peak is very evident in A-chitosan fiber mesh (Figure 12b), however it is absent in the case of EC on the ITO bare substrate (control, Figure 12c) and does not correspond to ITO glass substrate (Figure 12d). This crystallographic peak was not assigned to a determined hydration state of CaOx, unless a micro-powder XRD using synchrotron facilities or micro-Raman spectroscopy is utilized. However, it could be associated to a tetragonal COD phase reflection as clearly shown in the SEM images of Figure 10 and Figure 11d.

4. Discussion

The preparation of chitosan electrospun mesh (chitosan–ESM) was successful. It should be noted that there are numerous works that have reported the electrospun of chitosan, however, this is usually done in combination with other polymers [33]. They mention factors such as the polycationic nature of chitosan, the large number of hydrogen bonds that form and the high viscosity of the chitosan solution that hinder the ability to electrospun chitosan solution. The current work was carried out according to the method described by Mo et al. [34], who recommend using chitosan solution with concentrations below 0.6%. The HFIP (1,1,1,3,3,3-hexafluoro-propan-2-ol) is described as good solvent for chitosan and achieve electrospun chitosan fibers. This can be explained considering the work of Ohkawa et al. [35], who used trifluoroacetic acid which is structurally similar to HFIP and is widely used in polymer and biomaterials science [36,37,38,39]. However, as seen in Figure 9b, we found that this solvent causes damage to the structure of the chitosan fibers. Moreover, we suspected that residual HFIP remains in the chitosan–ESM after electrospinning, therefore FTIR analysis was performed to corroborate the presence of HFIP. Indeed, the FTIR analysis showed characteristic absorption bands between 900 cm−1 and 1400 cm−1, particularly the absorption at 1180 cm−1 and 1100 cm−1 is attributed to the energy absorbed due to the C-H bending of HFIP solvent with chitosan–ESM (Figure 2b). This allows to infer that HFIP molecules are still present in the chitosan–ESM meshes after the electrospinning process, suggesting that it is necessary to optimize the electrospinning parameters.
The homogeneous preparation of electrospun A-chitosan fibers proved to be not a trivial process to obtain as it is for other polymers. This could be related to the intrinsic nature of chitosan, the low concentration (0.1%) of used chitosan solution and the repulsion between chitosan fibers, despite the effect induced by the rotary collecting plate (Figure 9c,d). We noticed that the morphology, distribution and interaction between chitosan fibers on the ITO substrate had a smooth change (Figure 10 and Figure 11). As observed in Figure 11, the A-chitosan fibers on the ITO seems to interact more between them after the EC. The above mentioned can be related to the effect of submerging the ITO containing the chitosan–ESM into EC solution and the subsequent formation of a non-conductive mineral onto the ITO surface, which allowed to register potential (V) fluctuations during the EC of CaOx as is observed in Figure 3.
SEM images of the A-chitosan fibers showed more regular sizes and of smaller diameter than the R-chitosan fibers, which could be related by the mechanical effect of stretching of the fiber during the electrospinning process [25] as well as the ventilation effect generated by the rotary collector, which allows the solvent to evaporate faster [40]. Moreover, the morphological aspect of CaOx crystals grown on chitosan–ESM, analyzed by OM and SEM, reveal the nature and topology of chitosan–ESM affect the nucleation of CaOx during the in vitro EC process. It is important to highlight that smaller number of crystals with regular structures where obtained in the control EC experiment without fibers, however, abundant crystals with different morphologies in the presence of chitosan–ESM were obtained. Also, the circumferential arrangements (falling drop) in the presence of R-chitosan and A-chitosan fibers were observed. As is known, here the coursing of the spherical droplet solution can be explained as a consequence of an Ostwald ripening process via solvent mediated recrystallization. The crystallization begins with nucleation, which plays a dominant role in determining the structure, shape and size distribution of crystals as was documented by Ostwald in the late 19th century [41]. Another point to take into account is the repulsion between fibers, which would be given by presence of surface-charged chitosan fibers. Here, chitosan–ESM with negative charges on the surface was induced, basically because the utilized ES equipment apply positive voltages to the chitosan solution. When 12 kV was applied, this potential exerted an effect on the chitosan solution, attracting hydroxyl groups (OH) to the surface and moving the amine groups (-NH2) inside the fibers. Consequently, this induces surface modification of chitosan–ESM resulting in negatively charged chitosan-fibers [42]. Therefore, the fibrillar organization of the chitosan–ESM could acquire flat surface and both functional groups are exposed on the surface, generating an alteration in the distribution of these groups or the surface charge.
The role of chitosan–ESM on the morphology and distribution of CaOx crystals can be observed at the edges and inside the oval shaped chitosan–ESM matrices (Figure 10 and Figure 11), where the crystals are arranged in oriented and fused manner with a morphology alluding to COD crystal. On the other hand, abundant small crystals of size ca. of 1 µm were observed outside the circular shaped chitosan–ESM matrices, which would indicate a greater number of nucleation points due to the greater availability of hydroxyl groups that attract Ca2+ ions. In addition, flower-like CaOx crystals were observed mostly outside these circular shaped chitosan–ESM, which were in the R-chitosan fibers (Figure 10c) the double larger-than in the A-chitosan fibers (Figure 11c). Indeed, it is possible to observe that the CaOx crystals are formed on the fibrillar ESM matrices and surrounding the chitosan-fibers. The effect of the chemical nature and topology of the chitosan–ESM matrix, where the CaOx particles formed during the in vitro EC process is also demonstrated by the XRD analysis, where the XRD of crystals formed on the ITO modified with R-chitosan and A-chitosan fiber surfaces (Figure 12a,b) was different to crystals grown on the ITO bare substrate (control, Figure 12c). Although the coexistence of the hydrated forms of COM and COD on both chitosan-fibers meshes were found, new diffraction peaks mostly related to COD form appeared. The XRD spectra of CaOx crystals from A-chitosan fiber showed more diffraction peaks and the COD reflections were more intense. Therefore, under our experimental EC condition, more COD crystals were formed as well as possible transformation of COM to COD can be promoted. These findings demonstrate firstly the ability of chitosan–ESM to stabilize the more stable tetragonal COD phase and, secondly, how the orientation of chitosan fiber is a key factor for crystallizing most effectively COD than COM according to our established EC procedure. Finally, we believe that the non-identified phase detected at 2θ = 8.2° (according to the JCPDS cards, numbers 20-231 and 17-541), detected only in the presence of chitosan–ESM fibers, being this more intense in the presence of A-chitosan than R-chitosan fibers, could be associated to the tetragonal phase when chitosan fibers were used.

5. Conclusions

R-chitosan and A-chitosan fibers were prepared from 0.1% chitosan solution using HFIP as solvent through ES technique directly on ITO glass substrates. Both chitosan-EMS matrices were for the first time utilized as an organic template for the in vitro EC of CaOx. The chitosan–ESM templates showed an active role on the mineralization of CaOx process, demonstrating that the resulting CaOx crystals is dependent on both the chemical nature and the distribution of chitosan fibers. Our results show that it was possible to stabilize the hydrated forms of COM and the metastable form of COD. These findings are very auspicious and could continue to be addressed in a future work using e.g., anionic chitosan-fiber as candidate for ESM-fiber template for EC of CaOx. The morphological aspects and type of CaOx crystals formed on the ITO substrates were analyzed by OM, SEM, and XRD techniques. In summary, given their unique properties—such as porosity and large surface area, high productivity, shape, and topography control—electrospun polymer fibers are excellent candidates for scaffolds for different purposes such as tissue engineering, as carriers in drug delivery, matrixes in wound dressing, and in the biomineralization field. In the biomineralization, we believe that the study of the influence of the chitosan fiber arrangement as template on the in vitro EC of CaOx or other Ca-minerals may help to provide new findings for understanding the ability of solid templates or additives to inhibit or promote the process of CaOx precipitation and by this manner to understand better the formation of undesirable and slightly soluble mineral deposits in the soft tissues, a pathological biomineralization process that results in mammalian urolithiasis.

Author Contributions

N.B., N.C.V., F.D.-S. conceived, designed, and performed the experiments; N.B. and A.N.-C. wrote the manuscript. M.Y.-P. contributed with partial experimental work. A.N.-C. contributed reagents/materials/analysis tools and represents the senior author, and he is the principal investigator of the 1171520 FONDECYT project, in which the current research work was realized. Therefore, A.N.C. provided the intellectual input, the designs, and approved the reported protocols of this study. A.N.-C. and M.Y.-P. were responsible for the manuscript correction, proof reading during paper submission, handling the revisions, and re-submission process of the revised manuscript. All authors have read and agreed to the published version of the manuscript.

Funding

This research was supported by FONDECYT 1171520 granted by the Chilean Council for Science and Technology (CONICYT program).

Conflicts of Interest

The authors declare no conflict of interest.

References

  1. Fratzl, P.; Kolednik, O.; Fischer, F.D.; Dean, M.N. The mechanics of tessellations–bioinspired strategies for fracture resistance. Chem. Soc. Rev. 2016, 45, 252–267. [Google Scholar] [PubMed] [Green Version]
  2. Demichelis, R.; Schuitemaker, A.; Garcia, N.A.; Koziara, K.B.; De La Pierre, M.; Raiteri, P.; Gale, J.D. Simulation of crystallization of biominerals. Ann. Rev. Mater. Res. 2018, 48, 327–352. [Google Scholar] [CrossRef]
  3. Weiner, S.; Dove, P.M. An overview of biomineralization processes and the problem of the vital effect. Rev. Mineral. Geochem. 2003, 54, 1–29. [Google Scholar] [CrossRef]
  4. Neira-Carrillo, A.; Vásquez-Quitral, P.; Sánchez, M.; Vargas-Fernández, A.; Silva, J.F. Control of calcium oxalate morphology through electrocrystallization as an electrochemical approach for preventing pathological disease. Ionics 2015, 21, 3141–3149. [Google Scholar]
  5. Ruiz-Agudo, E.; Burgos-Cara, A.; Ruiz-Agudo, C.; Ibañez-Velasco, A.; Cölfen, H.; Rodriguez-Navarro, C. A non-classical view on calcium oxalate precipitation and the role of citrate. Nat. Commun. 2017, 8, 768. [Google Scholar] [CrossRef] [PubMed] [Green Version]
  6. Daudon, M.; Bazin, D.; Letavernier, E. Randall’s plaque as the origin of calcium oxalate kidney stones. Urolithiasis 2015, 43, 5–11. [Google Scholar] [CrossRef] [PubMed] [Green Version]
  7. Sun, X.Y.; Ouyang, J.M.; Xu, M. Synthesis, characterization, and cytotoxicity assay of calcium oxalate dihydrate crystals in various shapes. CrystEngComm 2016, 18, 5463–5473. [Google Scholar] [CrossRef]
  8. Sánchez, M.; Vásquez-Quitral, P.; Butto, N.; Díaz-Soler, F.; Yazdani-Pedram, M.; Silva, J.F.; Neira-Carrillo, A. Effect of alginate from Chilean Lessonia nigrescens and MWCNTs on CaCO3 crystallization by classical and non-classical methods. Crystals 2018, 8, 69. [Google Scholar]
  9. Arias, J.L.; Fernández, M.S. Polysaccharides and proteoglycans in calcium carbonate-based biomineralization. Chem. Rev. 2008, 108, 4475–4482. [Google Scholar] [CrossRef]
  10. Neira-Carrillo, A.; Yazdani-Pedram, M.; Retuert, J.; Diaz-Dosque, M.; Gallois, S.; Arias, J.L. Selective crystallization of calcium salts by poly (acrylate)-grafted chitosan. J. Colloid Interface Sci. 2005, 286, 134–141. [Google Scholar] [CrossRef]
  11. Neira-Carrillo, A.; Fernández, M.S.; Hevia, G.P.; Arias, J.L.; Gebauer, D.; Cölfen, H. Retrosynthesis of CaCO3 via amorphous precursor particles using gastroliths of the Red Claw lobster (Cherax quadricarinatus). J. Struct. Biol. 2017, 199, 46–56. [Google Scholar] [CrossRef] [PubMed] [Green Version]
  12. Rinaudo, M. Chitin and chitosan: Properties and applications. Prog. Polym. Sci. 2006, 31, 603–632. [Google Scholar] [CrossRef]
  13. Younes, I.; Rinaudo, M. Chitin and chitosan preparation from marine sources. Structure, properties and applications. Mar. Drugs 2015, 13, 1133–1174. [Google Scholar] [CrossRef] [PubMed] [Green Version]
  14. Zargar, V.; Asghari, M.; Dashti, A. A review on chitin and chitosan polymers: Structure, chemistry, solubility, derivatives, and applications. ChemBioEng Rev. 2015, 2, 204–226. [Google Scholar] [CrossRef]
  15. Ohkawa, K.; Cha, D.; Kim, H.; Nishida, A.; Yamamoto, H. Electrospinning of Chitosan. Macromol. Rapid Commun. 2004, 25, 1600–1605. [Google Scholar] [CrossRef]
  16. Pham, Q.P.; Sharma, U.; Mikos, A.G. Electrospinning of polymeric nanofibers for tissue engineering applications: A review. Tissue Eng. 2006, 12, 1197–1211. [Google Scholar] [CrossRef] [Green Version]
  17. Rodríguez-Vásquez, M.; Vega-Ruiz, B.; Ramos-Zúñiga, R.; Saldaña-Koppel, D.A.; Quiñones-Olvera, L.F. Chitosan and its potential use as a scaffold for tissue engineering in regenerative medicine. BioMed Res. Int. 2015, 2015, 15. [Google Scholar] [CrossRef] [Green Version]
  18. Qasim, S.B.; Zafar, M.S.; Najeeb, S.; Khurshid, Z.; Shah, A.H.; Husain, S.; Rehman, I.U. Electrospinning of chitosan-based solutions for tissue engineering and regenerative medicine. Int. J. Mol. Sci. 2018, 19, 407. [Google Scholar] [CrossRef] [Green Version]
  19. Küther, J.; Seshadri, R.; Knoll, W.; Tremel, W. Templated growth of calcite, vaterite and aragonite crystals onself-assembled monolayers of substituted alkylthiols on gold. J. Mater. Chem. 1998, 8, 641–650. [Google Scholar] [CrossRef]
  20. Chun, Y.W.; Khang, D.; Haberstroh, K.M.; Webster, T.J. The role of polymer nanosurface roughness and submicron pores in improving bladder urothelial cell density and inhibiting calcium oxalate stone formation. Nanotechnology 2009, 20, 085104. [Google Scholar] [CrossRef]
  21. Fernandes Queiroz, M.; Melo, K.; Sabry, D.; Sassaki, G.; Rocha, H. Does the use of chitosan contribute to oxalate kidney stone formation? Mar. Drugs 2015, 13, 141–158. [Google Scholar] [CrossRef] [PubMed]
  22. Cao, Z.; Wang, D.; Lyu, L.; Gong, Y.; Li, Y. Fabrication and characterization of PCL/CaCO3 electrospun composite membrane for bone repair. RSC Adv. 2016, 6, 10641–10649. [Google Scholar] [CrossRef]
  23. Fujihara, K.; Kotaki, M.; Ramakrishna, S. Guided bone regeneration membrane made of polycaprolactone/calcium carbonate composite nano-fibers. Biomaterials 2005, 26, 4139–4147. [Google Scholar] [CrossRef] [PubMed]
  24. Reneker, D.H.; Chun, I. Nanometre diameter fibres of polymer, produced by electrospinning. Nanotechnology 1996, 7, 216–223. [Google Scholar] [CrossRef] [Green Version]
  25. Burger, C.; Hsiao, B.S.; Chu, B. Nanofibrous materials and their applications. Ann. Rev. Mater. Res. 2006, 36, 333–368. [Google Scholar] [CrossRef]
  26. Kishan, A.P.; Cosgriff-Hernandez, E.M. Recent advancements in electrospinning design for tissue engineering applications: A review. J. Biomed. Mater. Res. Part A 2017, 105, 2892–2905. [Google Scholar] [CrossRef]
  27. Xiao, Y.; Shen, M.; Shi, X. Design of functional electrospun nanofibers for cancer cell capture applications. J. Mater. Chem. B 2018, 6, 1420–1432. [Google Scholar] [CrossRef]
  28. Joseph, S.; Kamath, P.V. Synthesis of different polymorphic modifications of calcium oxalate by electrodeposition. J. Solid State Electrochem. 2010, 14, 1481–1486. [Google Scholar] [CrossRef]
  29. Dinamani, M.; Kamath, P.V.; Seshadri, R. Deposition of oriented SrSO4 coatings by electrogeneration of acid. Solid State Sci. 2003, 5, 805–810. [Google Scholar] [CrossRef]
  30. Kameda, T.; Kojima, K.; Miyazawa, M.; Fujiwara, S. Film Formation and Structural Characterization of Silk of the Hornet Vespa simillima xanthoptera Cameron. Z. Naturforschung C 2005, 60, 906–914. [Google Scholar] [CrossRef]
  31. Ketrane, R.; Saidani, B.; Gil, O.; Leleyter, L.; Baraud, F. Efficiency of five scale inhibitors on calcium carbonate precipitation from hard water: Effect of temperature and concentration. Desalination 2009, 249, 1397–1404. [Google Scholar] [CrossRef]
  32. Jáuregui-Zúñiga, D.; Reyes-Grajeda, J.P.; Sepúlveda-Sánchez, J.D.; Whitaker, J.R.; Moreno, A. Crystallochemical characterization of calcium oxalate crystals isolated from seed coats of Phaseolus vulgaris and leaves of Vitis vinifera. J. Plan Physiol. 2003, 160, 239–245. [Google Scholar] [CrossRef] [PubMed]
  33. Naseri, N.; Mathew, A.P.; Girandon, L.; Fröhlich, M.; Oksman, K. Porous electrospun nanocomposite mats based on chitosan–cellulose nanocrystals for wound dressing: Effect of surface characteristics of nanocrystals. Cellulose 2015, 22, 521–534. [Google Scholar] [CrossRef]
  34. Mo, X.; Chen, Z.; Weber, H.J. Electrospun nanofibers of collagen-chitosan and P (LLA-CL) for tissue engineering. Front. Mater. Sci. China 2007, 1, 20–23. [Google Scholar] [CrossRef]
  35. Ohkawa, K.; Minato, K.I.; Kumagai, G.; Hayashi, S.; Yamamoto, H. Chitosan nanofiber. Biomacromolecules 2006, 7, 3291–3294. [Google Scholar] [CrossRef]
  36. Colomer, I.; Chamberlain, A.E.R.; Haughey, M.B.; Donohoe, T.J. Hexafluoroisopropanol as a highly versatile solvent. Nat. Rev. Chem. 2017, 1, 0088. [Google Scholar] [CrossRef]
  37. Rajkhowa, R.; Gil, E.S.; Kluge, J.; Numata, K.; Wang, L.; Wang, X.; Kaplan, D.L. Reinforcing Silk Scaffolds with Silk Particles. Macromol. Biosci. 2010, 10, 599–611. [Google Scholar] [CrossRef] [Green Version]
  38. Homayoni, H.; Ravandi, S.A.H.; Valizadeh, M. Electrospinning of chitosan nanofibers: Processing optimization. Carbohydr. Polym. 2009, 77, 656–661. [Google Scholar] [CrossRef]
  39. Pillai, C.K.S.; Paul, W.; Sharma, C.P. Chitin and chitosan polymers: Chemistry, solubility and fiber formation. Prog. Polym. Sci. 2009, 34, 641–678. [Google Scholar] [CrossRef]
  40. Mirjalili, M.; Zohoori, S. Review for application of electrospinning and electrospun nanofibers technology in textile industry. J. Nanostruct. Chem. 2016, 6, 207–213. [Google Scholar] [CrossRef] [Green Version]
  41. Ostwald, W. Studien über die Umwandlung fester körper. Z. Phys. Chem. 1897, 22, 289–330. [Google Scholar] [CrossRef]
  42. Szewczyk, P.K.; Metwally, S.; Karbowniczek, J.E.; Marzec, M.M.; Stodolak-Zych, E.; Gruszczyński, A.; Bernasik, A.; Stachewicz, U. Surface-potential-controlled cell proliferation and collagen mineralization on electrospun polyvinylidene fluoride (PVDF) fiber scaffolds for bone regeneration. ACS Biomater. Sci. Eng. 2018, 5, 582–593. [Google Scholar] [CrossRef]
Figure 1. Optical images illustrating the preparation of chitosan–ESM on pieces of ITO substrate before the in vitro EC of CaOx glued on (a) rotating drum (rotation speed of 1800 rpm, clockwise) and (b) flat plate collectors. White, green, and blue arrows indicate working electrode, ITO glass with chitosan fibers and aluminum foil, respectively.
Crystals 10 00453 g001
Figure 2. FTIR of (a) Chitosan powder and (b) ESM composed of R-chitosan fibers.
Crystals 10 00453 g002
Figure 3. Chronophotenciometry of EC of CaOx performed on ITO substrate modified with chitosan–ESM fibers. (a) Control (bare substrate), (b) R-chitosan fibers, (c) A-chitosan fibers.
Crystals 10 00453 g003
Figure 4. OM images of R-chitosan fibers supported on ITO substrate at (a) 10× and (b) 40× magnifications.
Crystals 10 00453 g004
Figure 5. OM images of A-chitosan fibers supported on ITO substrate at (a) 10× and (b) 40× magnifications.
Crystals 10 00453 g005
Figure 6. OM images of CaOx crystals obtained on ITO substrate at (a) 10× and (bd) 40× magnifications.
Crystals 10 00453 g006
Figure 7. OM images of CaOx crystals obtained on ITO substrate modified with R-chitosan fibers at (a) 10× and (bd) 40× magnifications.
Crystals 10 00453 g007
Figure 8. OM images of CaOx crystals obtained on ITO substrate modified with A-chitosan fibers (a) 10× and (bd) 40× magnifications.
Crystals 10 00453 g008
Figure 9. SEM images of chitosan fibers. (a,b) R-chitosan fibers and (c,d) A-chitosan fibers.
Crystals 10 00453 g009
Figure 10. SEM images of CaOx crystals obtained via EC on ITO modified with R-chitosan fibers at different magnifications showing circumferential rearrangement with radial orientation (a,b) and flower-like crystals (c) and tetragonal COD (d) crystals. White, green, and light blue indicate radial orientation of crystals, fiber fusion, and the tetragonal COD phase, respectively.
Crystals 10 00453 g010
Figure 11. SEM images of CaOx crystals obtained via EC on ITO modified with A-chitosan fibers at different magnifications showing the abundance of smaller crystals (a) with flower morphology (b,c) and the tetragonal bipyramidal COD (d) crystals. Light blue and blue arrows indicate lateral and top views of the tetragonal COD phase, respectively.
Crystals 10 00453 g011
Figure 12. XRD diffractograms of CaOx crystals obtained on ITO substrate modified: (a) with R-chitosan fibers, (b) with A-chitosan fibers, (c) ITO (control, bare substrate), and (d) ITO glass substrate. The designations of D, M, * and ↓ correspond to COD, COM, reflections from ITO glass and the unidentified phases, respectively.
Crystals 10 00453 g012

