Effect of Equal Channel Angular Pressing on Microstructure and Mechanical Properties of a Cu-Mg Alloy


Abstract
1. Introduction
2. Materials and Methods
3. Results
4. Discussion
4.1. Mechanism for Inhomogeneity Phenomenon
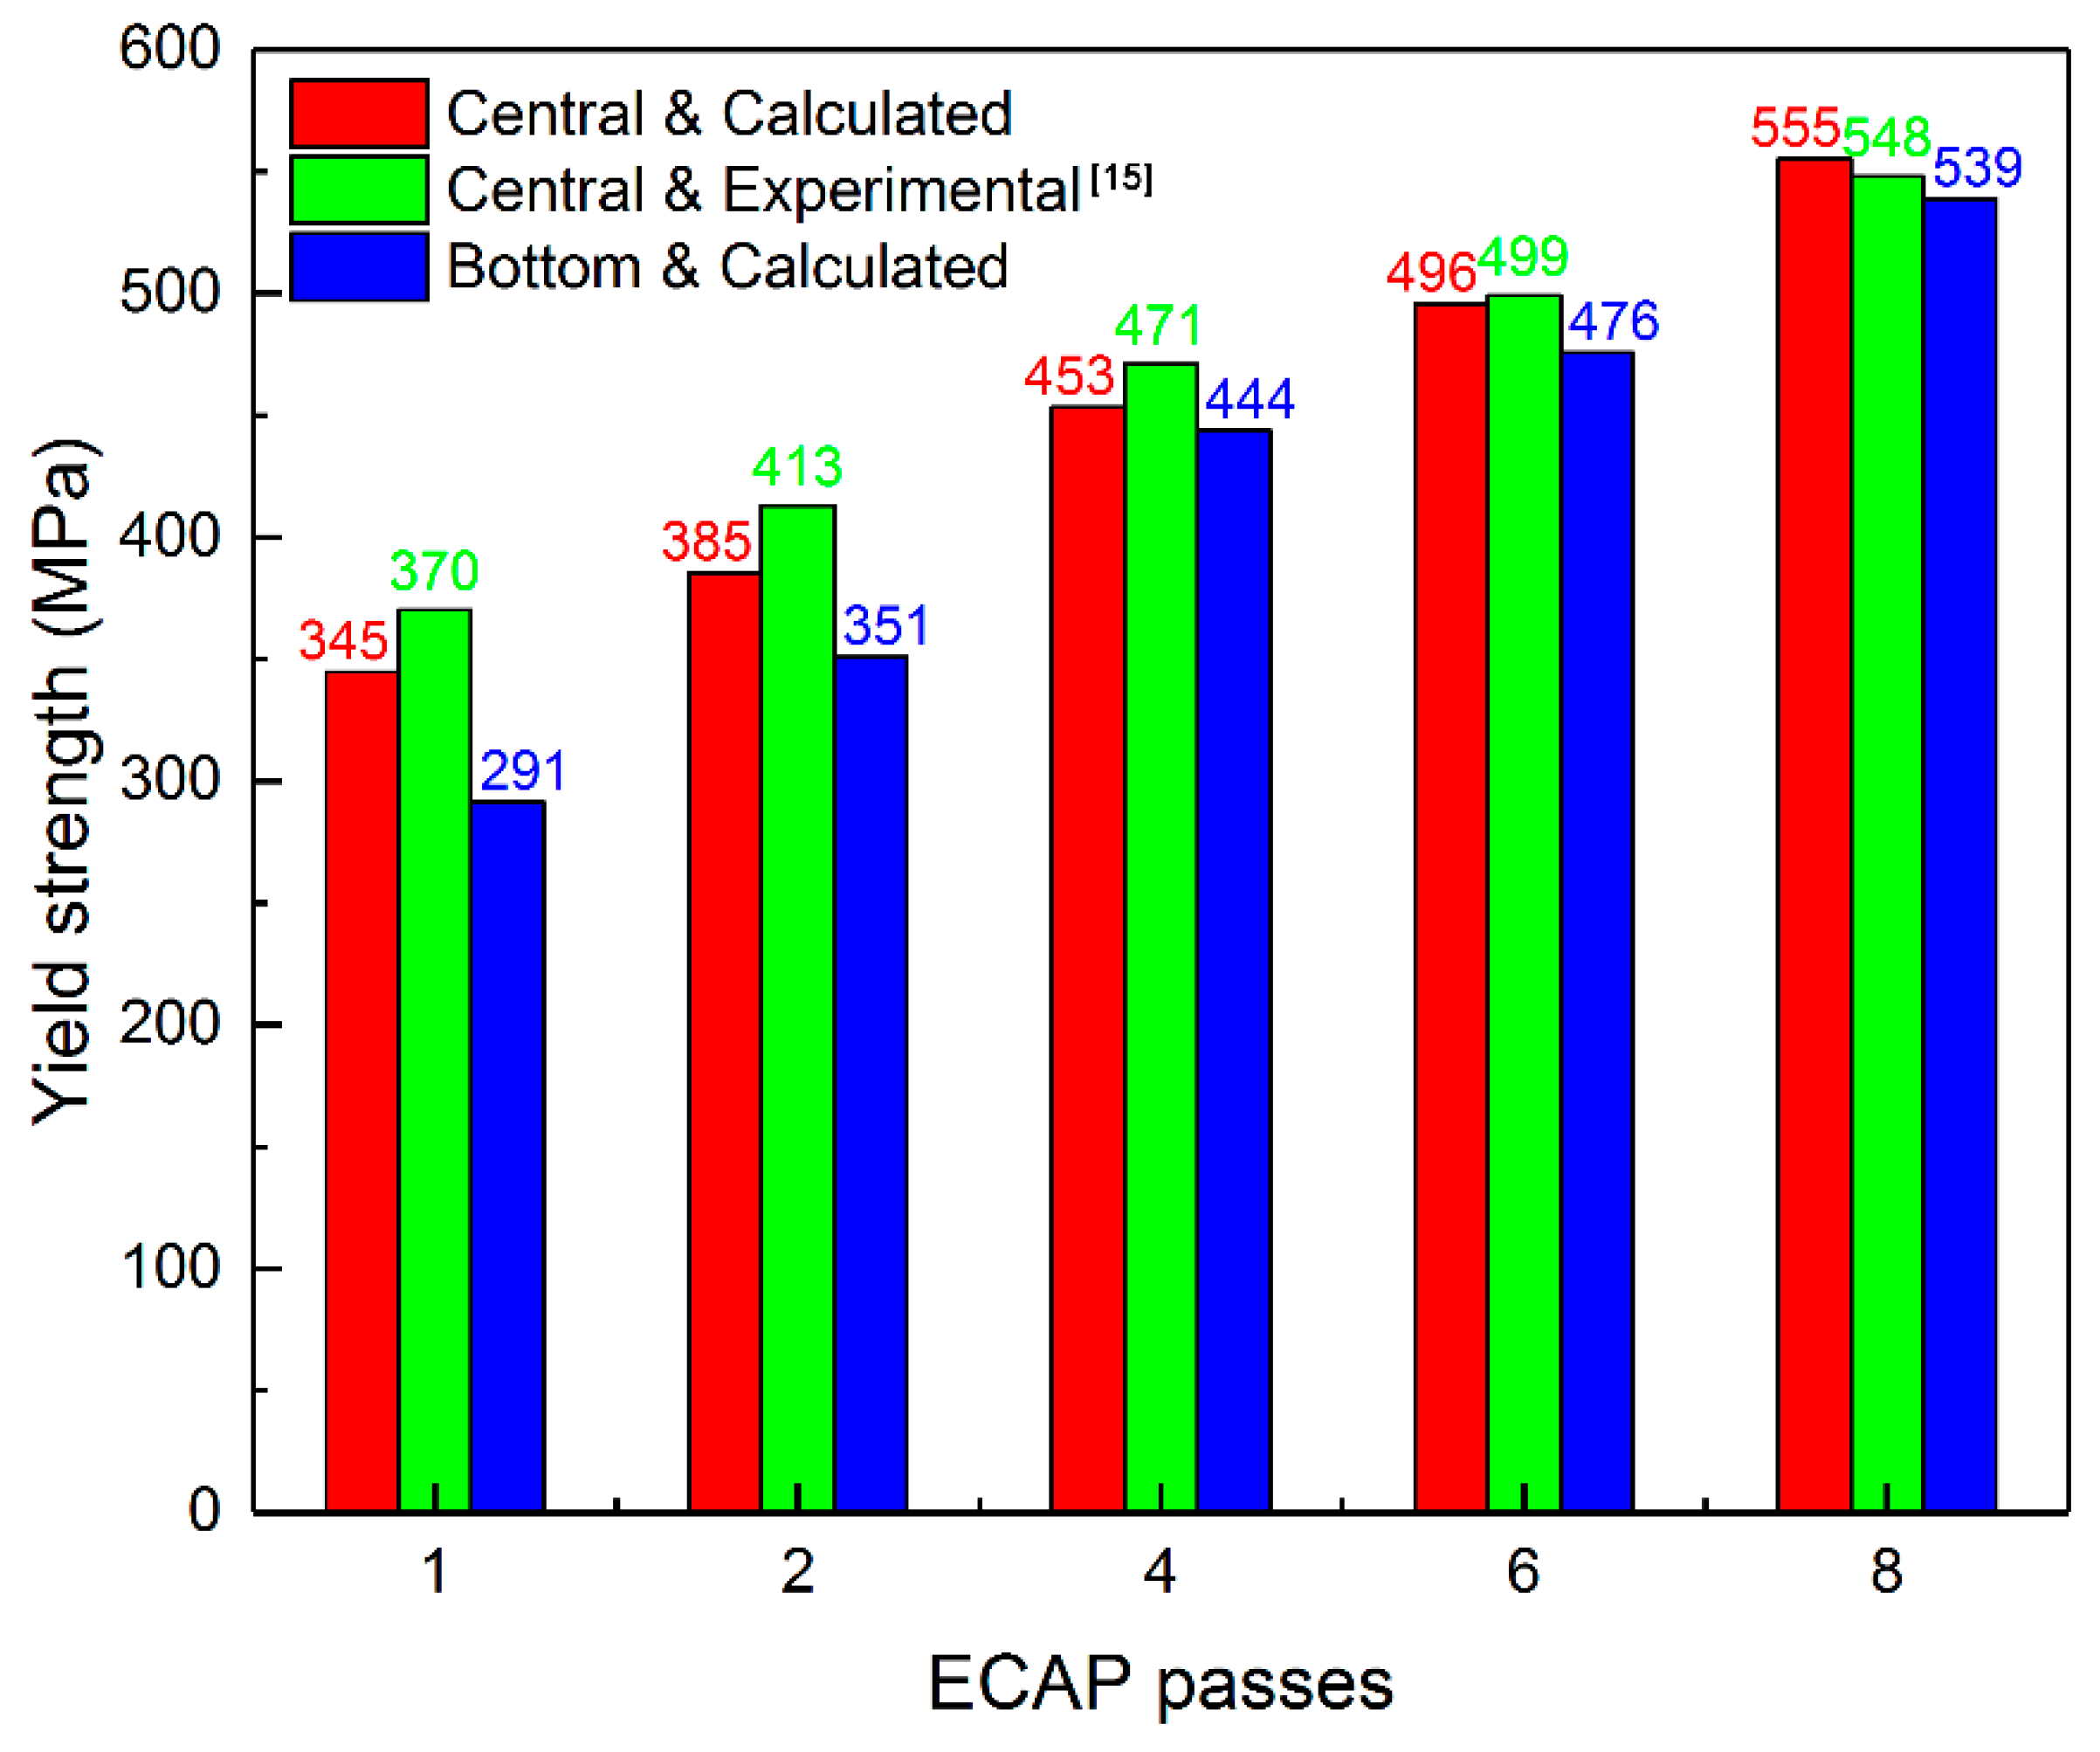
4.2. Strengthening Mechanisms and Strengths Calculation
5. Conclusions
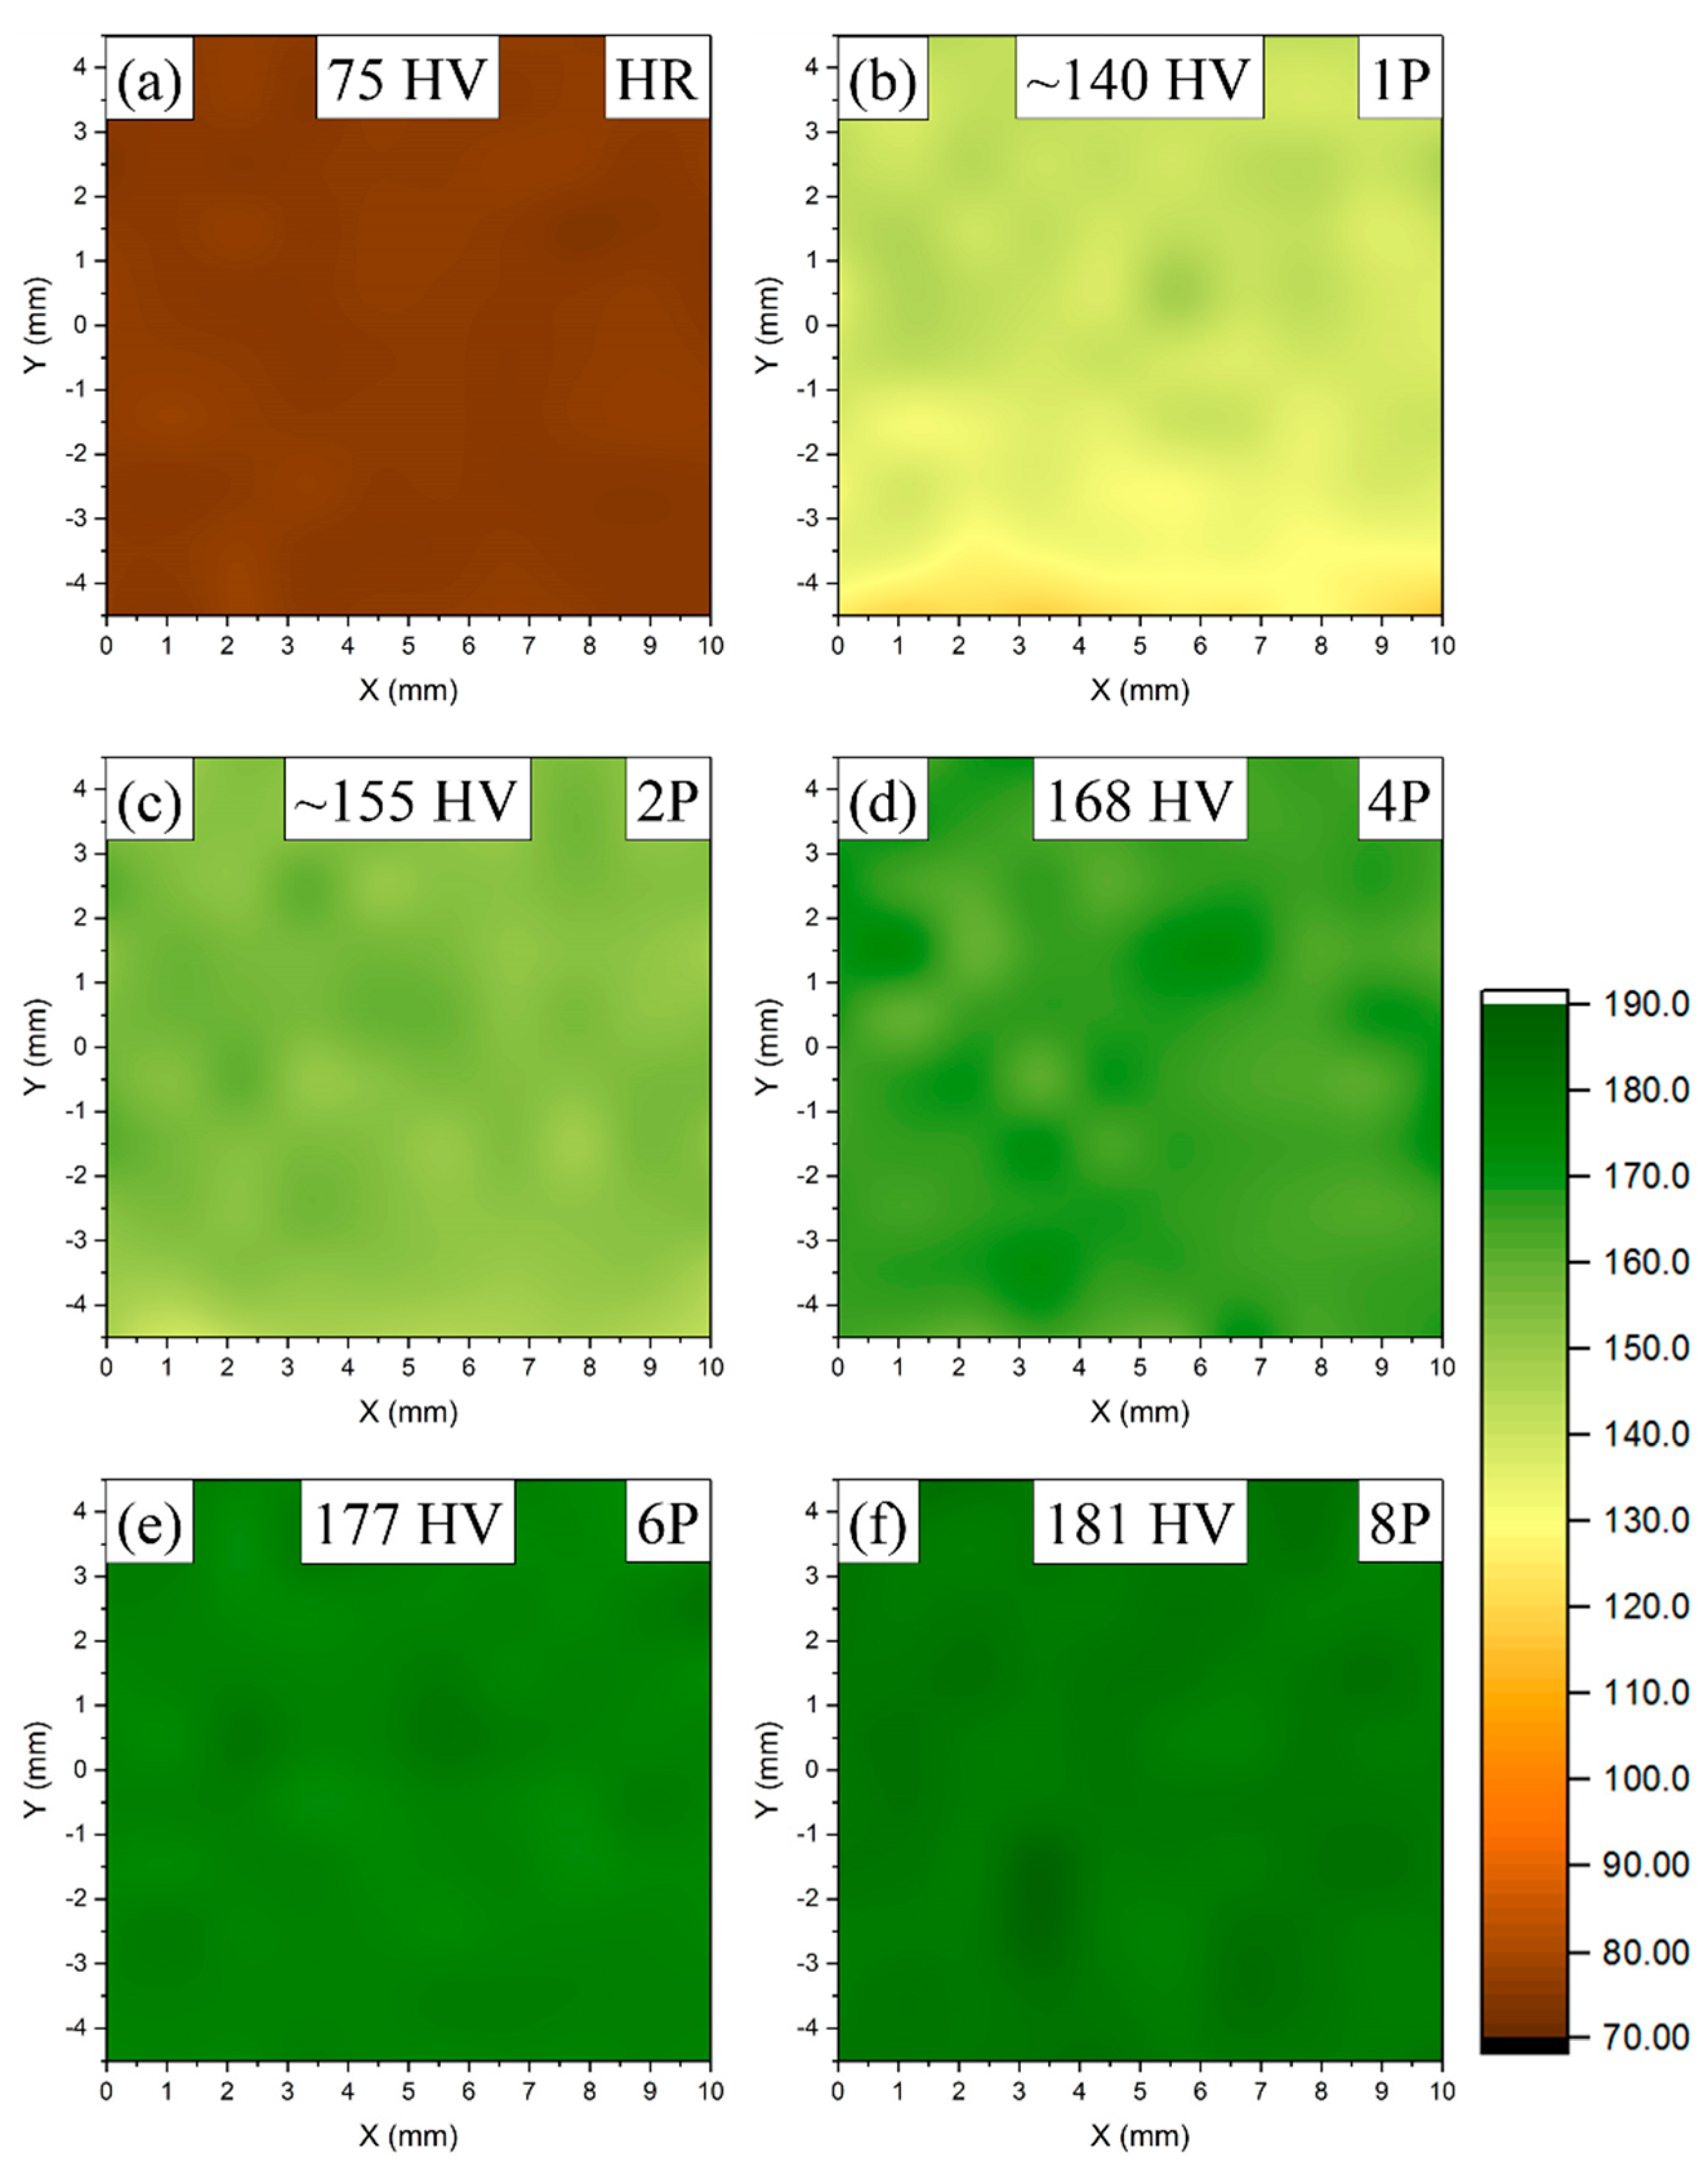
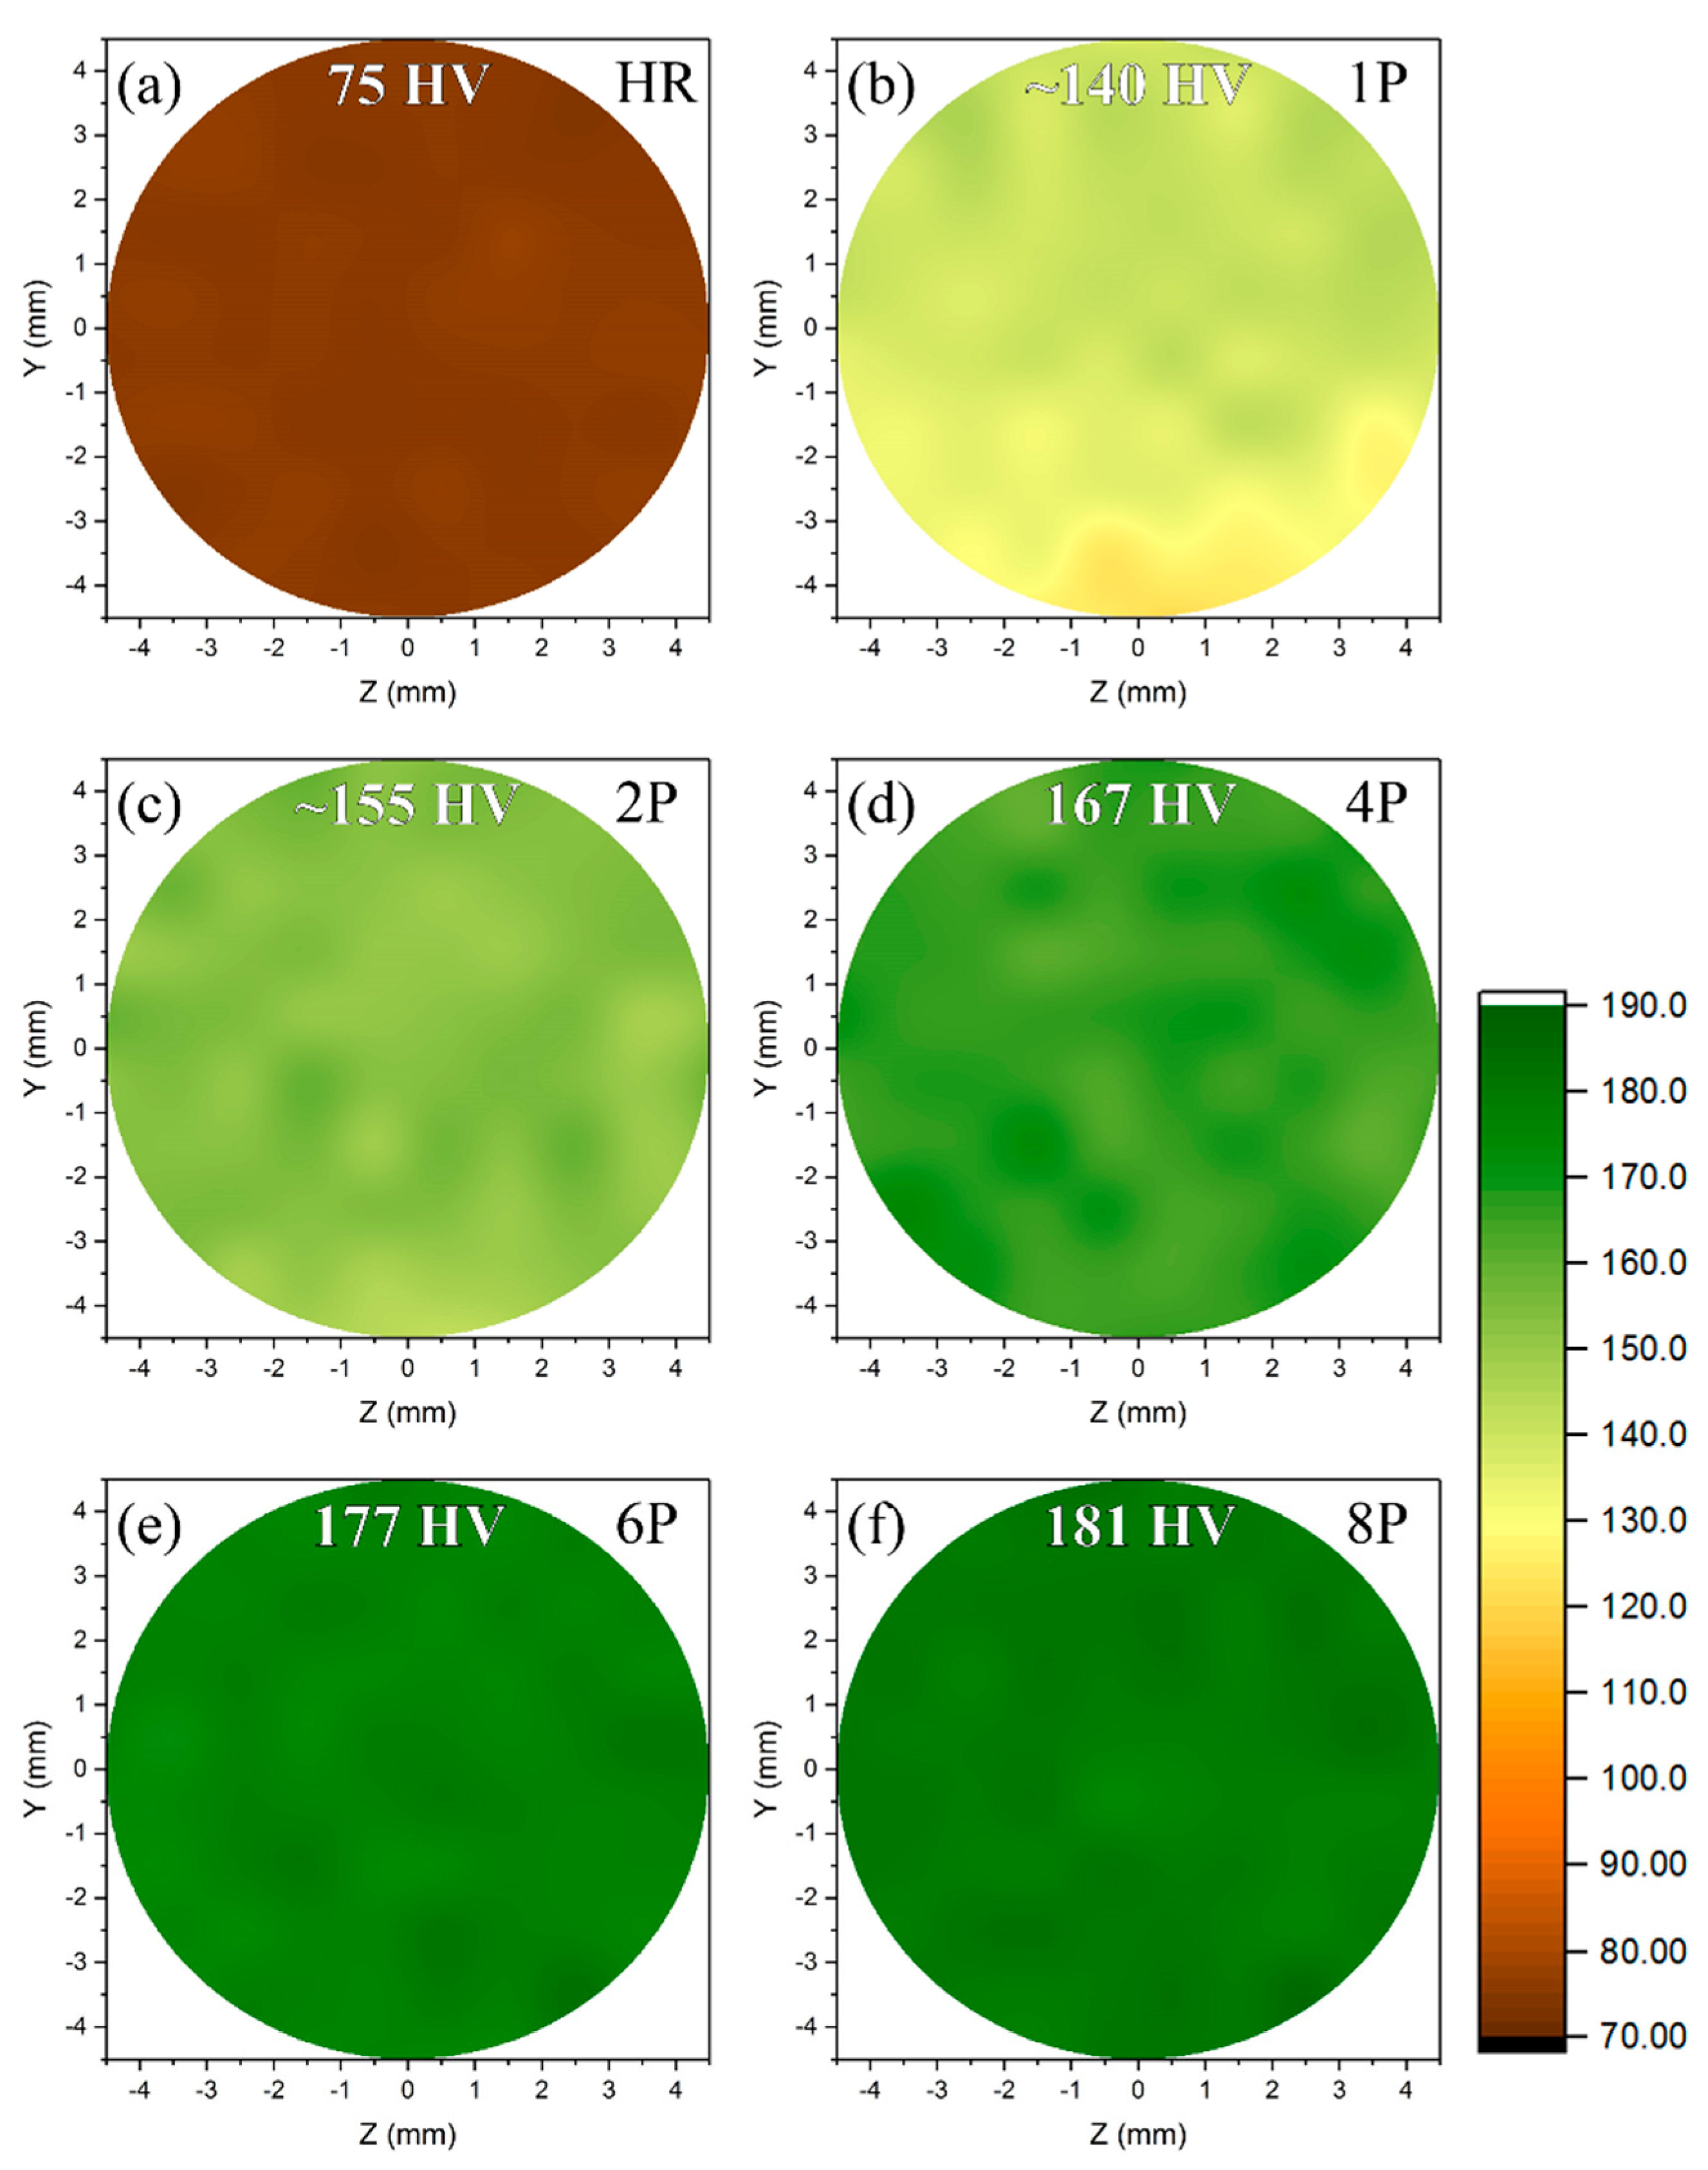
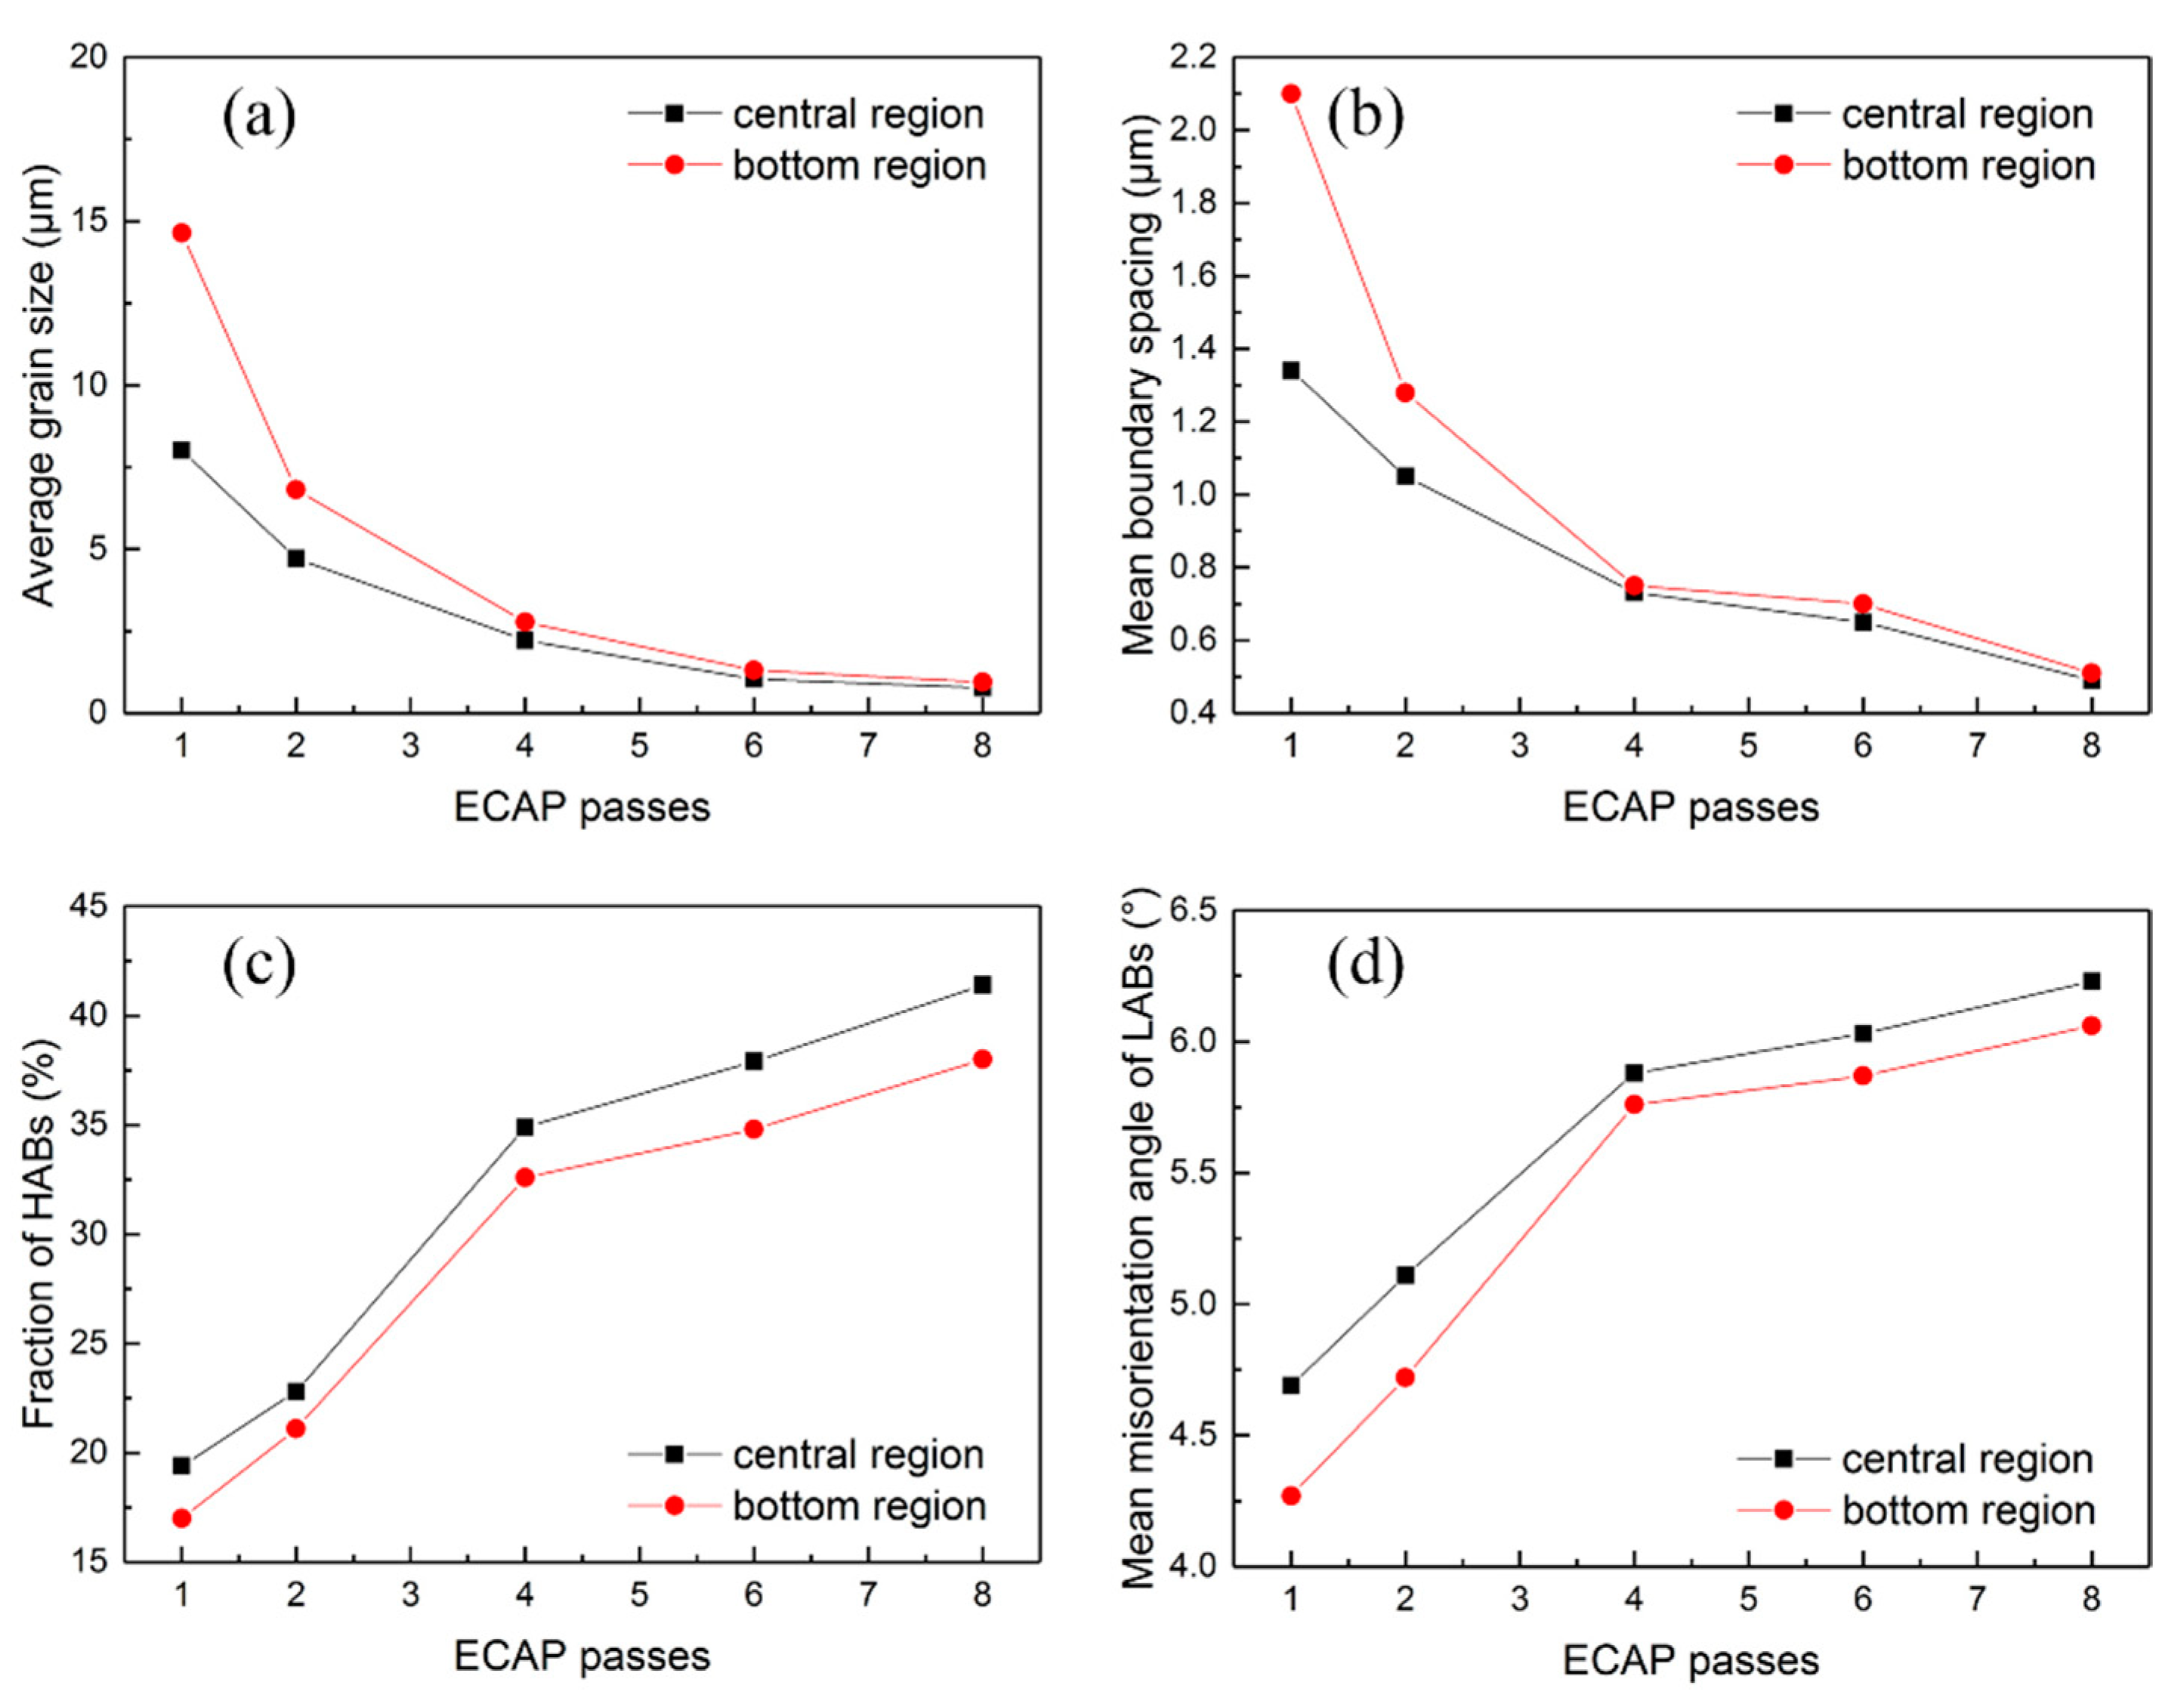
- The hardness of a Cu-0.43Mg (wt.%) alloy was improved significantly at the initial stage of ECAP process, and the lower-hardness region appeared at the area nearby the bottom surface. With the number of ECAP passes, the hardness gently increased and finally became saturated. The inhomogeneity of the hardness distribution along the normal direction gradually weakened and finally disappeared;
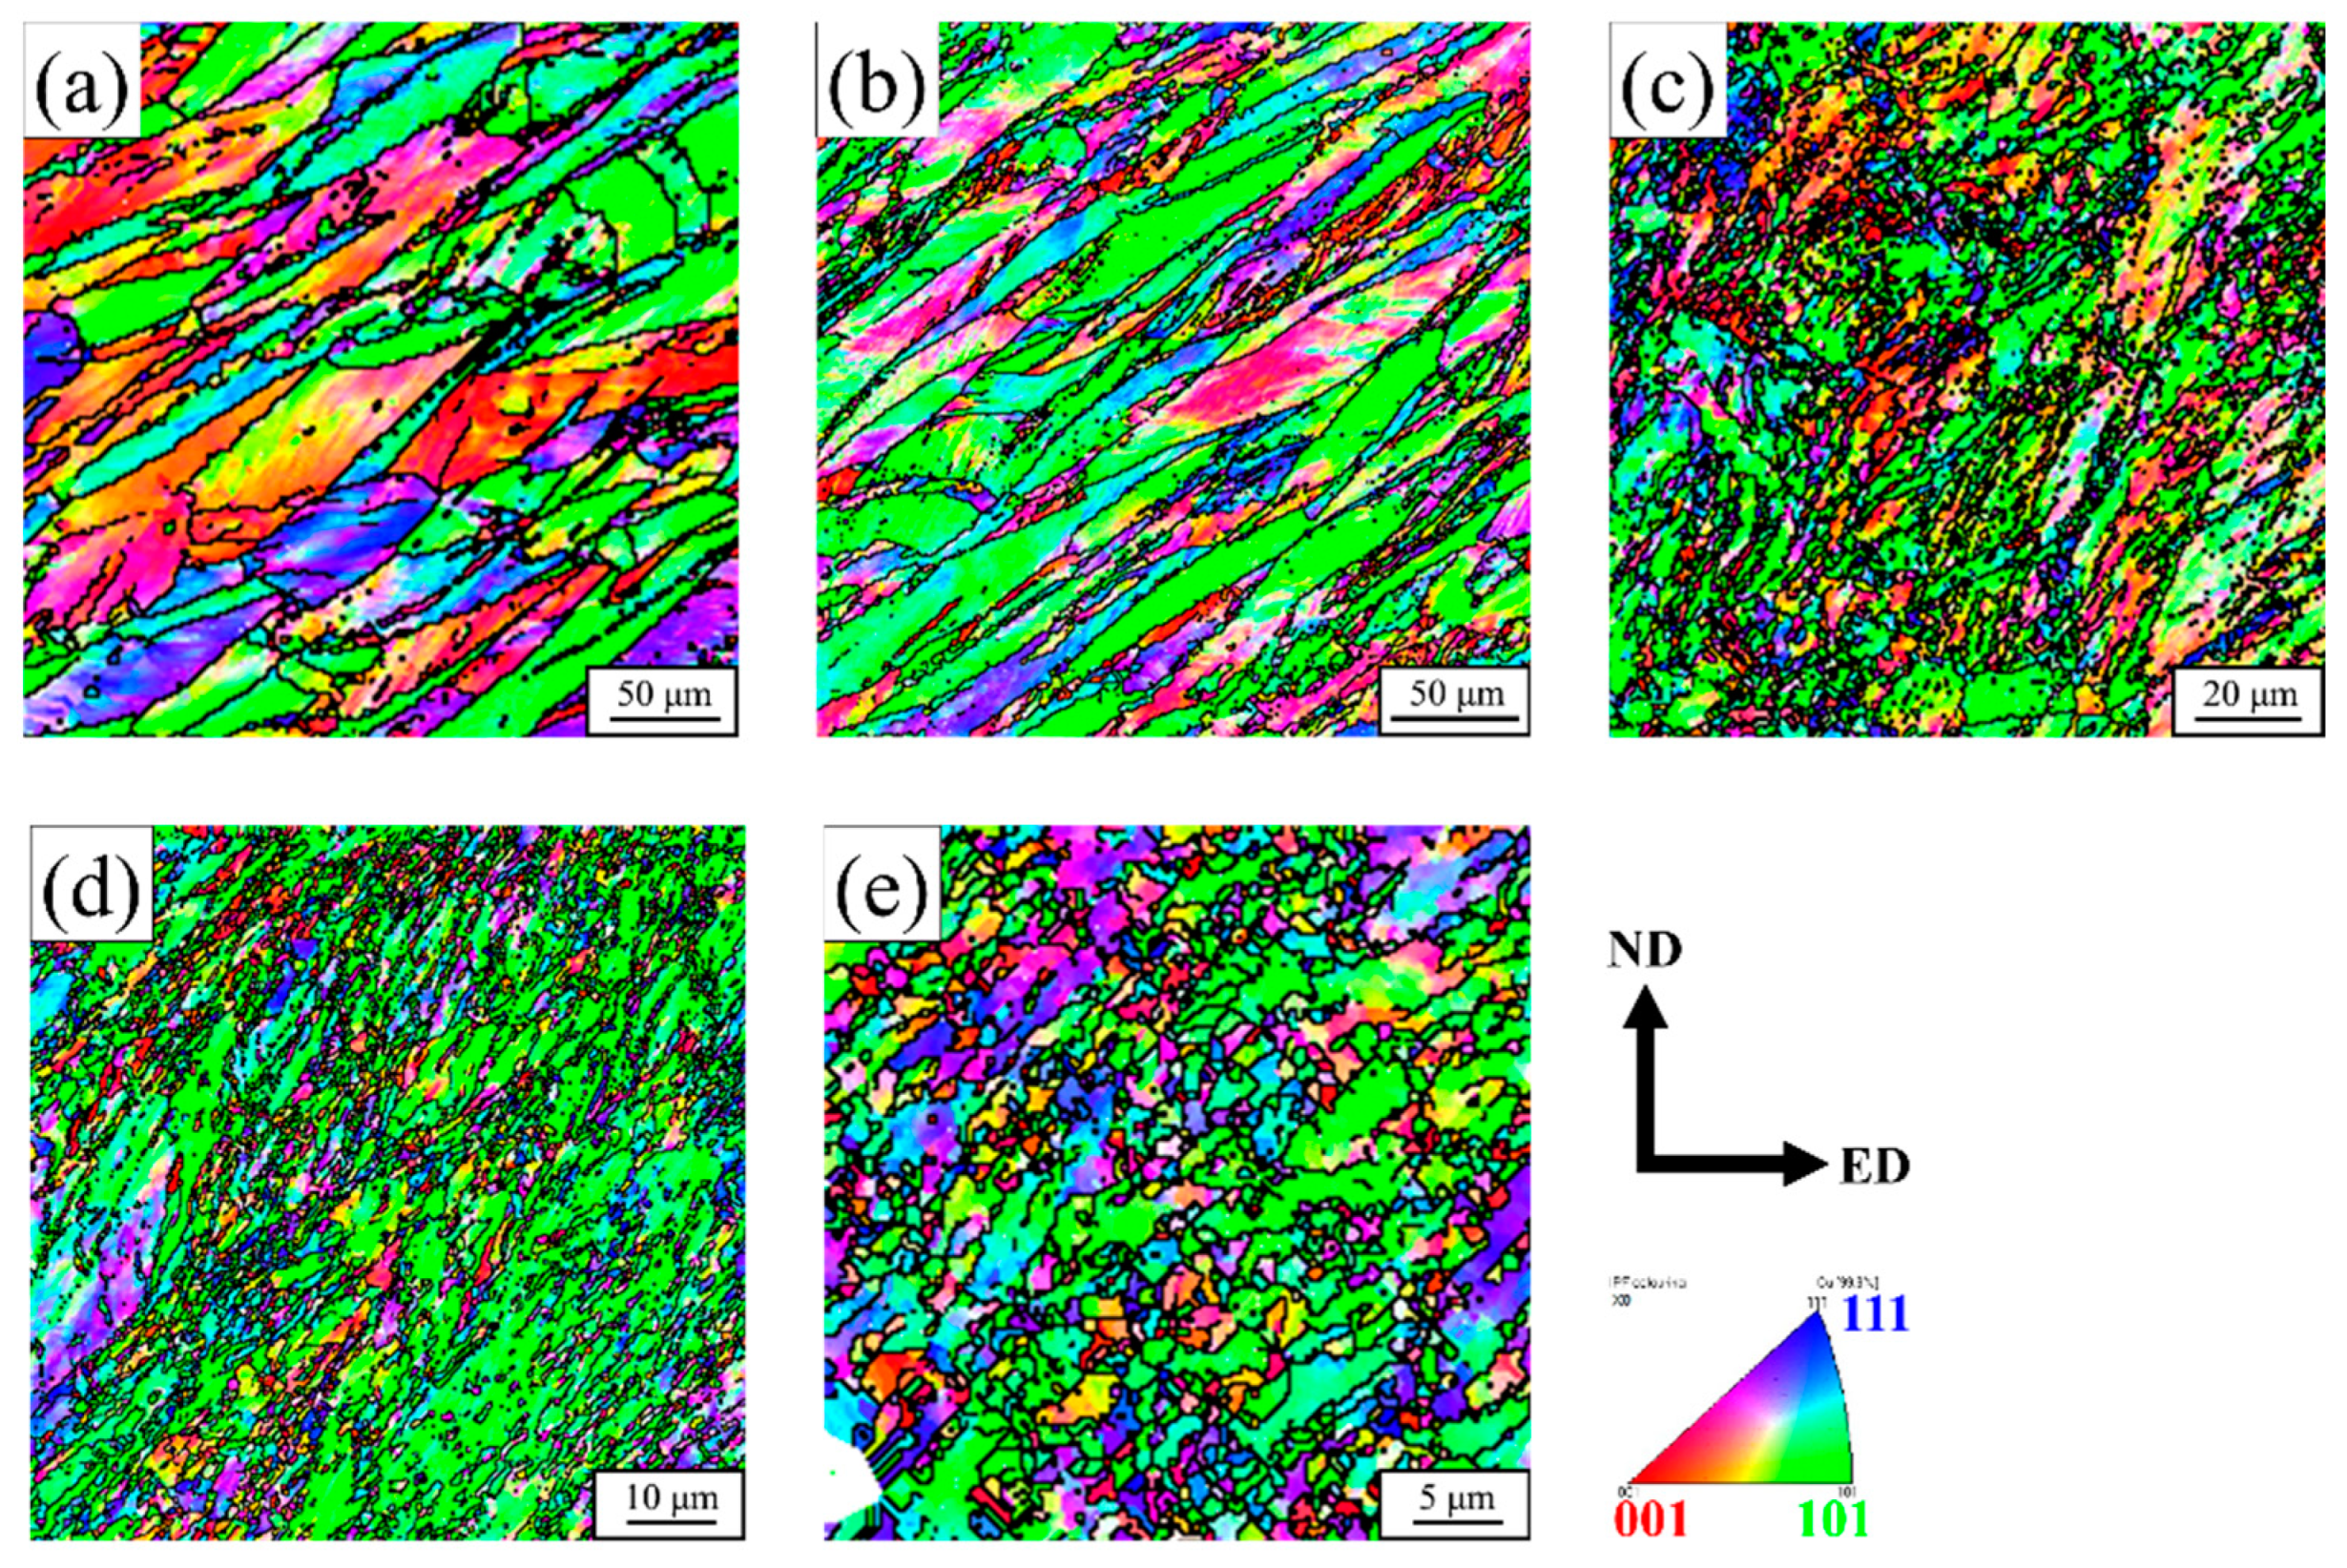
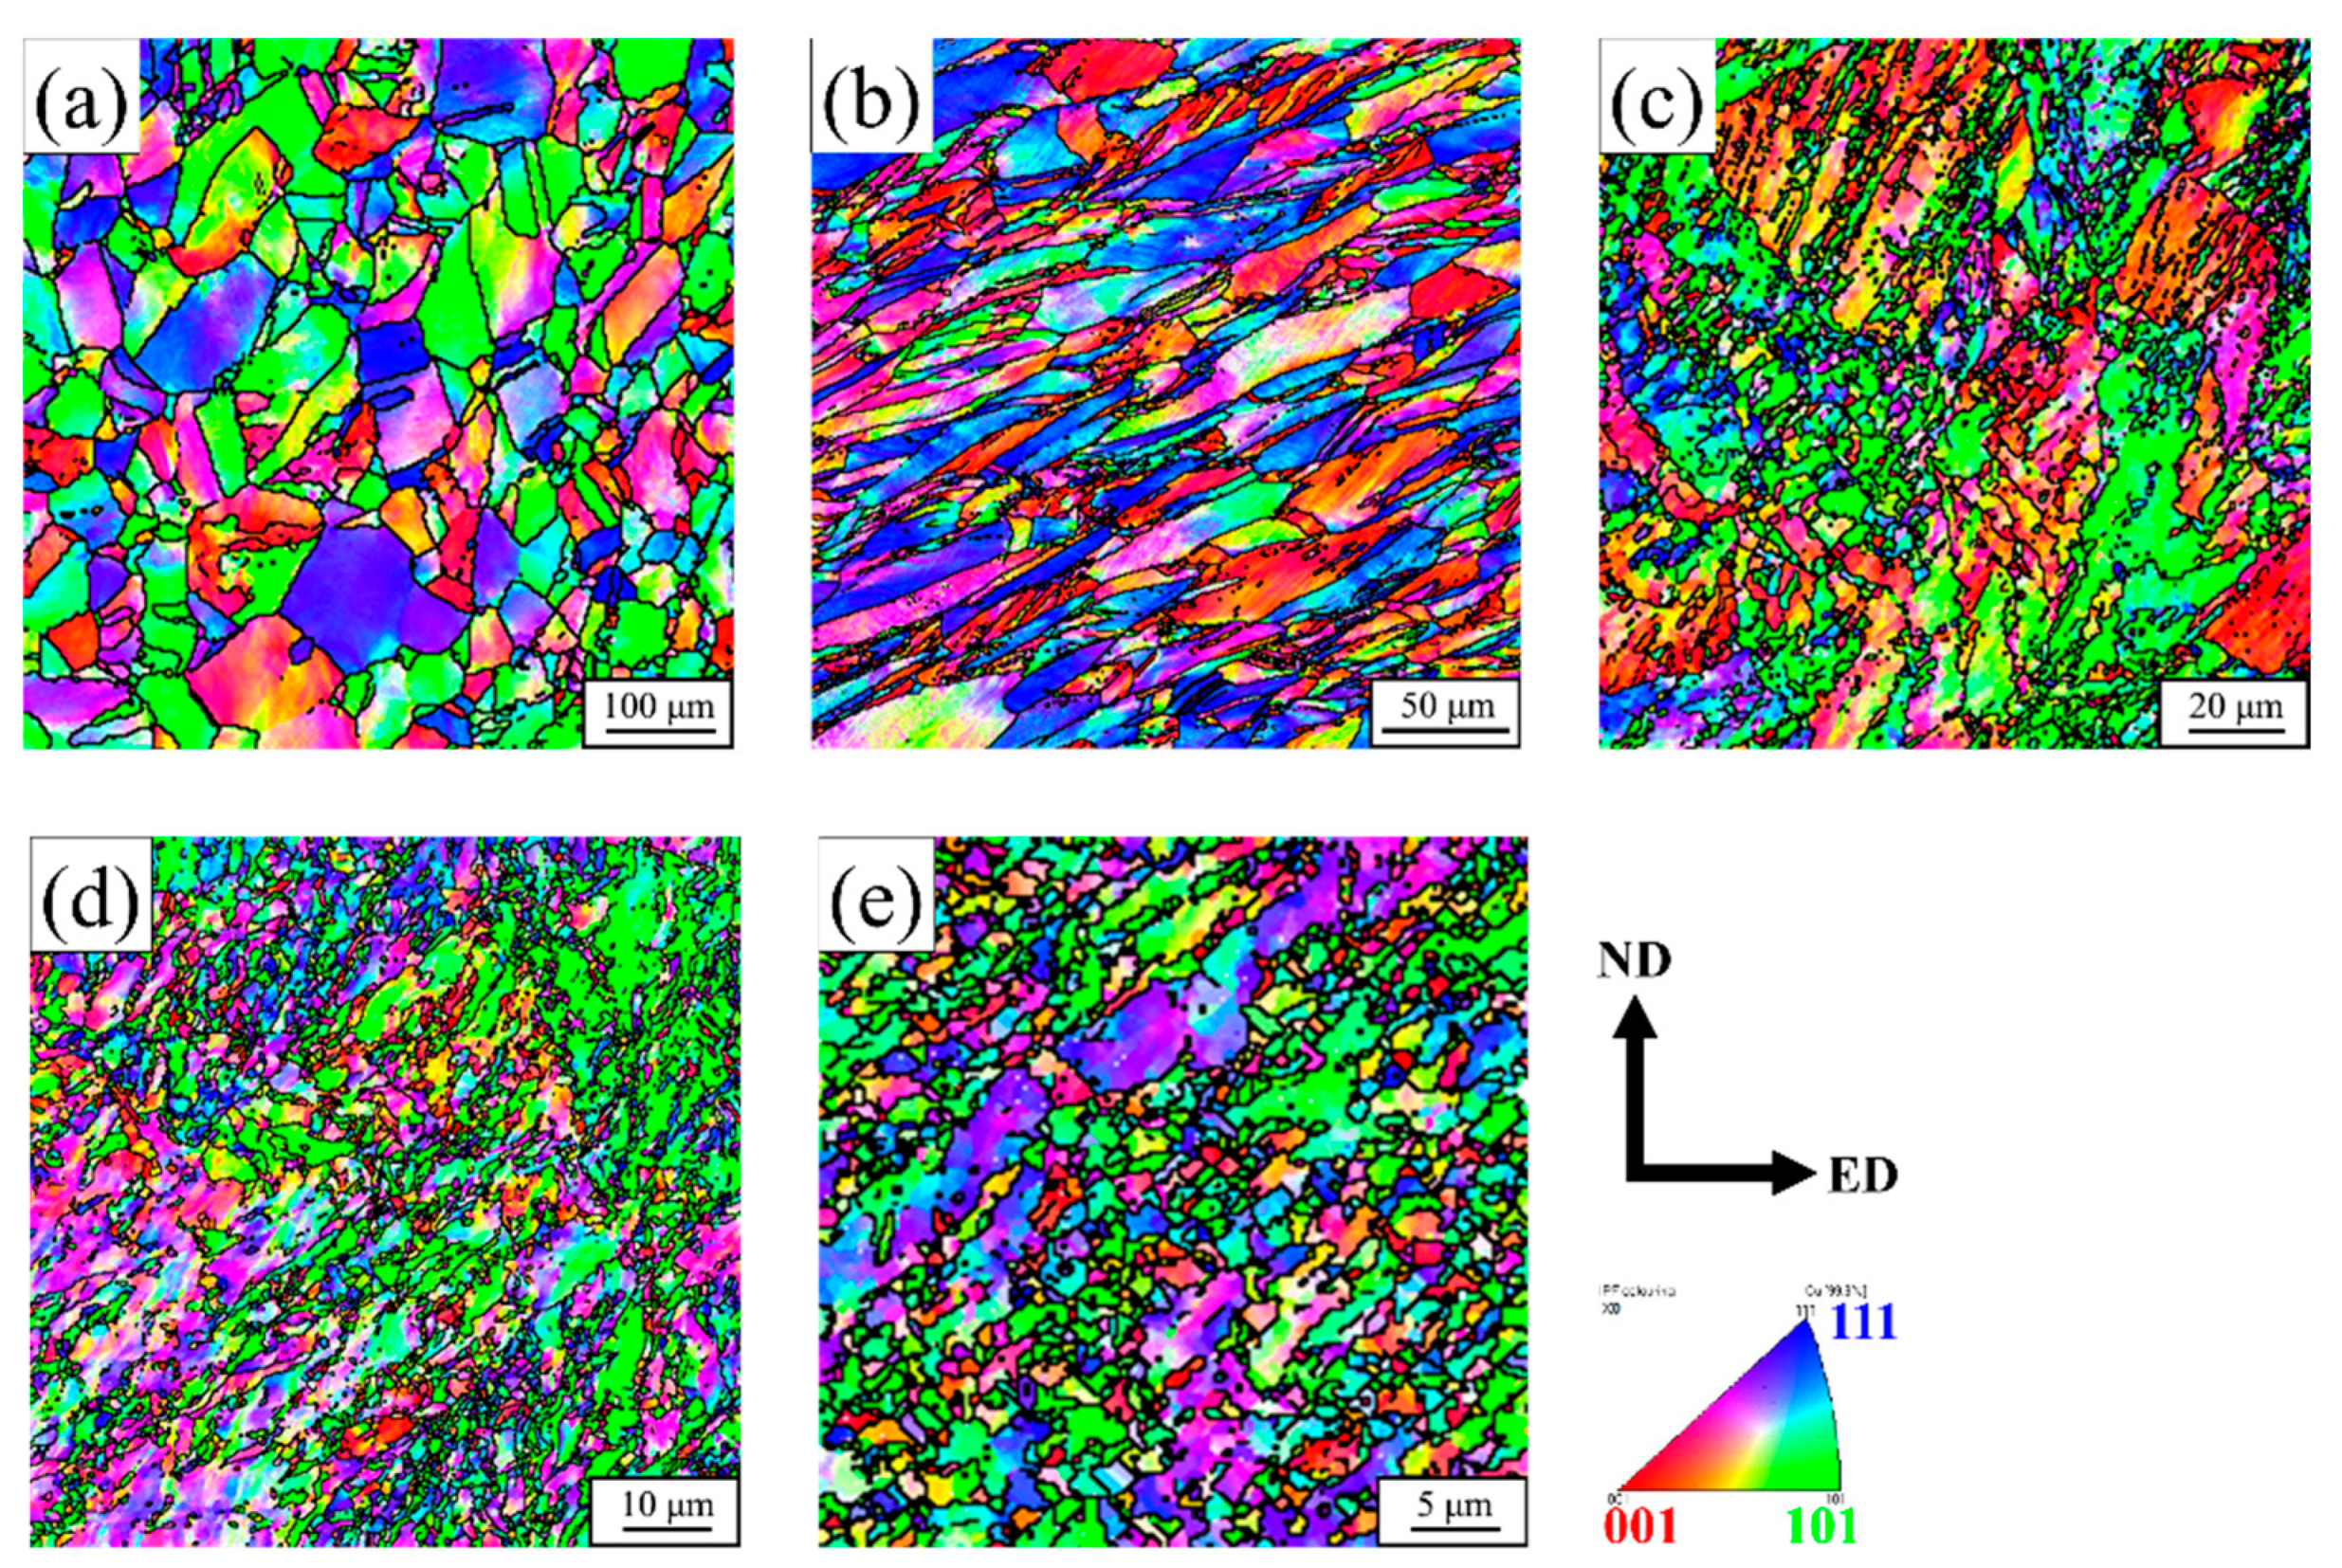
- The shear microstructure in the central region was different from that in the bottom region after one ECAP pass, and they became similar to each other after two ECAP passes, except the rotation angle of the elongated grains. With the further increasing ECAP passes, there was no obvious microstructure difference between the central and bottom regions;
- The inhomogeneities of the hardness and the microstructure along the normal direction should be attributed to the non-zero outer arc of curvature of the ECAP die and the friction between the bottom surface of the billets and the ECAP die walls;
- The strengthening mechanisms showed that the improvement of yield strengths should be mainly attributed to the strength contribution from the dislocation strengthening and the grain boundary strengthening. For example, after eight ECAP passes, they accounted for 78.9% of the yield strength of 555.0 MPa.
Author Contributions
Funding
Acknowledgments
Conflicts of Interest
References
- Feng, J.; Liang, S.; Guo, X.; Zhang, Y.; Song, K. Electrical conductivity anisotropy of copper matrix composites reinforced with SiC whiskers. Nanotechnol. Rev. 2019, 8, 285–292. [Google Scholar] [CrossRef]
- Zhao, Z.; Xiao, Z.; Li, Z.; Qiu, W.; Jiang, H.; Lei, Q.; Liu, Z.; Jiang, Y.; Zhang, S. Microstructure and properties of a Cu–Ni–Si–Co–Cr alloy with high strength and high conductivity. Mater. Sci. Eng. A 2019, 759, 396–403. [Google Scholar] [CrossRef]
- Li, S.; Guo, X.; Zhang, S.; Feng, J.; Song, K.; Liang, S. Arc erosion behavior of TiB2/Cu composites with single-scale and dual-scale TiB2 particles. Nanotechnol. Rev. 2019, 8, 619–627. [Google Scholar] [CrossRef]
- Feng, J.; Song, K.; Liang, S.; Guo, X.; Jiang, Y. Electrical wear of TiB2 particle-reinforced Cu and Cu–Cr composites prepared by vacuum arc melting. Vacuum 2020, 175, 109295. [Google Scholar] [CrossRef]
- Ji, G.; Li, Q.; Li, L. The kinetics of dynamic recrystallization of Cu–0.4Mg alloy. Mater. Sci. Eng. A 2013, 586, 197–203. [Google Scholar] [CrossRef]
- Ji, G.; Yang, G.; Li, L.; Li, Q. Modeling Constitutive Relationship of Cu-0.4 Mg Alloy During Hot Deformation. J. Mater. Eng. Perform. 2014, 23, 1770–1779. [Google Scholar] [CrossRef]
- Yuan, Y.; Dai, C.; Li, Z.; Yang, G.; Liu, Y.; Xiao, Z. Microstructure evolution of Cu–0.2Mg alloy during continuous extrusion process. J. Mater. Res. 2015, 30, 2783–2791. [Google Scholar] [CrossRef]
- Yuan, Y.; Li, Z.; Xiao, Z.; Zhao, Z. Investigations on Voids Formation in Cu–Mg Alloy During Continuous Extrusion. JOM 2017, 69, 1696–1700. [Google Scholar] [CrossRef]
- Zhen, G.; Kim, Y.; Haochuang, L.; Koo, J.-M.; Seok, C.-S.; Lee, K.; Kwon, S.-Y. Bending fatigue life evaluation of Cu-Mg alloy contact wire. Int. J. Precis. Eng. Manuf. 2014, 15, 1331–1335. [Google Scholar] [CrossRef]
- Zhang, X.; Han, J.; Chen, L.; Zhou, B.; Xue, Y.; Jia, F. Effects of B and Y additions on the microstructure and properties of Cu–Mg–Te alloys. J. Mater. Res. 2013, 28, 2747–2752. [Google Scholar] [CrossRef]
- Duan, Y.; Xu, G.; Tang, L.; Li, Z.; Yang, G. Microstructure and properties of the novel Cu–0.30Mg–0.05Ce alloy processed by equal channel angular pressing. Mater. Sci. Eng. A 2015, 648, 252–259. [Google Scholar] [CrossRef]
- Ha, S.-H.; Yoon, Y.-O.; Lim, H.-K.; Kim, S.K. Effect of Heat Treatment on Microstructure and Hardness of Cu–Mg Alloy with a Trace of Ca. J. Nanosci. Nanotechnol. 2017, 17, 7820–7823. [Google Scholar] [CrossRef]
- Li, Y.; Xiao, Z.; Li, Z.; Zhou, Z.; Yang, Z.; Lei, Q. Microstructure and properties of a novel Cu-Mg-Ca alloy with high strength and high electrical conductivity. J. Alloy. Compd. 2017, 723, 1162–1170. [Google Scholar] [CrossRef]
- Freudenberger, J.; Kauffmann, A.; Klauß, H.; Marr, T.; Nenkov, K.; Sarma, V.; Schultz, L. Studies on recrystallization of single-phase copper alloys by resistance measurements. Acta Mater. 2010, 58, 2324–2329. [Google Scholar] [CrossRef]
- Ma, M.; Li, Z.; Qiu, W.; Xiao, Z.; Zhao, Z.; Jiang, Y. Microstructure and properties of Cu–Mg-Ca alloy processed by equal channel angular pressing. J. Alloy. Compd. 2019, 788, 50–60. [Google Scholar] [CrossRef]
- Valiev, R.Z.; Langdon, T.G. Principles of equal-channel angular pressing as a processing tool for grain refinement. Prog. Mater. Sci. 2006, 51, 881–981. [Google Scholar] [CrossRef]
- Cobos, O.F.H.; Berríos-Ortiz, J.A.; Cabrera, J.M. Texture and fatigue behavior of ultrafine grained copper produced by ECAP. Mater. Sci. Eng. A 2014, 609, 273–282. [Google Scholar] [CrossRef]
- Wei, W.; Wang, S.L.; Wei, K.X.; Alexandrov, I.V.; Du, Q.B.; Hu, J. Microstructure and tensile properties of Cu Al alloys processed by ECAP and rolling at cryogenic temperature. J. Alloy. Compd. 2016, 678, 506–510. [Google Scholar] [CrossRef]
- Zaynullina, L.; Alexandrov, I.V.; Wei, W. Effect of the stacking fault energy on the mechanical properties of pure Cu and Cu-Al alloys subjected to severe plastic deformation. MATEC Web Conf. 2017, 129, 2032. [Google Scholar] [CrossRef][Green Version]
- Wongsa-Ngam, J.; Wen, H.; Langdon, T.G. Microstructural evolution in a Cu–Zr alloy processed by a combination of ECAP and HPT. Mater. Sci. Eng. A 2013, 579, 126–135. [Google Scholar] [CrossRef]
- Mishnev, R.; Shakhova, I.; Belyakov, A.; Kaibyshev, R. Deformation microstructures, strengthening mechanisms, and electrical conductivity in a Cu–Cr–Zr alloy. Mater. Sci. Eng. A 2015, 629, 29–40. [Google Scholar] [CrossRef]
- Iwahashi, Y.; Wang, J.; Horita, Z.; Nemoto, M.; Langdon, T.G. Principle of equal-channel angular pressing for the processing of ultra-fine grained materials. Scr. Mater. 1996, 35, 143–146. [Google Scholar] [CrossRef]
- Xu, C.; Furukawa, M.; Horita, Z.; Langdon, T.G. The evolution of homogeneity and grain refinement during equal-channel angular pressing: A model for grain refinement in ECAP. Mater. Sci. Eng. A 2005, 398, 66–76. [Google Scholar] [CrossRef]
- Xu, C.; Langdon, T.G. The development of hardness homogeneity in aluminum and an aluminum alloy processed by ECAP. J. Mater. Sci. 2007, 42, 1542–1550. [Google Scholar] [CrossRef]
- Beyerlein, I.; Toth, L.S. Texture evolution in equal-channel angular extrusion. Prog. Mater. Sci. 2009, 54, 427–510. [Google Scholar] [CrossRef]
- Prell, M.; Xu, C.; Langdon, T.G. The evolution of homogeneity on longitudinal sections during processing by ECAP. Mater. Sci. Eng. A 2008, 480, 449–455. [Google Scholar] [CrossRef]
- Alhajeri, S.N.; Gao, N.; Langdon, T.G. Hardness homogeneity on longitudinal and transverse sections of an aluminum alloy processed by ECAP. Mater. Sci. Eng. A 2011, 528, 3833–3840. [Google Scholar] [CrossRef]
- Reihanian, M.; Ebrahimi, R.; Moshksar, M.; Terada, D.; Tsuji, N. Microstructure quantification and correlation with flow stress of ultrafine grained commercially pure Al fabricated by equal channel angular pressing (ECAP). Mater. Charact. 2008, 59, 1312–1323. [Google Scholar] [CrossRef]
- Ma, M.; Li, Z.; Qiu, W.; Xiao, Z.; Zhao, Z.; Jiang, Y.; Xia, Z.; Huang, H. Development of homogeneity in a Cu-Mg-Ca alloy processed by equal channel angular pressing. J. Alloy. Compd. 2020, 820, 153112. [Google Scholar] [CrossRef]
- Kim, H.S. Evaluation of Strain Rate During Equal-channel Angular Pressing. J. Mater. Res. 2002, 17, 172–179. [Google Scholar] [CrossRef]
- Kim, H.S. Finite element analysis of deformation behaviour of metals during equal channel multi-angular pressing. Mater. Sci. Eng. A 2002, 328, 317–323. [Google Scholar] [CrossRef]
- Kim, H.S.; Seo, M.H.; Hong, S.I. Finite element analysis of equal channel angular pressing of strain rate sensitive metals. J. Mater. Process. Technol. 2002, 130, 497–503. [Google Scholar] [CrossRef]
- Beyerlein, I.; Tomé, C. Analytical modeling of material flow in equal channel angular extrusion (ECAE). Mater. Sci. Eng. A 2004, 380, 171–190. [Google Scholar] [CrossRef]
- Suh, J.-Y.; Kim, H.-S.; Park, J.-W.; Chang, J.-Y. Finite element analysis of material flow in equal channel angular pressing. Scr. Mater. 2001, 44, 677–681. [Google Scholar] [CrossRef]
- Deng, G.; Lu, C.; Su, L.; Liu, X.; Tieu, A. Modeling texture evolution during ECAP of copper single crystal by crystal plasticity FEM. Mater. Sci. Eng. A 2012, 534, 68–74. [Google Scholar] [CrossRef]
- Skrotzki, W.; Toth, L.S.; Klöden, B.; Brokmeier, H.-G.; Arruffat-Massion, R. Texture after ECAP of a cube-oriented Ni single crystal. Acta Mater. 2008, 56, 3439–3449. [Google Scholar] [CrossRef]
- Yang, G.; Li, Z.; Yuan, Y.; Lei, Q. Microstructure, mechanical properties and electrical conductivity of Cu–0.3Mg–0.05Ce alloy processed by equal channel angular pressing and subsequent annealing. J. Alloy. Compd. 2015, 640, 347–354. [Google Scholar] [CrossRef]
- Lei, Q.; Li, Z.; Gao, Y.; Peng, X.; Derby, B. Microstructure and mechanical properties of a high strength Cu-Ni-Si alloy treated by combined aging processes. J. Alloy. Compd. 2017, 695, 2413–2423. [Google Scholar] [CrossRef]
- Luo, P.; McDonald, D.; Xu, W.; Palanisamy, S.; Dargusch, M.; Xia, K. A modified Hall–Petch relationship in ultrafine-grained titanium recycled from chips by equal channel angular pressing. Scr. Mater. 2012, 66, 785–788. [Google Scholar] [CrossRef]
- Hansen, N. Hall–Petch relation and boundary strengthening. Scr. Mater. 2004, 51, 801–806. [Google Scholar] [CrossRef]
- Hansen, N. Boundary strengthening in undeformed and deformed polycrystals. Mater. Sci. Eng. A 2005, 409, 39–45. [Google Scholar] [CrossRef]
- Rodriguez-Calvillo, P.; Ferrer, N.; Cabrera, J.M. Analysis of microstructure and strengthening in CuMg alloys deformed by equal channel angular pressing. J. Alloy. Compd. 2015, 626, 340–348. [Google Scholar] [CrossRef]
- Germain, L.; Kratsch, D.; Salib, M.; Gey, N. Identification of sub-grains and low angle boundaries beyond the angular resolution of EBSD maps. Mater. Charact. 2014, 98, 66–72. [Google Scholar] [CrossRef]


| Region | ECAP Passes | ||||||
|---|---|---|---|---|---|---|---|
| Central | 1 | 68.3 | 48.7 | 205.9 | 21.8 | 344.7 | 370 [15] |
| 2 | 68.3 | 48.7 | 237.7 | 30.8 | 385.4 | 413 [15] | |
| 4 | 68.3 | 48.7 | 280.8 | 55.5 | 453.3 | 471 [15] | |
| 6 | 68.3 | 48.7 | 294.3 | 84.5 | 495.8 | 499 [15] | |
| 8 | 68.3 | 48.7 | 335.8 | 102.2 | 555.0 | 548 [15] | |
| Bottom | 1 | 68.3 | 48.7 | 159.3 | 15.1 | 291.4 | |
| 2 | 68.3 | 48.7 | 209.1 | 24.6 | 350.8 | ||
| 4 | 68.3 | 48.7 | 279.0 | 47.9 | 443.9 | ||
| 6 | 68.3 | 48.7 | 286.7 | 72.7 | 475.8 | ||
| 8 | 68.3 | 48.7 | 332.8 | 89.0 | 538.8 |
© 2020 by the authors. Licensee MDPI, Basel, Switzerland. This article is an open access article distributed under the terms and conditions of the Creative Commons Attribution (CC BY) license (http://creativecommons.org/licenses/by/4.0/).
Share and Cite
Ma, M.; Zhang, X.; Li, Z.; Xiao, Z.; Jiang, H.; Xia, Z.; Huang, H. Effect of Equal Channel Angular Pressing on Microstructure and Mechanical Properties of a Cu-Mg Alloy. Crystals 2020, 10, 426. https://doi.org/10.3390/cryst10060426
Ma M, Zhang X, Li Z, Xiao Z, Jiang H, Xia Z, Huang H. Effect of Equal Channel Angular Pressing on Microstructure and Mechanical Properties of a Cu-Mg Alloy. Crystals. 2020; 10(6):426. https://doi.org/10.3390/cryst10060426
Chicago/Turabian StyleMa, Muzhi, Xi Zhang, Zhou Li, Zhu Xiao, Hongyun Jiang, Ziqi Xia, and Hanyan Huang. 2020. "Effect of Equal Channel Angular Pressing on Microstructure and Mechanical Properties of a Cu-Mg Alloy" Crystals 10, no. 6: 426. https://doi.org/10.3390/cryst10060426
APA StyleMa, M., Zhang, X., Li, Z., Xiao, Z., Jiang, H., Xia, Z., & Huang, H. (2020). Effect of Equal Channel Angular Pressing on Microstructure and Mechanical Properties of a Cu-Mg Alloy. Crystals, 10(6), 426. https://doi.org/10.3390/cryst10060426