Abstract
Diamond crystallization in melts of europium salts (Eu2(C2O4)3·10H2O, Eu2(CO3)3·3H2O, EuCl3, EuF3, EuF2) at 7.8 GPa and in a temperature range of 1800–2000 °C was studied for the first time. Diamond growth on seed crystals was realized at a temperature of 2000 °C. Spontaneous diamond nucleation at these parameters was observed only in an Eu oxalate melt. The maximum growth rate in the europium oxalate melt was 22.5 μm/h on the {100} faces and 12.5 μm/h on the {111} faces. The diamond formation intensity in the tested systems was found to decrease in the following sequence: Eu2(C2O4)3·10H2O > Eu2(CO3)3·3H2O > EuF3 > EuF2 = EuCl3. Diamond crystallization occurred in the region of stable octahedral growth in melts of Eu3+ salts and in the region of cubo-octahedral growth in an EuF2 melt. The microrelief of faces was characterized by specific features, depending on the system composition and diamond growth rate. In parallel with diamond growth, the formation of metastable graphite in the form of independent crystals and inclusions in diamond was observed. From the spectroscopic characterization, it was found that diamonds synthesized from Eu oxalate contain relatively high concentrations of nitrogen (about 1000−1200 ppm) and show weak PL features due to inclusions of Eu-containing species.
1. Introduction
Lately, the investigation of the optical properties of rare-earth (RE) ions in various crystalline matrices has attracted the interest of many researchers. Diamond, due to its unique electrophysical, thermophysical, optical and mechanical properties, is an ideal matrix for various optically active defects, in particular for RE ions. Rare-earth ions have unique optical properties, in particular narrow-band luminescence, with a long decay time and an exceptionally long nuclear spin coherence time [1,2]. A combination of the extreme properties of diamonds and the optical and magnetic characteristics of REs makes diamonds containing luminescent RE ions promising materials in various fields of modern technology. The technological interest in rare-earth luminescence is quite wide and includes telecommunications, laser materials, data storage, bio-medical applications and many other fields of application. In this regard, of considerable interest is the search for new systems for diamond growth, which will involve the doping of diamonds with RE ions. However, the problem of producing diamond crystals doped with rare-earth elements remains unresolved.
The first attempts to dope diamond with europium (Eu3+)-containing nanoparticles were undertaken using a multi-step chemical vapor deposition method (CVD) [3,4]. An alternative method was to obtained diamond–rare-earth composite material with luminescent EuF3 nanoparticles [5]. The doping of diamond with single rare-earth ions using CVD has not been successful yet. The first results on polycrystalline diamond synthesis at pressure of 8–9 GPa and temperature of 1600–2200 °C in RE–carbon systems were reported by Ekimov et al. [6] However, the spectroscopic characterization of the synthesized diamonds did not reveal optical centers associated with rare-earth elements. Recently, we have tested magnesium-based systems containing rare-earth elements [7] and their oxides [8]. The magnesium-based systems are of interest because they exhibit very high diamond crystallization rates in a kinetically controlled mode. Magnesium was shown to promote synthesis of nitrogen-free crystals with optical quality acceptable for spectroscopic studies [9,10]. In Mg+R2O3+C systems (where R = Nd, Sm, Eu, Tb, Dy, Ho, Er, Tm, and Yb) at 7.8 GPa and 1800 °C, the addition of RE oxides in an amount of 10 wt.% was found to have no significant effect on diamond crystallization relative to the Mg-C system [8]. Diamond crystals synthesized with 20 wt.%–30 wt.% Sm2O3 additives revealed a photoluminescence signal resembling the emission spectrum of Sm3+ ions. The results of diamond crystallization at similar parameters in Mg+REM+C systems (REM = Sc, Y, La, Pr, Nd, Dy, and Yb) unambiguously indicate an inhibitory effect of rare-earth metals [7]. In addition, diamonds produced with Y, Nd, and Yb additives demonstrated a number of new photoluminescent characteristics that may be associated with specific defects causing diamond growth inhibition.
In the present work, diamond crystallization in melts of europium salts was investigated for the first time. This study continues our investigation of the RE influence on diamond synthesis at high P and T parameters and the possible formation of optical centers in crystals, which are associated with rare-earth elements. The choice of Eu oxalate, Eu carbonate, and Eu halides as potential solvent-catalysts of diamond synthesis is based on our previous experience of successful diamond synthesis and growth in alkali and alkaline earth metal salts [11,12,13,14].
2. Materials and Methods
Experiments were performed at a pressure of 7.8 GPa, a temperature of 1800–2000 °C, and a runs time of 60 to 120 min using a split-sphere multi-anvil high-pressure apparatus (Table 1). The experimental technique, design of high-pressure cell, and calibrations of pressure and temperature were described in our previous works [9,10,15]. The choice of experimental parameters was based on our studies of diamond crystallization in magnesium-RE systems [7,8]. Graphite rods (purity of 99.99%) and europium salts (purity of 99.99%) were used as starting materials (Table 1). Graphite rods were processed into thick-walled (1.5 mm) capsules, with an outer diameter of 6.9 mm and a height of 6.5 mm. Europium salts were encapsulated into graphite capsules. Synthetic industrial grade diamonds SDA100 + 0.4–0.5 mm in size were used as seed crystals. The seed crystals had a cuboctahedral shape and flat {111} and {100} faces. According to the manufacturer’s specifications, they contained trace amounts of nitrogen, nickel and cobalt impurities. In each experiment four diamond seed crystals were used, which were placed at the interface between the graphite capsule and Eu salts. In all experiments, graphite capsules were wrapped outside, with 0.1 mm thick Mo foil that protected the capsule contents from external influences. Before the study, diamonds were purified from experimental products by a hot mixture of HNO3 and HCl acids (1:3 volume ratio). Then, diamonds were processed in a hot mixture of concentrated H2SO4 and a 30% aqueous solution of K2Cr2O7 (3:2 volume ratio), to remove graphite and possible organic pollutants. Diamonds were washed in hot distilled water after each acid treatment.

Table 1.
Experimental conditions and results.
Diamond crystals were studied using optical microscopy on a Carl Zeiss Axio Imager Z2m microscope (Carl Zeiss Microscopy, Jena, Germany). The differential-interference contrast (DIC) method was used to enhance the contrast of faces’ relief images. Scanning electron microscopy (SEM) of crystals was performed on a Tescan MIRA3 LMU microscope (Tescan, Brno, Czech Republic) at the Analytical Center for the Multi-Elemental and Isotope Research of the Siberian Branch of the Russian Academy of Sciences. Spectroscopic study of diamond crystals was carried out using infrared (IR) absorption and photoluminescence (PL). IR spectra were recorded using a Bruker Vertex 70 Fourier transform infrared (FTIR) spectrometer, fitted with a Hyperion 2000 microscope (Bruker Optics, Ettlingen, Germany). PL spectra were measured using a custom-built setup based on a Horiba JY iHR320 monochromator equipped with a Syncerity CCD detector (Horiba Jobin Yvon S.A.S., Lonjumeau, France). Photoluminescence was excited using a 395 nm diode laser (Omicron-Laserage Laserprodukte GmbH, Rodgau-Dudenhofen, Germany). A Linkam FTIR600 heating/freezing stage (Linkam Scientific Instruments, Tadworth, UK) was used for the low-temperature measurements.
3. Results and Discussion
3.1. Diamond Crystallization
The choice of starting experimental parameters was based on our studies of diamond crystallization in magnesium–RE systems [7,8]. Therefore, the first experiments on diamond synthesis in molten europium salts were carried out at a pressure of 7.8 GPa, a temperature of 1800 °C, and a run duration of 60 min. The experimental results demonstrated the lack of diamond synthesis and no growth on seed crystals at these parameters. In all experiments, metastable graphite was detected (Table 1). An increase in the run time to 120 min at 1800 °C in EuCl3+C and Eu2(CO3)3·3H2O+C systems (runs ES-2 and ES-6) did not result in diamond synthesis and growth on seeds. For this reason, the experimental temperature was elevated to 2000 °C, with a run time of 120 min being unchanged. In all experiments at 2000 °C in europium salts, there was diamond growth on the {111} and {100} faces of seed crystals (Table 1). In this case, the thickness of newly formed diamond layers differed significantly. There was no problem in determining the thickness of overgrown layers. After the experiment, seed crystals were found to be pressed into the graphite capsule to varying degrees. Growth of the newly formed diamond occurred only towards melts of RE salts, and the faces of a seed diamond in graphite remained almost unchanged or were slightly dissolved. As a result, a distinct step in the diamond relief was formed at the graphite–salt melt salt boundary. This is most clearly seen in the case of significant diamond growth that occurred in the europium oxalate melt (Figure 1a). Most of the diamond seed crystal shown in Figure 1a was located in the graphite capsule. Overgrowth of the newly formed diamond occurred on a small part of the seed, which contacted the molten salt. Table 1 shows the thicknesses of overgrown diamond layers on the {100} and {111} faces of seed crystals, which may be used to assess the diamond growth rates. The highest growth rate occurred in a europium oxalate melt (Eu2(C2O4)3·10H2O): 22.5 μm/h on the {100} faces and 12.5 μm/h on the {111} faces (run ES-8). Additionally, it was the only experiment where spontaneous crystals were produced. Spontaneous crystals of up to 25 μm in size had an octahedral shape. Spontaneous diamonds occurred both on seed crystals (Figure 1c,d) and on the walls of the capsule (Figure 1e,f). Separate not attached diamond crystals (diamond nucleation in the melt) were not detected.
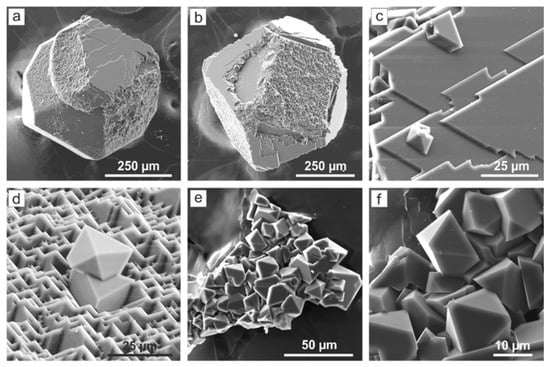
Figure 1.
SEM micrographs of diamonds after run with Eu oxalate melt (run ES-8): (a,b) seed crystals with overgrown diamond layers; (c) {111} face with macrolayers of growth and spontaneous diamond crystals; (d) {100} face with spontaneous diamond crystals; (e,f) intergrowth of spontaneous diamond crystals.
Less intensive diamond growth occurred on seed crystals in an aqueous Eu carbonate melt (Figure 2). The growth rate was no more than 10 μm/h on the {100} faces and about 5.5 μm/h on the {111} faces. The lowest diamond growth rate was detected in experiments with EuCl3 (run ES-3) and EuF2 (run ES-10) melts. The diamond growth rate in these experiments was only 2 μm/h on the {100} faces and 1.0–1.5 μm/h on the {111} faces. Thus, the diamond formation intensity in the studied systems decreases in the following sequence: Eu2(C2O4)3·10H2O > Eu2(CO3)3·3H2O > EuF3 > EuF2 = EuCl3 at P = 7.8 GPa and T = 2000 °C. The identified series of abilities of Eu salts to diamond formation is consistent with the previously identified patterns for alkali metal compounds.
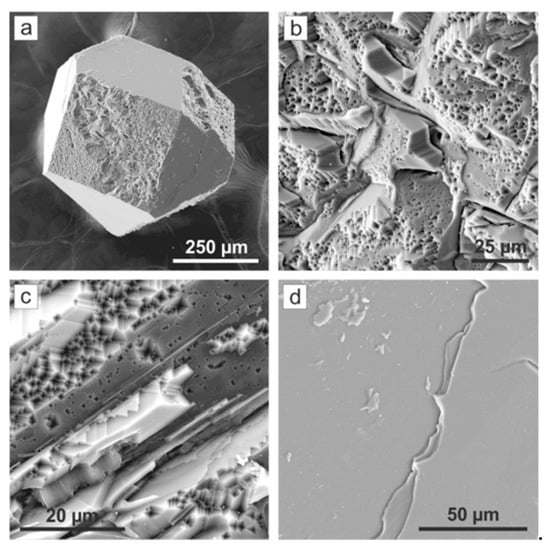
Figure 2.
SEM micrographs of diamonds after run with Eu carbonate melt (run ES-6): (a) seed crystal with overgrown diamond layers; (b,c) fragments of {100} face; (d) growth layers on the (111) face.
For example, Palyanov et al. [11–14] demonstrated that the maximum diamond growth rates in alkali carbonate melts at P = 5.7–7.5 GPa and T = 1200–1700 °C occurred in the presence of oxalate. In water–carbonate systems, the growth rate was significantly reduced. In KCl melts, the minimum growth rates were detected at significantly higher temperatures only [13,16]. It should also be noted that the observed diamond growth rates in RE salt melts are significantly lower than those obtained previously in magnesium-based systems in the presence of REs. For example, diamond growth rates in the Mg+Sm2O3+C system at a temperature of 1800 °C ranged from 1.65 mm/h (at 10 wt.% Sm2O3) to 0.3 mm/h (at 30 wt.% Sm2O3) [8]. In Mg-REM-C systems, the minimum growth rate of 0.5 mm/h (Mg90Yb10+C system) [7] is almost two orders of magnitude higher than the diamond growth rates in molten Eu salts. Apparently, in magnesium-based systems, magnesium primarily contributed to the intensity of diamond formation.
However, unambiguous diamond growth was detected in all the tested systems with europium salts. In all experiments with Eu3+ salts, the ratio of growth rates on the {100} and {111} faces, V(100)/V(111), ranges from 1.75 to 2.0. According to geometric constructions, the formation of an octahedral crystal without {100} faces requires the V(100)/V(111) ratio of speeds to be more than 1.73. Therefore, diamond crystallization in molten Eu3+ salts occurred in the region of stable octahedral growth. Indeed, spontaneous diamond crystals produced in an Eu2(C2O4)3·10H2O melt also have an octahedral shape (run ES-8). The rate ratio is also reflected in the microrelief of {100} and {111} faces. The {100} faces had rough surfaces formed by tetragonal pyramids with octahedral faceting; no flat sites of the {100} faces are formed (Figure 1d and Figure 2b,c). Growth of the {111} faces occurs by triangular layers. The layers edges being oriented along the {110} directions and the vertices being oriented in the direction of {100} faces (Figure 1c and Figure 3). The layers form clusters of various configurations, depending on the system composition. Figure 3 shows examples of the microrelief of {111} faces from the experiments. In an experiment with Eu oxalate (run ES-8), triangular layers form serrate echelons of macrosteps propagating in one direction (Figure 3a). The terraces of steps are covered with numerous triangular vicinal pyramids, no larger than 10 μm in size. The {111} faces are composed of large (up to 100 μm) vicinal pyramids with very sloping stepped walls on the diamond grown in aqueous Eu carbonate (Figure 3b). The wall inclination angle of these vicinal pyramids is less than 1°. In EuF3 (run ES-12) and EuCl3 (run ES-3) melts, growth of the {111} faces occurs at lower rates by echelons of serrate trigonal layers propagating from the edges to the center of the faces (Figure 3c).
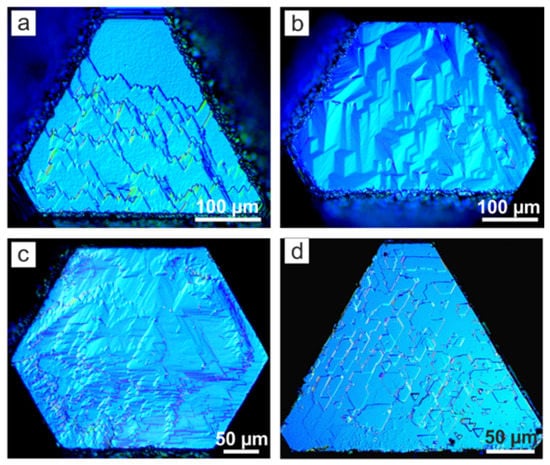
Figure 3.
Optical micrographs (differential interference contrast (DIC) method) of the {111} faces of diamond seed crystals from experiments in molten europium salts: (a) run ES-8; (b) run ES-6; (c) run ES-12; (d) run ES-10.
A different pattern is observed in the case of diamond growth in Eu2+ fluoride (run ES-10). The V(100)/V(111) ratio in this experiment is 1.33. This rate ratio corresponds to the growth of the octahedron with minor {100} faces, which was detected based on the microrelief of faces in this experiment. The {100} faces of seed crystals complete growth by patters and meander islets faceted by {100} and {111} faces (Figure 4a). Diamond growth on the {111} faces occurs by hexagonal macrolayers evenly situated across the entire face (Figure 3d).
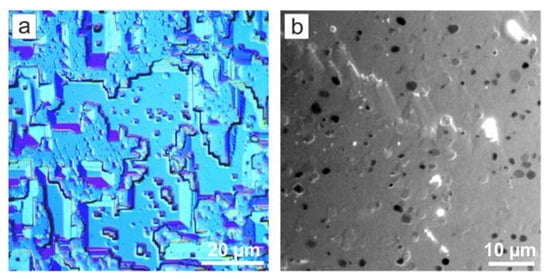
Figure 4.
Optical micrographs of fragments of overgrown diamond layers on seed crystals: (a) {100} face (run ES-10, DIC metod); (b) inclusions of graphite (black) in overgrown diamond layers (run ES-3, transmitted light).
Metastable graphite, in varying amounts, was present in almost all experiments. The crystallization of graphite in the field of diamond thermodynamic stability as a metastable phase of carbon is a well-known phenomenon in the synthesis of diamond using non-metallic solvent catalysts [13,17]. In our experiments, graphite formed intergrowths of plate crystals and grew on seed crystals. Graphite crystallized on seed crystals interacted differently with growing diamond layers, depending on diamond growth rates. In an Eu2(C2O4)3·10H2O (run ES-8) melt, a large amount of metastable graphite had no effect on the morphology of diamond layers (Figure 1 and Figure 3a). As the diamond growth rate in an Eu2(CO3)3·3H2O melt (run ES-6) decreases, traces of joint growth of metastable graphite and diamond in the form of scars with induction surfaces are clearly seen only on the {100} faces (Figure 2b,c). As diamond growth rates further decrease (runs ES-3 and ES-12), metastable graphite crystallizes, together with diamond, on both {100} and {111} faces. In this case, a large amount of inclusions of hexagonal and rounded graphite plates of up to 3 μm in size are found in a diamond layer along the {111} faces (Figure 4b). Metastable graphite in the form of independent crystals was not observed only in an experiment on diamond crystallization in EuF2 melt (run ES-10), where the minimum growth rates were detected. However, the plates of metastable graphite were present as inclusions in diamond layers of {111} faces (Figure 4b). Therefore, the identified series of diamond crystallization intensities in europium salt melts: Eu2(C2O4)3·10H2O > Eu2(CO3)3·3H2O > EuF3 > EuF2 is also valid for the metastable graphite crystallization intensity.
The highest growth rate of diamond and metastable graphite in experiments with aqueous Eu oxalate can be explained by its instability at experimental parameters. We have not found studies on the stability of aqueous Eu carbonate at high pressure. However, on the basis of the available data at atmospheric pressure, we may suppose that carbonate and oxalate dehydration also occurs at elevated P and T parameters. Further, oxalate decomposes to form Eu carbonate, carbon dioxide, and free carbon (graphite). Therefore, diamond crystallization media in these systems were Eu carbonate melts with a dissolved water–carbon dioxide fluid and excess carbon (runs ES-7 and ES-8), or with a predominantly water fluid (run ES-6).
A higher intensity of carbon phases (diamond and graphite) crystallization in experiments with starting aqueous oxalate and Eu carbonate relative to Eu halides correlates with the results of previous studies on diamond crystallization. The diamond growth rates in carbonate systems are significantly higher than the growth rates in halide systems. For example, the degree of graphite to diamond transformation is about 2% in a KCl melt at P = 7.5 GPa, T = 1800 °C, and 20 h [13]. The addition of K2CO3 in an amount of 20 wt.% leads to the complete transition of all graphite to diamond [13]. It was also previously found that the diamond growth rate in melts of alkali metal halide at P = 6 GPa and T = 1620 °C is about 1 μm/h [16]. The diamond growth rate in the K2CO3 + CO2 + C system at close parameters (7.5 GPa and T = 1700 °C) is 8 μm/h [14]. Even at lower P, T parameters, significant diamond growth was observed in melts of alkaline and alkaline earth carbonates [11,12,13,18].
3.2. Spectroscopic Characterization
Infrared absorption measurements were only possible for the aggregates of spontaneously nucleated diamond crystals produced in run ES-8. Due to the polycrystalline structure of the samples and their low thickness (<50 µm) the recorded spectra were distorted and showed relatively low signal-to-noise ratios. Nevertheless, identification of the absorption in the defect-induced one phonon-region could be made without difficulties. The observed absorption band peaking at 1280 cm−1 (Figure 5) can unambiguously be assigned to the A aggregates of nitrogen (pairs of nearest-neighbor substitutional nitrogen atoms). After background correction and normalization of the experimental spectrum to the intrinsic multi-phonon absorption of diamond, the concentration of the A-form nitrogen was estimated from the strength of absorption at 1280 cm−1, taking into account that 1 cm−1 absorption at 1280 cm−1 is produced by 16.5 ppm of A-form nitrogen [19]. Our estimations of the nitrogen content gave values of 1000–1200 ppm. Such nitrogen concentrations are much higher than those typical of synthetic diamonds produced from conventional metal-carbon systems (about 200–300 ppm). At the same time, it has been experimentally demonstrated that diamonds synthesized using different non-metallic catalysts may contain very high nitrogen concentrations, up to 1000 ppm and higher, even if the crystallization system was not deliberately doped with nitrogen-containing species [20,21]. The main sources of nitrogen in this case are the nitrogen impurities in the solvent-catalyst and starting graphite, as well as the atmospheric nitrogen in the pore space in the high-pressure cell components. We can therefore conclude that europium oxalate belongs to that type of solvent-catalysts, which promotes nitrogen incorporation into the growing diamond.
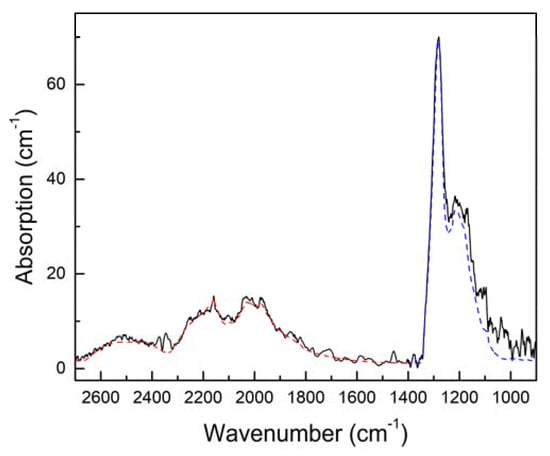
Figure 5.
Infrared absorption spectrum of a spontaneous diamond aggregate from run ES-8. Red dashed curve shows standard absorption spectrum of type IIa diamond. Blue dashed curve shows absorption spectrum of A-form nitrogen.
The photoluminescence characteristics of spontaneous diamond aggregates from run ES-8 were examined for as-recovered samples and after their treatment in acids. The obtained PL spectra are shown in Figure 6. As-recovered samples exhibited strong luminescence features typical of the Eu3+ ions [22]. The spectrum was dominated by three groups of emission lines centered at approximately 592, 615 and 690 nm, which corresponded to the electronic transitions from the 5D0 level to the 7F1, 7F2 and 7F4 sublevels, respectively. Note, that all the emission bands of the Eu3+ ion corresponding to the 5D0 → 7FJ (J = 0−6) transitions could be identified in the spectrum. The observed strong Eu-related photoluminescence was due to contamination of the diamond aggregates with quenched catalyst melt species, presumably europium carbonate. After the acid treatment of the samples, the photoluminescence intensity decreased by approximately, two orders of magnitude and the PL features observed in the spectrum were several times weaker than the first-order Raman line of diamond. The spectrum showed a band due to the N3 centers (zero-phonon line at 415 nm and related phonon sideband), a broad band peaking at 520, whose origin is unclear, and three bands centered at 592 nm, 615 nm and 690 nm, which again can be assigned to the Eu3+ ions. However, in this case, the Eu-related PL bands did not show a fine structure and appeared as a composition of poorly resolved relatively broad peaks. This observation can be explained by supposing that, in this case, the Eu-containing species were entrapped inside the diamond aggregates as inclusions either inside diamond crystals or at the intercrystallite boundaries. Similar effects of the broadening of the Eu-related PL lines were recently observed by Sedov et al. [5] for EuF3 nanoparticles imbedded into the polycrystalline CVD diamond matrix.
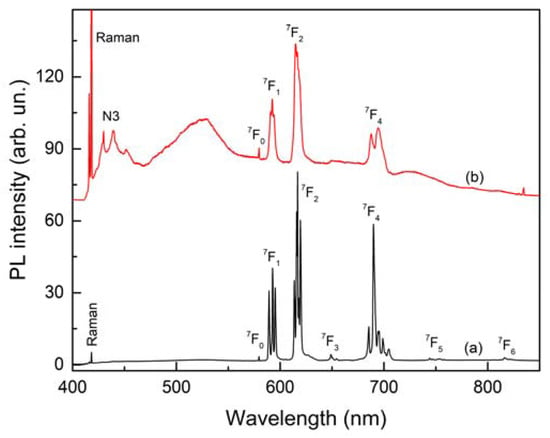
Figure 6.
Photoluminescence spectra of a spontaneous diamond aggregate from run ES-8 recorded (a) before and (b) after acid cleaning. PL bands due transitions from the 5D0 state to different levels of the 7FJ state of the Eu3+ ion are marked. The spectra are displaced vertically for clarity.
Attempts to register photoluminescence from the diamond layers grown on the seed crystals in run ES-8 as well as in other runs, where diamond growth was detected, were not successful, due to the low thickness of the layers and a very strong PL signal originating from the seed crystals. Because of the high temperatures, applied in the synthesis experiments, the seed diamond crystals had undergone an annealing process resulting in the formation of a variety of Co-N and Ni-N optical centers [23], which produce bright photoluminescence in the visible range.
4. Conclusions
A study of diamond crystallization in the melts of europium salts at 7.8 GPa showed that at 1800 °C, diamond synthesis and diamond growth on seed crystals do not occur. Diamond growth on seed crystals was realized in all experiments at 2000 °C. The highest growth rate occurred in the europium oxalate melt: 22.5 μm/h on the {100} faces and 12.5 μm/h on the {111} faces. Additionally, spontaneous diamond crystals were produced in the europium oxalate melt. The diamond formation intensity in the studied systems decreased in the following series: Eu2(C2O4)3·10H2O > Eu2(CO3)3·3H2O > EuF3 > EuF2 = EuCl3. Diamond crystallization occurred in the region of stable octahedral growth in Eu3+ salts melts and in the region of cubo-octahedral growth in a EuF2 melt. The microrelief of faces was characterized by specific features, depending on the system composition and diamond growth rate. From the spectroscopic characterization, it was found that diamonds synthesized from Eu oxalate contain relatively high concentrations of nitrogen (about 1000−1200 ppm) and show weak PL features due to inclusions of Eu-containing species.
Thus, the results showed that molten Eu salts are new diamond-producing systems that provide diamond growth on seeds and spontaneous diamond nucleation at 7.8 GPa and 2000 °C. The sequence in the intensity of diamond formation in the studied systems is established. However, the tested systems did not allow the doping of diamond with Eu ions. Perhaps this is due to the doping of diamond crystals with nitrogen in our experiments. Therefore, a further search for new diamond-producing systems, in our opinion, should focus on nitrogen-gettered systems.
Author Contributions
Conceptualization, Y.N.P.; methodology, Y.N.P. and Y.M.B.; investigation, Y.M.B., A.F.K., I.N.K. and D.V.N.; visualization, A.F.K. and Y.N.P.; writing—original draft preparation, A.F.K. and Y.N.P.; writing—review and editing, Y.N.P. and A.F.K. All authors have read and agreed to the published version of the manuscript.
Funding
This research was funded by the Russian Foundation for Basic Research, grant number 18-29-12041, and the Ministry of Science and Higher Education of the Russian Foundation on state assignment of IGM SB RAS.
Conflicts of Interest
The authors declare no conflict of interest. The funders had no role in the design of the study; in the collection, analyses, or interpretation of data; in the writing of the manuscript, or in the decision to publish the results.
References
- Kenyon, A.J. Recent developments in rare-earth doped materials for optoelectronics. Prog. Quantum Electron. 2002, 26, 225–284. [Google Scholar] [CrossRef]
- Zhong, M.; Hedges, M.P.; Ahlefeldt, R.L.; Bartholomew, J.G.; Beavan, S.E.; Wittig, S.M.; Longdell, J.J.; Sellarset, M.J. Optically addressable nuclear spins in a solid with a six-hour coherence time. Nature 2015, 517, 177–180. [Google Scholar] [CrossRef] [PubMed]
- Magyar, A.; Hu, W.; Shanley, T.; Flatte, M.E.; Hu, E.; Aharonovich, I. Synthesis of luminescent europium defects in diamond. Nat. Commun. 2014, 5, 3523. [Google Scholar] [CrossRef] [PubMed]
- Vanpoucke, D.E.P.; Nicley, S.S.; Raymakers, J.; Maes, W.; Haenen, K. Can europium atoms form luminescent centers in diamond: A combined theoretical–experimental study. Diam. Relat. Mater. 2019, 94, 233–241. [Google Scholar] [CrossRef]
- Sedov, V.S.; Kuznetsov, S.V.; Ralchenko, V.G.; Mayakova, M.N.; Krivobok, V.S.; Savin, S.S.; Zhuravlev, K.P.; Martyanov, A.K.; Romanishkin, I.D.; Khomich, A.A.; et al. Diamond-EuF3 nanocomposites with bright orange photoluminescence. Diam. Relat. Mater. 2017, 72, 47–52. [Google Scholar] [CrossRef]
- Ekimov, E.A.; Zibrov, I.P.; Malykhin, S.A.; Khmelnitskiy, R.A.; Vlasov, I.I. Synthesis of diamond in double carbon-rare earth element systems. Mater. Lett. 2017, 193, 130–132. [Google Scholar] [CrossRef]
- Khokhryakov, A.F.; Borzdov, Y.M.; Kupriyanov, I.N. High-Pressure Diamond Synthesis in the Presence of Rare-Earth Metals. J. Cryst. Growth 2020, 531, 125358. [Google Scholar] [CrossRef]
- Palyanov, Y.N.; Borzdov, Y.M.; Khokhryakov, A.F.; Kupriyanov, I.N. Effect of rare-earth element oxides on diamond crystallization in Mg-based systems. Crystals 2019, 9, 300. [Google Scholar] [CrossRef]
- Palyanov, Y.N.; Borzdov, Y.M.; Kupriyanov, I.N.; Khokhryakov, A.F.; Nechaev, D.V. Diamond crystallization from Mg-C system under high pressure, high temperature conditions. CrystEngComm 2015, 17, 4928–4936. [Google Scholar] [CrossRef]
- Palyanov, Y.N.; Kupriyanov, I.N.; Khokhryakov, A.F.; Borzdov, Y.M. High-pressure crystallization and properties of diamond from magnesium-based catalysts. CrystEngComm 2017, 19, 4459–4475. [Google Scholar] [CrossRef]
- Palyanov, Y.N.; Sokol, A.G.; Borzdov, Y.M.; Khokhryakov, A.F.; Sobolev, N.V. Diamond formation from mantle carbonate fluid. Nature 1999, 400, 417–418. [Google Scholar] [CrossRef]
- Pal’yanov, Y.N.; Sokol, A.G.; Borzdov, Y.M.; Khokhryakov, A.F. Fluid-bearing alkaline carbonate melts as the medium for the formation of diamond in the Earth’s mantle: An experimental study. Lithos 2002, 60, 145–159. [Google Scholar] [CrossRef]
- Palyanov, Y.N.; Shatsky, V.S.; Sobolev, N.V.; Sokol, A.G. The role of mantle ultrapotassic fluids in diamond formation. Proc. National Acad. Sci. USA 2007, 104, 9122–9127. [Google Scholar] [CrossRef] [PubMed]
- Palyanov, Y.N.; Kupriyanov, I.N.; Sokol, A.G.; Borzdov, Y.M.; Khokhryakov, A.F. Effect of CO2 on crystallization and properties of diamond from ultra-alkaline carbonate melt. Lithos 2016, 265, 339–350. [Google Scholar] [CrossRef]
- Sokol, A.G.; Borzdov, Y.M.; Palyanov, Y.N.; Khokhryakov, A.F. High-temperature calibration of a multi-anvil high pressure apparatus. High Press. Res. 2015, 35, 139–147. [Google Scholar] [CrossRef]
- Wang, Y.; Kanda, H. Growth of HPHT diamonds in alkali halides: Possible effects of oxygen contamination. Diam. Relat. Mater. 1998, 7, 57–63. [Google Scholar] [CrossRef]
- Sokol, A.G.; Pal’yanov, Y.N. Diamond crystallization in fluid and carbonate-fluid systems under mantle P-T conditions: 2. An analytical review of experimental date. Geochem. Int. 2004, 42, 1018–1032. [Google Scholar]
- Sokol, A.G.; Borzdov, Y.M.; Palyanov, Y.N.; Khokhryakov, A.F.; Sobolev, N.V. An experimental demonstration of diamond formation in the dolomite-carbon and dolomite-fluid-carbon systems. Eur. J. Mineral. 2001, 13, 893–900. [Google Scholar] [CrossRef]
- Boyd, S.R.; Kiflawi, I.; Woods, G.S. The relationship between infrared absorption and the A defect concentration in diamond. Phil. Mag. B 1994, 69, 1149–1153. [Google Scholar] [CrossRef]
- Kanda, H.; Akaishi, M.; Yamaoka, S. Synthesis of diamond with highest nitrogen concentration. Diam. Relat. Mater. 1999, 8, 1441–1443. [Google Scholar] [CrossRef]
- Palyanov, Y.N.; Bataleva, Y.V.; Sokol, A.G.; Borzdov, Y.M.; Kupriyanov, I.N.; Reutsky, V.N.; Sobolev, N.V. Mantle–slab interaction and redox mechanism of diamond formation. Proc. National Acad. Sci. USA 2013, 110, 20408–20413. [Google Scholar] [CrossRef] [PubMed]
- Binnemans, K. Interpretation of europium (III) spectra. Coord. Chem. Rev. 2015, 295, 1–45. [Google Scholar] [CrossRef]
- Yelisseyev, A.; Kanda, H. Optical centers related to 3d transition metals in diamond. New Diam. Front. Carbon Technol. MYU Tokyo 2007, 17, 127–178. [Google Scholar]
© 2020 by the authors. Licensee MDPI, Basel, Switzerland. This article is an open access article distributed under the terms and conditions of the Creative Commons Attribution (CC BY) license (http://creativecommons.org/licenses/by/4.0/).