Abstract
Coherent X-ray diffraction patterns were recorded by using an X-ray free-electron laser to illuminate barium titanate nanocrystals as a function of time delay after laser excitation. Rather than seeing any significant thermal expansion effects, the diffraction peaks were found to move perpendicular to the momentum transfer direction. This suggests a laser driven rotation of the crystal lattice, which is delayed by the aggregated state of the crystals. Internal deformations associated with crystal contacts were also observed.
1. Introduction
Barium Titanate, BaTiO3 (BTO), is an important ferroelectric material, which was first used to explain the coupling of lattice distortions with phonon mode softening, leading to its ferroelectric structure [1]. It has the classical phase diagram for a perovskite oxide material, with a cubic structure at high temperature, becoming tetragonal below TC = 393 K and then orthorhombic below T2 = 273 K [2]. The room temperature tetragonal phase is ferroelectric with an electric polarization along its c-axis, attributed to displacement of the perovskite B-site Ti4+ ion with respect to the A-site Ba2+, locally displaced towards the unit cell corners.
Nanosized BTO is an important industrial material for making supercapacitors. BTO’s dielectric constant peaks as a function of size, with a maximum of around 140 nm with a factor of three enhancement of dielectric constant, resulting in a big improvement in capacitor performance [3]. A major industry is currently building up for energy storage, which is of significant interest to Energy Sciences. Although BTO has clear structural phase transitions, there are studies showing local rhombohedral distortion even in the cubic phase [4,5]. A powder diffraction study proposed a core–shell structure for the nanoparticles, in which the core is tetragonal and the shell is cubic [6]. The dynamical aspects of this model could in principle explain the enhancement of dielectric constant.
Previous experiments on pump-probe diffraction from BTO thin films at the Linac Coherent Light Source (LCLS) showed a small lattice expansion, but no direct piezoelectric response [7]. A fast sub-10 ps transient increase in the 003 peak intensity was detected, followed by a shift in the rocking curve to lower angles on an acoustic response time of 15 ps. The response indicates a lattice expansion of 0.04% and 0.11% in two different experiments using THz illumination. The expansion was reported to be linear in fluence and attributed to enhanced vibrations of the Ti4+ ion, analogous to transient heating, subsequently relaxing on a time scale of 10 ns.
Bragg Coherent Diffraction Imaging (BCDI) is a powerful X-ray technique for investigating the structures of nanocrystals in three dimensions on the 30 nm resolution scale [8]. By using an area detector far enough from the sample, the fringes surrounding a Bragg diffraction peak, due to the external shape of the crystals, can be oversampled with respect to their spatial Shannon—Nyquist frequency. Such data can be inverted to images using iterative algorithms, namely the error reduction and hybrid input-output methods [9]. These methods depend on a well-defined spatial support function, used as the real-space constraint, which can be provided by a “shrink-wrap” approach [10]. The advantage of BCDI, which is important here, is its high sensitivity to the distribution of nano-scale strains inside the nanocrystal under investigation [11]. BCDI is a 3-D imaging method that is particularly valuable for probing the responses of individual nano-sized crystal grains embedded in an in situ environment, such as a polycrystalline material, a battery electrode or a working catalyst particle. More details about Bragg coherent diffraction imaging can be found in other specialized reviews [12,13,14,15,16,17,18,19,20]. In this work, BCDI is combined with laser excitation of the samples in a pump-probe approach to obtain ultrafast time-resolved images of internal strain fields [21].
2. Materials and Methods
Barium Titanate (BTO) nanocrystals were obtained commercially from Sigma-Aldrich and were assumed to have been fabricated by hydrothermal synthesis. The crystals were found by Scanning Electron Microscopy (SEM, Zeiss Sigma 300VP, Carl Zeiss Microscopy GmbH) to have roughly spherical shapes and a size distribution centered at 200 nm. Crystals were drop-cast from ethanol suspension onto a Si3N4 (SiN) window array provided by Silson. The crystals were bonded to the substrate using 1% Tetraethyl Orthosilicate (TEOS) as an adhesive and calcined in air at 723 K [8]. No particular care was taken to ensure that the crystals were separated from each other on the substrate. They were found to be clustered together in aggregates, which was found to have consequences for the laser excitation described below.
The transmission geometry was used to measure coherent X-ray diffraction patterns of the samples. We had previously found [22] that this led to slightly higher damage thresholds for the samples to become detached from the substrate by radiation pressure, at least with respect to the commonly used grazing incidence geometry [23]. The samples were mounted on the Huber diffractometer of the X-ray Pump-Probe (XPP) station of the LCLS, an X-ray Free Electron Laser (XFEL) at Stanford, USA. The 9 keV X-ray beam was focused with in-line X-ray Compound Refractive Lenses (CRLs) and 10–15% attenuators were used to stay below the X-ray damage threshold, as detected by the sudden loss of diffraction peaks. A 120 Hz repetition rate was used. Two-dimensional and three-dimensional Bragg Coherent Diffraction Imaging (BCDI) data at a range of delay times were collected on the CS-Pad detector (pixel size 110 µm) placed 1.575 m downstream of the sample at 27° Bragg angle in the vertical scattering-plane geometry. After mapping the general behavior, discussed below, we selected about six nano-crystals for detailed BCDI measurement over 36 h of “standard configuration” operations at LCLS.
The XPP Ti-sapphire laser was synchronized with the X-ray beam via a motorized delay line, allowing pump-probe delays up to several nanoseconds. The beam came down through the hutch roof and was directed onto the sample by the final focusing mirror in a collinear geometry with about 2° inclination. Temporal overlap was calibrated with a Bi standard. Spatial overlap was set with phosphor screens and checked using diffraction effects seen from the actual samples, as well as with some Au standard crystals [23]. The laser was used on the third harmonic, with a wavelength of 266 nm, to excite the sample above its band gap of 5 eV. Manual adjustments were made initially of the time delay and the beam position on the sample, to explore the response to the laser with a real-time display. Then, time-delay scans were made on aligned samples to extract quantitative values for the Bragg peak position on the detector, to learn about the laser-induced changes of the crystal structure.
3. Results
Previous experiments on metal nanocrystals have measured radial oscillatory Bragg peak movements on the detector. These are identified as breathing modes of crystal vibration in which the crystal expands and contracts with a period given by the ratio of the speed of sound to the crystal size [23]. These vibrations represent the impulse response of the crystal to a short thermal pulse applied homogeneously throughout the crystal. The Two Temperature Model (2TM) [24] is invoked to explain how the optical excitation reaches the entire nanocrystal faster than the sound velocity: the optical absorption is relayed by hot electrons that travel rapidly through the crystal before equilibrating their temperature with the lattice. Both the electron transport and electron–phonon coupling take place on a time scale of around 1 ps, significantly faster than the acoustic response of the crystal, for which the vibration period is consistent with the speed of sound in the material.
In this study, BTO nanocrystals have a tetragonal structure at room temperature, with lattice constants close to a = 3.99 Å and c = 4.01 Å. The split of (110) and (001) Bragg peak is 0.107° at 9 keV, which is covered by the angle range of the detector. We observed two clear Debye–Scherrer (DS) powder rings of spots corresponding to the tetragonally distorted (110) and (101) diffraction peaks. At different positions on the sample, peaks were found to lie along two powder rings separated by 0.107°, as expected. From any single shot of any area on the sample, we saw at least 3–4 diffraction peaks, always located on one or the other powder ring. The spots from individual nanocrystals were well separated and the number of peaks on the outer (110) ring was roughly half the number on the inner (101) ring, consistent with the multiplicity. Unexpectedly, during real-time monitoring of the diffraction pattern during laser excitation, we found that some of the diffraction spots moved around the DS ring, transverse to the scattering vector direction. This motion reversed when the laser was turned off. Some other spots showed a blinking behavior, becoming less or more intense upon excitation. Both the pattern movement around the DS ring and blinking are further explored in the time delay scanning study described in the next section. There were also many diffraction spots which did not respond at all to the laser, a behavior we attribute to a blocking of the laser by other nanocrystals within the clusters of crystals seen in the SEM. No significant radial spot motion was detected in this real-time preliminary investigation.
We attribute both responses to crystal rotations, as shown in Figure 1. We used a vertical scattering-plane geometry, in which the powder rings lie horizontally on the detector. Any vertical movement of the diffraction peaks involves a changing of the Bragg angle. Due to the high coherence of the X-ray source and small beam size, each crystal grain generates a separate diffraction pattern along the powder ring without the interference from others, so that the geometry and temporal changes of each individual crystal can be directly attributed to its diffraction pattern. The transverse motion on the detector corresponds to a component of rotation around the forward direction, denoted as the “X-axis” in the figure, while the blinking corresponds to transverse rotations on or off the Bragg condition, denoted as the “Z-axis”. Rotations of crystals about their third axis, denoted the “Y-axis”, the scattering vector direction, would not have been detected.
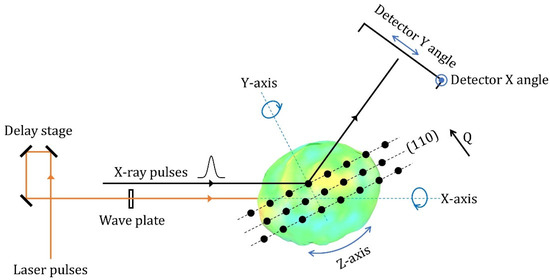
Figure 1.
Illustration of the set-up for the X-ray pump-probe experiment performed at Linac Coherent Light Source (LCLS). A 0.5 m delay stage is used for making laser pulse time delays up to 3000 ps. The wave plate is used to control the fluence of the laser pulses. The X, Y and Z axes of the crystal under Bragg condition are shown and the (110)/(101) Bragg planes are indicated schematically. Rotation of the crystal around the X-axis causes the diffraction pattern to move in the X direction on the detector, which is around the (110)/(101) powder ring. Rotation around the Z-axis results in a scanning of the crystal through its Bragg condition and leads to an intensity difference. This is the “blinking” phenomenon seen in the experiment. Any rotation around the Y-axis is not detected. Movements in the Y direction on the detector would indicate lattice expansions or contractions.
Crystals were then selected for further investigation using two approaches. Time delay scans were performed after centering a selected nanocrystal in the X-ray beam and on the maximum of its rocking curve; these allowed detailed measurement of the Bragg peak position on the detector with sub-pixel accuracy as a function of time delay. The Center of Mass (COM) of the diffraction pattern was viewed as the pattern center and was tracked over different time delay scans. Figure 2a shows the rotation angle variation of diffraction pattern center from the position at the start of measurement, along the X and Y directions of the detector. Zone 1 and Zone 2 were acquired from different scans and combined together. Waterfall plots of these position changes can be seen in Figure 2c–f. Figure 2b shows the intensity plot over different delay times. There is a clear difference between Zone 1 and Zone 2. In Zone 1, the intensity is higher and the period of oscillation is shorter, around 100 ps, while in Zone 2, there is a 450 ps periodic oscillation when time delay is over 1500 ps.
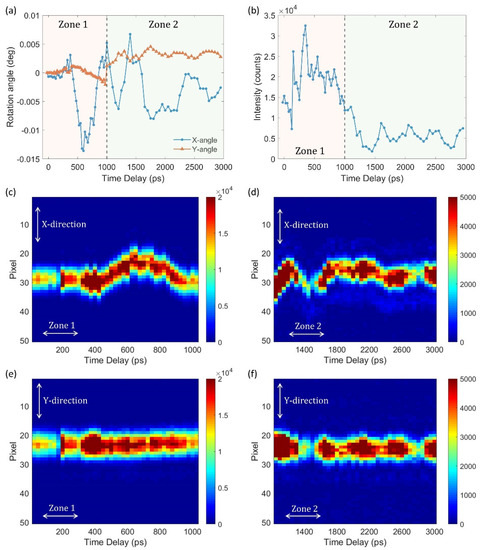
Figure 2.
(a) The rotation of a (110) Barium Titanate (BTO) diffraction pattern along the X and Y directions of the detector as a function of laser pump-probe delay. (b) Intensity plot of diffraction pattern for different laser pulse delays. Zone 1 and Zone 2 were recorded before and after a Bragg Coherent Diffraction Imaging (BCDI) measurement. (c–f) Waterfall plots of transverse (X) and radial (Y) slices through the diffraction pattern for different time delays. The first (c,d) and second (e,f) rows display positions in the X and Y directions, respectively.
The time scale for both X-axis and Z-axis rotations was the same, so we conclude that it was just due to its chance orientation of the crystal around the (110) Q-vector of the measurement. There is an interesting delayed onset of the motion in Figure 2a, around 250 ps, seen on this crystal and several others. This can be understood as the laser and X-ray beam are not hitting the same crystal in the BTO nanocrystal aggregates and acoustic coupling between them. The randomly oriented individual crystals are assumed to be bonded together into aggregates as shown in Figure 3. This sketch shows how there can be a delay between the X-ray diffraction signal and the laser heating. The X-ray penetration depth of 15 μm can reach many 200 nm-sized crystals within the aggregate, while the laser is absorbed only by the surface layer. One crystal inside (colored blue) is illuminated by the X-ray and gives rise to the diffraction and BCDI images, while the laser is directly heating other crystals on the front of the sample. It takes time for the mechanical response to the laser heating to transfer from the front side to the inside, which explains the time delay before the onset of the motion observed. To the extent that BTO is a piezoelectric material, where the laser excitation could lead to a piezoelectric deformation, we cannot identify whether the observed delay of the X-ray diffraction signal is purely thermally driven, or whether the piezoelectric response also makes contributions.
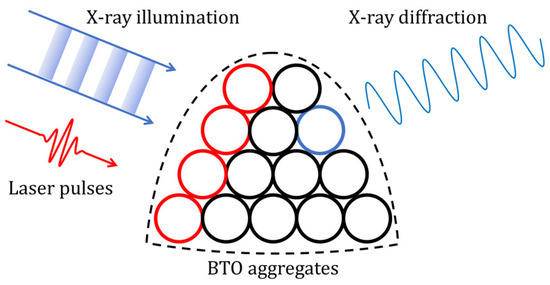
Figure 3.
Illustration of the time delay between laser heating and X-ray diffraction response. All the crystals (circles) are illuminated by the X-ray beam, while only the crystal colored blue is at the correct Bragg angle to give the X-ray diffraction signal. The laser is absorbed by the front row of crystals, colored red.
At strategic points on these time delay scans, BCDI experiments were performed to map out the single crystal shape and displacement field in three dimensions. The (110) diffraction pattern from the selected crystal was first centered to the maximum intensity position by adjusting the sample stage. Then a series of 2-D diffraction pattern data were taken by collecting rocking curve scans across the Bragg condition, with angular steps fine enough to oversample the coherent diffraction patterns. These 2-D datasets were stacked into 3-D and then inverted to real-space images using iterative algorithms, alternating cycles of error reduction and hybrid input-output [9], using a “shrink-wrap” support [10] and combining with partial coherence correction [25]. The data inversion was carried out in the detector-pixel-angle coordinate system and then transformed to the laboratory coordinates in the standard way [11]. The first column of Figure 4 shows the central slice of the 3-D diffraction patterns at different time delays, while the second and third columns show their corresponding reconstructed Bragg density slice and displacement slice, respectively. The displacement shown at each point in the crystal is derived from the phase of the complex image ϕ, and given as the projection of the 3-D displacement u along the Q-vector, using the relation ϕ = Q·u [19]. For a perfect single crystal, the Bragg density map would have only one center in the middle and monotonically decrease towards the surface. In this case, however, there are several high-density regions distributed inside the single crystal indicating a complex nature, as shown in second column of Figure 4. The displacement map is also seen to be changing with time delay. The crystal has a positive displaced region seen before the laser pump at −50 ps. After +50 ps of pump-probe delay, the positive displaced region diminishes, while there are negative displaced regions appearing at the surface, which could arise from contacts with surrounding crystals showing a compressive strain. When the laser pump delay reaches +500 ps to +700 ps, a positive displaced region appears again on the surface. Upon +900 ps laser delay, the positive region inside the crystal comes back.
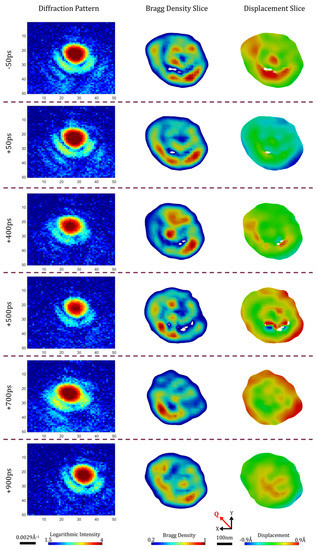
Figure 4.
(110) diffraction patterns and their reconstructed images of the same BTO crystal shown in Figure 2 after different pump-probe delays. The first column shows the central slices of 3-D diffraction patterns of a single crystal after different laser delays. The powder ring direction is horizontal, as shown in the figure. These 3-D diffraction patterns were inverted into 3-D real-space images. The second column is slices of reconstructed Bragg density (image amplitude), which gives the shape and crystal ordering information. The third column is slices of retrieved displacement field projected along the Q-vector (shown inset in red). The positive and negative value represent tensile and compressive displacement, respectively.
BCDI cannot directly see the small crystal rotation as indicated in Figure 2, but is sensitive to any inhomogeneous shearing of the crystal lattice, which also contributes to the peak motions. By directly viewing the crystal in 3-D, however, we find that both the Bragg density slices and displacement slices are complex and continuously changing inside a single crystal grain following laser excitation. The surface displacement fields are different from the center, indicating the presence of lattice shearing. We think that these sharp dynamic changes are plausible given that the crystal is in close contact with other crystal grains.
4. Discussion
Our XFEL experiment clearly shows that rotations of the BTO nanocrystals are induced by laser excitation on a 100 ps time scale, appropriate for an acoustic response of the material. An observed response time delay around 200 ps could be attributed to the generation of acoustic waves at some distance from the part of the sample probed with the X-ray diffraction. The longitudinal and transverse speeds of sound of BTO (in sintered ceramics) are 4800 and 2400 m/s [26,27], so the 250 ps time delay corresponds to a distance between the excitation and its observation of 1.2 or 0.6 µm. The apparent vibration period of 450 ps would correspond to the breathing of a slab of nanocrystals 1.1 or 0.55 µm thick. Both these lengths are greater than the 200 nm size of the particles being measured with the X-rays, so we consider this to represent a collective response of several nanocrystals bonded together into aggregates.
Author Contributions
R.H. and I.R. planned the experiment and prepared the samples. R.H., X.H., F.Z., B.C., A.U., S.S., D.Z., D.K. and I.R. performed the measurements. J.D., M.C., and I.R. carried out the data analysis. All authors contributed to writing the paper. All authors have read and agreed to the published version of the manuscript.
Funding
The work was supported by the UK EPSRC grant EP/I022562/1. Work at Brookhaven National Laboratory was supported by the U.S. Department of Energy (DOE), Office of Science, Office of Basic Energy Sciences, under Contract No. DE-SC0012704. Work at Argonne National Laboratory was supported the DOE Office of Science by under Contract No. DE-AC02-06CH11357. Work at the SLAC National Accelerator Laboratory, was supported by the DOE Office of Science, Office of Basic Energy Sciences under Contract No. DE-AC02-76SF00515. F.Z. acknowledges funding from the National Natural Science Foundation of China (No. 11775105). B.C. is also supported by the “Shanghai PuJiang Talent Program” with grant No. 18PJ1410400 and the National Natural Science Foundation of China with grant No. 51971160.
Acknowledgments
The X-ray pump-probe experimental work was carried out at the Linac Coherent Light Source (LCLS), a National User Facility operated by Stanford University on behalf of the U.S. Department of Energy, Office of Basic Energy Sciences. We are grateful for useful discussions about this work with Jesse Clark, Aaron Lindenberg, Mariano Trigo, David Reis and Wen Hu. J.D. thanks the China Scholarship Council (CSC) for financial support.
Conflicts of Interest
The authors declare no financial conflict of interest.
References
- Lines, M.E.; Glass, A.M. Principles and Applications of Ferroelectrics and Related Materials; Oxford University Press: Oxford, UK, 1977; pp. 24–56. [Google Scholar] [CrossRef]
- Hippel, A.V. Ferroelectricity, domain structure and phase transitions of barium titanate. Rev. Mod. Phys. 1950, 22, 221–237. [Google Scholar] [CrossRef]
- Arlt, G.; Hennings, D.; With, G. Dielectric properties of fine-grained barium titanate ceramics. J. Appl. Phys. 1985, 58, 1619–1625. [Google Scholar] [CrossRef]
- Hlinka, J.; Ostapchuk, T.; Nuzhnyy, D.; Petzelt, J.; Kuzel, P.; Kadlec, C.; Vanek, P.; Ponomareva, I.; Bellaiche, L. Coexistence of the phonon and relaxation soft modes in the terahertz dielectric response of tetragonal BaTiO3. Phys. Rev. Lett. 2008, 101, 167402. [Google Scholar] [CrossRef] [PubMed]
- Stern, E.A. Character of order-disorder and displacive components in barium titanate. Phys. Rev. Lett. 2004, 93, 037601. [Google Scholar] [CrossRef]
- Hoshina, T.; Wada, S.; Kuroiwa, Y.; Tsurumi, T. Composite structure and size effect of barium titanate nanoparticles. Appl. Phys. Lett. 2008, 93, 192914. [Google Scholar] [CrossRef]
- Chen, F.; Zhu, Y.; Liu, S.; Qi, Y.; Hwang, H.Y.; Brandt, N.C.; Lu, J.; Quirin, F.; Enquist, H.; Zalden, P.; et al. Ultrafast terahertz-field-driven ionic response in ferroelectric BaTiO3. Phys. Rev. B 2016, 94, 180104. [Google Scholar] [CrossRef]
- Monteforte, M.; Estandarte, A.K.; Chen, B.; Harder, R.; Huang, M.H.; Robinson, I.K. Novel silica stabilization method for the analysis of fine nanocrystals using coherent X-ray diffraction imaging. J. Synchrotron Radiat. 2016, 23, 953–958. [Google Scholar] [CrossRef]
- Fienup, J.R. Phase retrieval algorithms: A comparison. Appl. Opt. 1982, 21, 2758–2769. [Google Scholar] [CrossRef]
- Marchesini, S. Invited article: A unified evaluation of iterative projection algorithms for phase retrieval. Rev. Sci. Instrum. 2007, 78, 011301. [Google Scholar] [CrossRef]
- Pfeifer, M.A.; Williams, G.J.; Vartanyants, I.A.; Harder, R.; Robinson, I.K. Three-dimensional mapping of a deformation field inside a nanocrystal. Nature 2006, 442, 63–66. [Google Scholar] [CrossRef]
- Robinson, I.; Harder, R. Coherent X-ray diffraction imaging of strain at the nanoscale. Nat. Mater. 2009, 8, 291–298. [Google Scholar] [CrossRef] [PubMed]
- Xiong, G.; Moutanabbir, O.; Reiche, M.; Harder, R.; Clark, J.; Robinson, I. Coherent X-ray diffraction imaging and characterization of strain in silicon-on-insulator structures. Adv. Mater. 2014, 26, 7747–7763. [Google Scholar] [CrossRef] [PubMed]
- Miao, J.; Ishikawa, T.; Robinson, I.K.; Murnane, M.M. Beyond crystallography: Diffractive imaging using coherent X-ray light sources. Science 2015, 348, 530–535. [Google Scholar] [CrossRef] [PubMed]
- Robinson, I.; Assefa, T.; Cao, Y.; Gu, G.; Harder, R.; Maxey, E.; Dean, M. Domain texture of the orthorhombic phase of La2−xBaxCuO4. J. Supercond. Nov. Magn. 2020, 33, 99–106. [Google Scholar] [CrossRef]
- Estandarte, A.K.; Lynch, C.M.; Monteforte, M.; Rawle, J.; Nicklin, C.; Robinson, I. Bragg coherent diffraction imaging of iron diffusion into gold nanocrystals. New J. Phys. 2018, 20, 113026. [Google Scholar] [CrossRef]
- Hofmann, F.; Tarleton, E.; Harder, R.J.; Phillips, N.W.; Ma, P.-W.; Clark, J.; Robinson, I.K.; Abbey, B.; Liu, W.; Beck, C.E.; et al. 3D lattice distortions and defect structures in ion-implanted nano-crystals. Nat. Sci. Rep. 2017, 7, 45993. [Google Scholar] [CrossRef]
- Diao, J.; Chen, B.; Lin, W.; Luo, Q.; Liu, X.; Shen, J.; Robinson, I. Nucleation of fractal nanocrystallites upon annealing of Fe-based metallic glass. J. Mater. Res. 2017, 32, 1880–1887. [Google Scholar] [CrossRef]
- Chen, B.; Diao, J.; Luo, Q.; Rawle, J.; Liu, X.; Nicklin, C.; Shen, J.; Robinson, I. In-situ investigation of crystallization and structural evolution of a metallic glass in three dimensions at nano-scale. Mater. Des. 2020, 190, 108551. [Google Scholar] [CrossRef]
- Ihli, J.; Clark, J.N.; Cote, A.S.; Kim, Y.-Y.; Schenk, A.S.; Kulak, A.S.; Comyn, T.P.; Chammas, O.; Harder, R.J.; Duffy, D.M.; et al. Strain-relief by single dislocation loops in calcite crystals grown on self-assembled monolayers. Nat. Commun. 2016, 7, 11878. [Google Scholar] [CrossRef]
- Berlincourt, D.; Jaffe, H. Elastic and piezoelectric coefficients of single—crystal barium titanate. Phys. Rev. 1958, 111, 143–148. [Google Scholar] [CrossRef]
- Clark, J.N.; Beitra, L.; Xiong, G.; Higginbotham, A.; Fritz, D.M.; Lemke, H.T.; Zhu, D.; Chollet, M.; Williams, G.J.; Messerschmidt, M.; et al. Imaging transient melting of a nanocrystal using an X-ray laser. Proc. Natl. Acad. Sci. USA 2015, 112, 7444–7448. [Google Scholar] [CrossRef] [PubMed]
- Clark, J.N.; Beitra, L.; Xiong, G.; Higginbotham, A.; Fritz, D.M.; Lemke, H.T.; Zhu, D.; Chollet, M.; Williams, G.J.; Messerschmidt, M.; et al. Ultrafast three-dimensional imaging of lattice dynamics in individual gold nanocrystals. Science 2013, 341, 56–59. [Google Scholar] [CrossRef] [PubMed]
- Allen, P.B. Theory of thermal relaxation of electrons in metals. Phys. Rev. Lett. 1987, 59, 1460–1463. [Google Scholar] [CrossRef] [PubMed]
- Clark, J.N.; Huang, X.; Harder, R.; Robinson, I.K. High-resolution three-dimensional partially coherent diffraction imaging. Nat. Commun. 2012, 3, 993. [Google Scholar] [CrossRef]
- Kashida, S.; Hatta, I.; Ikushima, A.; Yamada, Y. Ultrasonic velocities in BaTiO3. J. Phys. Soc. Jpn. 1973, 34, 997–1001. [Google Scholar] [CrossRef]
- Ogawa, T.; Ikegaya, T. Elastic constants measured from acoustic wave velocities in barium titanate piezoelectric ceramics. Jpn. J. Appl. Phys. 2015, 54, 011501. [Google Scholar] [CrossRef]


© 2020 by the authors. Licensee MDPI, Basel, Switzerland. This article is an open access article distributed under the terms and conditions of the Creative Commons Attribution (CC BY) license (http://creativecommons.org/licenses/by/4.0/).