Article

Insight into Positional Isomerism of N-(Benzo[d]thiazol-2-yl)-o/m/p-Nitrobenzamide: Crystal Structure, Hirshfeld Surface Analysis and Interaction Energy

by
Aqilah Binti Abdul Latiff
1,
Yan Yi Chong
1,
Wun Fui Mark-Lee
2,* and
Mohammad B. Kassim
1,*
1
Department of Chemical Sciences, Faculty of Science and Technology, Universiti Kebangsaan Malaysia, Bangi, Selangor 43600, Malaysia
2
Department of Basic Science and Engineering, Faculty of Agriculture and Food Sciences, Universiti Putra Malaysia, Bintulu, Sarawak 97008, Malaysia
*
Authors to whom correspondence should be addressed.
Crystals 2020, 10(5), 348; https://doi.org/10.3390/cryst10050348
Submission received: 15 March 2020 / Revised: 14 April 2020 / Accepted: 15 April 2020 / Published: 28 April 2020

Abstract

:
The functionalization of N-(benzo[d]thiazol-2-yl)benzamide with a nitro (NO2) substituent influences the solid-state arrangement, absorption and fluorescence properties of these compounds. Each of these compounds crystallised in a different crystal system or space group, namely a monoclinic crystal system with P21/n and C2/c space groups for o-NO2 and m-NO2 derivatives, respectively, and an orthorhombic crystal system (Pbcn space group) for p-NO2 derivative. The o-NO2 substituent with intrinsic steric hindrance engendered a distorted geometry. Conversely, the m-NO2 derivate displayed the most planar geometry among the analogues. The solid-state architectures of these compounds were dominated by the N−H···N and C−H···O intermolecular hydrogen bonds and were further stabilised by other weak interactions. The dimer synthons of the compounds were established via a pair of N−H···N hydrogen bonds. These findings were corroborated by a Hirshfeld surface analysis and two-dimensional (2D) fingerprint plot. The interaction energies within the crystal packing were calculated (CE-B3LYP/6-31G(d,p)) and the energy frameworks were modelled by CrystalExplorer17.5. The highly distorted o-NO2 congener synthon relied mainly on the dispersion forces, which included π–π interactions compared to the electrostatic attractions found in m-NO2. Besides, the latter possesses an elevated asphericity character, portraying a marked directionality in the crystal array. The electrostatic and dispersion forces were regarded as the dominant factors in stabilising the crystal packing.

1. Introduction

Benzothiazole is a multi-donor heterocyclic compound derived from thiazole and the compound has been applied for a variety of biological applications such as antitumor [1], antifungal [2], anticancer [3] and antibacterial [4]. The compound has also attracted interest from researchers for its photosensitizing properties [5]. Besides, the current activity in benzothiazole research has also gained much momentum from its potential applications as nonlinear optical (NLO) materials, light emitting diodes (LED) and solar cells due to desired optical and electronic properties with proper molecular tuning [6]. This multi-donor heterocyclic compound is of particular interest due to its favourable properties in the fabrication of an optimum electron donor-acceptor system [7] when coupled with substituted aromatic compounds. Besides, this compound is advantageous for its diverse ligating behaviour, thus, it can be used as a precursor for the templating reaction and a receptor or active site for organic molecules [8].
In this research, we synthesised the N-(benzo[d]thiazol-2-yl)-R-nitrobenzamide (where R = o, m and p) compounds (abbreviated as R-BTBA) and studied their structural and optical properties. This class of compounds has been reported to possess good luminescent properties [9] and the incorporation of the NO2 group is expected to provide interesting electronic properties due to the mesomeric effect [10]. The structure of the parent molecule, BTBA, is simple and synthetically facile, and thus, led to an upsurge of interest in this class of compounds [11,12]. Previously, it was reported that the position, rather than the variety of the substituent, i.e., CH3, CCl3, CF3 and Cl3 on the nitrobenzene, has a greater impact on the kinetics of the reaction to form the desired R-Ph(NO2) product [13]. In addition, we also investigated the compounds theoretically via density functional theory (DFT) calculations to corroborate the experimental study.
Varying the positions of the NO2 group on the phenyl ring has augmented the dipole moment and doubled the hyperpolarizability of (2E-1-(4-aminophenyl)-3-(4-nitrophenyl)prop-2-en-1-one compared to the meta and ortho derivates [14]. Previous study on the chemical reactivity properties, namely hardness (η), chemical potential (μ), and electrophilicity (ω) for a series of diindolylmethane-R-phenyl (R = o, m, and p) boronic acid, has demonstrated that the ortho analogue has the highest reactivity [15].

2. Materials and Methods

2.1. General Experiment

All reagents and solvents were purchased from Sigma-Aldrich and were used as received without further purification. Thin layer chromatography (TLC) with ethyl acetate:n-hexane (ratio of 1:2) as the mobile phase was used to monitor the reactions. 1H and 13C NMR spectra were recorded at room temperature with a Bruker Ascend 400 spectrometer (Bruker, Fällanden, Switzerland), operating at 400 MHz, in which deuterated dimethyl sulfoxide (DMSO-d6) and tetramethylsilane (TMS) were used as the solvent and internal reference, respectively. Chemical shifts and coupling constants (J) are quoted in parts per million (ppm) and Hertz (Hz), respectively, relative to TMS. Mass spectrometry was performed using the DIMS 2010 Shimadzu spectrometer (Shimadzu Corporation, Kyoto, Japan) with electrospray ionization (ESI) in positive mode. Electronic spectra for the compounds were recorded on a UV-1650 Pc Shimadzu Fision spectrophotometer (Shimadzu Corporation, Kyoto, Japan). The emission spectra of these three compounds were recorded on a Hitachi F-7000 spectrofluorometer (Hitachi High-Tech Corporation, Tokyo, Japan). Infrared (IR) spectra were recorded using an Agilent Cary 630 spectrophotometer (Agilent Technologies Inc., Santa Clara, CA, USA) equipped with a 5-bounce zinc selenide attenuated total reflectance sampling accessory.

2.2. Synthetic Procedures

N-(benzo[d]thiazol-2-yl)-o-nitrobenzamide (I) was synthesised according to the literature [16]. A mixture of o-nitrobenzoyl chloride (0.5 mL, 3.33 mmol) and 2-aminobenzothiazole (0.5 g, 3.33 mmol) in toluene with Et3N (0.5 mL, 3.33 mmol) was heated at refluxing temperature for 5 hours (Scheme 1). The mixture was then allowed to cool to room temperature. The precipitate was then filtered off using Büchner filter, washed with an excess amount of water and n-hexane. The same method was repeated to synthesise N-(benzo[d]thiazol-2-yl)-m-nitrobenzamide (II) and N-(benzo[d]thiazol-2-yl)-p-nitrobenzamide (III) by substituting the o-nitrobenzoyl chloride with m- and p-nitrobenzoyl chloride, respectively.
Compound I: Yield = 0.89 g (90%). IR (ATR/cm−1): 3173 [ν(N–H)], 1690 [ν(C=O)], 1597 [ν(C=N)], 1401–1550 [ν(ArC=C)]. 1H NMR (400 MHz, DMSO–d6) δ = 7.36 (t, 1H, J = 16 Hz), 7.48 (t, 1H, J = 16 Hz), 7.78–7.94 (m, 4H), 8.04 (d, 1H, J = 8 Hz), 8.22 (d, 1H, J = 8 Hz), 13.15 (s, 1H); 13C NMR (400 MHz, DMSO–d6) δ = 121.10, 122.36, 124.41, 124.92, 126.83, 130.15, 130.80, 131.84, 132.35, 134.90, 146.75, 148.82, 158.44, 165.90.
Compound II: Yield = 0.82 g (82.4%). IR (ATR/cm−1): 3124 [ν(N–H)], 1674 [ν(C=O)], 1599 [ν(C=N)], 1437–1524 [ν(ArC=C)]. 1H NMR (400 MHz, DMSO–d6) δ = 7.34 (t, 1H, J = 14.7 Hz), 7.47 (t, 1H, J = 15.2 Hz), 7.75–7.86 (m, 2H), 8.00 (d, 1H, J = 7.84 Hz), 8.45–8.54 (m, 2H), 8.96 (s, 1H), 13.33 (s, 1H); 13C NMR (400 MHz, DMSO–d6) δ = 120.24, 122.41, 123.70, 124.34, 126.86, 127.54, 129.35, 130.81, 131.40, 134.42, 135.11, 148.23, 165.45, 165.99.
Compound III: Yield = 0.73 g (73.7%). IR (ATR/cm−1): 3121 [ν(N–H)], 1673 [ν(C=O)], 1597 [ν(C=N)], 1441–1512 [ν(ArC=C)]. 1H NMR (400 MHz, DMSO–d6) δ = 7.36 (t, 1H, J = 14.9 Hz), 7.49 (t, 1H, J = 14.8 Hz), 7.79 (d, 1H, J = 7.8 Hz), 8.03 (d, 1H, J = 7.84 Hz), 8.33–8.39 (m, 4H), 13.29 (s, 1H); 13C NMR (400 MHz, DMSO–d6) δ = 120.43, 122.44, 123.76, 124.11, 124.41, 126.88, 128.20, 130.39, 131.57, 138.39, 148.30, 150.20, 159.14, 165.52.

2.3. Single Crystal X-ray Diffraction Studies

Single crystal diffraction data for I and II were collected at 100 K while III was collected at 298 K on a Rigaku XtaLAB Synergy-S diffractometer (Rigaku Corporation, Tokyo, Japan) with Cu-Kα radiation (λ = 1.54178 Å). The crystal structures were solved by direct methods and refined by the full-matrix least-squares method on weighted F2 values for all reflections using ShelXL [17]. The molecular graphics were produced by using Olex2 software [18]. All non-hydrogen atoms were refined with anisotropic displacement parameters. Hydrogen atoms were positioned geometrically and allowed to ride on their respective parent atoms with Uiso(H)=1.2Ueq for aryl H atoms. The N- and C-bound H atom involved in hydrogen bonding was constrained by an AFIX command (AFIX 44).

2.4. Computational Methods

The Cartesian coordinates of all the molecules were extracted from the X-ray structure and used as an input for geometrical optimization via density functional theory (DFT) calculations with Gaussian09 (C.01) software (B3LYP/6-31G (d,p)) [19]. The DFT calculations were performed to study the electronic structure of the molecules based on molecular orbitals (MO). The vibrational frequency calculations were established and verified to ensure that only positive eigen values were acquired. Hirshfeld surface analysis with 2D fingerprint plot (FP) and the interaction energies (CE-B3LYP/6–31 G (d,p)) was obtained with CrystalExplorer17.5 [20].

3. Results

3.1. Photophysical Properties

The photophysical properties of I, II and III are summarised in Table 1. The UV/Vis absorption spectra of I, II and III exhibit a strong and broad absorption band at λmax = 271–307 nm (Figure 1). This electronic excitation is typical for benzothiazole derivatives and corresponds to the involvement of both π→π* and n→π* transitions [21,22]. It was observed that the relative positioning of the NO2 group (o, m or p) induces a change in the optical properties. The absorption bands were progressively red-shifted in the following order, I (271 nm) < II (303 nm) < III (307 nm). Based on DFT calculations, the highest occupied molecular orbital (HOMO) of these compounds is essentially localised on the benzothiazole moiety; while, the lowest unoccupied molecular orbital (LUMO) is significantly projected towards the benzoyl fragment for III compared to that of II and I. In I, the benzoyl moiety is substantially twisted as a result of the proximity of NO2 and the carbonyl groups, causing the two groups to repel each other [23]. Therefore, the population of electrons towards the benzoyl moiety is hampered and thus, requires a relatively higher energy (λmax = 271) to initiate the corresponding electronic transition.
Interestingly, the emission spectra of these compounds demonstrated a reversed trend with respect to the absorption spectra (λmax) in the following manner: I (380 nm) > II (367 nm) > III (342 nm). However, it should be noted that compound III exhibits a broader emission band compared to that of the formers albeit with much lower intensity, which extends bathochromically further than that of its congeners. The emission feature suggested that the HOMO/LUMO might be tuned differently by the p-NO2 substituent. Compound I possessed the highest quantum yield, Φ = 0.56 compared to II (Φ = 0.21) and III (Φ = 0.07). The increased steric hindrance caused by the o-substituted NO2 has sufficiently impeded the free-rotation of the pendant benzene ring, thereby, favouring radiative and circumventing the non-radiative relaxation [24].

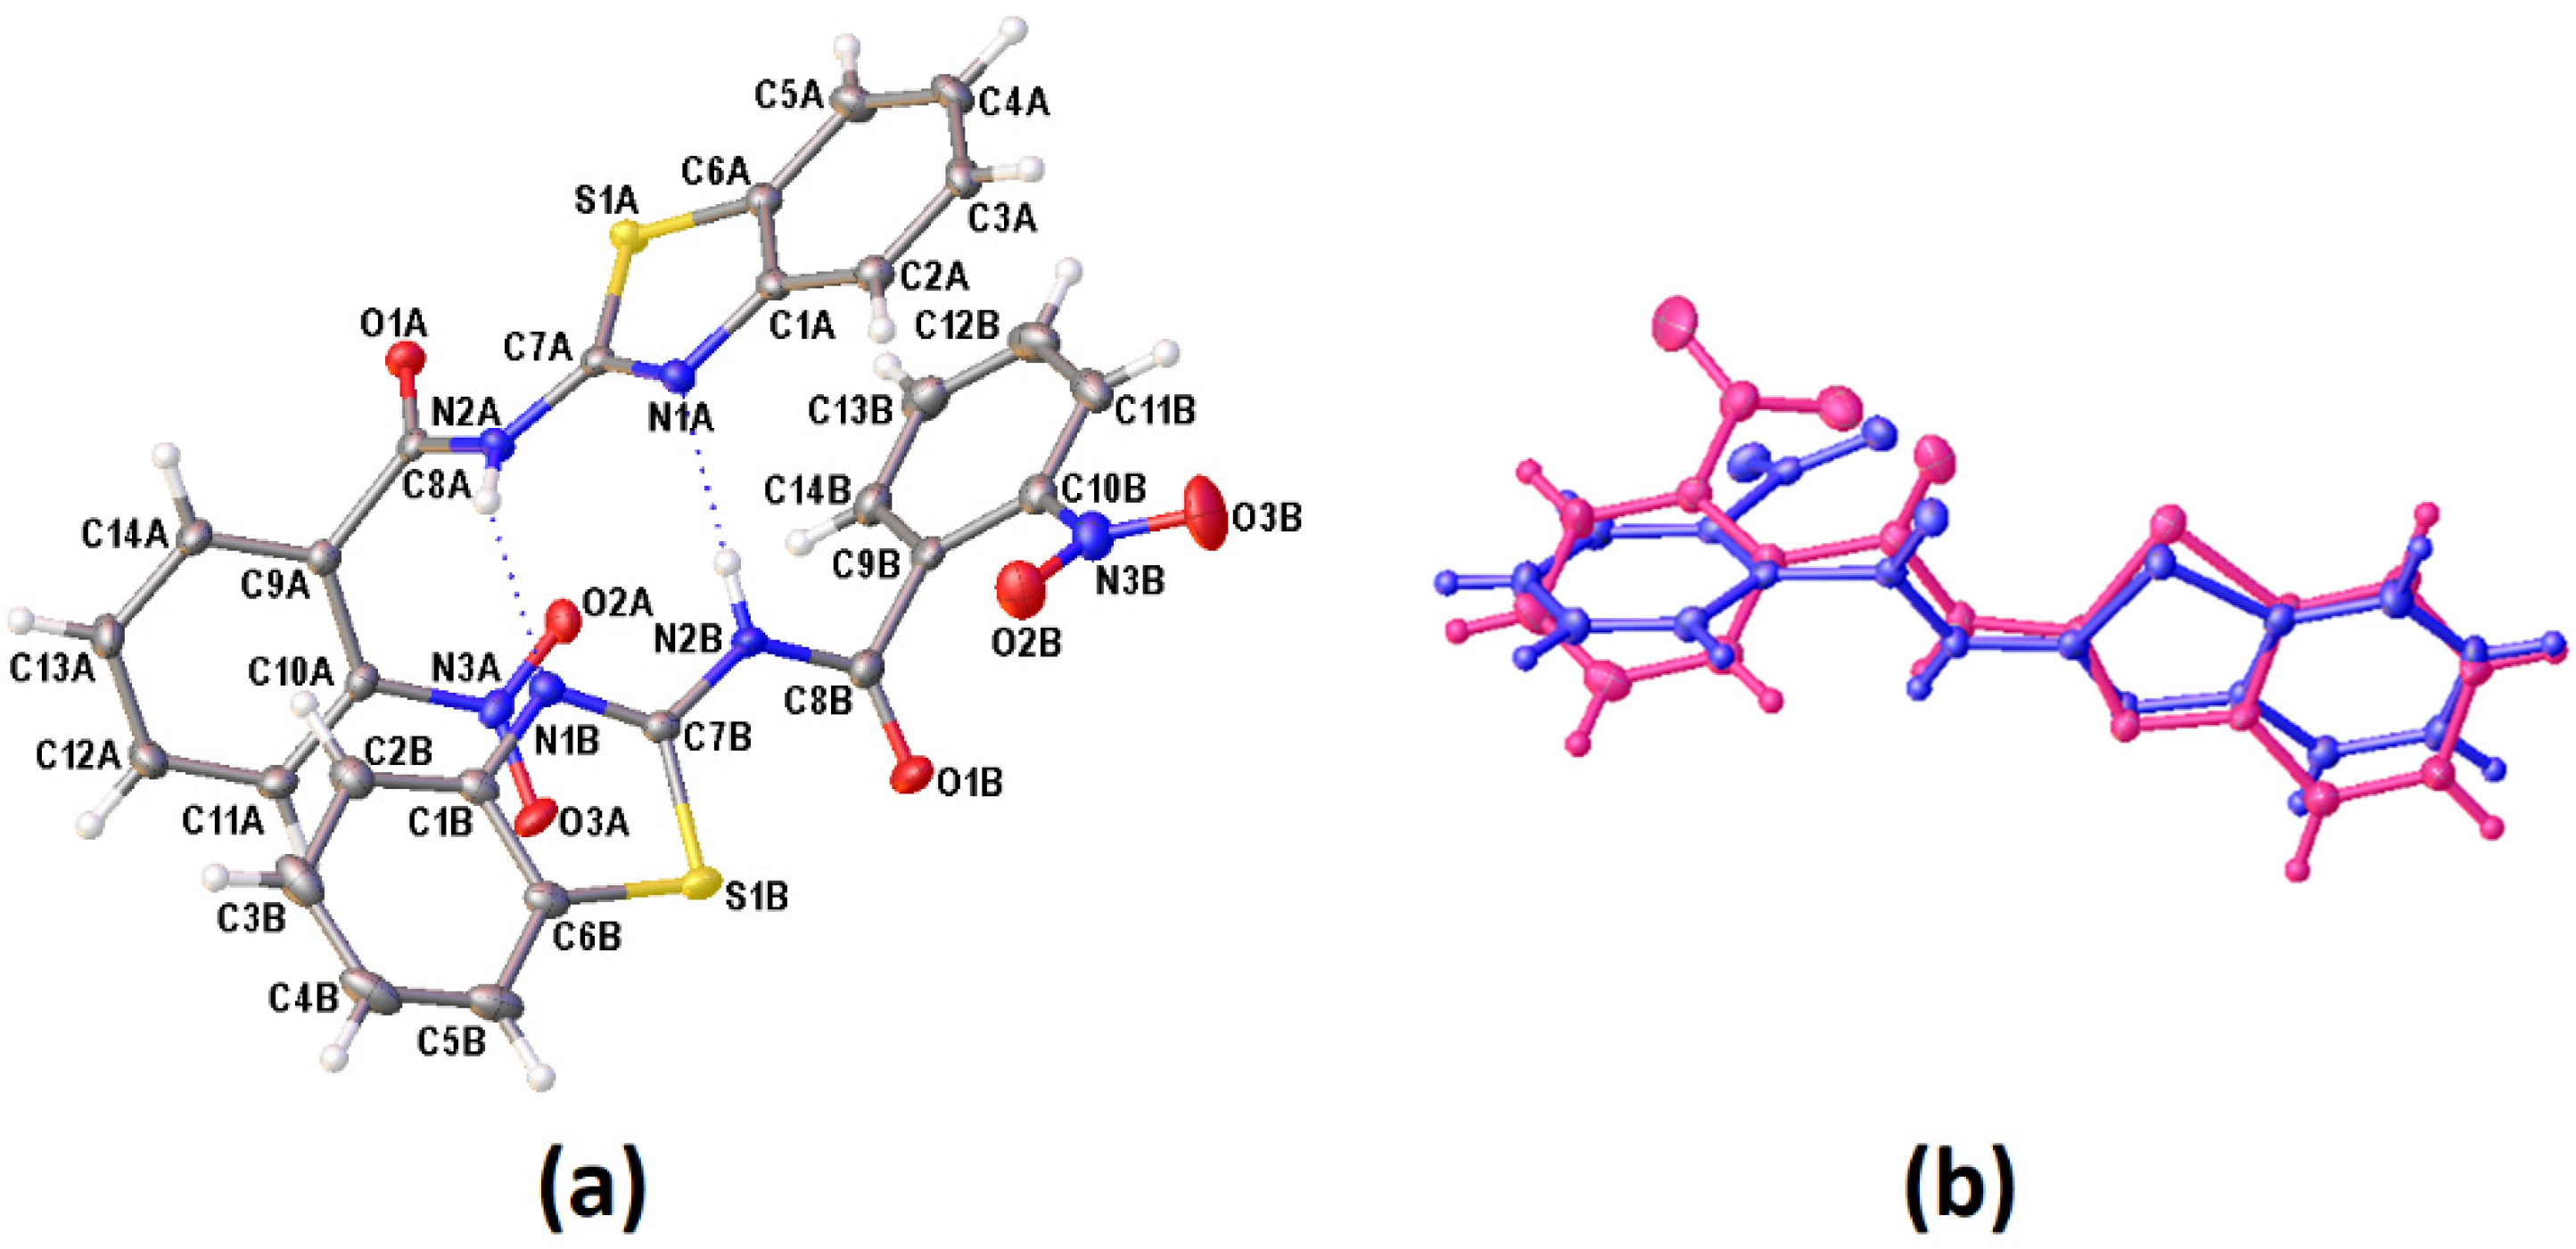
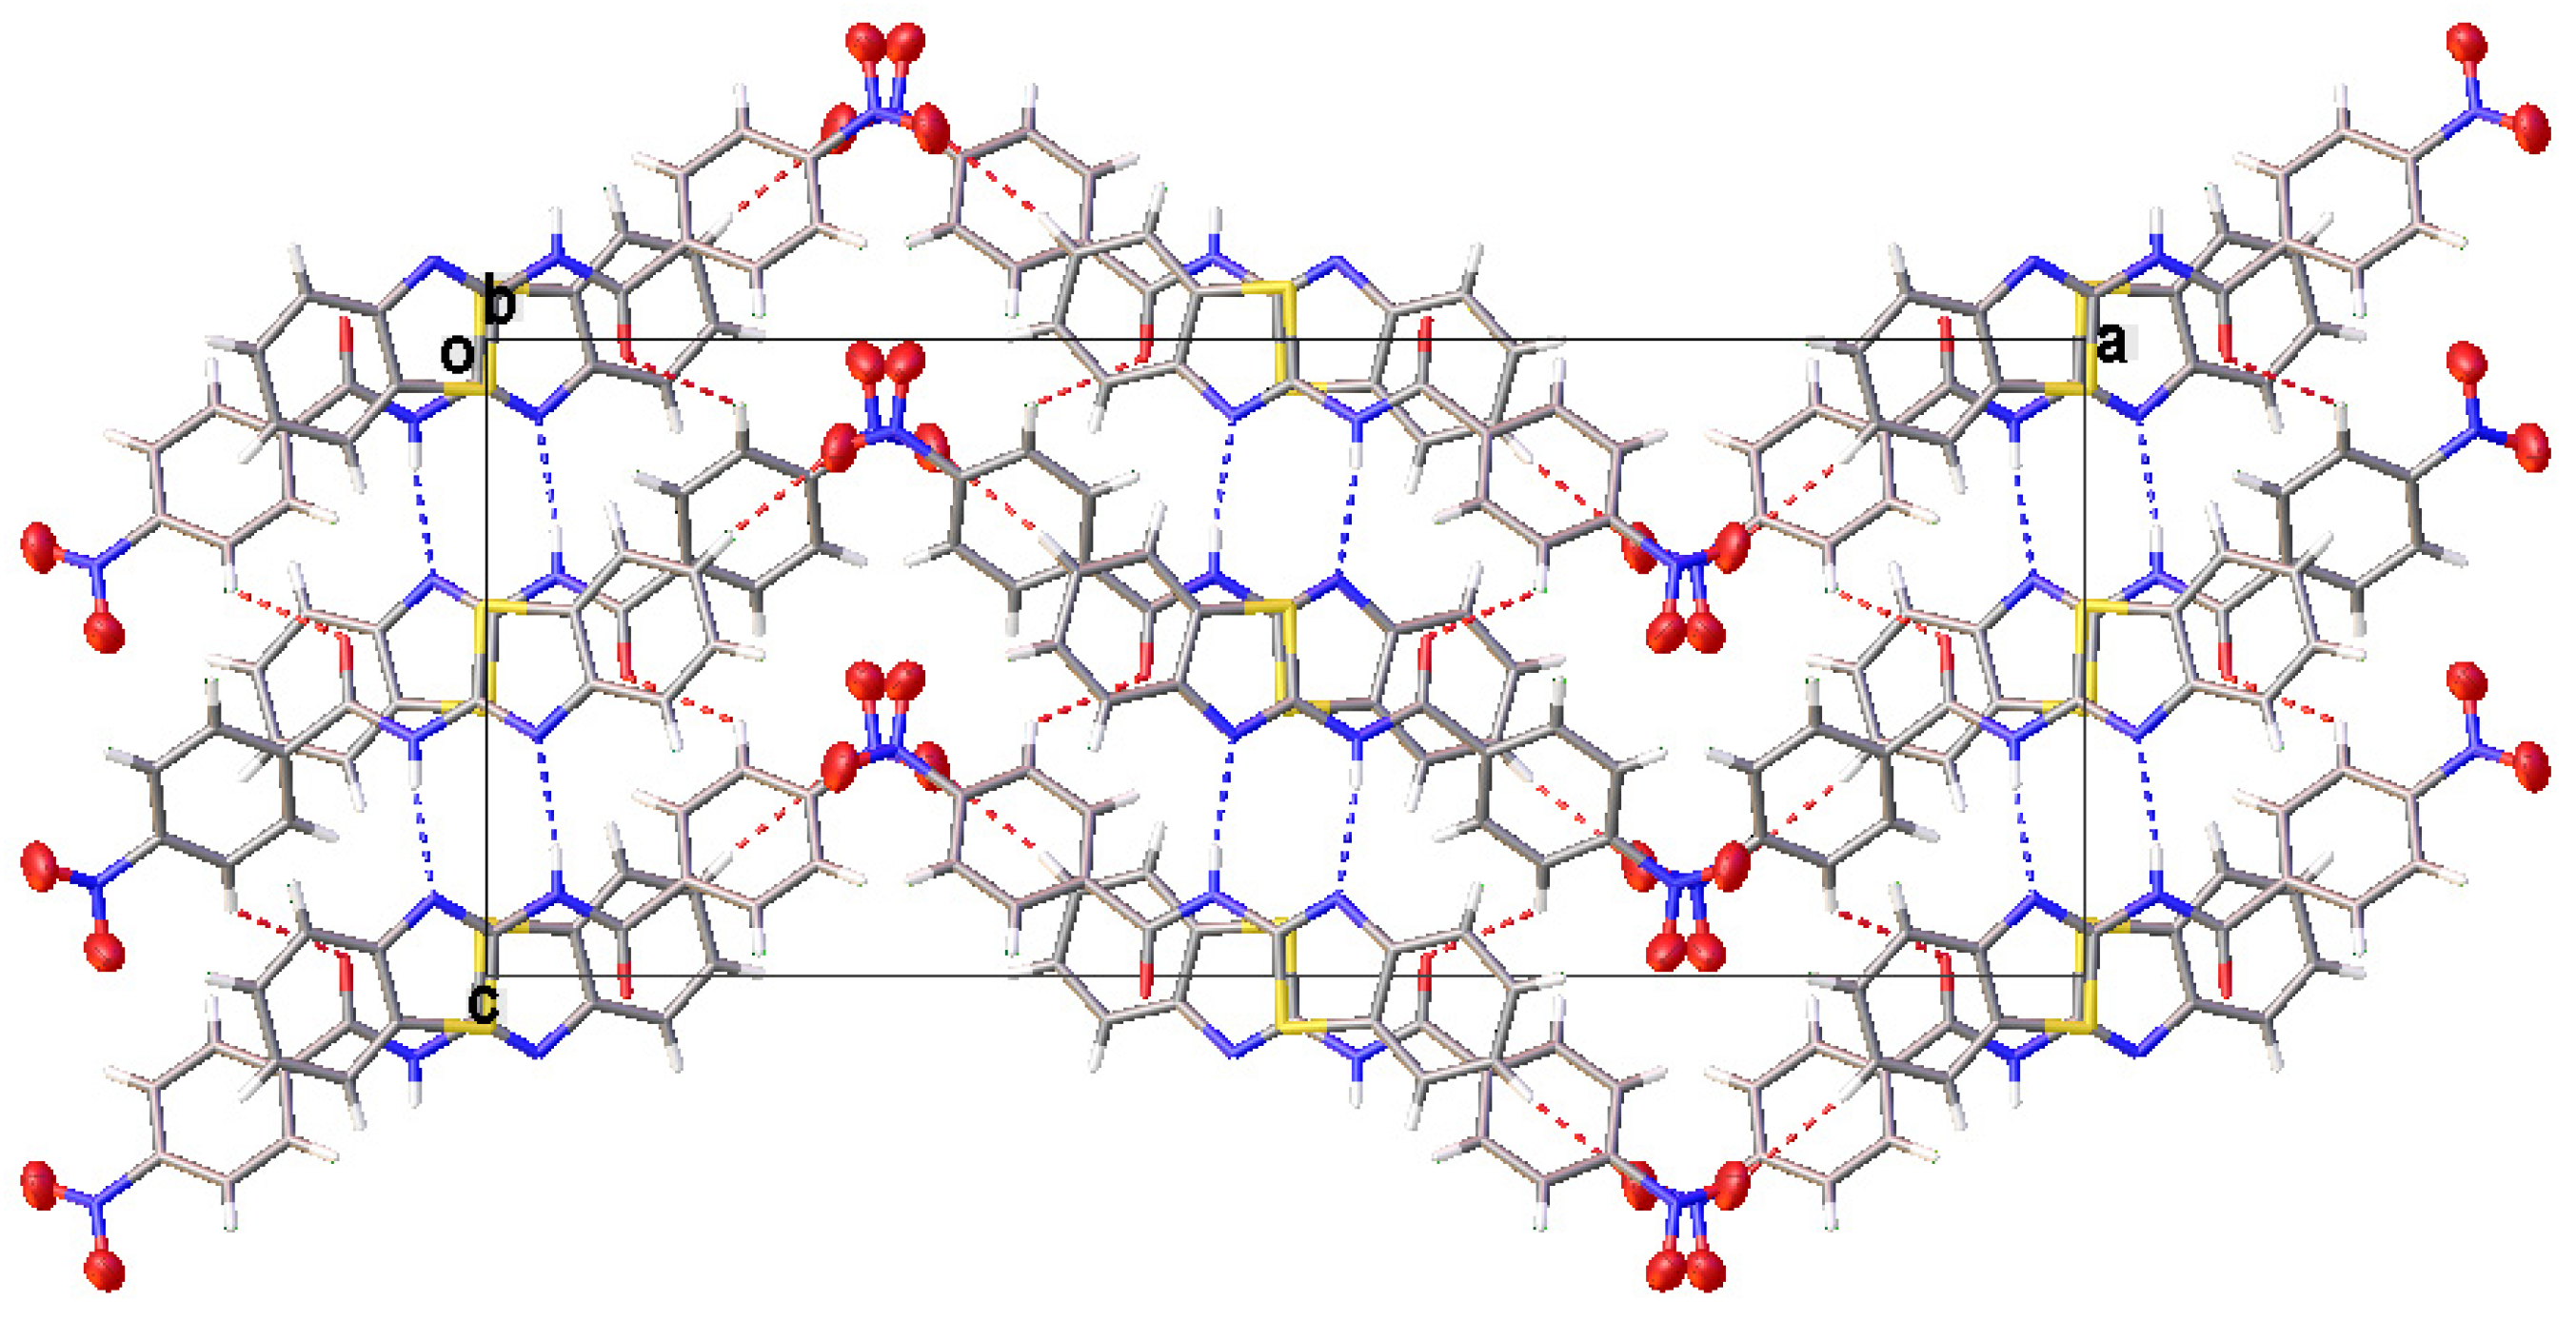
3.2. Crystal Structural Descriptions

The crystallographic details for these three new compounds are given in Table 2. Single crystals of I and III were obtained from the slow evaporation of acetonitrile while II was crystallised from a mixture of chloroform and n-hexane solutions. The molecular structure of I, II and III are shown in Figure 2a and Figure 3a,b, respectively. Figure 2 exhibits two crystallographic independent molecules of compound I (IA and IB) in the asymmetric unit. The image of the two molecules, viz. inverted molecule IB (fuchsia) on molecule IA (blue) with a root mean square (RMS) deviation of 0.798 Å, is shown in Figure 2b. The p-NO2 group of the benzoyl moiety was disordered in two sets of atomic sites with 0.54(4) and 0.46(4) occupancies. Interestingly, these three compounds crystallised in different crystal systems or space groups, albeit having the same molecular formula. However, these compounds are subjected to positional isomerism with regards to the NO2 group. I and II crystallised in the same crystal system (monoclinic) but with different space groups, namely, I (P21/n) and II (C2/c), respectively. III crystallised in the orthorhombic crystal system (Pbcn). The bond lengths and angle of these series of compounds are similar to benzothiazole derivatives reported previously [16].
The CCDC number for I, II and III are 1991706, 1991705 and 1991707, respectively.
All compounds displayed N−H···N and C−H···O intermolecular hydrogen bonds (Table 3). The two independent molecules (IA and IB) in the asymmetric unit of I formed a dimer through N−H···N intermolecular hydrogen bonds. Congruently, II and III also displayed a complementary pair of molecules involving N−H···N intermolecular hydrogen bonds, albeit juxtaposed with a centre of inversion. The intermolecular connection established by the centrosymmetric dimer of II and III constitute a R 2 2 (8) loop [25]. The supramolecular structure of I (Figure 4) was constructed through three C−H···O intermolecular hydrogen bonds, namely C(4A)−H(4A)···O(3A), C(5A)−H(5A)···O(2B) and C(13A)−H(13A)···O(3A). The centrosymmetric dimer of II propagates in two directions via C(13)−H(13)···O(1) along the c-axis, C(4)−H(4)···O(3) and C(12)−H(12)···O(2) intermolecular hydrogen bonds along the a-axis, giving rise to a column along the b-axis (Figure 5). Compound III showed centrosymmetric dimers propagating along the c-axis through the C(13)−H(13)···O(1) intermolecular hydrogen bond (Figure 6). This one-dimensional chain was then extended via the C(4)−H(4)···O(2A) intermolecular hydrogen bond, giving rise to a herringbone packing pattern. In addition, the NO2 substituent was arranged in an anti-parallel arrangement. Furthermore, the packing of these crystals was also stabilised by other weak interactions, as discussed in detail below.
The benzene and thiazole rings of the compounds in this series are essentially coplanar [0.08(6)–3.74(6)°]. The dihedral angle between the benzothiazole and phenyl (benzoyl moiety) rings are 67.88(5)° [59.60(5)° for molecule IB], 17.16(5)° and 38.27(5)° for I, II and III, respectively. Compound I displayed a distorted geometry due to the substitution in the o-position on the phenyl ring, which was sufficient to exert a steric hindrance on the benzamide moiety [24]. Compound II was observed to be the most planar as the amide group (NHCO), benzene ring of the benzoyl moiety, and also the two oxygen atoms of the substituent group were involved in the intermolecular hydrogen bonds. This phenomenon restricts the rotation of the benzene ring, giving rise to a planar geometry similar to previously reported compounds [26]. Similarly, the O1 atom of III also participates in the intermolecular hydrogen bonding, however, the benzene ring of the benzoyl moiety of III has fewer intermolecular hydrogen interactions than that of II and thus, the benzene ring was more susceptible to a distortion.
By taking into account the maximum centroid–centroid distances (Cg-Cg) of 3.8 Å as a criterion for π–π interactions [27], compound II and III were found to display very weak stacking interactions (>3.8 Å). However, I which consists of IA and IB in the asymmetric unit displayed four π–π interactions (<3.8 Å). Cg(1) [centroid of the thiazole ring, S(1A)/C(6A)/C(1A)/N(1A)/C(7A)] and Cg(2) [centroid of the benzene ring, C(1A)-C(6A)] planes of molecule IA interacts with Cg(7) [centroid of the benzene ring, C(9B)-C(14B)] of molecule IB from the same asymmetric unit; whereas, Cg(5) [centroid of the thiazole ring, S(1B)/C(6B)/C(1B)/N(1B)/C(7B)] and Cg(6) [centroid of the benzene ring, C(1B)-C(6B)] planes interact with Cg(6) and Cg(5) planes, respectively, in the vicinity of IB molecule (Table 4). As per earlier discussion, at first sight, the dimer synthon formed by IA and IB seemed to be constructed primarily through the interaction of N−H···N hydrogen bonds. However, the strong overlay of π–π interactions displayed between IA and IB may suggest otherwise. Therefore, it is interesting to see how the π–π connections fare with the N−H···N hydrogen bonds in terms of interaction energies (vide infra).

3.3. Hirshfeld Surface Analysis

Hirshfeld surface analysis was conducted to gain insights into the nature of non-covalent interactions involving the molecules. The generated plots for the compounds (Figure 7) depict four prominent features for the intermolecular interactions with the exemption of III. The Hirshfeld surface analysis for III was judiciously interpreted to avoid errors in the elucidation caused by the disordered NO2 group [28]. The distinct deviation for the IA fingerprint plot (Figure 7a) stems from the conspicuously dispersed blue spots, bottom right ‘bat-wing’ on the Hirshfeld surface involving H···N/N···H interconnections (di > de) in contrast to the contracted wing at the top left (di < de). Meanwhile, the IB congener (Figure 7b) depicts a complementary spread-out wing at the top left (di < de), indicating the relevant contact environment is different. This information asserts that the donor-acceptor atoms veered from the favourable head-on interaction which can only stem from a deviated N−H···N (< 180°) interaction and corroborates the contribution of the steric effect imposed by the o-substituted NO2. In general, the H···N/N···H feature renders the closest intermolecular close contact across the four molecules with ca. di + de = 2.0 Å, despite having a mere 5.4–9.5% contribution (Figure 8).
One of the largest contributors in the intermolecular contacts originates from the H···O/O···H (25.8–27.7%) due to the availability of three donor oxygen atoms per compound molecule, despite having a relatively distant contact in comparison with the H···N/N···H connections. The blue projections between the H···N/N···H spikes arise from the closest H···H contacts, and it is obvious that II has appreciably closer H···H interconnections than other analogues with a 23.1% contribution. The corresponding features observed in IA and III are bifurcated, revealing that the H···H contacts are presumably not based on a one-on-one arrangement [29]. Compound IB displays a more subtle H···H plot with scarcely diffused blue points surrounding a centre spike. The loosely distributed points observed at a larger surface area reflects a less crowded environment in terms of H···H contacts. The blue patches centred at di = de ≈ 1.8−2.0 Å manifest a typical interlayer space for aromatic rings [30]. The blue plots of II and III exhibit distinct shapes as compared to a ‘blob’ generated for I. This implies that the arrangement of the π–π assembly is more orderly aligned with the supramolecular framework that was attributed to the relatively planar geometry of the molecule compared to the latter.

3.4. Interaction Energies

The solid-state structures of I and II, are further compared and discussed since they exhibit distinctive planarity features. The calculated pairwise total interaction energy can typically be dissected into four energy terms viz. electrostatic, polarization, dispersion and exchange-repulsion. The calculated interaction energies involving the dimer synthon and a cluster of molecules were listed in Table 5. The highest projected interaction energy among the compounds arise from the complementary molecular couples connected via a pair of N−H···N hydrogen bonds. Surprisingly, the interaction of the corresponding pair of molecules for I (Etotal = −97.9 kJ·mol−1) is more robust as opposed to the twin molecules of II (Etotal = −88.9 kJ·mol−1). However, the mean planes of the interacting domains, H2AA/N2A/C7A/N1A and H2BB/N2B/C7B/N1B, of I deviate significantly from each other with a dihedral angle of 63.50(8) °. Meanwhile, the relevant mean planes deviate slightly [34.15(6)°] in the case of II. The interacting molecules of the latter have gained more electrostatic stabilisation (Eele = −97.4 kJ·mol−1) than the former (Eele = −80.6 kJ·mol−1). Nevertheless, the weaker electrostatic attraction found in the case of I was compensated with a higher dispersion energy (Eele = −86.6 kJ·mol−1) through the inherent π–π connections (vide supra). Additionally, the crystal framework of I was boosted with a wider range of interconnections available across the structure than that of II (See Supplementary Materials Figures S1–S3).
Figure 9 provides a graphical description of the interaction energies represented as coloured cylinders bridging the pertinent molecular centroids. Besides, the size (diameter) of the cylinders reflects the magnitude of interaction energy. Based on Figure 9a, the electrostatic component represented as cylindrical red capsules dominate exclusively between the dimer molecules. The molecular synthon gains further traction in the molecular array in two directions. Firstly, by virtue of relative strength in terms of total energy, the synthon conjoined to its vicinal synthon across the c-axis mainly through dispersion forces (Edis = −42.1 kJ·mol−1) (Figure 9b), represented by the longer green cylinders connecting the two shorter green capsules with Etotal = −44.2 kJ·mol−1 (Figure 9c), involving IA molecules. Meanwhile, on the opposite end, the synthon also interacts (Edis = −56.8 kJ·mol−1; Etotal = −33.6 kJ·mol−1) with the neighbouring synthon which involves the IB molecules (Figure 9e,f). Secondly, the same synthon reaches out to its nearest synthon (Edis = −44.7 kJ·mol−1; Etotal = −41.5 kJ·mol−1) along the a-axis and conjured the propagation of molecular stacking discernible as a column in a similar direction, which can be viewed appreciably from the slightly tilted-view of Figure 9c,f.
The centrosymmetric dimer of II is bonded with a total energy of −88.9 kJ·mol−1, observable across the (010) plane as isolated red capsules. The synthon then connects to its neighbouring synthons on each side of its essentially planar surfaces to form a column that traverses along the (010) plane. The energy involved on each side of the contacting surfaces are different as the following, Etotal = −49.3 kJ·mol−1 and −37.5 kJ·mol−1. These prominent interacting features could have been involved in the initial stages of molecular assembly and dictated the molecular arrangement in the supramolecular scaffold (Figure 9f) [31]. The total interaction energy measured for compound II (ΣEtotal = −313.6 kJ·mol−1) is proportionally higher than the associated average energy value for IA and IB, −307.7 kJ·mol−1. Fundamentally, the Hirshfeld surface of II exhibited a higher anisotropic quality mirrored by a greater asphericity attribute (Ω = 0.431 a.u.) compared to IA (Ω = 0.334 a.u.) and IB (Ω = 0.337 a.u.). Moreover, compound II possesses a concomitant surface area (312.42 Å2) property that is relatively larger in comparison to its analogues I [IA (303.41 Å2) and IB (303.2 Å2)]. Consequently, these implicit characteristics associated with the former compound provide a conducive platform for a repertoire of non-covalent interactions to occur. Thus, they can be directionally packed more closely, bolstering stronger intermolecular contacts.

4. Conclusions

We have successfully synthesised a series of N-(benzo[d]thiazol-2-yl)-o/m/p-nitrobenzamide and inspected their solid-state structural properties. The presence of the NO2 group has played a pivotal role in determining the crystal packing and to some extent their electronic properties. The NO2 group (o, m or p) influenced the absorption bands and were progressively red-shifted in the following order, I < II < III. The packing of I, with the intrinsic steric hindrance was mediated by weaker non-covalent interactions, as opposed to the much more selective crystal packing motifs for II. N−H···N interaction involved significantly in the interconnections of the molecules in this series, but π–π interactions engaged more in I compared to II and III. The Hirshfeld surface of II exhibited a higher anisotropic quality compared to I. Overall, the study has demonstrated that the position of the substituents played an important role in the structural and electronic properties of the compounds.

Supplementary Materials

The following are available online at https://www.mdpi.com/2073-4352/10/5/348/s1, Figure S1: Interaction energies for a 3.8 Å cluster around IA, Figure S2: Interaction energies for a 3.8 Å cluster around IB, Figure S3: Interaction energies for a 3.8 Å cluster around II.

Author Contributions

Conceptualization, M.B.K.; methodology, Y.Y.C. and W.F.M.-L.; software, Y.Y.C., W.F.M.-L. and M.B.K.; validation, Y.Y.C., W.F.M.-L and M.B.K.; formal analysis, A.B.A.L. and Y.Y.C.; investigation, A.B.A.L. and Y.Y.C.; resources, W.F.M.-L. and M.B.K.; data curation, W.F.M.-L. and M.B.K.; writing—original draft preparation, A.B.A.L., Y.Y.C. and W.F.M.-L.; writing—review and editing, M.B.K.; visualization, Y.Y.C, W.F.M.-L. and M.B.K.; supervision, M.B.K.; project administration, M.B.K.; funding acquisition, W.F.M.-L. and M.B.K. All authors have read and agreed to the published version of the manuscript.

Funding

This research was funded by Ministry of Higher Education (MOHE) and Universiti Kebangsaan Malaysia (UKM) with FRGS/1/2018/STG01/UKM/01/3 and MI-2018-012 research grants, respectively.

Acknowledgments

The authors would like to thank the Ministry of Higher Education (MOHE) and Universiti Kebangsaan Malaysia (UKM) for FRGS/1/2018/STG01/UKM/01/3 and MI-2018-012 research grants, respectively. We are grateful to the Department of Chemical Sciences, Faculty of Science and Technology (UKM) for facilities.

Conflicts of Interest

The authors declare no conflict of interest and the funders had no role in the design of the study; in the collection, analyses, or interpretation of data; in the writing of the manuscript, or in the decision to publish the results.

References

  1. Dadmal, T.L.; Katre, S.D.; Mandewale, M.C.; Kumbhare, R.M. Contemporary Progress in the Synthesis and Reactions of 2-Aminobenzothiazole: A review. New J. Chem. 2018, 42, 776–797. [Google Scholar] [CrossRef]
  2. Malik, S.; Jain, B.; Mirza, A.S.; Singh, A. Review Study on Metal Complexes Synthesized from Therapeutically Important Schiff. Pharm. Chem. J. 2016, 3, 119–124. [Google Scholar]
  3. Cuevas-Hernández, R.I.; Padilla-Martínez, I.I.; Martínez-Cerón, S.; Vásquez-Moctezuma, I.; Trujillo-Ferrara, J.G. Helical Arrangement of 2-(4-Hydroxy-3-Methoxyphenyl)-Benzothiazole in Crystal Formation and Biological Evaluation on HeLa Cells. Crystals 2017, 7, 171. [Google Scholar] [CrossRef] [Green Version]
  4. Shiran, J.A.; Yahyazadeh, A.; Yamin, B.M.; Mamaghani, M.; Kiyani, H. Three-component synthesis of new substituted bis[2-imino-3-(substituted)-4-phenyl-3H-thiazole] derivatives and evaluation of their antibacterial activity. Heterocycles 2015, 91, 123–133. [Google Scholar] [CrossRef]
  5. Sarau Devi, A.; Aswathy, V.V.; Sheena Mary, Y.; Yohannan Panicker, C.; Armaković, S.; Armaković, S.J.; Ravindran, R.; Van Alsenoy, C. Synthesis, XRD Single Crystal Structure Analysis, Vibrational Spectral Analysis, Molecular Dynamics and Molecular Docking Studies of 2-(3-Methoxy-4-Hydroxyphenyl)Benzothiazole. J. Mol. Struct. 2017, 1148, 282–292. [Google Scholar] [CrossRef]
  6. Swetha, T.; Akhtaruzzaman, M.; Chowdhury, T.H.; Amin, N.; Islam, A.; Noda, T.; Upadhyaya, H.M. Benzodithiazole-Based Hole-Transporting Material for Efficient Perovskite Solar Cells. Asian J. Org. Chem. 2018, 7, 2497–2503. [Google Scholar] [CrossRef]
  7. Gautam, P.; Maragani, R.; Misra, R. Tuning the HOMO-LUMO Gap of Donor-substituted Benzothiazoles. Tetrahedron Lett. 2014, 55, 6827–6830. [Google Scholar] [CrossRef]
  8. Gudasi, K.B.; Patil, S.A.; Vadavi, R.S.; Shenoy, R.V.; Patil, M.S. Synthesis and Spectral Studies of Cu(II), Ni(II), Co(II), Mn(II), Zn(II) and Cd(II) Complexes of a New Macroacyclic ligand N,N′-Bis(2-Benzothiazolyl)-2,6-Pyridinedicarboxamide. J. Serb. Chem. Soc. 2006, 71, 529–542. [Google Scholar] [CrossRef]
  9. Luo, C.; Chen, H.; Cao, K.; Wang, W.; Gao, J.; Jia, J. Diode Effect Caused by Sequence of Benzothiazole on Optical Properties. Tetrahedron 2017, 73, 3066–3073. [Google Scholar] [CrossRef]
  10. Rittmeyer, S.P.; Groß, A. Structural and Electronic Properties of Oligo- and Polythiophenes Modified by Substituents. Beilstein J. Nanotechnol. 2012, 3, 909–919. [Google Scholar] [CrossRef] [Green Version]
  11. Diana, R.; Caruso, U.; Tuzi, A.; Panunzi, B. A Highly Water-Soluble Fluorescent and Colorimetric pH Probe. Crystals 2020, 10, 83. [Google Scholar] [CrossRef] [Green Version]
  12. Zainal, W.; Hafizi, M.; Mark-Lee, W.F.; Tahir, S.M.; Ahmad, I.B.; Kassim, M.B. Experimental and DFT investigation on the influence of electron donor/acceptor on the hydrogen bonding interactions of 1-(1,3-benzothiazol-2-y1)-3-(R-benzoylthiourea). Sains Malaysiana 2018, 47, 923–929. [Google Scholar] [CrossRef]
  13. Minasyan, Y.V.; Degtyarenko, A.I.; Kosmacheva, K.D.; Plekhovich, S.D.; Zelentsov, S.V. Effect of Acceptor and Donor Substituents in The ortho, meta, and para Positions in the Nitrobenzene Molecule on the Reaction of Interaction with Ethylene. Proceedings 2018, 9, 5770. [Google Scholar] [CrossRef] [Green Version]
  14. Usha, H.; Ravindra, H.J. Effect of Position of Electron Acceptor Group Substitution on NLO Properties of Chalcones Derivatives: A DFT study. Int. J. Sci. Eng. Res. 2018, 9, 2–5. [Google Scholar]
  15. Fragoso-Medina, A.J.; Escobedo-González, R.G.; Nicolás-Vázquez, M.I.; Arroyo-Razo, G.A.; Noguez-Córdova, M.O.; Miranda-Ruvalcaba, R. A DFT Study of the Geometrical, Spectroscopical and Reactivity Properties of Diindolylmethane-Phenylboronic Acid Hybrids. Molecules 2017, 22, 1744. [Google Scholar] [CrossRef] [PubMed] [Green Version]
  16. Ćaleta, I.; Cinčić, D.; Karminski-Zamola, G.; Kaitner, B. The Synthesis and Structure of Two Novel N-(Benzothiazol-2-yl)Benzamides. J. Chem. Crystallogr. 2008, 38, 775–780. [Google Scholar] [CrossRef]
  17. Sheldrick, G.M. Crystal structure refinement with SHELXL. Acta Crystallogr. C 2015, 71, 3–8. [Google Scholar] [CrossRef]
  18. Dolomanov, O.V.; Bourhis, L.J.; Gildea, R.J.; Howard, J.A.K.; Puschmann, H. OLEX2: A Complete Structure Solution, Refinement and Analysis Program. J. Appl. Crystallogr. 2009, 42, 339–341. [Google Scholar] [CrossRef]
  19. Frisch, M.J.; Trucks, G.W.; Schlegel, H.B.; Scuseria, G.E.; Robb, M.A.; Cheeseman, J.R.; Scalmani, G.; Barone, V.; Petersson, G.A.; Nakatsuji, H.; et al. GAUSSIAN09; Gaussian Inc.: Wallingford, CT, USA, 2009. [Google Scholar]
  20. Turner, M.J.; McKinnon, J.J.; Wolff, S.K.; Grimwood, D.J.; Spackman, P.R.; Jayatilaka, D.; Spackman, M.A. Crystal Explorer17.5; The University of Western Australia: Perth, Australia, 2017. [Google Scholar]
  21. Liu, D.; Yao, R.; Dong, R.; Jia, F.; Fu, M. A Strategy to Increase Phosphorescent Efficiency without Perturbing Emission Color for Benzothiazole-Containing Iridium Phosphors. Dye. Pigment 2017, 145, 528–537. [Google Scholar] [CrossRef]
  22. Alias, M.F.; Jaafer, F.S.; Sadiq, A.S. Synthesis Mixed Ligands Complexes of Some Light Metals by Microwave Assisted Using 2-Acetamide Benzothiazole and 1,10-Phenanthrolin. Int J. Pharm 2015, 5, 451–458. [Google Scholar]
  23. Mark-Lee, W.F.; Md Nasir, M.F.; Kassim, M.B. Structural and optical properties investigation on H-bonded 1D helical self-assembly of 1,1-dibenzyl-3-(2-bromobenzoyl)thiourea molecules for nonlinear optical application. Sains Malaysiana 2018, 47, 741–747. [Google Scholar] [CrossRef]
  24. Roacho, R.I.; Metta-magaña, A.J.; Peña-cabrera, E.; Pannell, K.H. Synthesis, Structural Characterization, and Spectroscopic Properties of the ortho, meta, and para isomers of 8-(HOCH2-C6H4)-BODIPY and 8-(MeOC6H4)-BODIPY. J. Phys. Org. Chem. 2013, 26, 345–351. [Google Scholar] [CrossRef]
  25. Bernstein, J.; Davis, R.E.; Shimoni, L.; Chang, N.-L. Patterns in Hydrogen Bonding: Functionality and Graph Set Analysis in Crystals. Angew. Chem. Int. Ed. Engl. 1995, 34, 1555–1573. [Google Scholar] [CrossRef]
  26. Mark-Lee, W.F.; Chong, Y.Y.; Kassim, M.B. Supramolecular Structures of Rhenium(I) Complexes Mediated by Ligand Planarity via The Interplay of Substituents. Acta Cryst. C 2018, 74, 997–1006. [Google Scholar] [CrossRef]
  27. Janiak, C. A Critical Account on π-π Stacking in Metal Complexes with Aromatic Nitrogen-Containing Ligands. J. Chem. Soc. Dalton Trans. 2000, 21, 3885–3896. [Google Scholar] [CrossRef]
  28. Tan, S.L.; Jotani, M.M.; Tiekink, E.R.T. Utilizing Hirshfeld Surface Calculations, Non-Covalent Interaction (NCI) Plots and the Calculation of Interaction Energies in the Analysis of Molecular Packing. Acta Cryst. E 2019, 75, 308–318. [Google Scholar] [CrossRef] [Green Version]
  29. Spackman, M.A.; McKinnon, J.J. Fingerprinting Intermolecular Interactions in Molecular Crystals. CrystEngComm 2002, 4, 378–392. [Google Scholar] [CrossRef]
  30. Spackman, M.A.; Jayatilaka, D. Hirshfeld Surface Analysis. CrystEngComm 2009, 11, 19–32. [Google Scholar] [CrossRef]
  31. Turner, M.J.; Thomas, S.P.; Shi, M.W.; Jayatilaka, D.; Spackman, M.A. Energy Frameworks: Insights into Interaction Anisotropy and the Mechanical Properties of Molecular Crystals. Chem. Commun. 2015, 51, 3735–3738. [Google Scholar] [CrossRef]
Scheme 1. The schematic reaction of 2-aminobenzothiazole with o-, m- and p-nitrobenzoyl chloride to synthesise I, II and III, respectively.
Crystals 10 00348 sch001
Figure 1. The normalized absorbance (solid lines) and emission spectra (dashed lines) of I, II and III in acetonitrile.
Crystals 10 00348 g001
Figure 2. (a) The molecular structure of (I), showing the atom labelling and displacement ellipsoids drawn at the 50% probability level. (b) Overlap of the inverted molecule IB (fuchsia) on molecule IA (blue).
Crystals 10 00348 g002
Figure 3. The molecular structures of (a) II and (b) III (disordered O atoms of the NO2 substituent group were omitted for clarity), showing the atom-numbering schemes. Displacement ellipsoids are drawn at the 50% probability level.
Crystals 10 00348 g003
Figure 4. The partial crystal packing of I, displaying the two-dimensional framework, viewed from the a-axis. The N−H···N and C−H···O intermolecular hydrogen bonds are shown as blue and red dotted lines, respectively.
Crystals 10 00348 g004
Figure 5. The N−H···N (blue dashed lines) and C−H···O (red dashed lines) intermolecular hydrogen bonds generate centrosymmetric dimers which propagate to give rise to a column along the b-axis.
Crystals 10 00348 g005
Figure 6. A partial view of the crystal packing of III depicting a herringbone packing pattern.
Crystals 10 00348 g006
Figure 7. Comparison of 2D fingerprint plots for the compounds (a) IA, (b) IB, (c) II and (d) III (Erroneous H···O/O···H plot (disordered O atoms of NO2) was omitted) with the depicted non-covalent interactions (di and de represent the internal and external distances (Å) away from a point on the Hirshfeld map, respectively).
Crystals 10 00348 g007
Figure 8. Percentage contributions of non-covalent intermolecular connections.
Crystals 10 00348 g008
Figure 9. A comparison of energy framework (2 × 1 × 1 unit cell) comprised of (a) electrostatic (b) dispersion and (c) total energies for IA, (d–f) for IB, viewed from a-axis, and (gi) corresponding diagrams for II (1 × 2 × 1 unit cell) viewed from b-axis. (Tube size scale factor = 80; energy threshold = 30 kJ·mol−1).
Crystals 10 00348 g009
Table 1. Photophysical data of I, II and III.
CompoundAbsorptionEmission
λmax (nm)εa,bλmax (nm)Quantum Yieldc (Φ)
I2712.163800.56
II3031.483670.21
III3070.953420.07
a × 10−4 M−1·cm−1; b 1×10⁻⁵ M; c 2-aminopyridine as reference (Φref = 0.37).
Table 2. Crystal data and structure refinement parameters for I, II and III.
CompoundIIIIII
Formula C14H9N3O3S
Formula weight (g/mol) 299.30
Wavelength 1.54178 Å1.54178 Å1.54178 Å
Temperature (K) 100100298
Crystal system MonoclinicMonoclinicOrthorhombic
Space groupP21/nC2/cPbcn
Unit cell dimensionsa (Å)7.60873(3)29.35796(17)29.0714(5)
b (Å)23.76332(8)7.18924(3)7.8433(2)
c (Å)14.33447(6)12.63074(6)11.6150(2)
β (°)92.2481(4)97.5932(5)-
Volume (Å3)2589.802(17)2642.49(2)2648.40(9)
Z8
Density (calculated) (g cm−3)1.5351.505 g1.501
Absorption coefficient (mm−1)2.3682.3212.316
Crystal size (mm)0.22 × 0.16 × 0.160.13 × 0.13 × 0.080.27 × 0.09 × 0.06
F(000)1232
Refinement methodFull-matrix least-squares on F2
Data/restraints/parameters4620/0/3802355/0/1902373/0/209
Measured reflections605343039816585
θminmax3.603/67.0593.037/67.0673.040/67.047
Rint0.0240.0220.030
Goodness-of-fit on F21.0531.0901.027
Final R indices [I > 2σ(I)]R1 = 0.0265
wR2 = 0.0646
R1 = 0.0277
wR2 = 0.0720
R1 = 0.0316
wR2 = 0.0886
R indices (all data)R1 = 0.0266
wR2 = 0.0646
R1 = 0.0278
wR2 = 0.0721
R1 = 0.0357
wR2 = 0.0930
Largest diff. peak and hole (e/Ǻ3)−0.29 and 0.27−0.36 and 0.18−0.17 and 0.28
Table 3. Hydrogen-bond geometry (Å, º) for I, II and III.
CompoundD−H···AD−HH···AD···AD−H···A
IN(2A)−H(2AA)···N(1B)0.832(13)2.226(11)2.9505(15)145.7(3)
N(2B)−H(2BB)···N(1A)0.833(12)2.138(12)2.9512(15)165.2(6)
C(4A)−H(4A)···O(3A)ia0.954(16)2.541(13)3.2989(17)136.5(3)
C(5A)−H(5A)···O(2B)iia0.958(15)2.479(16)3.3822(18)157.3(7)
C(13A)−H(13A)···O(3A)iiia0.950(14)2.450(13)3.0805(17)123.7(5)
IIN(2)−H(2A)···N(1)iib0.800(16)2.137(15)2.9046(15)160.7(2)
C(4)−H(4)···O(3)ivb0.975(12)2.504(12)3.4614(18)167.4(10)
C(12)−H(12)···O(2)ib0.943(12)2.582(10)3.4288(18)149.7(8)
C(13)−H(13)···O(1)iiib0.933(14)2.513(8)3.1676(16)127.4(5)
IIIN(2)−H(2A)···N(1)iic0.74(2)2.286(19)3.0072(17)165.3(3)
C(4)−H(4)···O(2A)*iiic0.996(16)2.534(18)3.495(9)162.1(7)
C(13)−H(13)···O(1)ic0.956(17)2.536(8)3.172(2)124.1(6)
Symmetry codes: (ia) 3 2 − x, 1 2 + y, 1 2   − z; (iia) 1 2 + x, 1 2 y, − 1 2   + z; (iiia) 1   + x, y, z; (ib) 1 2 x, 1 2 + y, 1 2 z; (iib) − x, y, −   1 2   − z; (iiib) x, 1 y, 1 2   + z; (ivb)   1 2 + x, 1 2 y, 1 2   + z……… (ic) x, 1 y, 1 2 + z; (iic) −x, y, 1 2   − z; (iiic) − 1 2 + x, 1 2 y, 1 z. * The hydrogen bond geometry for the disordered O(2B) atom was omitted for clarity purposes.
Table 4. π–π stacking interactions displayed by I.
CompoundCg–CgSymmetry CodeCg–Cg (Å)Slippage (Å)
ICg(1)–Cg(7)-3.7900(7)1.306
Cg(2)–Cg(7)-3.6808(8)0.938
Cg(5)–Cg(6)1 − x, − y, 1 − z3.4893(7)0.538
Cg(6)–Cg(5)1 − x, − y, 1 − z3.4893(7)0.569
Table 5. Selected interaction energies (kJ·mol−1) for I and II.
CompoundsEelecEpolcEdiscErepcEtotalΣEtotald
IAa−80.6−18.6−86.6123.7−97.9−336.0 (IB = −279.4)
IIb−97.4−26.6−50.7126.1−88.9−313.6
a IA = IB in terms of interaction energies involving the dimer synthon via N(2A)−H(2AA)···N(1B) and N(2B)−H(2BB)···N(1A); b N(2)−H(2A)···N(1B) and N(2)−H(2A)···N(1); symmetry operation: − x, y, − z + 1 2 ; c ele = electrostatic, pol = polarisation, dis = dispersion and rep = exchange-repulsion; d Sum of all individual total interaction energies involved around the reference molecule within a 3.8 Å molecular cluster.

