Abstract
The effect of conventional Perovskite solar cells (PSCs) by using different concentration and spin-coating speeds of titanium dioxide (TiO2) as an electron transport layer (ETL) was studied. The influence of TiO2 based on device structure: fluorine-doped tin oxide substrate/TiO2/Perovskite (CH3NH3PbI3)/2,2′,7,7′-Tetrakis[N,N-di(4-methoxyp phenyl)amino]-9,9′-spirobifluorene/silver, is also studied. The spin-coating speed is varied in a range from 1000 to 3000 rpm to get optimal performance of device. The optimized power conversion efficiency (PCE) of PSCs with original concentration (OC) and double concentration (DC) TiO2 is 8.74 and 9.93%, respectively. The reason is attributed to excellent absorption in shorter wavelength, compact characteristic, and suitable thickness of TiO2, leading to perfect short-circuit current density (Jsc), lower series resistance (Rs), and higher fill factor (FF) of 0.75. Besides, recombination of electron and hole is also decreased due to the compact feature, leading to higher open-circuit voltage (VOC) of 0.91 V.
1. Introduction
People are dedicated to develop and advance photovoltaics because solar source is an emerging renewable energy with progress of technology and energy depletion. The outstanding breakthrough for solar cells is the discovery of perovskite in the Ural Mountains of Russia by Gustav Rose in 1839 and is named after Russian mineralogist Lev Perovski. Perovskite solar cells (PSCs) are a type of solar cells containing a perovskite structured compound and considered as light-harvesting active layer, most commonly a hybrid organic-inorganic lead or tin halide-based material [1,2,3,4,5,6].
In the past few years, lead halide perovskites have gained tremendous attention around the globe because of their excellent photovoltaic characteristics, including high charge carrier mobility [1], large absorption coefficient [2], and tunable optical properties [3]. Organic-inorganic hybrid solar cells based on lead halide perovskites have achieved a phenomenal improvement in power conversion efficiency (PCE) from 3.8% to 24.02% in ten years. The remarkable record of high PCE for perovskite solar cells can be recorded 3.8% published by Miyasaka et al. took organometal halide perovskites as sensitizers in liquid electrolyte-based dye-sensitized solar cells (DSSCs) in 2009 [4]. In 2011, Park et al. realized an efficiency of 6.5% by applying TiO2 surface treatment prior to deposition [7]. In 2012, an all-solid-state lead iodide perovskite sensitized TiO2 mesoscopic heterojunction solar cell with long-term stability had achieved a PCE of 9.7% [8]. In 2013, an outstanding PCE of 15% received from perovskite-sensitized mesoscopic solar cells was prepared using the sequential deposition method [9]. The astonished breakthrough of outstanding PCE is to reach 20.1%, published by Bakr et al. in 2015 [5]. Moreover, it is worth mentioning that there are some research groups devoted to apply perovskite solar cells on flexible substrates to develop wearable devices for illumination, exercise, etc., [10,11]. The DSSCs has been studied by a lot of researchers since Gratzel reported a DSSC device with sandwich-mode architecture in 1991 [12]. The traditional DSSC structure includes a dye-sensitized photoanode, a counter electrode, and an electrolyte [13]. The photoanode includes a TiO2 porous film and a TiO2 compact film [14]. The TiO2 compact layer is conventionally prepared by many methods as following: aerosol spray pyrolysis [15,16,17], thermal oxidation [18], spin-coating method [14], atomic layer deposition [19], and electrochemical deposition [20]. Besides, TiO2 film is a promise candidate to act as an electron transport layer (ETL) in PSCs according to best absorption at short wavelengths [21,22,23].
In this study, we discuss the performance of PSCs with different concentration and various spin-coating speeds of TiO2 to understand the fundamental effect. The TiO2 solution is prepared with original and double concentration, however, grown TiO2 film is also fabricated at 1000, 2000, and 3000 rpm. The properties of TiO2 film and improved PSCs are also researched to further optimize PCE.
2. Materials and Methods
In this paper, all materials were purchased by commercial source and used without further sublimation to accomplish fabrication. All preparation of solution and thin film was continuously achieved in glove box. The cleaning process of substrate was referred and complied with standard operation procedure of previous researches. The work function of fluorine-doped tin oxide-coated glass substrates (FTO-glass, with a sheet resistance of 7 Ω/sq, AimCore Technolog, Hsinchu, Taiwan) was improved by treatment of oxygen (O2) plasma with 10 W for 2 min [24] to reduce carbon contamination and effectively grow subsequent thin film.
2.1. Precursors Preparation
The prescription of TiO2 precursor solution consisted of titanium isopropoxide (369 μL for original concentration; 738 μL for double concentration) diluting in isopropanol (2.53 mL) and HCl solution (35 μL of 2 M) diluting in isopropanol (2.53 mL). Then, HCl solution was dropwise added into TiO2 precursor solution under stirring at 300 rpm for 24 h and filtered with a PTFE filter with 0.2 μm pore size before use. The prescription of perovskite precursor solution consisted of PBI2 (1.25 M, 99.99 %, Alfa Aesar, Haverhill, MA, USA) and CH3NH3I (1.25 M, >98 %, Dyesol, Queanbeyan, Australia) (i.e., PBI2 of 576.25 mg, CH3NH3I of 198.75 mg) in mixing solvent (1 mL, where volume ratio of dimethyl sulfoxide (DMSO) to γ-butyrolactone (GBL) is 1:1) [25]. Perovskite precursor solution was kept stirring at 300 rpm for 24 h and then filtered with PTFE filter of 0.2 μm pore size before use. The spiro-OMeTAD solution was prepared by blending two solution, 4-tert-butylpyridine (tBP) solution (tBP of 28.5 μL with spiro-OMeTAD of 80 mg in chlorobenzene (1 mL)) and lithium-bis(trifluoromethanesulfonyl)imide (Li-TFSI) solution of 17.5 μL (Li-TFSI of 520 mg solved in acetonitrile (1 mL), which is prepared under stirring at 300 rpm for 24 h before dropwise into tBP solution).
2.2. Fabrication of Thin Film and Device
The TiO2 precursor solution was dynamically spin-coated onto FTO substrates at different coating speeds (1000/2000/3000 rpm) for 60 s and heated at 180 °C for 5 min on hotplate in air to grow TiO2 thin film. TiO2 thin film was annealed at 550 °C for 30 min to form compact characteristic. The perovskite layer prepared by mixing solvent was deposited using solvent-engineering technique [25]. Perovskite precursor solution was spin-coated onto TiO2/FTO substrate in two consecutive spin-coating steps at 1000 rpm of 10 s and 5000 rpm of 20 s in order. During second step, toluene was dropping onto the wet spinning film. Perovskite thin film was annealed at 90 °C for 15 min on hotplate before hole transport layer was deposited by spin-coating spiro-OMeTAD solution at 3000 rpm for 30 s. Finally, silver (Ag) metal as anode, which is defined by shadow mask with active area of 6 mm2, was deposited to thicknesses of 100 nm by vacuum thermal evaporation below pressure of 4.8 × 10⁻⁶ torr. The deposition rate was monitored and adjusted by quartz crystal oscillator to ensure film thickness
2.3. Characteristic Measurement
All measurements were carried out in air. The current density-voltage (J-V) characteristics of device were measured with power source meter (Keithley 2400, Keithley, Cleveland, AL, USA) under an illumination of 100 mW/cm2 with an AM 1.5G sun simulator (Oriel 96000 150W Xe lamp, Newport, Taipei, Taiwan). The light intensity was calibrated by reference solar cell and meter (Oriel 91150, Newport, Taipei, Taiwan). The spectrum was taken for −5 V sample bias to separate sample and secondary edge for analyzer. The samples were measured by field-emission scanning electron microscopy (SEM, JEOL JSM-7001, Japan) and X-ray diffraction (XRD, ultima IV, Rigaku Corporation, Tokyo, Japan) to demonstrate cross-section images and crystalline structure, respectively. Devices were further measured by atomic force microscope (AFM, XE-70, Park Systems, Suwon, Korea) to analyze surface morphology with scan rate of 0.5 Hz probing an area of 10 × 10 µm2, with effectively reducing speed at which the tip moves and allowing system more time to adjust to sudden changes in height, and by spectrophotometer (UV-3900, Hitachi, Tokyo, Japan) to analyze the absorption spectrum and transmittance of devices. The external quantum efficiency (EQE, QE-3000, Titan Electro-Optics, Taipei, Taiwan) measurement was performed on irradiation of 150 W xenon light tower in DC mode.
3. Results and Discussion
In this study, both energy band diagram and structure are shown in Figure 1. Conventional structure of PSCs is fabricated as following: FTO/TiO2/perovskite (CH3NH3PbI3)/spiro-OMeTAD/Ag in Figure 1a. The transportation of electron can be clear to understand owing to suitable lowest unoccupied molecular orbital of TiO2 in Figure 1b. Figure 2 shows current density-voltage (J-V) characteristic of devices obtained by TiO2 with original concentration (OC) and double concentration (DC) at various spin-coating speeds (1000, 2000, and 3000 rpm), corresponding to red, blue, and purple line, respectively. We can clearly see red line have a colossal area under intersection of x- and y-coordinate compared to others. Generally speaking, the fill factor (FF) is determined from the intersection of area when J-V curve has been achieved. It is obviously shown that device performance prepared by OC TiO2 is not improved when coating speed is increased by two and three times in Figure 2a. The same situation and results occur in device prepared by DC TiO2 in Figure 2b. The optimized power conversion efficiency (PCE) of device prepared by OC and DC TiO2 is 8.74 and 9.93% with 1000 rpm, respectively. Poor PCE of device prepared by OC and DC TiO2 is only 0.77 and 1.2% with 3000 rpm, respectively. The higher series resistance (Rs) (6290 Ωcm2 and 728 Ωcm2) and lower FF (0.14 and 0.15) are one of the active factors to cause poor performance in Table 1. The Table 1 presents detailed performance of all devices. It can convey information about differences between OC and DC TiO2, and effect on various speed of spin-coating fabrication. As coating speed decreases one times, the PCE of device prepared by OC TiO2 is enhanced from 4.38 to 8.74% because of a great increase in short-circuit current density (JSC) from 7.58 to 19.21 mA/cm2, indicating that the ability of electron transport is enhanced when thickness of TiO2 gradually increases. Similar improvement of PCE is obtained by DC TiO2, from 7.4 to 9.93%.
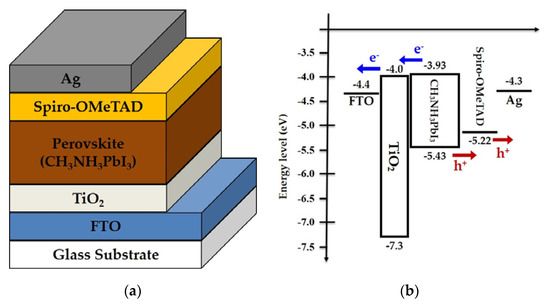
Figure 1.
(a) Schematic structure of device and (b) energy level diagram of device in this study.
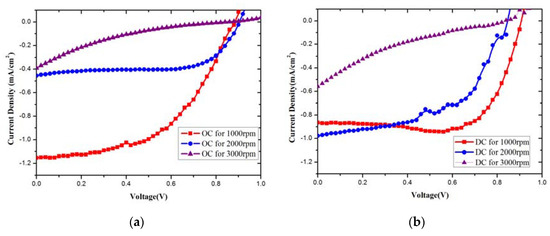
Figure 2.
The current density-voltage (J-V) curves of device with different spin-coating speed of (a) original concentration (OC) TiO2 and (b) double concentration (DC) TiO2.

Table 1.
Photovoltaic performance of perovskite solar cells with different TiO2 concentration and various spin-coating speeds.
However, it is seen that both JSC and Rs are affected in Table 1, indicating a two times increase in TiO2 concentration can cause improvement in PCE. Then, JSC of device is improved from 7.58 to 16.29 mA/cm2 at 2000 rpm and from 6.51 to 9.31 mA/cm2 at 3000 rpm, respectively. It is also shown that all Rs results caused by TiO2 concentration of two times give an individual drop at each speed from 282 to 107 Ωcm2, from 173 to 142 Ωcm2, and from 6290 to 728 Ωcm2, respectively. In order to find the reason why TiO2 influences the performance of PSCs, we decided to measure EQE spectrum and compare the two devices with highest PCE in Figure 3.
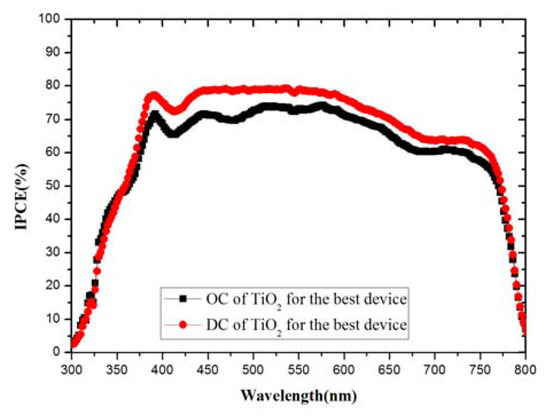
Figure 3.
The external quantum efficiency (EQE) spectrum of best device from 300 to 800 nm. The black curve is device obtained by OC TiO2 and red curve is device obtained by DC TiO2.
EQE spectrum of optimized device is demonstrated in Figure 3. Figure 3 displays which range of wavelength has greatest effect. The black and red curve represent the optimized device of OC and DC TiO2, respectively, reaching a maximum of 74.27% in 576 nm and 79.27% in 234 nm. Two curves have increased significantly from 300 to 390 nm and decreased until 800 nm. From 390 to 610 m, black curve can reach about 71.33% of EQE in average. From 380 to 650 nm, red curve can reach about 76.66% of EQE in average. The difference between current density from EQE data is close to that obtained from J-V curves in Table 1. Therefore, the current density data are reliable to explain why PCE of DC TiO2 device is higher than that of the OC one. Furthermore, we use absorption and transmission spectrum to further describe the relationship between light importance and device performances.
Figure 4 illustrates the UV-vis absorption and transmission spectrum of device prepared by OC and DC TiO2 ETL at various spin-coating speeds in visible range from 300 nm to 800 nm, respectively. All curves can be divided into two parts, in which black (1000 rpm), red (2000 rpm), and blue lines (3000 rpm) represent PSCs obtained by OC TiO2 at different speeds, and green (1000 rpm), pink (2000 rpm), and brown lines (3000 rpm) represent that of DC one. It is obvious that absorption intensity of DC TiO2 parts are higher than that of OC TiO2, leading to better capability to absorb light source and then convert it to PCE. As we know, TiO2 is a wide band gap semiconductor, which has a strong absorption at short wavelengths [23,24]. The order of intensity for all curves with peak position are arranged as following: black (0.724 a.u. in 300 nm), green (0.662 a.u. in 312 nm), red (0.549 a.u. in 300 nm), pink (0.543 a.u. in 312 nm), brown (0.473 a.u. in 312.5 nm), and blue (0.291 a.u. in 300.5 nm). Compared to the average intensity of absorption spectrum, DC TiO2 film is 0.559 a.u., which is higher than 0.521 a.u. of OC TiO2 film. Therefore, more light has been absorbed when PSCs are fabricated by DC TiO2 ETL. Further cross-section images of optimized PSCs obtained by DC TiO2 ETL are indicated by measurement of SEM in Figure 5. The thickness of each layer can be demonstrated and cross-section image of SEM is further measured via rotate and zero angle. The surface roughness (Rq) and morphologies of OC and DC TiO2 film coated on FTO substrate are shown in Figure 6. The difference of Rq is too close (maximum and minimum value is 29.892 and 22.254 nm, respectively) and all values are listed in Table 2. As shown in Figure 6a–d, these surfaces are compact due to island distribution, compared to the result of columnar distribution in Figure 6e,f.
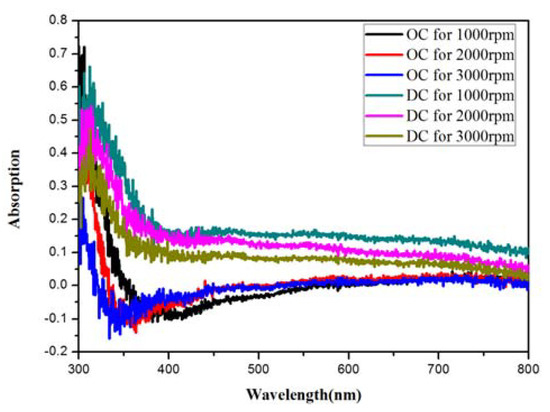
Figure 4.
The UV-vis absorption spectrum of original and double concentration of TiO2 in various spin-coating speeds.
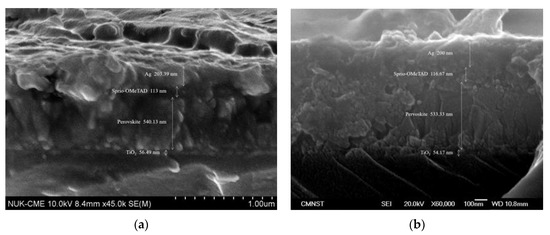
Figure 5.
The cross-section images of SEM with (a) rotate and (b) zero angle for optimized PSCs obtained by DC TiO2 ETL.
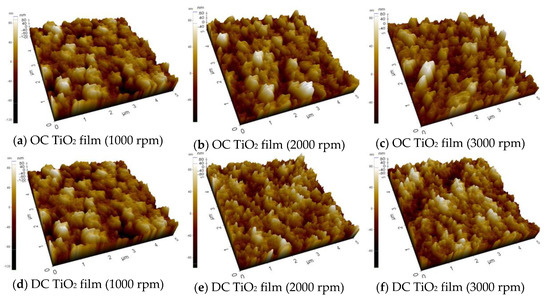
Figure 6.
The surface morphologies of atomic force microscope (AFM) with different spin-coating speeds based on OC TiO2 film from (a) to (c) and DC TiO2 film from (d) to (f).

Table 2.
Surface roughness from AFM measurement for OC and DC TiO2 film.
Figure 7a shows the XRD spectra of OC TiO2 film fabricated on FTO substrate. No extra peak of OC TiO2 film is produced due to basic peaks of FTO substrate, indicating the ability of electron transportation is affected by surface roughness at interface between Perovskite and TiO2. However, although the difference of surface roughness is not huge in Table 2, morphology of DC TiO2 film at 1000 rpm is more compact to others in Figure 6d. The unexpected crystallite growths because a small peak of DC TiO2 film is found at 2 θ = 26°, which represents tetragonal anatase structure (JCPSD card no. 83-2243) in Figure 7b.
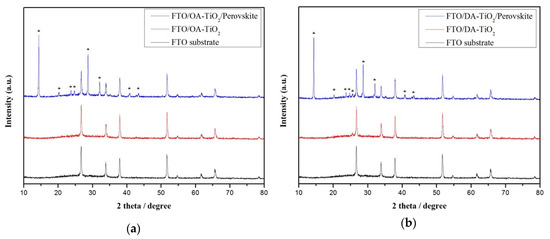
Figure 7.
XRD results of (a) OC TiO2 film and (b) DC TiO2 film fabricated on fluorine-doped tin oxide (FTO) substrate.
We ascribe the growth factor of tetragonal anatase structure to annealing temperature of 90 °C but there is no sufficient evidence to demonstrate [25]. So, the reason for PCE improvement is attributed not only to absorb light contribution of short wavelength from TiO2 film but effective blocking of recombination between electron and hole in TiO2 film, leading to enhancement of open-circuit (VOC) from 0.85 to 0.91 V. When spin-coating speed decreases, the thickness is gradually thinner and the ability of electron transportation is also increased, corresponding to boost JSC and FF in Table 1. Therefore, better PCE of 8.74% and 9.93% are achieved with thinner OC and DC TiO2 at 1000 rpm (average value of 55.33 nm), respectively. In the future, we predict that the thickness and crystalline characteristic of compact layer is the most important factor to affect the performance of PSCs because charge transport would be largely enhanced by suitable TiO2 layer.
4. Conclusions
The PSCs have been fabricated with different concentration (OC and DC TiO2) and with various spin-coating speeds. The effect of TiO2 on electron transportation has been studied via photovoltaic characteristic with AFM and XRD in this study. It is found that the main reason for highest PCE of PSCs obtained by OC and DC TiO2 is attributed to light absorption at a shorter wavelength and more compact surface of TiO2 film, indicating the improvement of JSC and FF, respectively. The contribution can be further shown in absorption spectra and surface roughness. Although there is no enough information to prove why and how extra crystalline of 26° in XRD is grown, it is still another factor for increase in PCE. The recombination of electron and hole also decreases according to compact DC TiO2 film, leading to enhancement of VOC 0.85 to 0.91 V. Therefore, optimized TiO2 film as ETL in PSCs have two features as following: thin and compact. Finally, the slight change in concentration of TiO2 have attained excellent performance of PSCs when we find the suitable parameters and details of improved thin films.
Author Contributions
C.-J.H. contributed to funding acquisition; P.-H.H., C.-W.H., and C.-H.H. proposed research frame and designed experiments; C.-W.H. performed the experiments; P.-H.H., C.-W.H., and C.-H.H. analyzed materials and all authors discussed data; C.-C.K., C.-J.H., and S.-Y.L. contributed to the analysis tools and advised on results of experiment; P.-H.H. wrote the paper; P.-H.H. and C.-W.H. are responsible for submission of manuscript and subsequent procedure. Data curation, C.-W.H., C.-H.H., S.-Y.L. and N.-F.W. All authors have read and approved of published version of manuscript.
Funding
This work is sponsored by Ministry of Science and Technology (MOST) of Taiwan, Republic of China under contract number: 108-2221-E-390-006. This work is also sponsored by Science and Technology Project of Xiamen, China (No. 3502ZCQ20191002).
Conflicts of Interest
The authors declare no conflict of interest.
References
- Kagan, C.R. Organic–Inorganic hybrid materials as semiconducting channels in thin-film field-effect transistors. Science 1999, 286, 945–947. [Google Scholar] [CrossRef]
- Huang, P.H.; Wang, Y.H.; Ke, J.C.; Huang, C.J. The effect of solvents on the performance of CH3NH3PbI3 perovskite solar cells. Energies 2017, 10, 599. [Google Scholar] [CrossRef]
- Kulkarni, S.A.; Baikie, T.; Boix, P.P.; Yantara, N.; Mathews, N.; Mhaisalkar, S.G. Band gap tuning of lead halide perovskites using a sequential deposition process. J. Mater. Chem. A 2014, 2, 9221–9225. [Google Scholar] [CrossRef]
- Kojima, A.; Teshima, K.; Shirai, Y.; Miyasaka, T. Organometal halide perovskites as visible-light sensitizers for photovoltaic cells. J. Am. Chem. Soc. 2009, 131, 6050. [Google Scholar] [CrossRef]
- Shi, D.; Adinol, V.; Comin, R.; Yuan, M.; Alarousu, E.; Buin, A.; Chen, Y.; Hoogland, S.; Rothenberger, A.; Katsiev, K.; et al. Low trap-state density and long carrier diffusion in organolead trihalide perovskite single crystals. Science 2015, 347, 519–522. [Google Scholar] [CrossRef]
- Collavini, S.; Völker, S.F.; Delgado, J.L. Understanding the outstanding power conversion efficiency of perovskite-based solar cells. Angew. Chem. Int. Ed. 2015, 54, 9757–9759. [Google Scholar] [CrossRef]
- Im, J.H.; Lee, C.R.; Lee, J.W.; Park, S.W.; Park, N.G. 6.5% efficient perovskite quantum-dot-sensitized solar cell. Nanoscale 2011, 3, 4088–4093. [Google Scholar] [CrossRef]
- Kim, H.S.; Lee, C.R.; Im, J.H.; Lee, K.B.; Moehl, T.; Marchioro, A.; Moon, S.J.; Humphry-Baker, R.; Yum, J.H.; Moser, J.E.; et al. Lead iodide perovskite sensitized all-solid-state submicron thin film mesoscopic solar cell with efficiency exceeding 9%. Sci. Rep. 2012, 2, 591. [Google Scholar] [CrossRef]
- Burschka, J.; Pellet, N.; Moon, S.; Humphry-Baker, R.; Gao, P.; Nazeeruddin, M.K.; Gratzel, M. Sequential deposition as a route to high-performance perovskite-sensitized solar cells. Nature 2013, 499, 316–319. [Google Scholar] [CrossRef]
- Docampo, P.; Ball, J.M.; Darwich, M.; Eperon, G.E.; Snaith, H.J. Efficient organometal trihalide perovskite planar-heterojunction solar cells on flexible polymer substrates. Nat. Commun. 2013, 4, 1–6. [Google Scholar] [CrossRef]
- You, J.; Hong, Z.; Yang, Y.; Chen, Q.; Cai, M.; Song, T.; Chen, C.; Lu, S.; Liu, Y.; Zhou, H.; et al. Low-temperature solution-processed perovskite solar cells with high efficiency and flexibility. ACS Nano 2014, 8, 1674–1680. [Google Scholar] [CrossRef]
- O’Regan, B.; Grätzel, M. A Low-Cost, High-efficiency solar cell based on dye-sensitized colloidal TiO2 films. Nature 1991, 353, 24. [Google Scholar] [CrossRef]
- Grätzel, M. Dye-sensitized solar cells. J. Photochem. Photobiol. C 2003, 4, 145–153. [Google Scholar] [CrossRef]
- Ke, W.J.; Fang, G.J.; Lei, H.W.; Qin, P.L.; Tao, H.; Zeng, W.; Wang, J.; Zhao, X.Z. An efficient and transparent CuS nanosheet film counter electrode for bifacial quantum-dot-sensitized solar cells. J. Power Sources 2014, 248, 809–815. [Google Scholar] [CrossRef]
- Unger, E.L.; Spadavecchia, F.; Nonomura, K.; Palmgren, P.; Cappelletti, G.; Hagfeldt, A.; Johansson, E.M.; Boschloo, G. Effect of the preparation procedure on the morphology of thin TiO2 Films and their device performance in small-molecule bilayer hybrid solar cells. ACS Appl. Mater. Interfaces 2012, 4, 5997–6004. [Google Scholar] [CrossRef]
- Kavan, L.; Tétreault, N.; Moehl, T.; Gratzel, M. Electrochemical characterization of TiO2 blocking layers for dye-sensitized solar cells. J. Phys. Chem. C 2014, 118, 16408–16418. [Google Scholar] [CrossRef]
- Cameron, P.J.; Peter, L.M. Characterization of titanium dioxide blocking layers in dye-sensitized nanocrystalline solar cells. J. Phys. Chem. B 2003, 107, 14394–14400. [Google Scholar] [CrossRef]
- Xia, J.B.; Masaki, N.; Jiang, K.J.; Yanagida, S. Deposition of a thin film of TiOx from a titanium metal target as novel blocking layers at conducting glass/TiO2 interfaces in ionic liquid mesoscopic TiO2 dye-sensitized solar cells. J. Phys. Chem. B 2006, 110, 25222–25228. [Google Scholar] [CrossRef]
- Chandiran, A.K.; Yella, A.; Stefik, M.; Heiniger, L.P.; Comte, P.; Nazeeruddin, M.K.; Graatzel, M. Low-temperature crystalline titanium dioxide by atomic layer deposition for dye-Sensitized solar cells. ACS Appl. Mater. Interfaces 2013, 5, 3487–3493. [Google Scholar] [CrossRef]
- Kavan, L.; O’Regan, B.; Kay, A.; Grätzel, M. Preparation of TiO2 (anatase) films on electrodes by anodic oxidative hydrolysis of TiCl3. J. Electroanal. Chem. 1993, 346, 291–307. [Google Scholar] [CrossRef]
- Zhan, Z.Y.; An, J.N.; Zhang, H.C.; Hansen, R.V.; Zheng, L.X. Three-dimensional plasmonic photoanodes based on Au-embedded TiO2 structures for enhanced visible-light water splitting. ACS Appl. Mater. Interfaces 2014, 6, 1139–1144. [Google Scholar] [CrossRef]
- Chang, H.M.; Yang, Y.J.; Li, H.C.; Hsu, C.C.; Cheng, I.C.; Chen, J.Z. Preparation of nanoporous TiO2 films for DSSC application by a rapid atmospheric pressure plasma jet sintering process. J. Power Sources 2013, 234, 16–22. [Google Scholar] [CrossRef]
- Wang, Y.; Wan, J.; Ding, J.; Hu, J.S.; Wang, D. A rutile TiO2 electron transport layer for the enhancement of charge collection for efficient perovskite solar cells. Angew. Chem. Int. Ed. 2019, 58, 9414–9418. [Google Scholar] [CrossRef]
- Ke, J.C.; Wang, Y.H.; Chen, K.L.; Huang, C.J. Effect of organic solar cells using various power O2 plasma treatments on the indium tin oxide substrate. J. Colloid Interface Sci. 2016, 465, 311–315. [Google Scholar] [CrossRef]
- Jeon, N.J.; Noh, J.H.; Kim, Y.C.; Yang, W.S.; Ryu, S.; Seok, S.I. Solvent engineering for high-performance inorganic–Organic hybrid perovskite solar cells. Nat. Mater. 2014, 13, 897–903. [Google Scholar] [CrossRef]
© 2020 by the authors. Licensee MDPI, Basel, Switzerland. This article is an open access article distributed under the terms and conditions of the Creative Commons Attribution (CC BY) license (http://creativecommons.org/licenses/by/4.0/).