Article

Uniform Spheres of α-NaYF4:RE3+ (RE=Eu, Tb, Ce, Er, and Tm): Template-Free Synthesis, Multi-Color Photoluminescence, and Their Application in Cellular Imaging

1
Key Laboratory for Anisotropy and Texture of Materials (Ministry of Education), School of Materials Science and Engineering, Northeastern University, Shenyang, Liaoning 110819, China
2
Institute of Ceramics and Powder Metallurgy, School of Materials Science and Engineering, Northeastern University, Shenyang, Liaoning 110819, China
*
Author to whom correspondence should be addressed.
Crystals 2020, 10(2), 119; https://doi.org/10.3390/cryst10020119
Submission received: 11 January 2020 / Revised: 3 February 2020 / Accepted: 11 February 2020 / Published: 14 February 2020

Abstract

:
Uniformly dispersed luminescent probes with a high brightness and high resolution are desired in bio imaging fields. Here, ~100 nm sized and well-dispersed spheres of RE3+ doped α-NaYF4 (rare earth (RE) = Eu, Tb, Ce, Er, and Tm) have been facile synthesized through hydrothermal processing in the absence of a template, followed by a proper annealing. The processing window of the cubic structured spheres is wide, because the hydrothermal products are independent of the processing conditions, including reaction time and temperature. The original morphology and crystal structure can be well retained with a calcination temperature up to 600 °C. However, calcination gives rise to a reduction of particle sizes, as a result of the crystallite growth and densification. Under ultraviolet radiation, α-NaYF4:RE3+ spheres show characteristic f-f emissions of RE3+ (RE = Eu, Tb, Ce, Er, and Tm), and exhibit orange red, green, ultraviolet (UV), blue green, and blue emissions, respectively. Mainly because of the near-infrared emission at ~697 nm (5D07F4 transitions of Eu3+), the successful imaging of macrophages was achieved by NH2-NaYF4:Eu3+ probes, indicating their excellent imaging capacity for cells in vitro.

1. Introduction

In rare-earth ions, including RE2+ and RE3+ (rare earth—RE), activated phosphor is an important and attractive luminescence material, owing to the fact that RE ions can exhibit sharp fluorescent emissions via intra-4f or 4f-5d transitions [1]. However, the luminescence efficiency is significantly dependent on two factors, phonon energy and energy gap of the host [2,3]. Low phonon energy gives rise to the high possibility of radiative transition, as well as to a high luminescence efficiency [2,3]. Therefore, an appropriate luminescent host is very important for efficient rare earth phosphors. Rare-earth-doped fluoride is one of the best down-/up-conversion luminescence materials, because it has a high luminescence efficiency and photo-stability [1,2,3]. Rare earth fluorides, including hexagonal/orthorhombic REF3 [4,5,6] and hexagonal/cubic NaREF4 (rare earth—RE) [7,8,9], are four typical host lattices for down-/up-conversion luminescence. Two crystal structures are always observed for NaREF4, which are a cubic α-phase (metastable high temperature phase) and a hexagonal β-phase (thermodynamically stable low-temperature phase) [4]. Recently, both experimental and theoretical studies indicate that Mn2+ could be incorporated in the cubic host lattice of α-NaYF4, because of the formation of F vacancies around Mn2+ ions for charge neutrality [7]. The incorporation of Mn2+ gives rise to the efficient multiphoton up-conversion process under pulsed laser excitation at high power densities [7,8]. In addition, doping Mn2+ in α-NaYF4 yielded a green persistent luminescence, mainly caused by the charge compensation defects [8]. However, doping Mn2+ in the hexagonal host of β-NaYF4 is impossible, because of the incompatibility of Mn2+ ions [7]. This suggests that the crystal structure of the host lattices exhibited a selective compatibility of dopant ions, and α-NaYF4 is an appropriate luminescent host for popular activators’ incorporation. On the other hand, mainly because of the isometric cubic structure, the final products of NaYF4:RE3+ could exhibit a sphere-like shape [7,8,10]. However, octahedrons [11], rods [12], and tubes [13] are always found for RE3+-doped β-NaYF4 microcrystals, mainly because of the crystal habit of the hexagonal structure.
It is widely accepted that luminescence behavior is significantly dependent on the size, shape, and dimensionality of micro-/nano-materials, except for their crystal structures and compositions. Recently, increased attention has been paid to uniformly dispersed luminescent nanomaterials with a high brightness and high resolution because of their wide applications in display and bio imaging fields. As the display resolution can be improved by decreasing the pixel size, fine phosphor particles of a narrow size distribution and spherical shape are highly desired. In this work, submicron-sized monodispersed spheres of RE3+ doped α-NaYF4 (RE = Eu, Tb, Ce, Er, and Tm) have been autoclaved from mixed solutions of the rare earth nitrate solutions and NH4F, in the presence of EDTA-2Na (ethylenediamine tetraacetic acid disodium salt). The luminescence behavior of the spheres and their application in cellular imaging were investigated in detail. We believe that the outcome of this work may offer wide implications for other luminescence materials systems.

2. Experimental

2.1. Synthesis

The starting rare earth materials were rare earth oxides, and all of the 99.99% pure products were purchased from Huizhou Ruier Rare-Chem. Hi-Tech. Co. Ltd. (Huizhou, China). The synthesis of RE3+ doped α-NaYF4 (RE = Eu, Tb, Ce, Er, and Tm) was conducted according to a facile hydrothermal technique described in our previous work [8]. The doping content for Eu3+ in α-NaYF4 is 5 at%, while the doping content for Tb3+, Ce3+, Er3+, and Tm3+ is 1 at%. Finally, the samples were calcined under flowing O2 (200 mL/min) at 600 °C for 2 h with a heating rate of 10 °C/min.

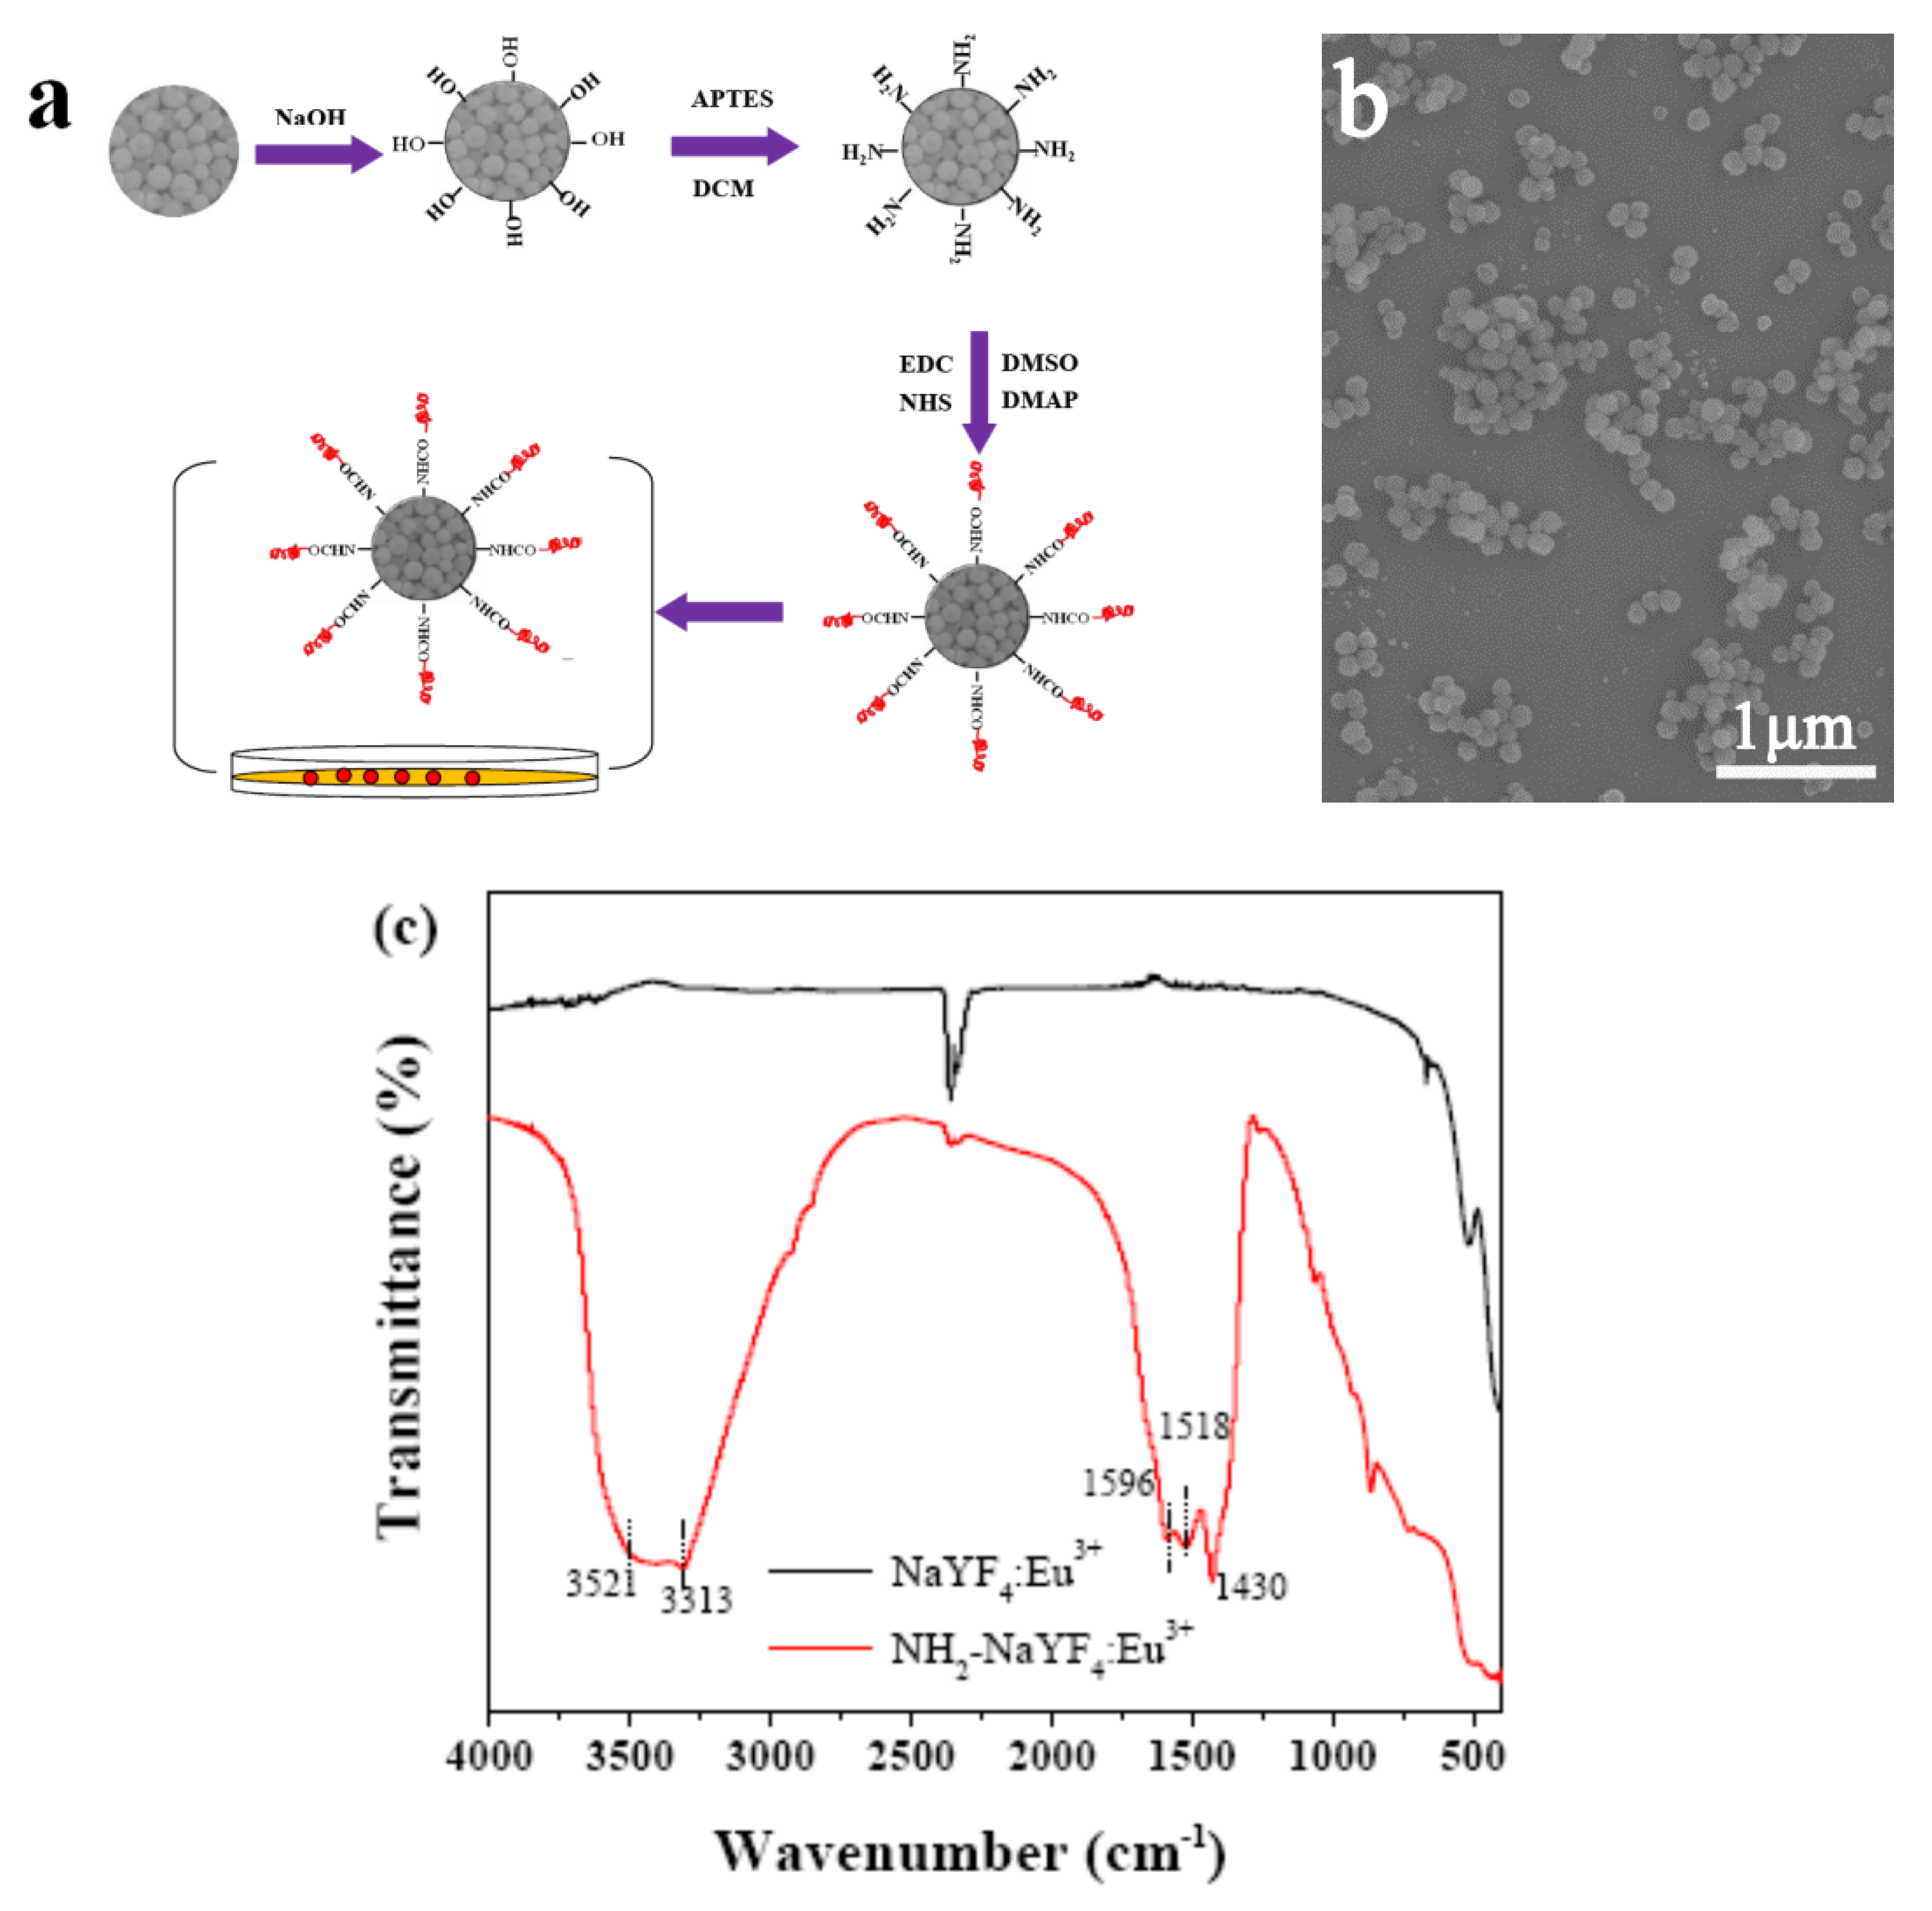
2.2. Surface Functionalization

First, 100 mg of RE3+ doped α-NaYF4 spheres was dispersed into 40 mL of a NaOH solution (5 mmol/L), followed by 1 h of sonication treatment. After vigorously stirring at room temperature for 24 h, the resulting colloid solution was treated by 1000 rpm centrifugation for 10 min to remove large particles. Then, a 10,000 rpm centrifugation for 10 min was conducted to collect the precipitate. The surface-hydroxylated particles were washed with deionized water three times. Then, 10 mg of surface-hydroxylated particles was added in 4 mL of dimethylformamide (DMF). After a 10-min sonication treatment, 40 μL of 3-aminopropyl-triethoxysilane (APTES) was added into the mixture under vigorous stirring for 24 h at room temperature. The as-obtained NH2-NaYF4:RE3+ particles were collected by 10-min centrifugation with a speed of 10,000 rpm. Finally, the powder was washed with DMF three times so as to remove the extra APTES.

2.3. Characterization Techniques
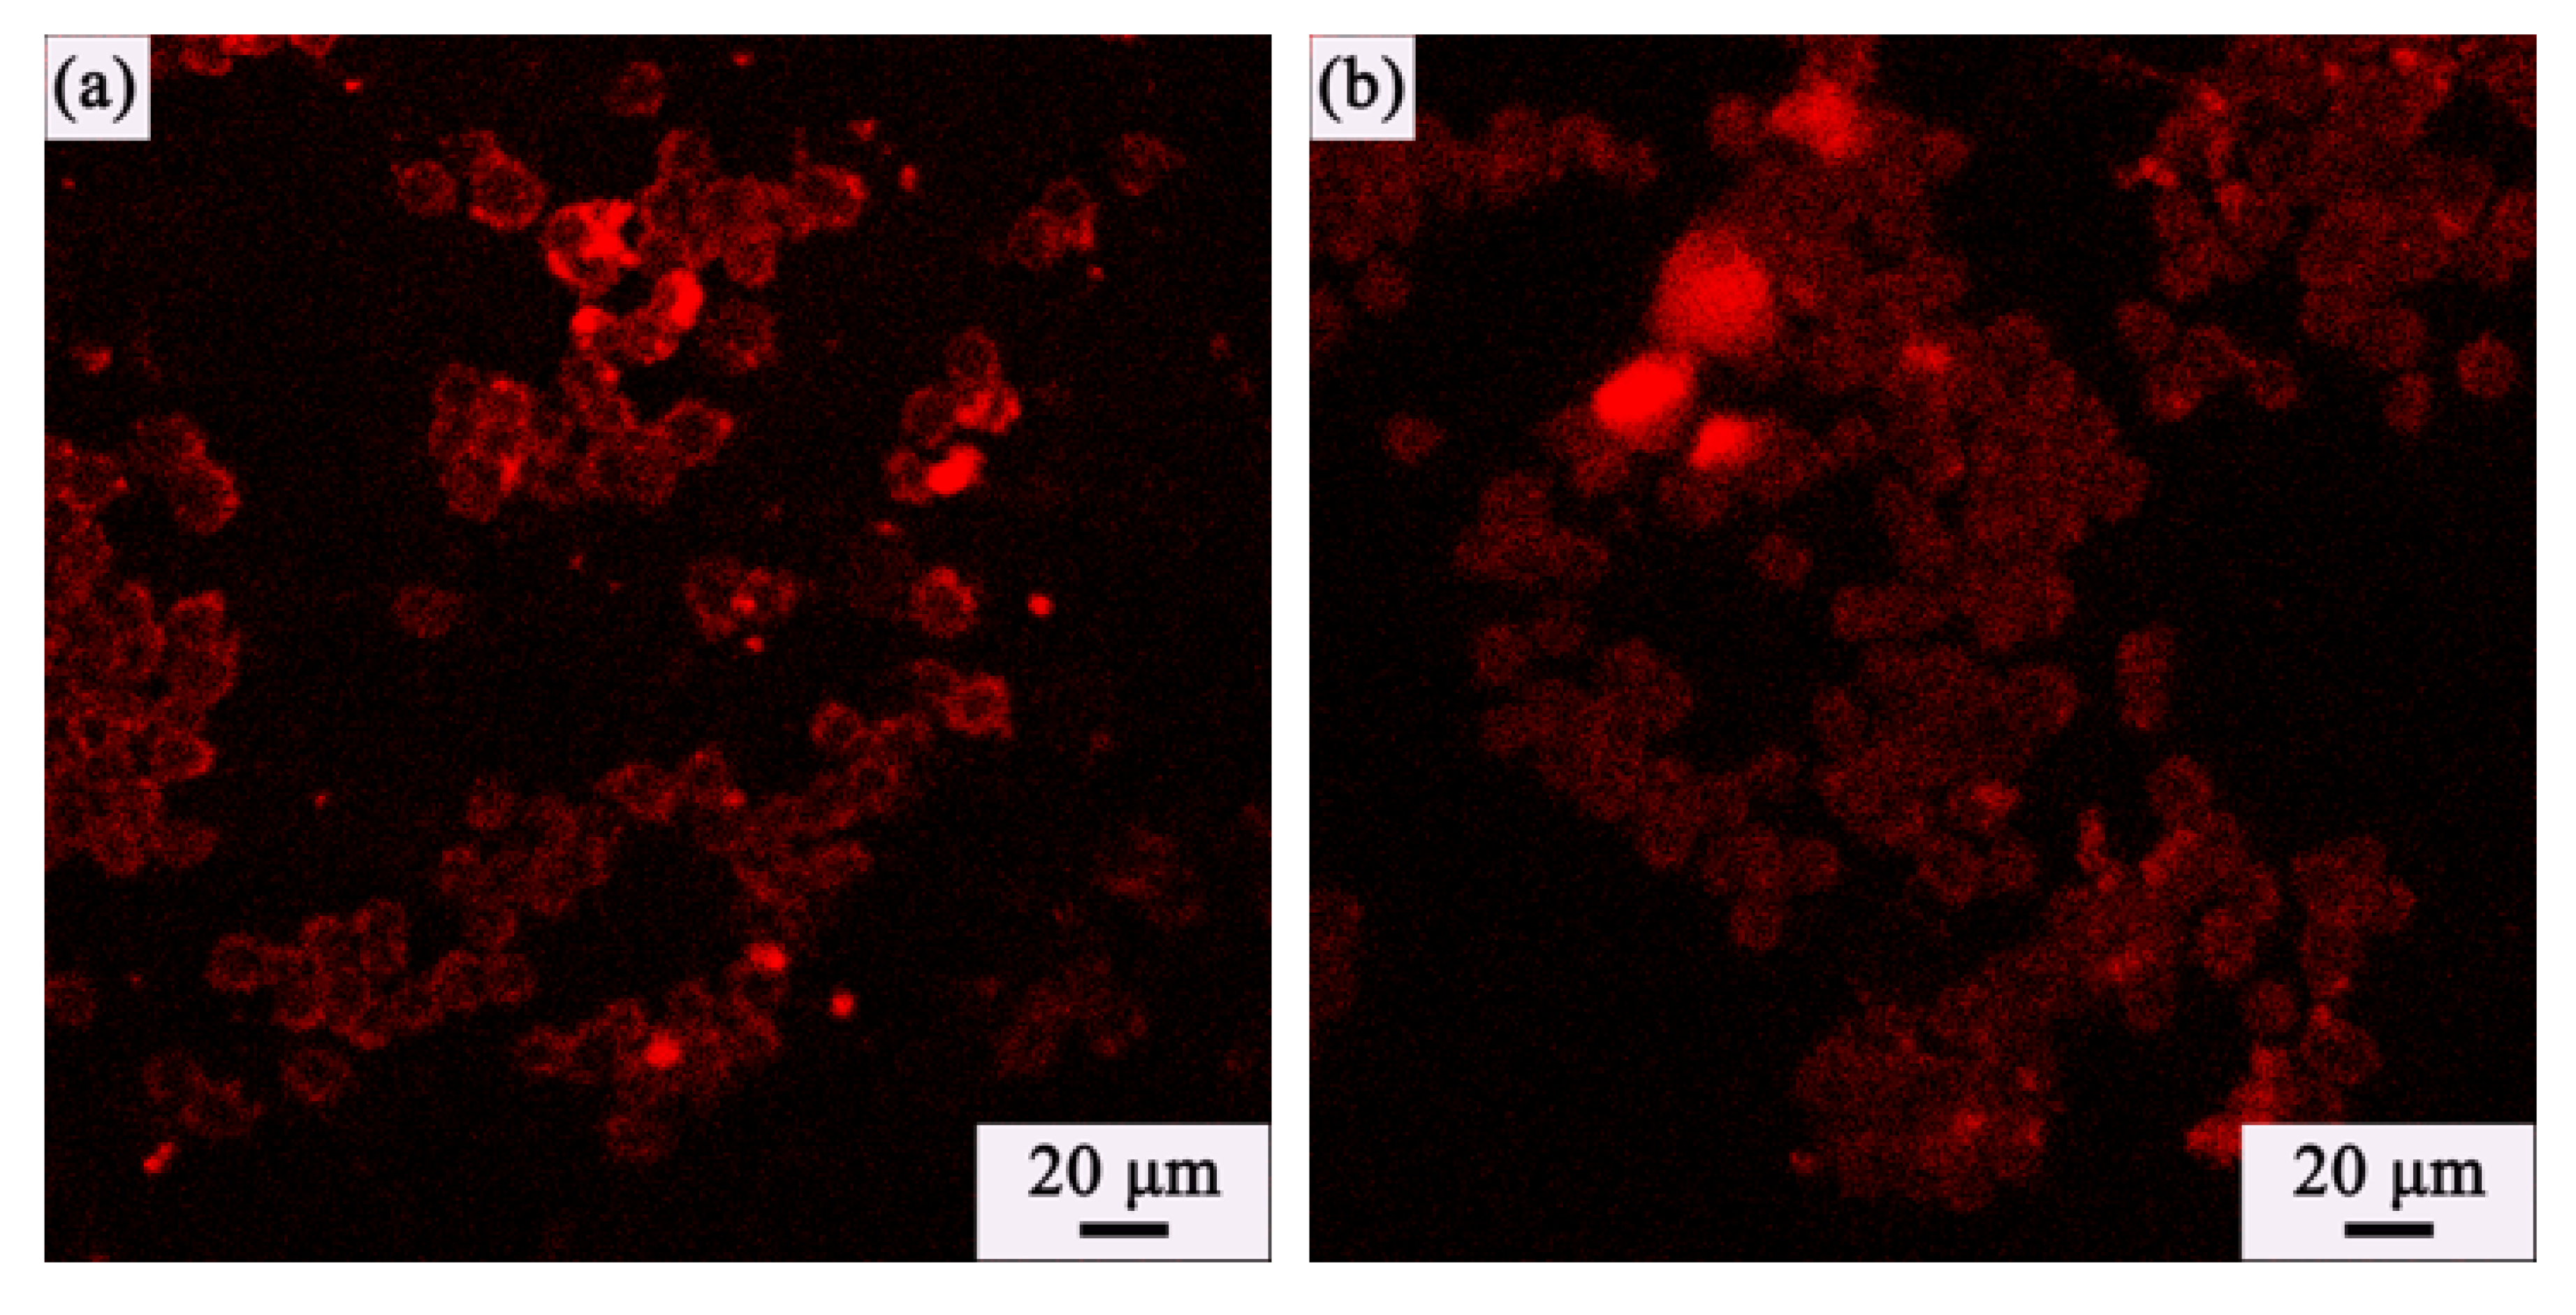
Phase identification was performed by X-ray diffraction (XRD; Model SmartLab, Rigaku, Tokyo, Japan), operating at 40 kV/40 mA using nickel-filtered Cu Kα radiation and a scanning speed of 6.0° 2θ/min. The product morphology was analyzed by field emission scanning electron microscopy (FE-SEM; Model JSM-7001F, JEOL, Tokyo) and transmission electron microscopy (TEM; Model JEM-2000FX, JEOL, Tokyo). Fourier transform infrared spectroscopy experiments (FT-IR; Nicolet iS5, Thermal Fisher Scientific, USA) were under taken using the standard KBr method. The photoluminescence of the phosphors was analyzed with an FP-8600 fluorospectrophotometer (Jasco, Tokyo). A Laser Scanning Confocal Microscope (LEICA TCS SP2, Germany) was used for the cell imaging.

2.4. Cells Imaging

Macrophages were cultured in DMEM with 10% FBS and seeded in 35 mm culture dishes for 2 h in a CO2 incubator. The as-obtained NH2-NaYF4:RE3+ (RE = Eu and Tb) particles were dispersed in a cell medium (50 mg/mL), which were then moved to culture dishes for 1 h of treatment. After removing the cell medium, 0.1 mL of 1% formaldehyde–PBS was added. Finally, the cells were washed with PBS several times for further characterization.

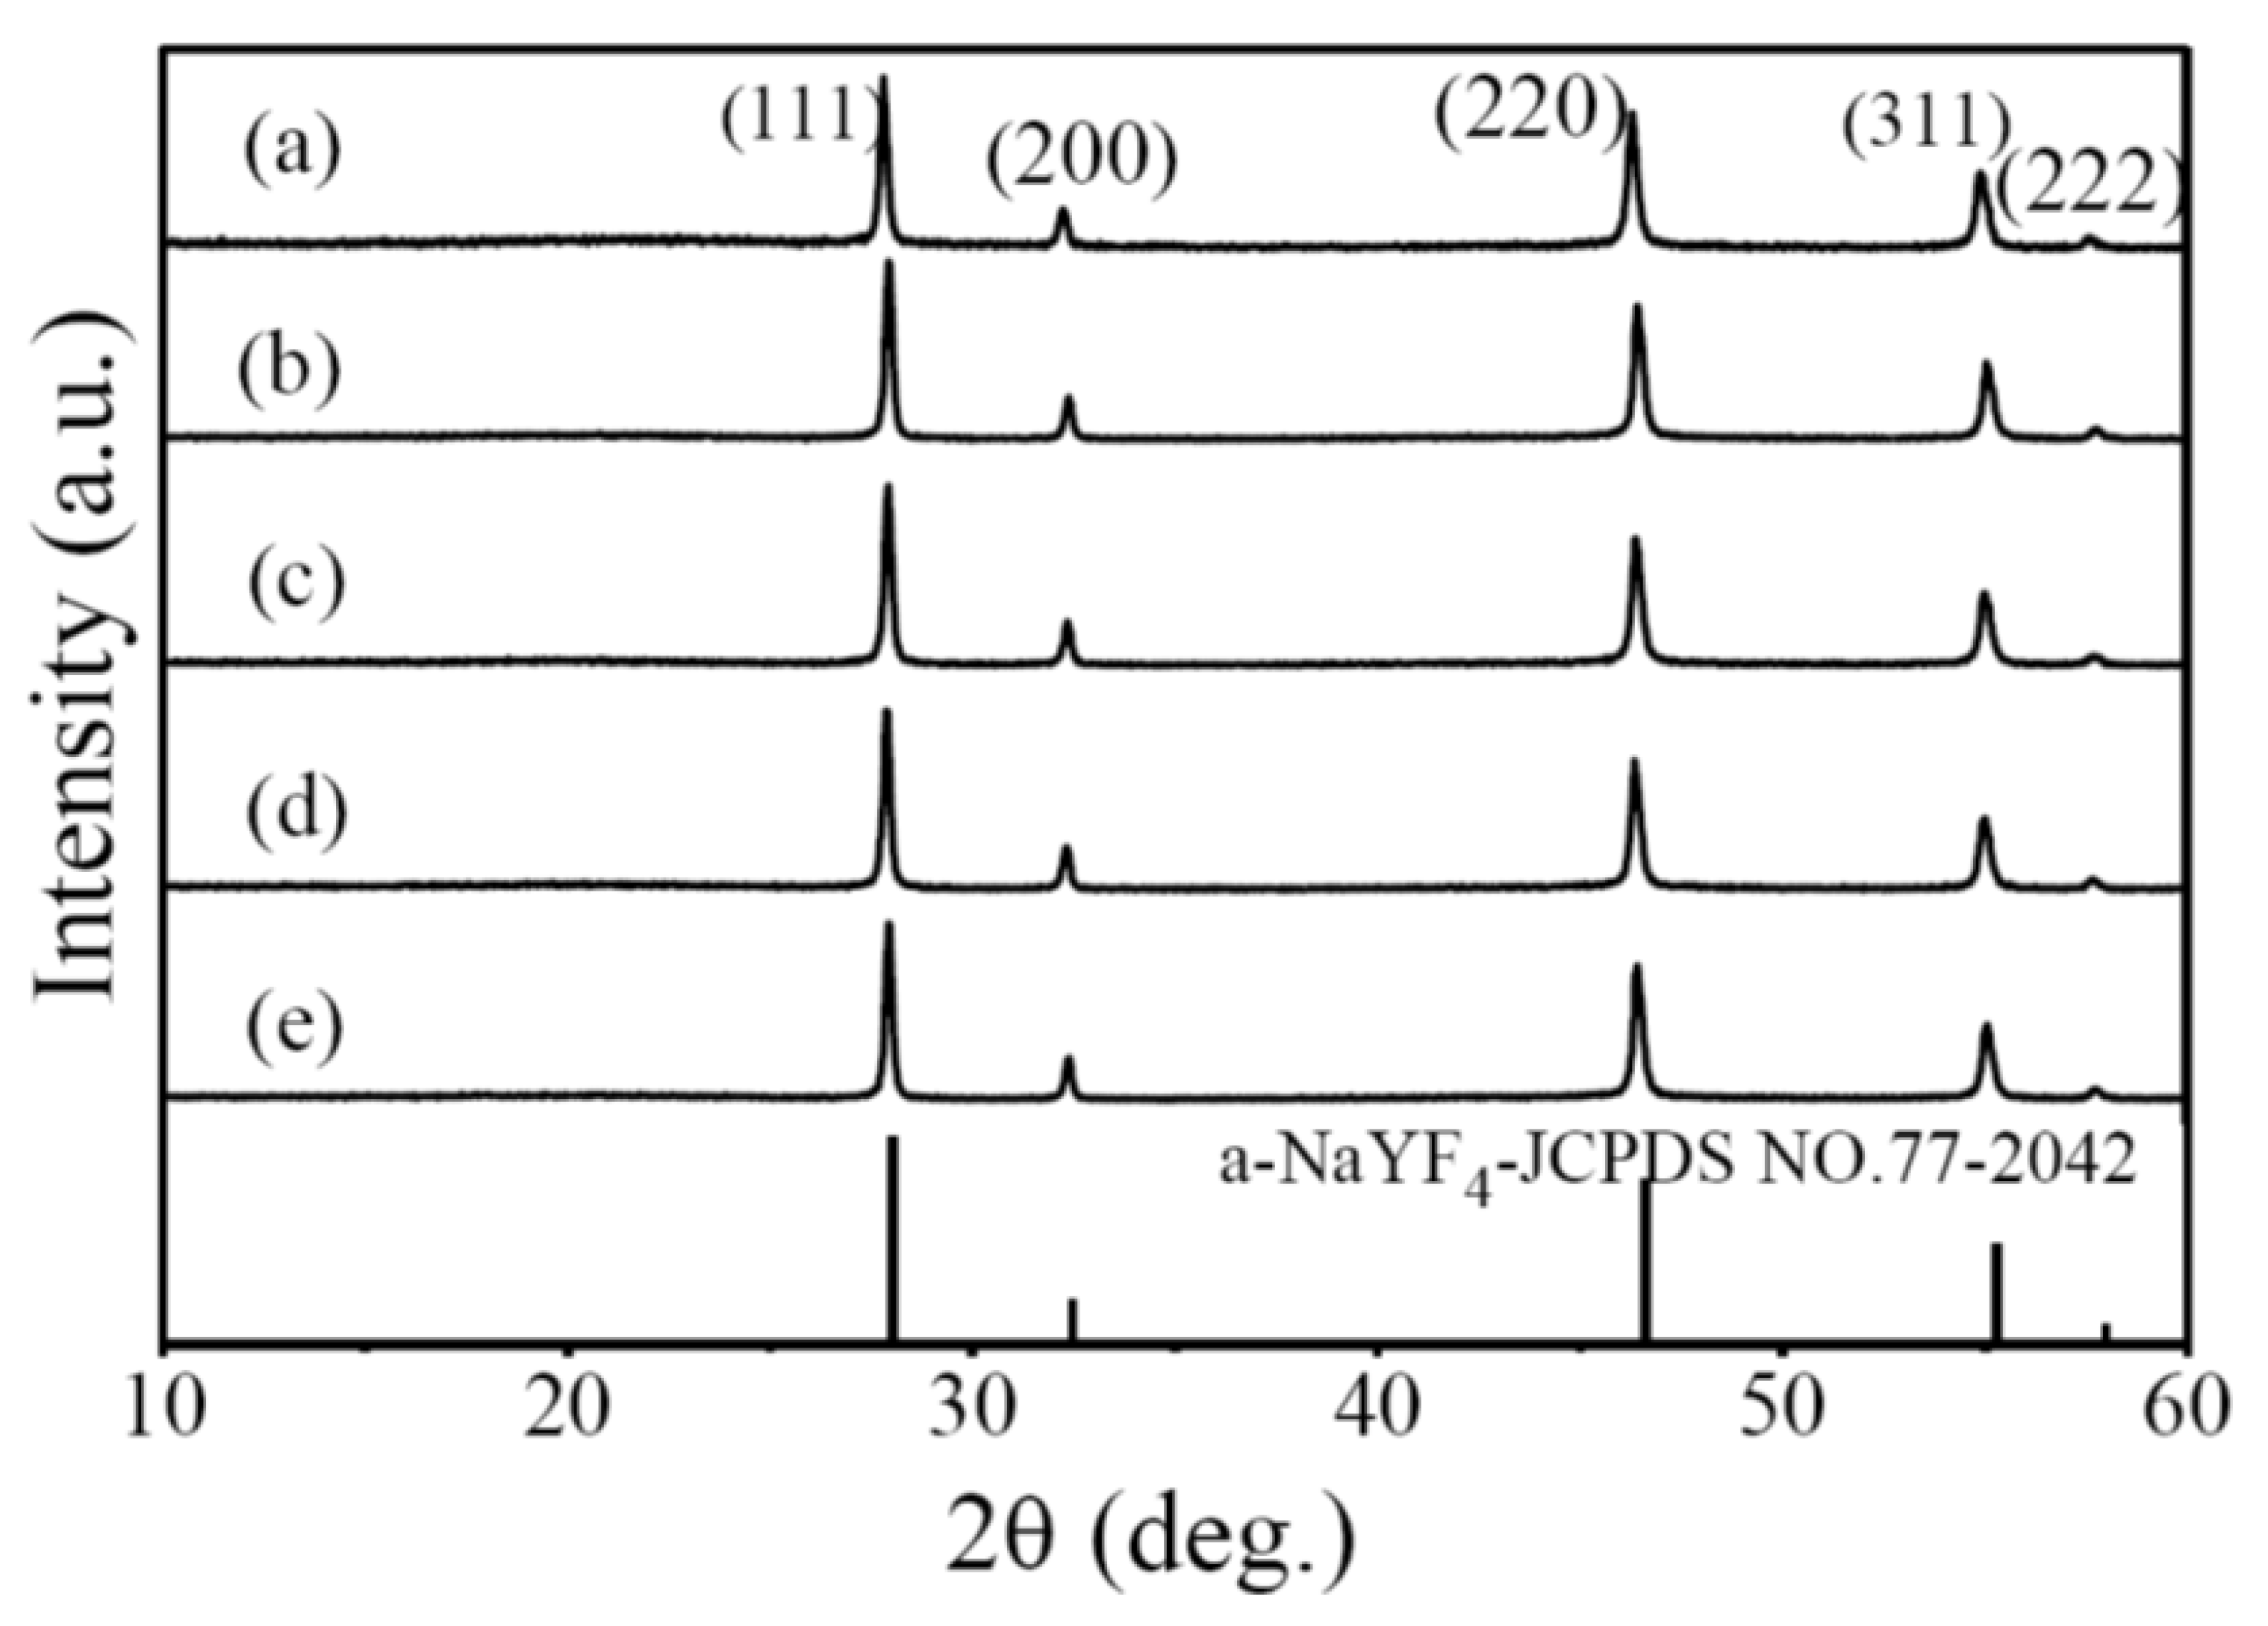
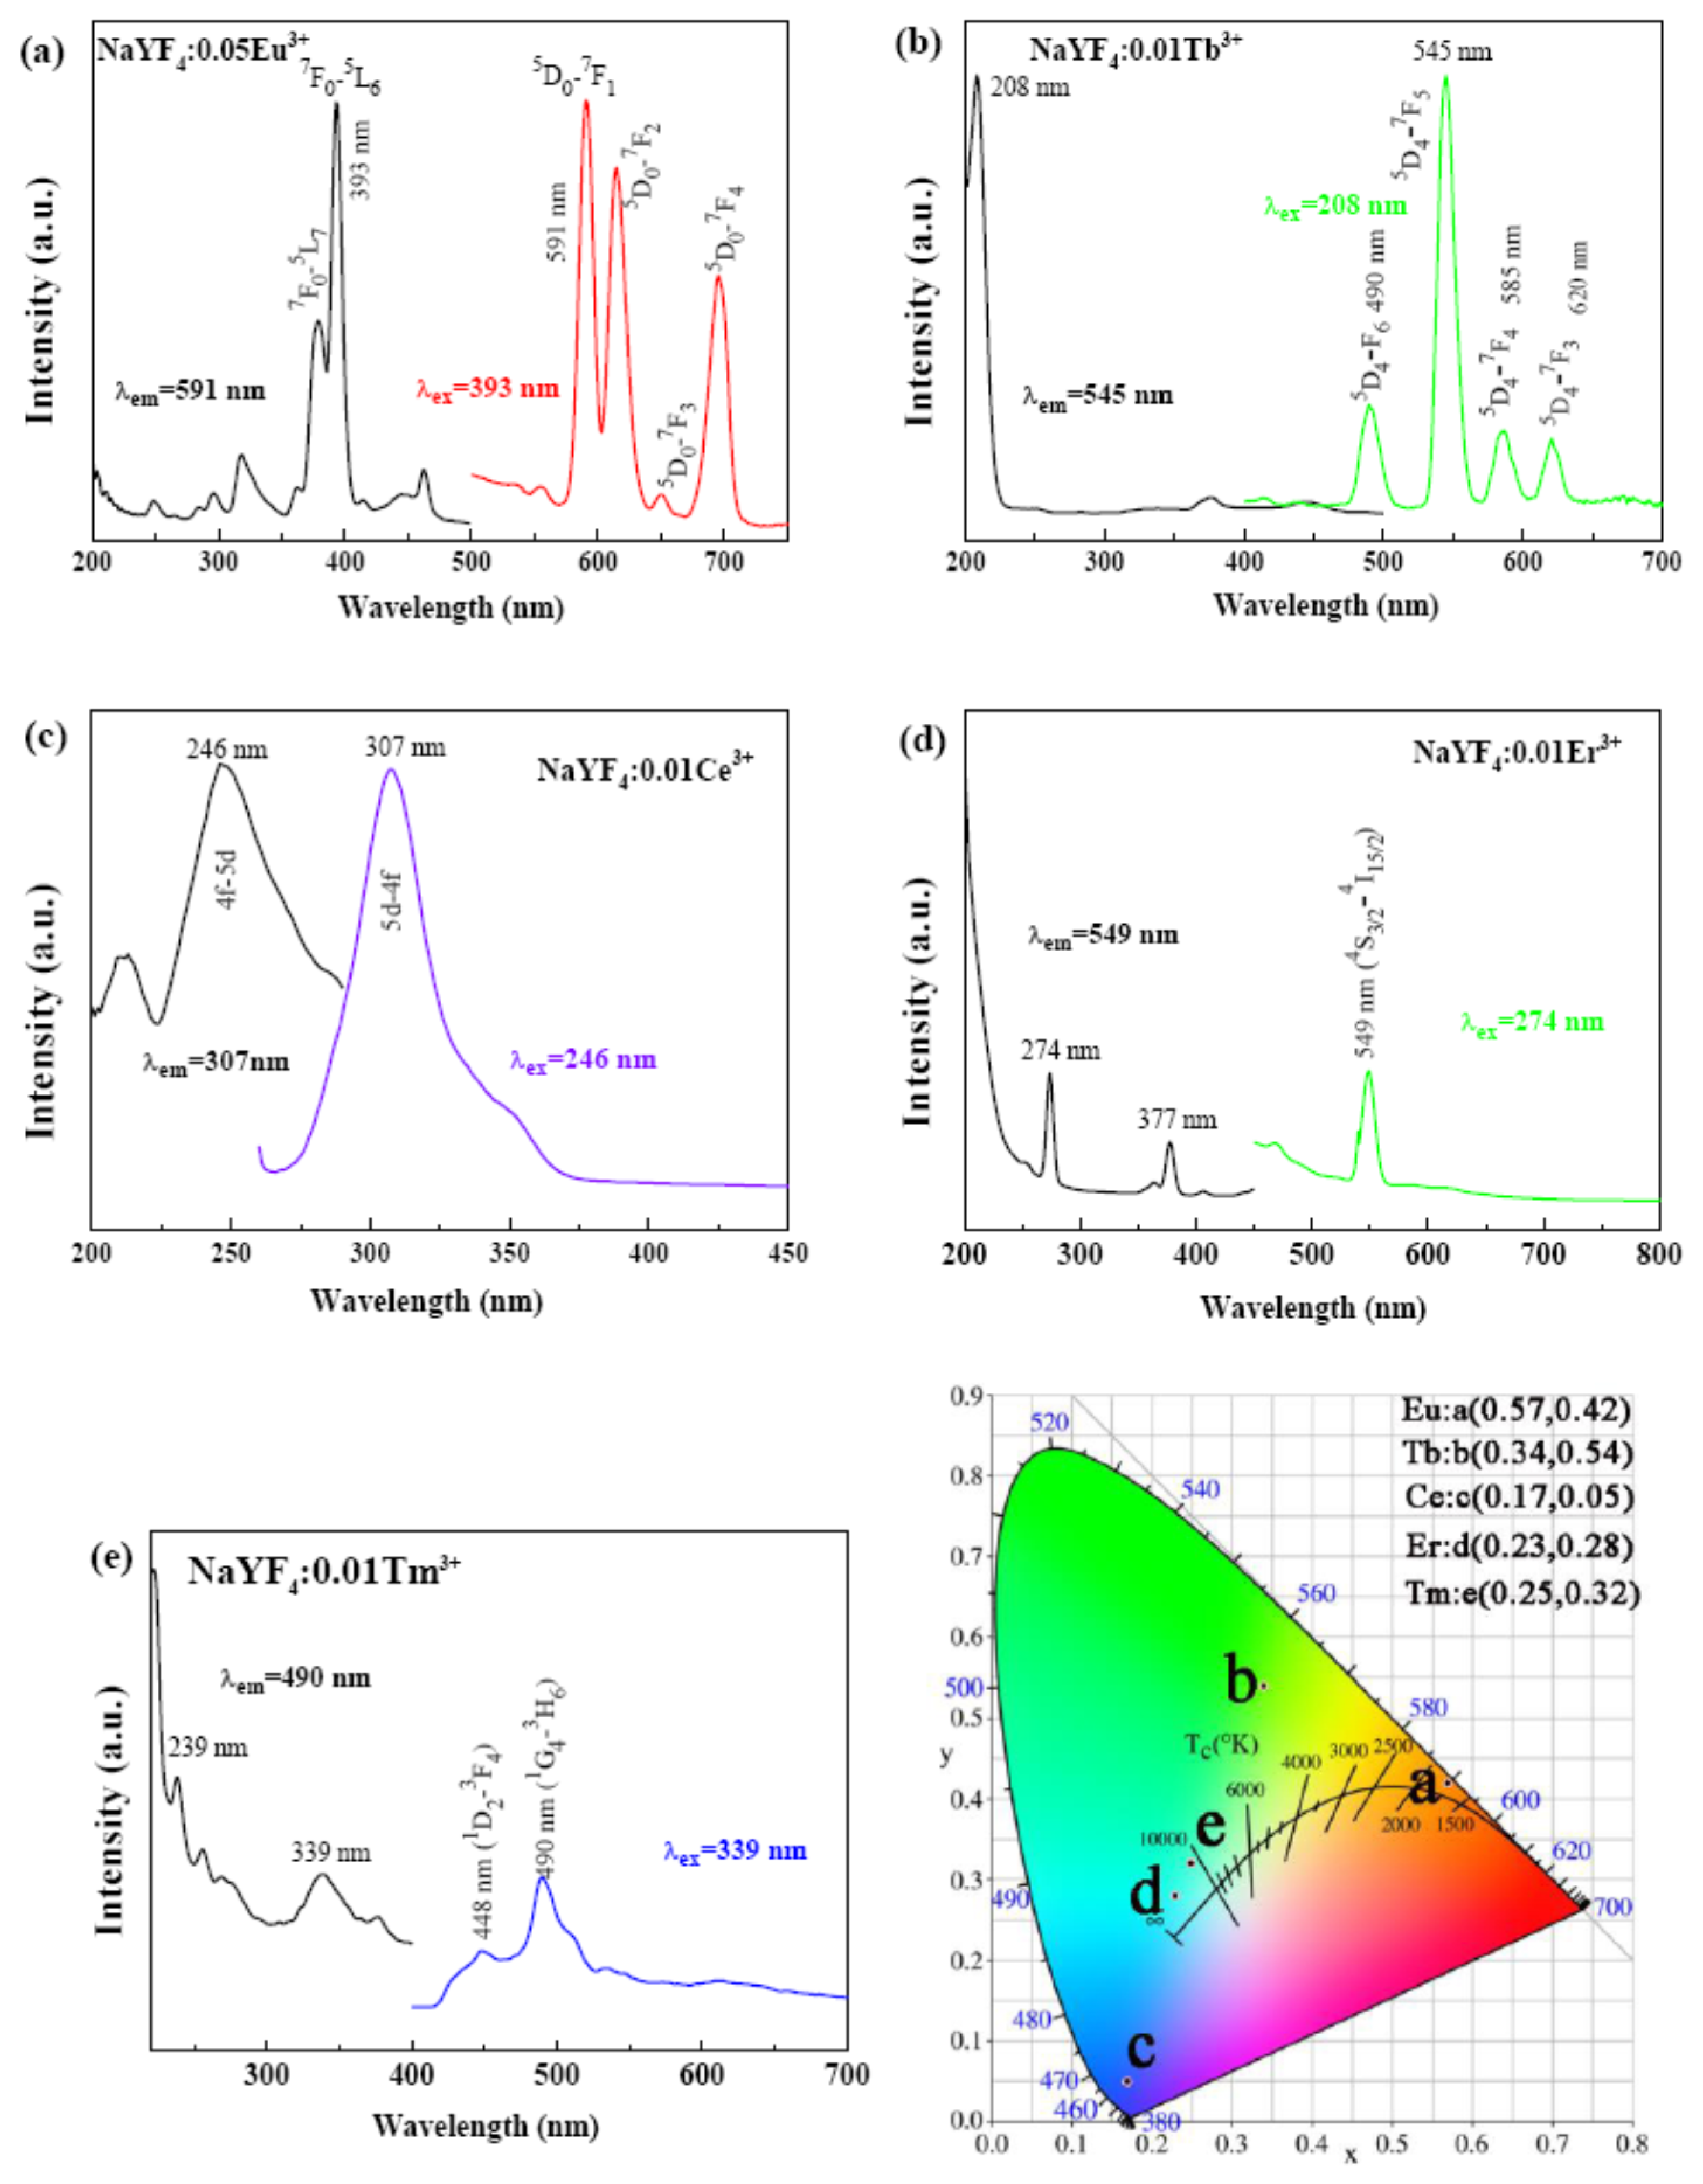
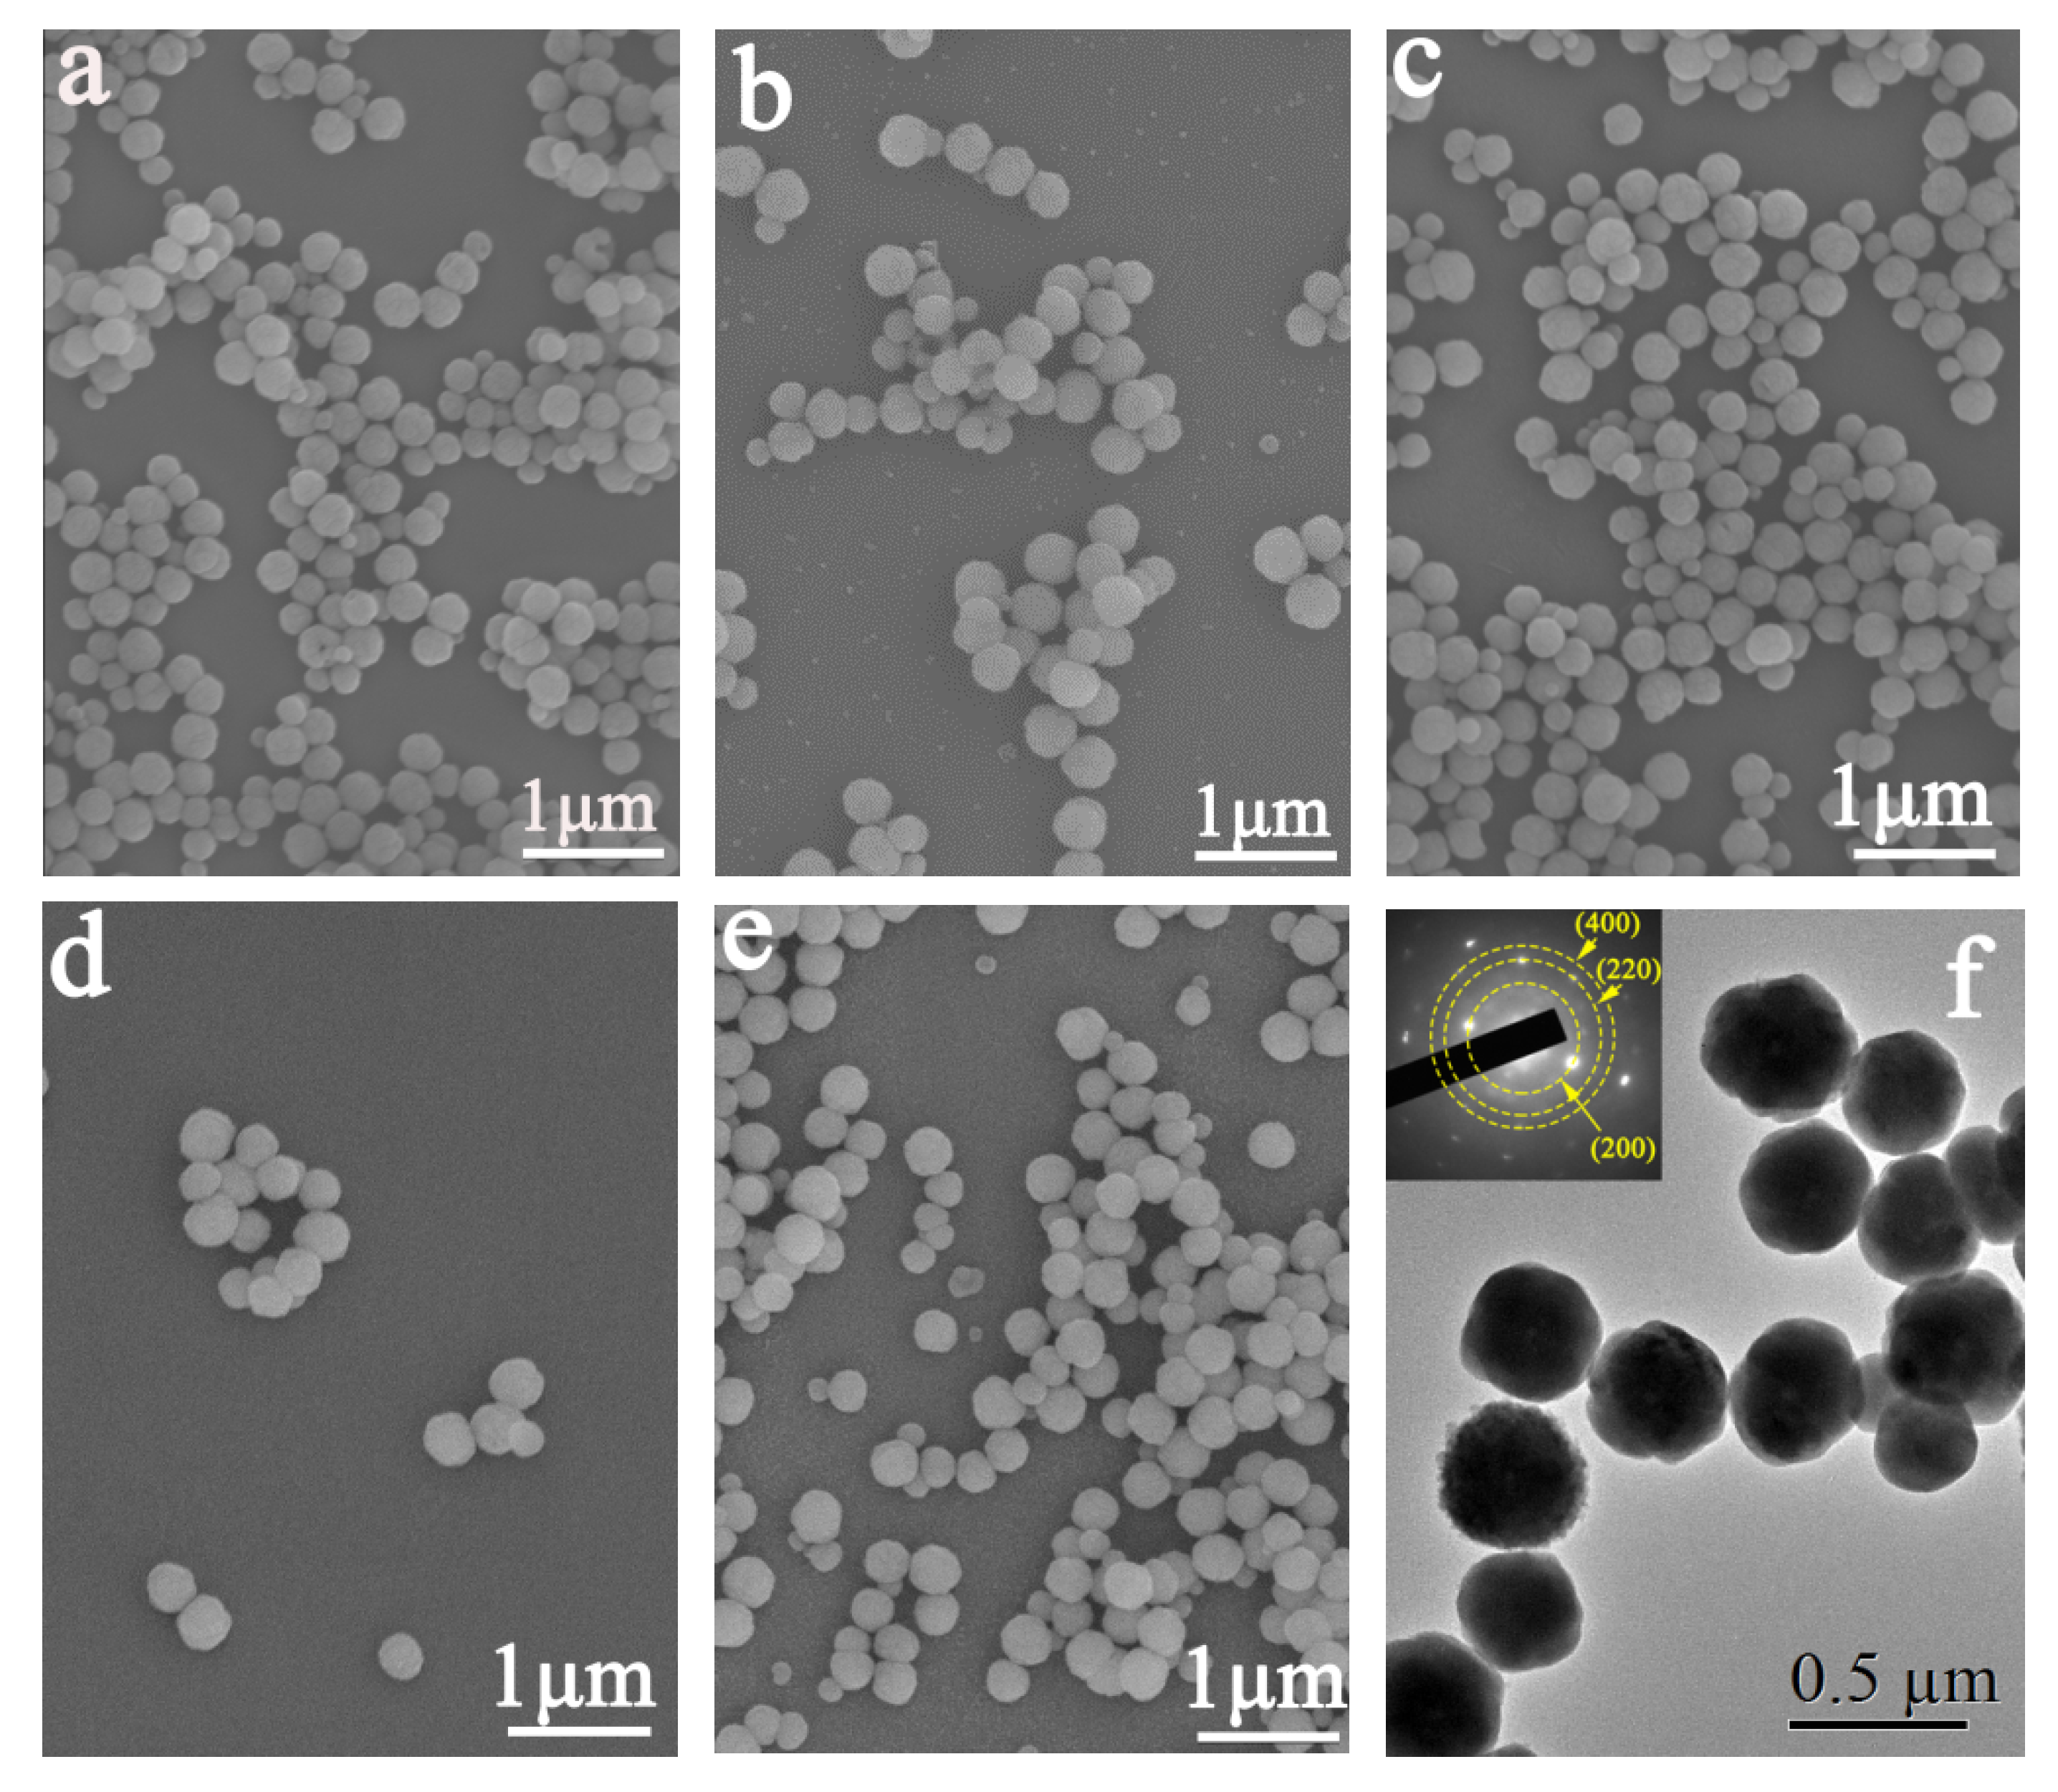
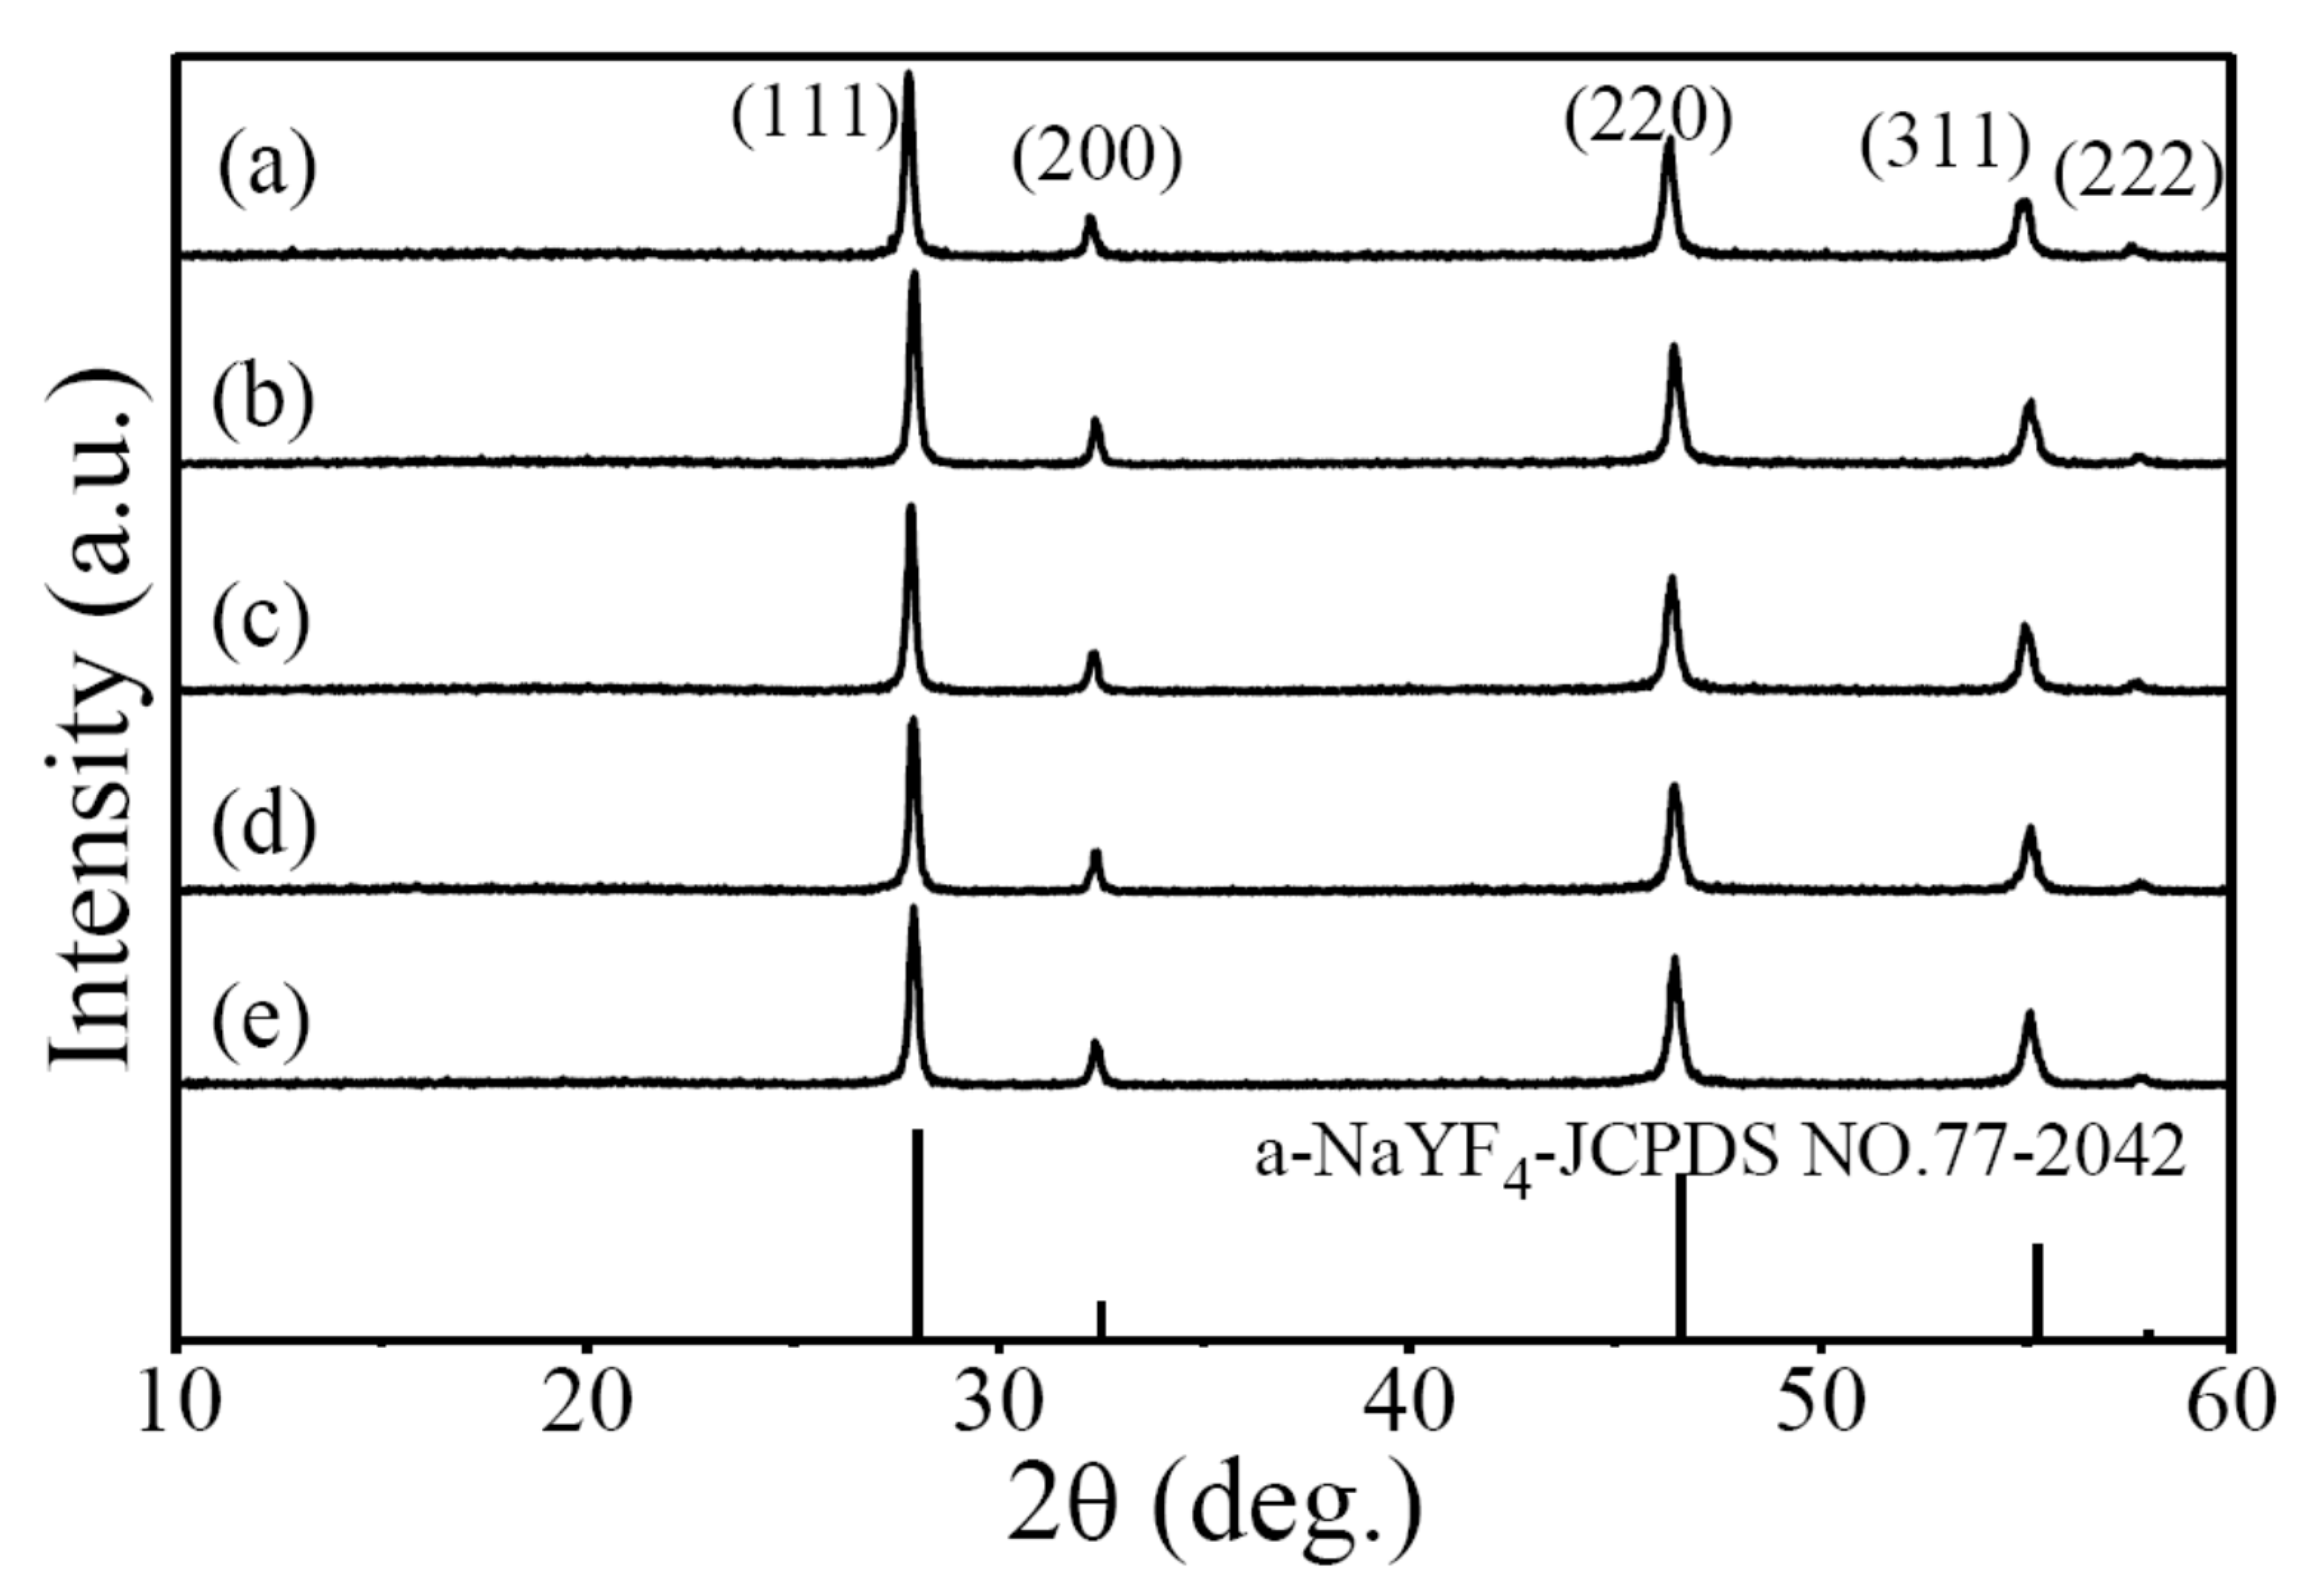
3. Results and Discussion

Figure 1 shows the morphologies of the obtained colloidal particles of α-NaYF4 doped with 5 at% Eu3+, 1 at% Tb3+, 1 at% Ce3+, 1 at% Er3+, and 1 at% Tm3+. The results indicate that all of the hydrothermal products are monodispersed colloidal spheres, with average diameters of 250 ± 50 nm. The XRD patterns shown in Figure 2 confirm that all of the Bragg reflections are identified along with the pure cubic phase NaYF4 (α-NaYF4, space group: Fm-3m (225), JCPDS no. 77-2042), and no trace of impurity phases is detected. In the cubic structure, the cation sites are equal, and the Na+ and Y3+ cations are randomly distributed in the cationic sub-lattice, with Na+ or Y3+ being surrounded by eight F ions [8]. The incorporation of Eu3+, Tb3+, Ce3+, Er3+, and Tm3+ did not introduce other heterogeneous phases, because rare earth ions replace Y3+ ions in a statistical way, thus forming a solid solution. Mainly because of the isometric cubic structure, the final products of NaYF4:RE3+ exhibited a sphere-like shape [7,8,10]. A calculation from the Scherrer equation via the profile broadening analysis of the (111) Bragg reflection yielded crystallite sizes averaging 33 ± 2 nm, which are obviously smaller than the particle sizes (250 ± 50 nm), indicating that the obtained spheres are polycrystalline. Consistent with the FE-SEM (Figure 1a–e), the TEM observation of NaYF4:Eu3+ (Figure 1f) reveals that the hydrothermal products are characterized by a spherical shape and good dispersion. In addition, the TEM analysis further indicates that the spheres are polycrystalline, because the particles consist of fine crystals, thus yielding a non-smooth surface. The (200), (220), and (400) planes are well resolved by selected area electron diffraction (SAED; inset in Figure 1f), suggesting that the particles are in good crystallization.
In this work, the phase and morphology of the hydrothermal products are found to be independent of the processing conditions, including the reaction time and reaction temperature. Taking the Eu3+ doped α-NaYF4 sample as an example, shortening the hydrothermal time from 24 to 6 h or lowering the reaction temperature from 180 to 100 °C all yielded monodispersed spheres of α-NaYF4:Eu3+ (Figures S1–S4). The above results indicate that the processing conditions have no obvious effects on the phase purity and particle morphology of the products. In other words, monodispersed spheres of α-NaYF4 can be facile synthesized in a wide synthetic range.
Calcining the spheres at 600 °C for 2 h yielded well-dispersed spherical particles, but smaller sizes were observed for the resultant products (Figure S5). In addition, the resultant products display all of the characteristic Bragg reflections (Figure 3) corresponding to the cubic phase of NaYF4 (α-NaYF4, space group: Fm-3m (225), JCPDS no. 77-2042). The above results suggest that the original morphology and crystal structure are well retained for the samples calcined at 600 °C. However, a sharper peak shape and stronger intensity are observed at a calcination temperature of 600 °C (Figure 3) because of crystallite growth. The profile broadening of the (200) diffraction peak was analyzed by applying the Scherrer equation. Indeed, the average crystallite size of 50 ± 2 nm determined for the spheres calcined at 600 °C is bigger than that for the original samples (33 ± 2 nm), directly confirming the crystallite growth. Because of the crystallite growth and densification during calcination, a reduction of particle sizes from 250 ± 50 nm to 100 ± 20 nm takes place.
α-NaYF4 is an appropriate luminescent host for popular activators’ incorporation; therefore, multi-color emissions can be achieved by the incorporation of different activated ions. Here, α-NaYF4 spheres exhibit varied emission colors by doping different trivalent rare earth ions, including Eu3+, Tb3+, Ce3+, Er3+, and Tm3+. Figure 4a–e shows the Photoluminescence excitation (PLE) and photoluminescence (PL) spectra of Eu3+-, Tb3+-, Ce3+-, Er3+-, and Tm3+-doped α-NaYF4 samples calcined at 600 °C. In Figure 4a, α-NaYF4:Eu3+ exhibits an excitation band in the 200–500 nm range, with a maximum at 393 nm, which is associated with the 7F05L6 transition of the inter-configurational Eu3+ [14]. Upon UV excitation at 393 nm, the Eu3+ doped sample exhibits sharp bands at ~591, ~615, ~650, and ~697 nm, associated with the 5D07F1, 5D07F2, 5D07F3, and 5D07F4 transitions of Eu3+ [14]. According to the Judd–Ofelt parity law, magnetic dipole transition is permitted, while electric dipole transition is forbidden, and the latter is allowed only on condition that the Eu3+ ions occupy non-centrosymmetric sites [15,16]. It is understood that the 5D07F2 electric dipole transition is hypersensitive to the local environment of the Eu3+ ions. Because Eu3+ replaces Y3+ in α-NaYF4, and thus occupies a symmetry site, the 5D07F1 transition at ~591 nm takes the dominate role, which gives rise to the orange-red emission rather than the red one. This yields a CIE chromaticity coordinate of (0.57, 0.42), seen in the final part of Figure 4. Tb3+ activated α-NaYF4 is one of the potential green phosphors, which may offer wide applications in lighting and display areas. In Figure 4b, the Tb3+-doped sample exhibits an excitation band in the range of 200–220 nm with a maximum at 208 nm, which could be attributed to the α-NaYF4 host excitation [17]. When excited at 208 nm, α-NaYF4:Tb3+ displays the typical 5D47FJ (J = 6 – 3) transitions of Tb3+ [17] at about 490, 545, 585, and 620 nm, with the green emission at 545 nm (5D47F5) being the strongest, which finally yields a CIE chromaticity coordinate of (0.34, 0.54), seen in the final part of Figure 4. Figure 4c displays the PLE/PL spectra for the Ce3+-activated α-NaYF4 sample. It exhibits a main absorption band at 246 nm in the UV region, because of the Ce3+ 4f-5d electron transition [18]. Under the excitation at 246 nm, the photoluminescence spectrum shows a strong emission band at 307 nm, resulting from the 5d-4f transition of Ce3+ [18], thereby yielding an ultraviolet (UV) emission (Figure 4, the final part) with a CIE chromaticity coordinate of (0.17, 0.05). In Figure 4d, the Er3+doped sample exhibits two strong excitation bands at 274 and 377 nm. When excited at 274 nm, the sample exhibits one dominant peak at 549 nm due to the 4S3/24I15/2 transition of Er3+ [19]. The corresponding CIE coordinate (0.23, 0.28) is located in the blue-green region, as shown in Figure 4 (the final part). The PLE/PL spectra of Na(Y0.99Tm0.01) F4 are exhibited in Figure 4e. Under excitation at 339 nm (the 3H61D2 transition of Tm3+), the emission spectrum presents one dominant peak at 490 nm, due to the 1G43H6 transition of Tm3+ [20]. The corresponding CIE coordinate (0.25, 0.32) is located in the blue region (Figure 4, the final part).
The obtained monospheres possess an excellent imaging capacity for the cells in vitro. Before cell imaging, surface-functionalization treatment is needed for the candidate particles. Massive hydroxyl groups were first grafted on the surfaces of the spheres via treatment with NaOH (Figure 5a). Then, sphere-NH2 was obtained through linking the amino groups with the hydroxyl groups (Figure 5a). After surface functionalization, the spherical shape and good dispersion are well maintained for the sphere-NH2 sample (Figure 5b). The FT-IR spectra of NaYF4:Eu3+ and NH2-NaYF4:Eu3+ are shown in Figure 5c. The strong absorption bands at ~3521 and ~3323 cm−1 (O-H) indicated successful surface hydroxylation [21,22,23]. The FT-IR spectra also show strong absorption bands at ~1596 and ~1518 cm−1 (stretching vibrations of N-H) and C-N stretching vibration band at ~1430 cm−1 [21,22,23], giving direct evidence of the successful modification of spheres with APTES. A luminescence solution is easily obtained by dispersing the NH2-NaYF4:RE3+ spheres in water in assistance of sonication treatment. However, luminescence signals from the solution dispersion of NH2-NaYF4:RE3+ (RE3+ = Ce3+, Er3+, and Tm3+) are very weak because of the strong quenching effect of water, indicating they are not suitable for cell imaging. Therefore, their luminescence spectra are not shown here. Figure S6 shows the luminescence spectra of the NH2-NaYF4:Eu3+ powder and NH2-NaYF4:Eu3+ solution dispersion, which exhibit similar luminescence emission spectra to their powder, although the weakened emission intensity is observed overall. However, the emission intensity decreases to a greater degree in a longer wavelength because of the quenching effect of water [24]. The emission intensity ratios of the 5D07F4 transition (Eu3+) at 697 nm and the 5D07F2 transition (Eu3+) at 615 nm to the 5D07F1 transition (Eu3+) at 591 nm decrease from ~0.58 and ~0.85 for the NaYF4:Eu3+ powder (Figure 4a) to 0.19 and 0.71 for the NH2-NaYF4:Eu3+ solution dispersion (Figure S6a). However, the intensity ratios of the 5D47F3 transition (Tb3+) at 620 nm and the 5D47F4 transition (Tb3+) at 585 nm to 5D47F5 transition (Tb3+) at 545 nm remain almost constant at ~0.17 and ~0.20 for the NaYF4:Tb3+ powder (Figure 4b) and NH2-NaYF4:Eu3+ solution dispersion (Figure S6b), indicating a stronger quenching effect of water on the Eu3+ transition than that on the Tb3+ one, which is similar to that observed for the tetragonal phosphate hydrates of the Y/Tb/Eu ternary system [24]. No emission signal at the near-infrared wavelength range is found for the NH2-NaYF4:Tb3+ solution dispersion (Figure S6b), but the NH2-NaYF4:Eu3+ solution dispersion exhibits the near-infrared emission at 697 nm, although the intensity is not high (Figure S6a).
Here, macrophages are selected for in vitro imaging. As shown in Figure 6a, a strong luminescence signal of NH2-NaYF4:Eu3+ in the macrophages can be precisely measured, and the nucleus and the cell wall can be clearly distinguished. For comparison, cell luminescence imaging was also performed by the NH2-NaYF4:Tb3+ for the same cells (Figure 6b). However, the signals are obviously weaker than that in Figure 6a, thus the nucleus and the cell wall cannot be clearly distinguished. Because NH2-NaYF4:Eu3+ can emit a near-infrared color at 697 nm (5D07F4 transitions of Eu3+), which has great advantages for bio imaging with a high signal-to-noise ratio [23], the results for the cell imaging are good. However, the green emission color generated from NH2-NaYF4:Tb3+ is located in the visible range, so the biological absorption of the cell organization and cell fluid contributes to the luminescence quench, and thus to the weak signals. Therefore, the NH2-NaYF4:Eu3+ probes have an excellent potential for use in imaging cells in vitro.

4. Conclusions

In this work, submicron-sized monodispersed spheres of RE3+-doped α-NaYF4 (RE = Eu, Tb, Ce, Er, and Tm) have been autoclaved from mixed solutions of rare earth nitrate solutions and ammonium fluoride (NH4F) in the presence of EDTA-2Na. The well-crystallized spheres are polycrystalline. The crystal structure and morphology of the hydrothermal products are independent of the processing conditions, including the reaction time and reaction temperature. After calcination at 600 °C, the original morphology and crystal structure are well retained. However, a reduction of particle sizes takes place, due to the crystallite growth and densification during calcination. Under excitation, the α-NaYF4 spheres exhibit multi-color emissions, which have an orange-red emission at ~591 nm (5D07F1 transition of Eu3+), green emission at ~545 nm (5D47F5 transition of Tb3+), ultraviolet (UV) emission at ~307 nm (5d-4f transition of Ce3+), blue-green emission at ~549 nm (4S3/24I15/2 transition of Er3+), and blue emission at ~490 nm (1G43H6 transition of Tm3+). The obtained NH2-NaYF4:Eu3+ monospheres possessing an excellent imaging capacity for cells in vitro, mainly because of their near-infrared emission at 697 nm (5D07F4 transition of Eu3+).

Supplementary Materials

The following are available online at https://www.mdpi.com/2073-4352/10/2/119/s1, Figure S1: FE-SEM micrographs showing morphologies of the Eu3+-doped α-NaYF4 samples synthesized at 180 °C for (a) 6 h, (b) 12 h, (c) 18 h.; Figure S2: XRD patterns of the Eu3+-doped α-NaYF4 samples synthesized at 180 °C for (a) 6 h, (b) 12 h; Figure S3: FE-SEM micrographs showing morphologies of the Eu3+-doped α-NaYF4 samples synthesized at (a) 100 °C, (b) 120 °C, (c) 150 °C for 24 h. (c) 18 h, (d) 24 h; Figure S4: XRD patterns of the Eu3+-doped α-NaYF4 samples synthesized at (a) 100 °C, (b) 120 °C, (c) 150 °C, and (d) 180 °C for 24 h; Figure S5: FE-SEM micrographs showing morphologies of (a) Eu3+-, (b) Tb3+-, (c) Ce3+-, (d) Er3+-, (e) Tm3+-doped α-NaYF4 samples calcined at 600 °C; Figure S6: Emission spectra of colloidal solution at room temperature with (a) NH2-NaYF4:Eu3+ and (b) NH2-NaYF4:Tb3+.

Author Contributions

Q.Z. conceived the project; X.F., L.G., and Y.H. carried out the experiments and data analysis; Q.Z. and X.F. drafted the manuscript. All the authors were involved in the results discussion. All authors have read and agreed to the published version of the manuscript.

Funding

This research was funded by the Fundamental Research Funds for the Central Universities (grant N172002001) and the National Training Program of Innovation and Entrepreneurship for undergraduates (201910145114).

Acknowledgments

This work was supported by the Fundamental Research Funds for the Central Universities (grant N172002001) and the National Training Program of Innovation and Entrepreneurship for undergraduates (201910145114).

Conflicts of Interest

The authors declare no conflict of interest.

References

  1. Blasse, G.; Grabmair, B.C. Luminescent Materials; Springer: Berlin/Heidelberg, Germany, 1994. [Google Scholar]
  2. Liu, Y.S.; Tu, D.T.; Zhu, H.M.; Chen, X.Y. Lanthanide-doped luminescent nanoprobes: Controlled synthesis, optical spectroscopy, and bio applications. Chem. Soc. Rev. 2013, 42, 6924–6958. [Google Scholar] [CrossRef]
  3. Wang, F.; Han, Y.; Lim, C.S.; Lu, Y.; Wang, J.; Xu, J.; Chen, H.; Zhang, C.; Hong, M.; Liu, X. Simultaneous phase and size control of upconversion nanocrystals through lanthanide doping. Nature 2010, 463, 1061–1065. [Google Scholar] [CrossRef]
  4. Li, C.X.; Lin, J. Rare earth fluoride nano-/microcrystals: Synthesis, surface modification and application. J. Mater. Chem. 2010, 20, 6831–6847. [Google Scholar] [CrossRef]
  5. Yang, B.; Zeng, H.D.; Zhang, Y.Y.; Deng, Y.F.; Guo, Y.Y.; Chen, J.D.; Chen, G.R. Enhanced NIR down-conversion of Yb3+ in fluorosilicate glass-ceramics co-doped with Bi ions. Opt. Mater. 2018, 84, 189–194. [Google Scholar] [CrossRef]
  6. Dan, H.K.; Qiu, J.B.; Zhou, D.C.; Wang, R.F. Broadband near-infrared emission and energy transfer in Nd-Bi co-doped transparent silicate glass-ceramics for optical amplifiers. Opt. Mater. 2018, 85, 517–522. [Google Scholar] [CrossRef]
  7. Li, X.Y.; Liu, X.W.; Chevrier, D.M.; Qin, X.; Xie, X.J.; Song, S.Y.; Zhang, H.J.; Zhang, P.; Liu, X.G. Energy migration upconversion in manganese (II)-doped nanoparticles. Ange. Chem. Int. Ed. 2015, 54, 13312–13317. [Google Scholar] [CrossRef]
  8. Zhu, Q.; Song, C.Y.; Li, X.D.; Sun, X.D.; Li, J.-G. Up-conversion monodispersed spheres of NaYF4:Yb3+/Er3+: Green and red emission tailoring mediated by heating temperature, and greatly enhanced luminescence by Mn2+ doping. Dalton Trans. 2018, 47, 8646–8655. [Google Scholar] [CrossRef]
  9. Xu, X.; Wang, Z.; Lei, P.P.; Yu, Y.N.; Yao, S.; Song, S.Y.; Liu, X.L.; Su, Y.; Dong, L.L.; Feng, J.; et al. α-NaYb(Mn)F4:Er3+/Tm3+@NaYF4 UCNPs as “band-shape” luminescent nanothermometers over a wide temperature range. ACS Appl. Mater. Interfaces 2015, 7, 20813–20819. [Google Scholar] [CrossRef]
  10. Yang, D.M.; Kang, X.J.; Ma, P.A.; Dai, Y.L.; Hou, Z.Y.; Cheng, Z.Y.; Li, C.X.; Lin, J. Hollow structured upconversion luminescent NaYF4:Yb3+, Er3+nanospheres for cell imaging and targeted anti-cancer drug delivery. Biomaterials 2013, 34, 1601–1612. [Google Scholar] [CrossRef]
  11. Luo, R.; Li, T.; Chen, Y.; Ning, Z.; Zhao, Y.; Liu, M.; Lai, X.; Zhong, C.; Wang, C.; Bi, J.; et al. Na(1-x)Lix(Gd0.39Y0.39Yb0.2Er0.02)F4 (0≤ x≤1) solid solution microcrystals: Li/Na ratio-induced transition of crystalline phase and morphology and their enhanced upconversion emission. Cryst. Growth Des. 2018, 18, 6581–6590. [Google Scholar] [CrossRef]
  12. Leménager, G.; Thiriet, M.; Pourcin, F.; Lahlil, K.; Valdivia-Valero, F.; Colas des Francs, G.; Gacoin, T.; Fick, J. Size-dependent trapping behavior and optical emission study of NaYF4 nanorods in optical fiber tip tweezers. Opt. Express 2018, 26, 32156–32167. [Google Scholar] [CrossRef] [PubMed]
  13. Zhang, Y.Y.; Wang, Y.; Deng, J.Q.; Wang, J.; Ni, S.C. Highly efficient Yb3+/Tm3+ co-doped NaYF4 nanotubes: Synthesis and intense ultraviolet to infrared up-conversion luminescence. Opt. Commun. 2014, 312, 43–46. [Google Scholar] [CrossRef]
  14. Zhu, Q.; Li, J.-G.; Zhi, C.; Li, X.D.; Sun, X.D.; Sakka, Y.; Golberg, D.; Bando, Y. Layered rare-earth hydroxides (LRHs) of (Y1-xEux)2(OH)5NO3·nH2O (x=0-1): Structural variations by Eu3+ doping, phase conversion to oxides, and the correlation of photoluminescence behaviors. Chem. Mater. 2010, 22, 4204–4213. [Google Scholar] [CrossRef]
  15. Judd, B.R. Optical Absorption Intensities of Rare-Earth Ions. Phys. Rev. 1962, 127, 750–761. [Google Scholar] [CrossRef]
  16. Ofelt, G.S. Intensities of Crystal Spectra of Rare-Earth Ions. J. Chem. Phys. 1962, 37, 511–520. [Google Scholar] [CrossRef]
  17. Zhang, D.P.; Yue, Z.; Liu, Z.Y. Dual-mode luminescent core-shell nanoarchitectures for highly sensitive optical nanothermometry. J. Alloys Compd. 2019, 787, 585–593. [Google Scholar] [CrossRef]
  18. Zhu, Q.; Xu, Z.X.; Wang, Z.H.; Wang, X.J.; Li, X.D.; Sun, X.D.; Li, J.-G. Multi-color emission in monodispersed spheres of tetragonal yttrium phosphate: Microwave-assisted fast synthesis, formation mechanism, temperature-dependent luminescence, and application in anti-fake label. CrystEngComm 2018, 20, 3187–3201. [Google Scholar] [CrossRef]
  19. Wang, D.; Zhang, P.; Ma, Q.; Zhang, J.; Wang, Y.H. Synthesis, optical properties and application of Y7O6F9:Er3+ for sensing the chip temperature of a light emitting diode. J. Mater. Chem. C 2018, 6, 13352–13358. [Google Scholar] [CrossRef]
  20. Zhang, J.J.; Qiao, B.; Liang, Z.Q.; Zuo, P.F.; Wu, Q.X.; Xu, Z.; Piao, L.Y.; Zhao, S.L. Near-infrared light-induced photocatalysis of NaYF4:Yb,Tm@Cu2O core-shell nanocomposites. Opt. Mater. 2018, 84, 89–93. [Google Scholar] [CrossRef]
  21. Nakamoto, K. Infrared Spectra of Inorganic & Coordination Compounds; John Wiley & Sons: New York, NY, USA, 1963. [Google Scholar]
  22. Gadsden, J.A. Infrared Spectra of Minerals and Related Inorganic Compounds; Butterworth: Newton, MA, USA, 1975. [Google Scholar]
  23. Abdukayum, A.; Chen, J.-T.; Zhao, Q.; Yan, X.-P. Functional near infrared-emitting Cr3+/Pr3+ co-doped zinc gallogermanate persistent luminescent nanoparticles with superlong afterglow for in vivo targeted bioimaging. J. Am. Chem. Soc. 2013, 135, 14125–14133. [Google Scholar] [CrossRef]
  24. Zhu, Q.; Xu, Z.X.; Li, X.D.; Li, J.-G. Tetragonal (Y,Ln)PO4·nH2O (Ln=Tb/Eu) colloidal spheres for color tunable photoluminescence and the effects of hydration. Opt. Mater. 2019, 92, 71–80. [Google Scholar] [CrossRef]
Figure 1. FE-SEM (ae) and TEM (f) micrographs showing morphologies of the as prepared (a,f) Eu3+-, (b) Tb3+-, (c) Ce3+-, (d) Er3+-, and (e) Tm3+-doped α-NaYF4 samples, respectively. The inset in (f) is the selected area electron diffraction (SAED) patterns of Eu3+-doped sample.
Crystals 10 00119 g001
Figure 2. XRD patterns of the as prepared (a) Eu3+-, (b) Tb3+-, (c) Ce3+-, (d) Er3+-, and (e) Tm3+-doped α-NaYF4 samples.
Crystals 10 00119 g002
Figure 3. XRD patterns of (a) Eu3+-, (b) Tb3+-, (c) Ce3+-, (d) Er3+-, and (e) Tm3+-doped α-NaYF4 samples calcined at 600 °C.
Crystals 10 00119 g003
Figure 4. PLE and PL spectra of (a) Eu3+-, (b) Tb3+-, (c) Ce3+-, (d) Er3+-, and (e) Tm3+-doped α-NaYF4 samples calcined at 600 °C. The final part is the corresponding CIE chromaticity diagram.
Crystals 10 00119 g004
Figure 5. (a) Schematic diagram for the surface modification particles, (b) FE-SEM micrographs showing the morphology of NH2-NaYF4:Eu3+, and (c) the FT-IR spectra of NaYF4:Eu3+ and NH2-NaYF4:Eu3+.
Crystals 10 00119 g005
Figure 6. LSCM (Laser Scanning Confocal Microscope) images of macrophages after being cultured with (a) NH2-NaYF4:Eu3+ and (b) NH2-NaYF4:Tb3+. The display color is a fake color automatically assigned by the test system.
Crystals 10 00119 g006

