Article

Influence of Trapped Gas on Pore Healing under Hot Isostatic Pressing in Nickel-Base Superalloys

ICAMS, Ruhr-Universität Bochum, 44801 Bochum, Germany
*
Author to whom correspondence should be addressed.
Crystals 2020, 10(12), 1147; https://doi.org/10.3390/cryst10121147
Submission received: 11 November 2020 / Revised: 11 December 2020 / Accepted: 14 December 2020 / Published: 17 December 2020
(This article belongs to the Special Issue Crystal Plasticity)

Abstract

:
Under the typical hot isostatic pressing (HIP) processing conditions, plastic deformation by dislocation slip is considered the primary mechanism for pore shrinkage, according to experimental observations and deformation mechanism maps. In the present work, a crystal plasticity model has been used to investigate the influence of applied pressure and holding time on porosity reduction in a nickel-base single crystal superalloy. The influence of trapped gas on pore shrinkage is modeled by coupling mechanical deformation with pore–gas interaction. In qualitative agreement with experimental investigations, we observe that increasing the applied pressure or the holding time can effectively reduce porosity. Furthermore, the effect of pore shape on the shrinkage is observed to depend on a combination of elastic anisotropy and the complex distribution of stresses around the pore. Simulation results also reveal that, for pores of the same shape, smaller pores (radius < 0.1 μm) have a higher shrinkage rate in comparison to larger pores (radius ≥ 0.1 μm), which is attributed to the increasing pore surface energies with decreasing pore sizes. It is also found that, for smaller initial gas-filled pores (radius < 0.1 μm), HIP can result in very high gas pressures (on the order of GPa). Such high pressures either act as a driving force for argon to diffuse into the surrounding metal during HIP itself, or it can result in pore re-opening during subsequent annealing or mechanical loading. These results demonstrate that the micromechanical model can quantitatively evaluate the individual influences of HIP processing conditions and pore characteristics on pore annihilation, which can help optimize the HIP process parameters in the future.

1. Introduction

Modern gas turbine blades in aero-engines are usually made of nickel-base superalloys, solidified as single crystals to obtain excellent resistance to extreme working conditions such as temperatures up to 1100 °C as well as static and cyclic loading. In nickel-base single crystal superalloys, the outstanding deformation resistance at elevated temperatures is due to the absence of grain boundaries, precipitate strengthening by coherent cuboidal γ phases (L1 2 crystal structure) homogeneously distributed in the γ (face centered cubic) matrix, and the solid solution strengthening of both γ and γ phases by adding a high concentration of refractory elements. Nevertheless, a higher degree of dendritic segregation during solidification and void formation in the interdendritic region during casting and extensive homogenization tend to occur, which deteriorates the mechanical properties [1,2,3]. In order to heal these microvoids, hot isostatic pressing (HIP) is utilized as an advanced thermal treatment [4], which combines plastic deformation, creep, and diffusion bonding [5,6] to reduce the voids through appropriate pressing at high temperatures [7,8]. For nickel-base superalloys, a typical HIP cycle consists of holding the material at ∼1280 °C (close to the γ -solvus temperature) and at a constant pressure of ∼200 MPa for 2–5 h [9,10]. In order to optimize the HIP parameters, it is necessary to understand the void reduction in this process by numerical modeling.
Another aspect to be considered during modeling is the presence of gas inside pores and its influence on pore closure. In recent manufacturing techniques such as additive manufacturing (AM) [11], parts are fabricated in an inert atmosphere, and thus the formation of pores filled with gas (argon) is a real possibility [12,13]. As microstructural defects such as porosity can be very detrimental to the effective mechanical property of the fabricated material [14,15], more research has been focused on alleviating these defects [13,16]. Experimental investigations have analyzed the influence of AM process parameters on the resulting porosity and have shown that the porosity can be reduced to a greater extent during the fabrication [13]. Nevertheless, HIP is available to be used as a post-AM process to eliminate porosity and has been in active research in the AM community [17,18]. Although HIP has been shown to eliminate voids in parts fabricated by casting and sintering, its effectiveness in eliminating pores in AM-fabricated parts is uncertain [19]. Some studies claim that HIP can completely eliminate the pores resulting in fully dense AM parts [16,17,18], while others have shown that HIP has limited effectiveness in removing pores [19,20]. In the works of Tammas-Williams et al. [20], X-ray computed tomography has been used to track individual pores found in AM-fabricated titanium. From their detailed experimental analysis, it has been confirmed that all the pores that appear during the heat treatment stages (subsequent to HIP) can be correlated to the locations of pores in the original build. Evidently, these pores had disappeared during HIP but reappeared during the subsequent annealing. Thus, it is vital to investigate the influence of HIP process parameters on pore shrinkage and also to understand the kinetics and mechanism of pore annihilation by modeling the pore–gas interaction.
At present, there is only one publication [21] focusing on the modeling of void annihilation in a nickel-base single crystal superalloy during HIP. This simulation applies to one void under one HIP condition. Our work aims to develop a crystal plasticity finite element model that is not only able to model the shrinkage of voids but also the influence of trapped gas and its resistance to pore shrinkage. Since void annihilation is mainly attributed to dislocation glide [21], our model is based on the phenomenological crystal plasticity constitutive laws. In addition, the self-diffusion of atoms assists the shrinkage of pores due to thermal disturbance at high temperature [7]. This mechanism is treated as a temperature-dependent coefficient of the strain rate in the current model. The mechanical response of a gas-filled pore is modeled by coupling the deformation of the material and the pressure exerted by the trapped gas on the pore surface. The current work investigates the influence of pore characteristics on pore shirnkage and the effect of HIP parameters such as isostatic pressures and holding times on the pore annihilation. Throughout this manuscript, a distinction between voids and pores is made unless mentioned otherwise; pores that do not contain trapped gas are referred to as voids.

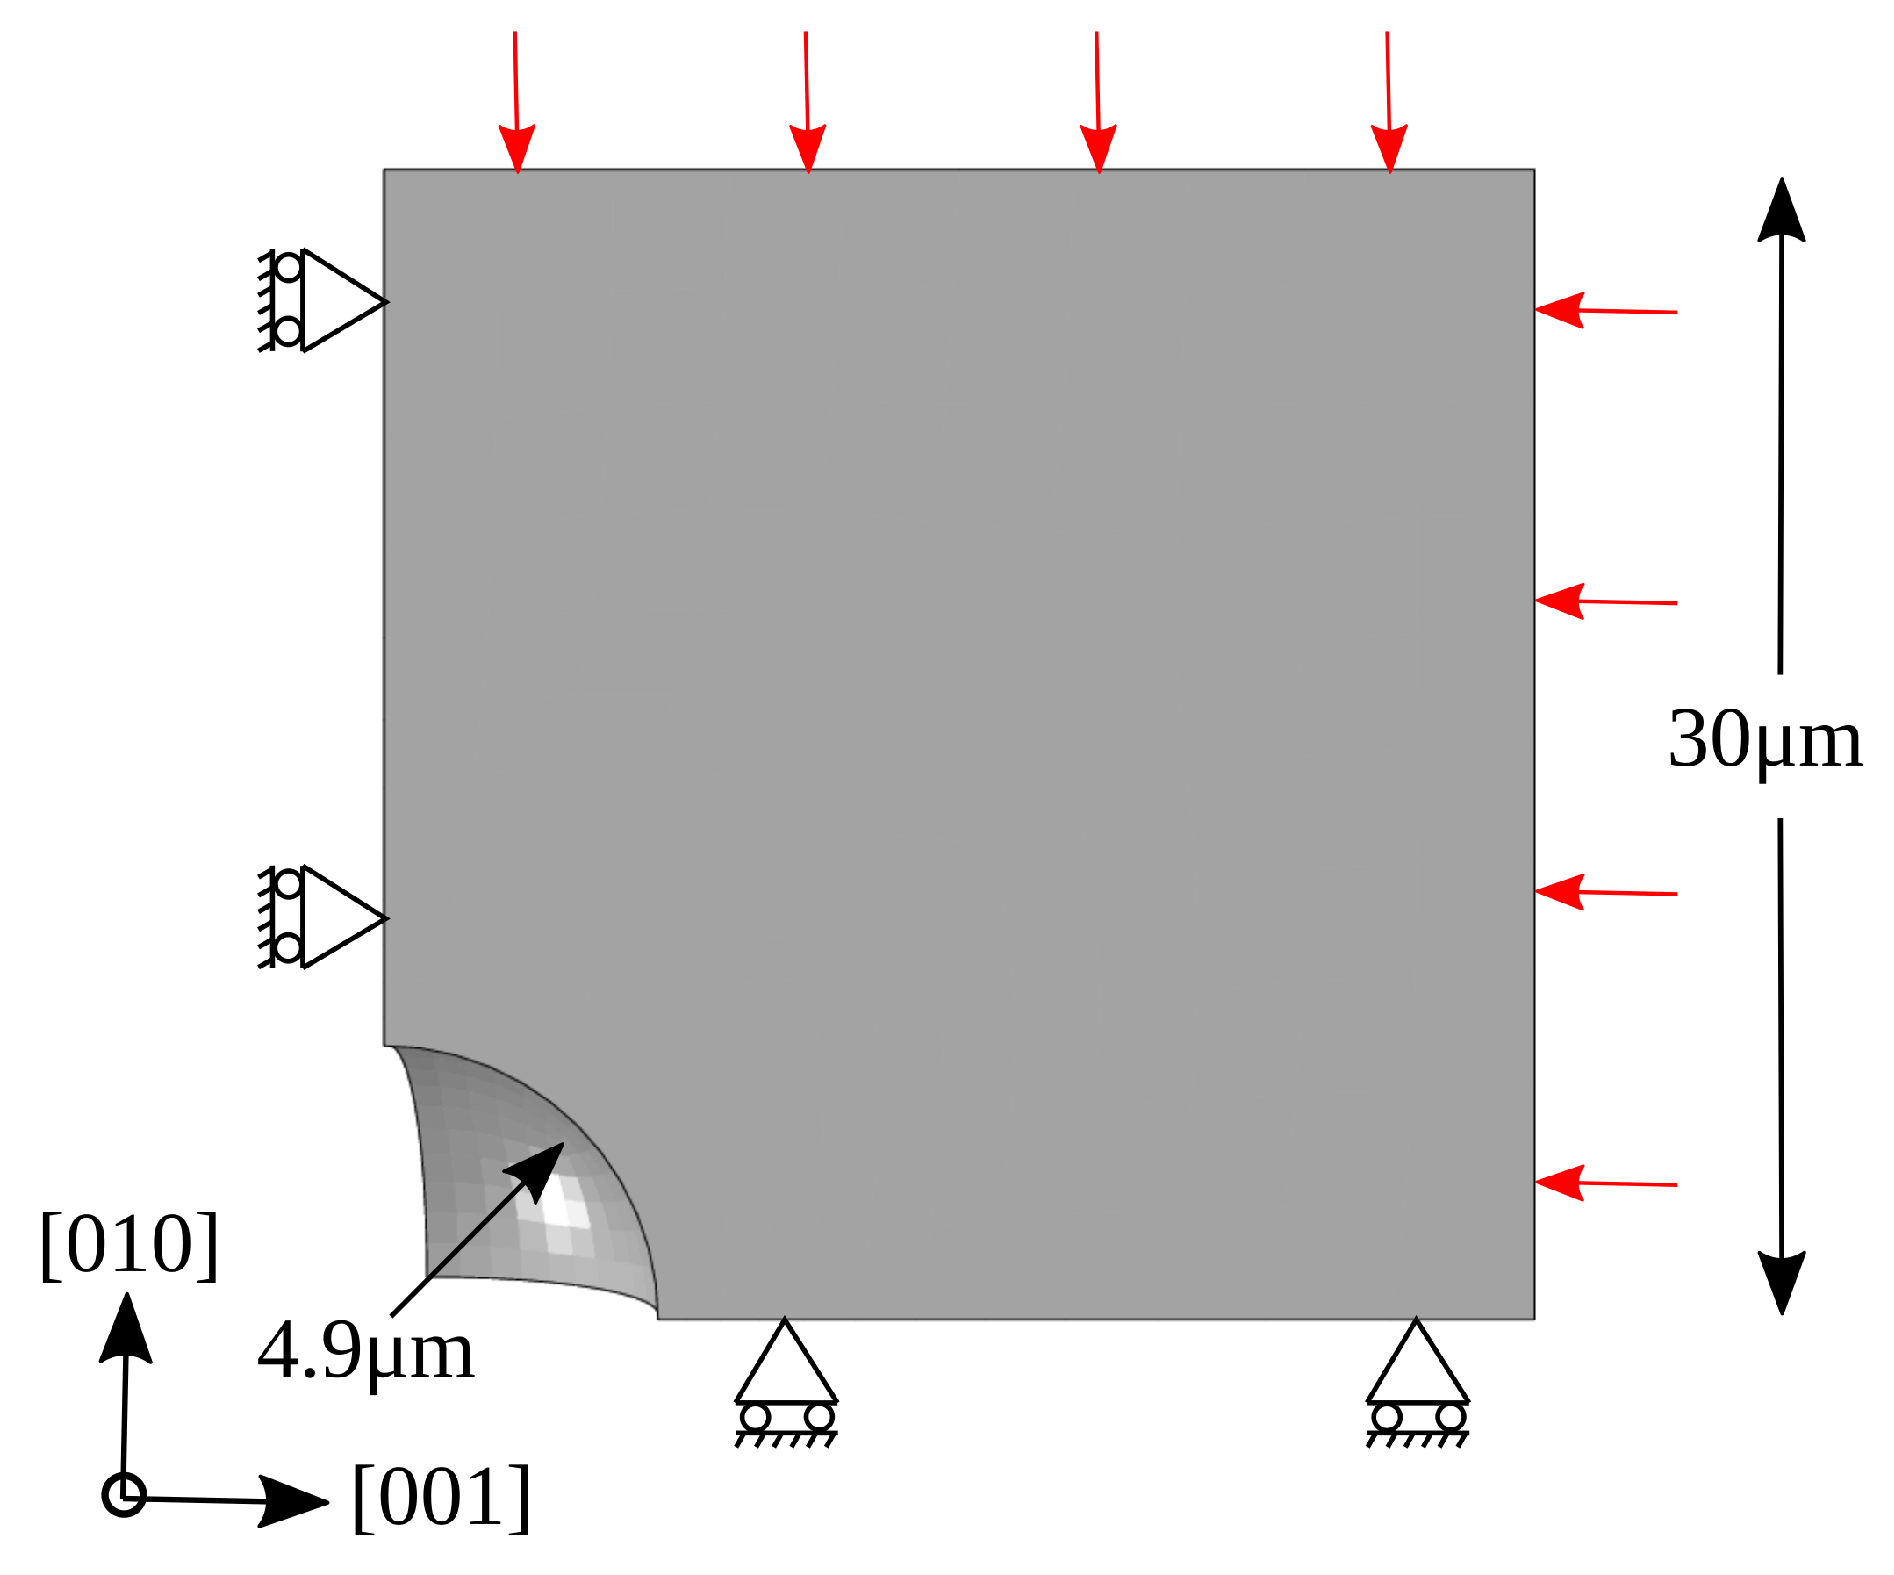
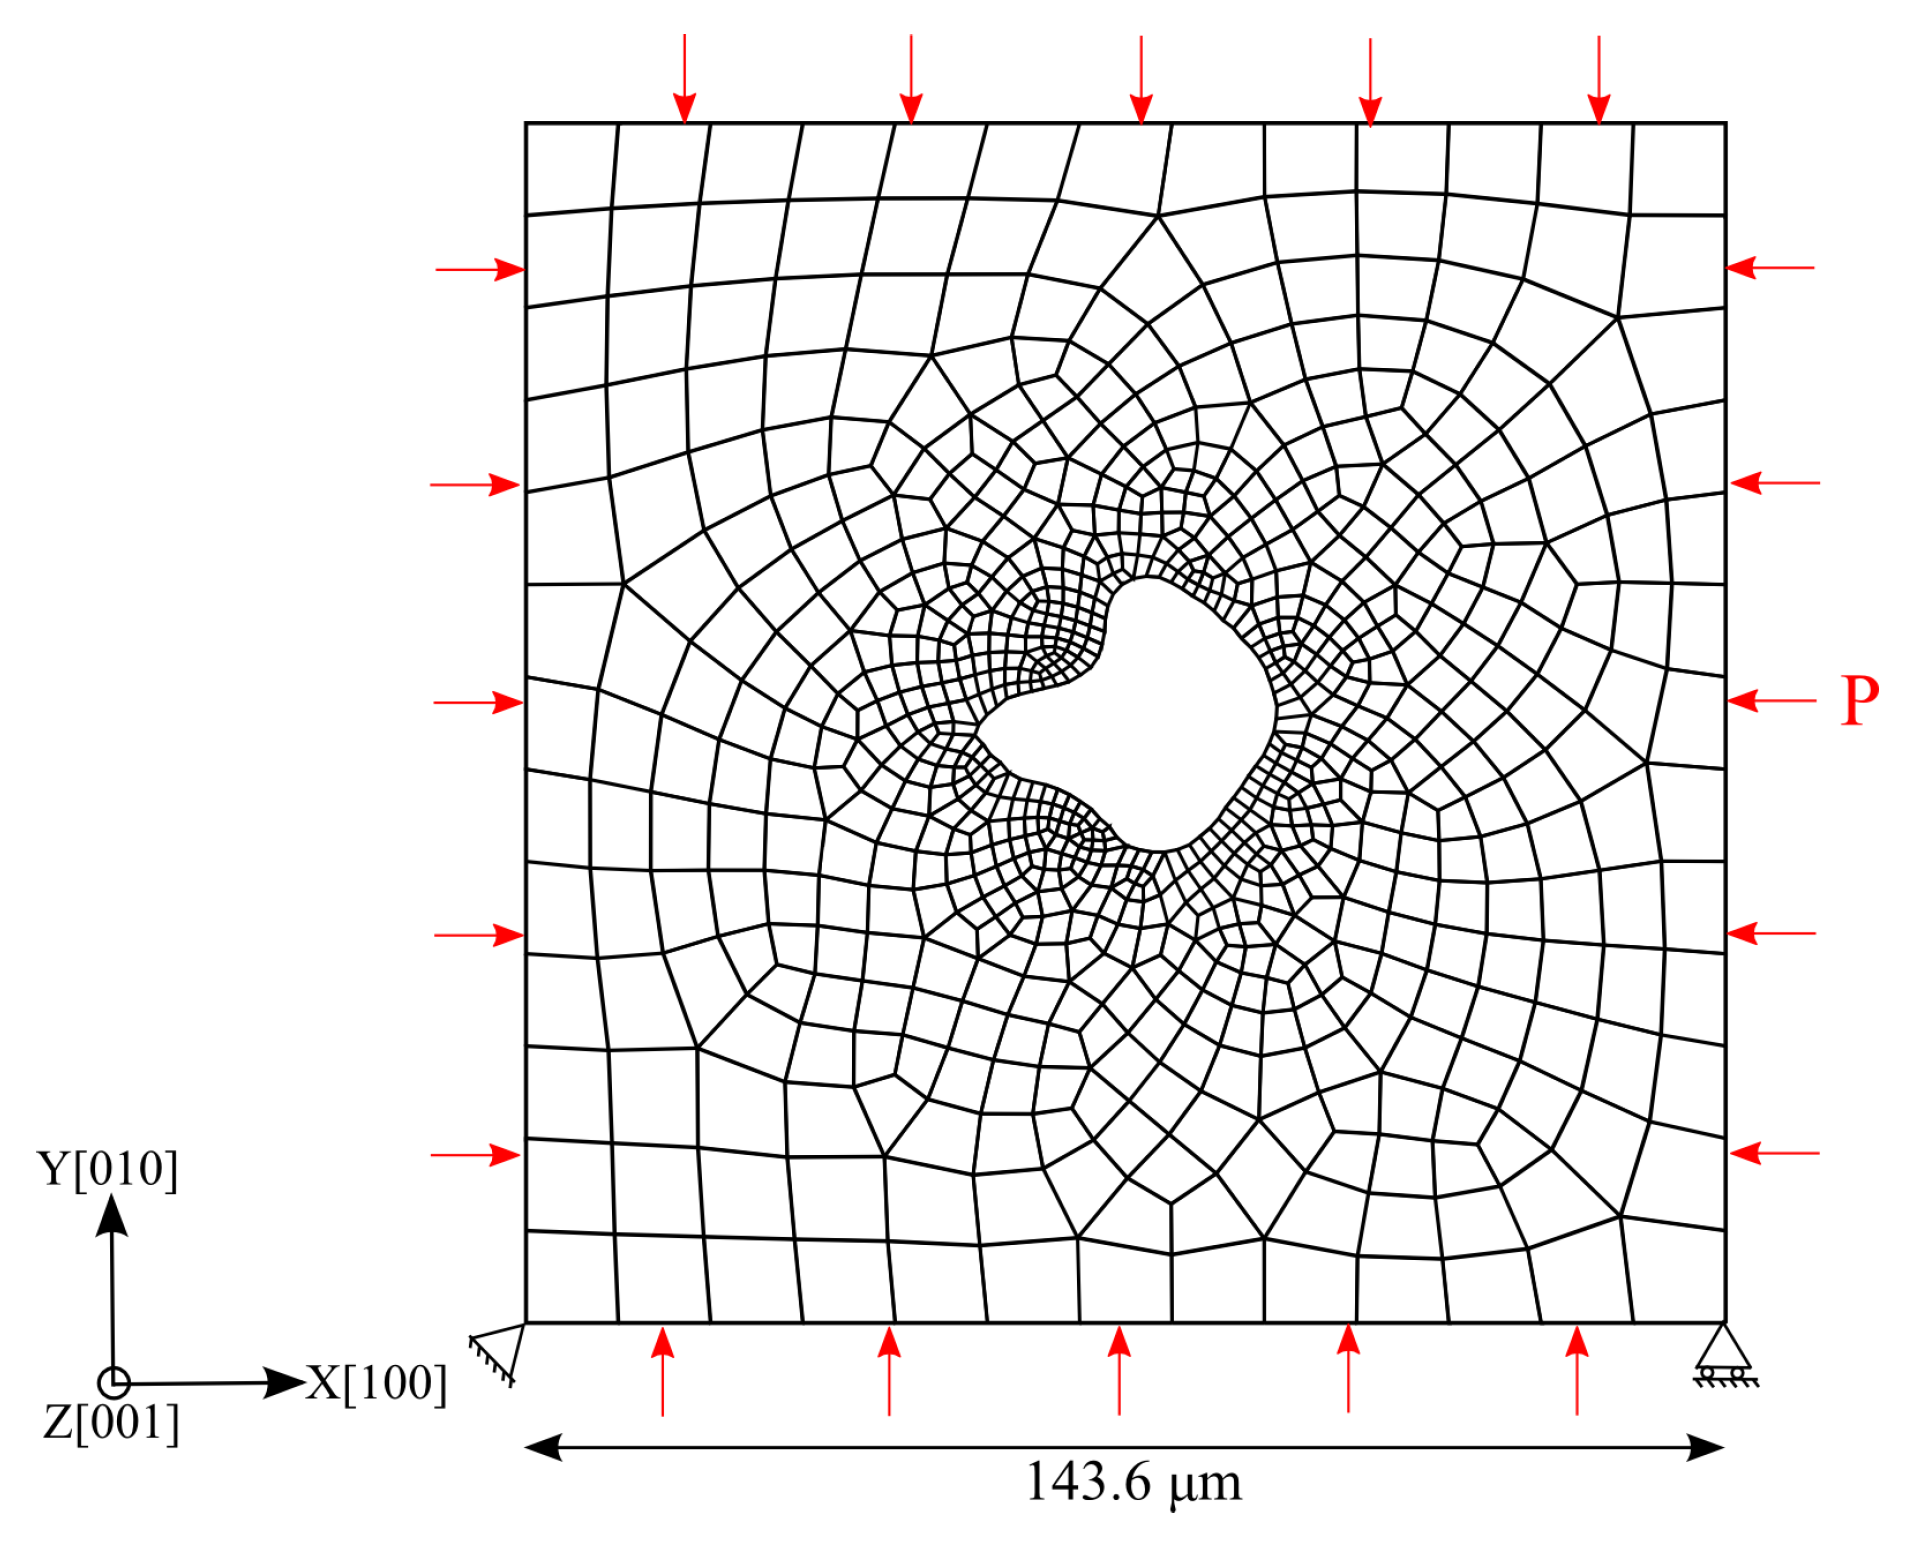
2. Micromechanical Modeling

This section presents the basics of the developed micromechanical model. In the detailed experimental investigation conducted by Epishin et al. [22], it was shown that slip of dislocations on the octahedral planes is the dominant deformation mechanism in a single-crystal superalloy at 1561 K. In addition, the deformation mechanism map [23] also indicates that dislocation glide operates in the considered HIP temperature and stress regimes. Based on these observations, the crystal plasticity (CP) method is used in this work to predict the plastic deformation behavior of the material, and the gas interaction is coupled with the mechanical deformation by using the surface-based fluid cavity model of Abaqus [24]. The CP model is implemented in a user-defined material subroutine (UMAT) to capture the creep response, and the behavior of the gas is modeled by using a user-defined fluid subroutine (UFLUID). A strict insoluble condition is assumed for the gas, hence the mass of gas in the pore does not change. Since the focus of the current work is to systematically analyze the pore closure mechanism during HIP, certain simplifications regarding the pore locations are made. The pores are assumed to be located in the grain bulk and the influence of grain boundaries on the pore closure through vacancy diffusion is not modeled here. In the following subsections, different aspects of the modeling approach, such as the ultra-high-temperature CP model, modeling gas inside pores, and model parameterization, are detailed.

2.1. Crystal Plasticity Model

Starting from the kinematics of deformation [25], the deformation gradient F on the macroscopic level can be multiplicatively decomposed into an elastic deformation part F e and a plastic deformation part F p as follows:
F = F e F p
With the help of an average elastic stiffness tensor C ¯ on the macroscopic level, the second Piola–Kirchhoff stress in the intermediate configuration is calculated by
S ˜ = C ¯ 1 2 F e T F e I
where I is the second order unit tensor. Based on the dislocation slip controlled plastic deformation mechanism, the common resolved shear stress for each slip system α is
τ α = S ˜ : M ˜ α
where M ˜ α is the Schmid tensor. Thus, the flow rule is given by
γ ˙ α = A G b D 0 k B T exp Q s d R T τ α τ ^ α slip τ α soft p 1 sign ( τ α )
where γ ˙ α is the shear rate, G is the shear modulus, b is the magnitude of Burgers vector of the dislocation, k B is the Boltzmann constant, A is a material constant, D 0 is the pre-exponential frequency factor of the self-diffusion coefficient, Q s d is the activation energy of self-diffusion, R is the Gas constant, T is the temperature, p 1 is the inverse value of the strain rate sensitivity, and τ ^ α slip is the slip resistance determined by
τ ^ ˙ α slip = β = 1 N s h 0 χ α β 1 τ ^ β slip τ ^ sat p 2 γ ˙ β
where N s is the number of slip systems, h 0 is the initial hardening rate, χ α β is the cross hardening matrix, τ ^ sat is the saturation slip resistance due to dislocation density accumulation, and p 2 is a fitting parameter.
The creep behavior of single-crystal CMSX-4 alloy at the HIP treatment temperature (1561 K) has been experimentally investigated by Epishin et al. [21,22]. Please note that this temperature lies above the γ solvus temperature such that the material consists only of γ phase. It is observed that at this super-solvus temperature, the superalloy is very soft and rapidly deforms under stresses between 4 MPa and 16 MPa. This is due to the dissolution of the strengthening γ -precipitate at this ultra-high homologous temperature. To account for this time induced softening behavior, τ α soft is introduced in the flow rule (Equation (4)) to counteract the hardening. Evolution of this high temperature softening stress is given by
τ α soft = v 1 tan h ( v 2 ϵ γ )
where v 1 is the softening stress, and v 2 defines the rate of softening. These parameters are computed during the fitting process, described in Section 2.2.

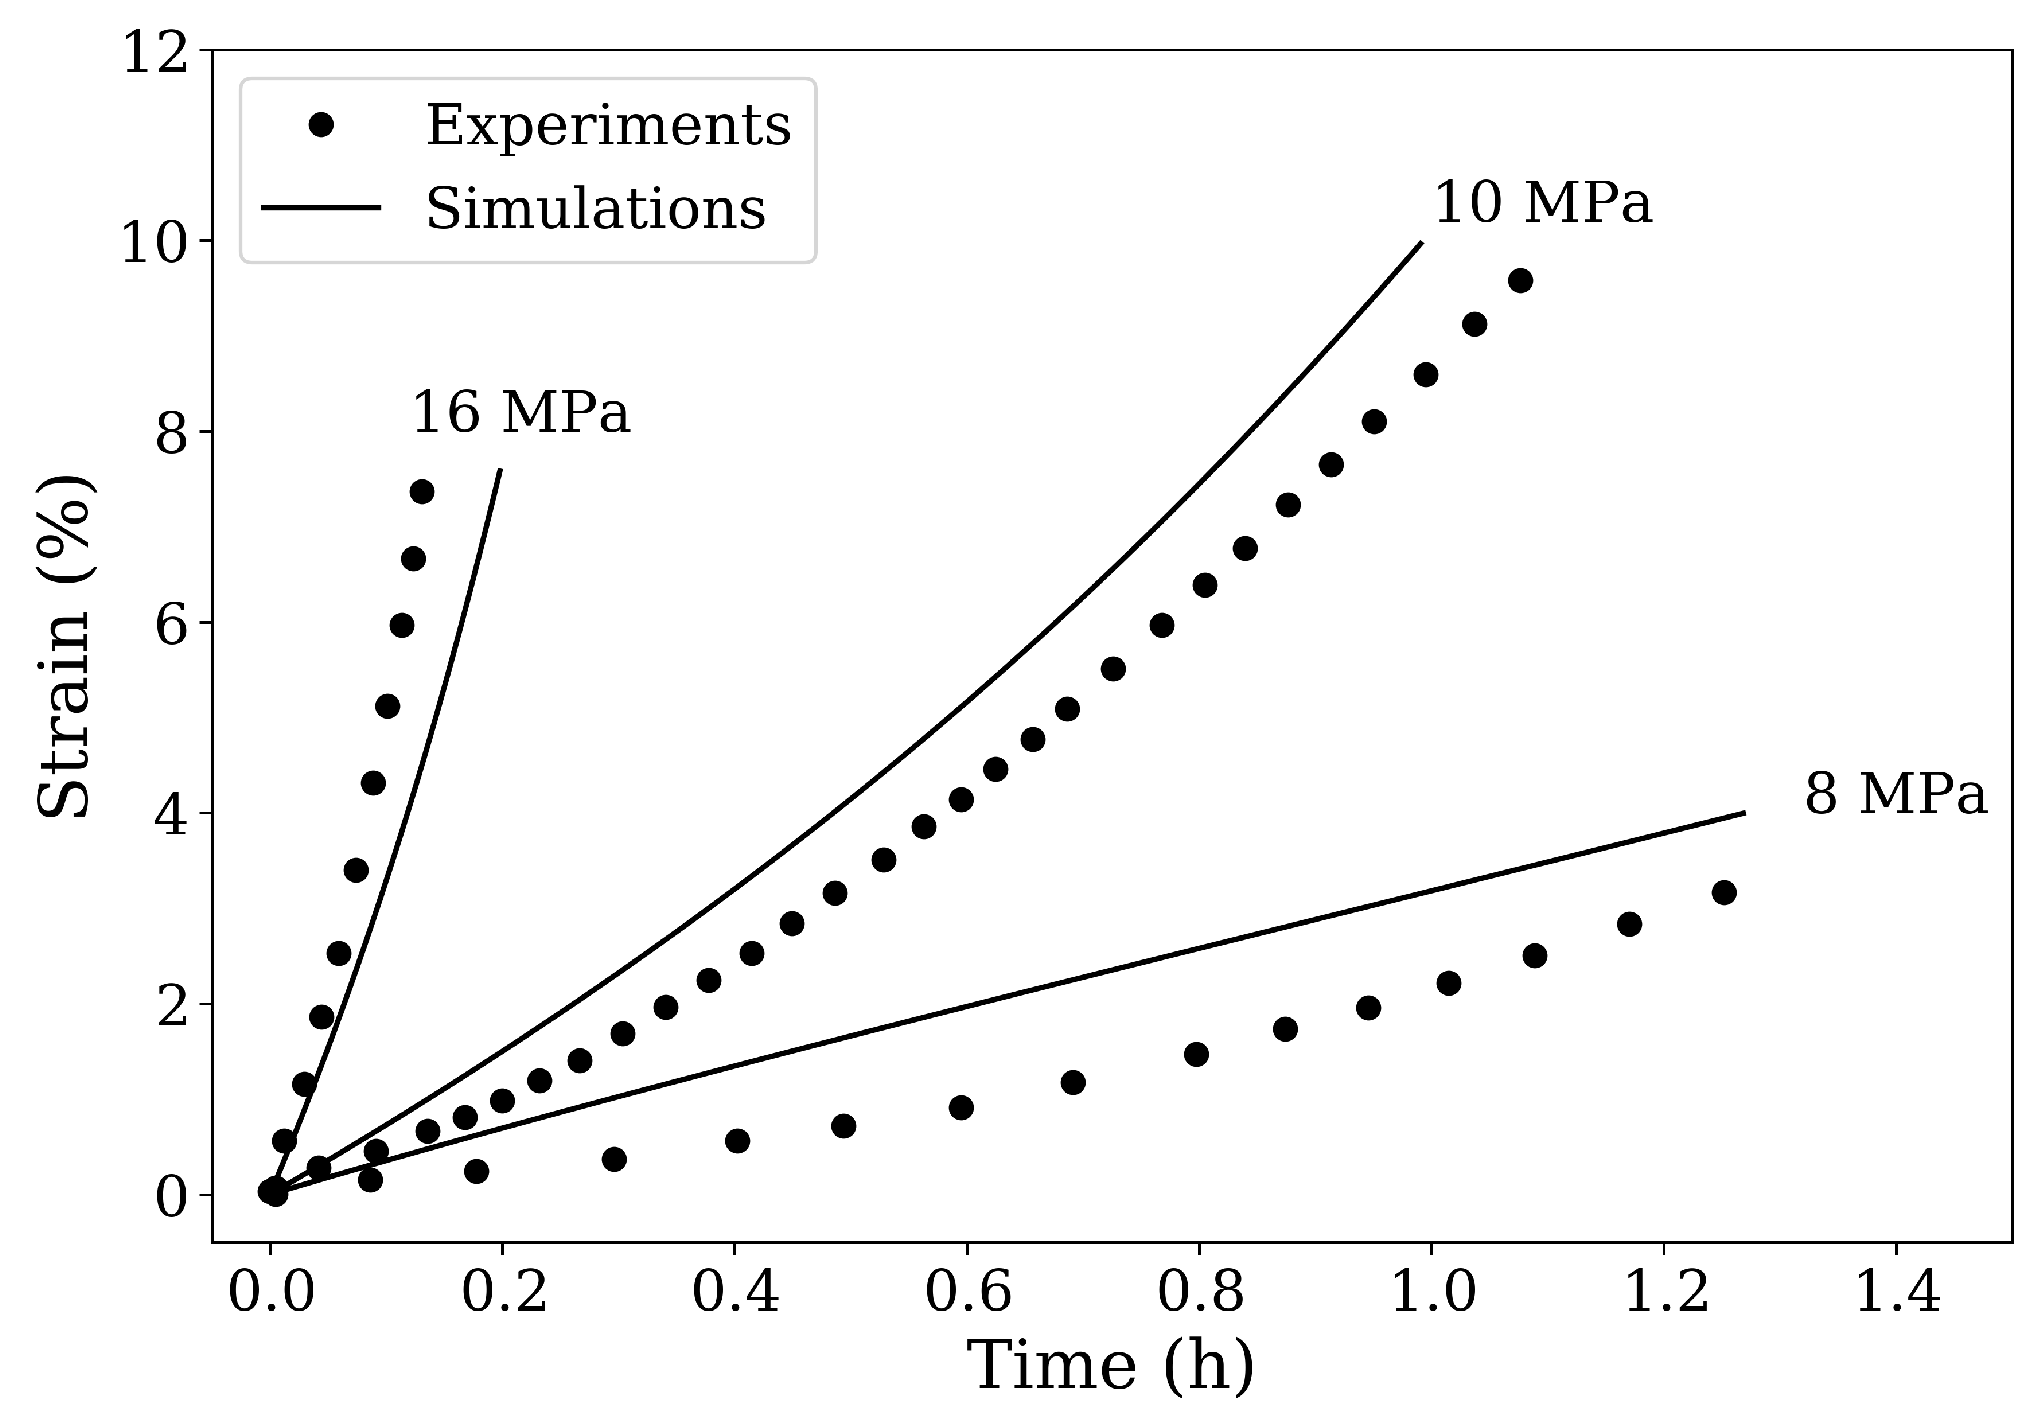
2.2. Model Calibration

The constitutive model described in the previous section is implemented as a user-defined material subroutine. Creep simulations for the CMSX-4 superalloy are performed at a temperature 1561 K and stresses between 4 MPa and 16 MPa. The temperature-dependent elastic constants of CMSX-4 ( c 11 = 185 GPa, c 12 = 154.9 GPa, and c 44 = 69.4 GPa) and the experimental creep curves for the various loading test cases are obtained from the works of Epishin et al. [21,22]. These tensile creep curves are used as reference here for comparison and model validation. A simple 3D finite element model is set up to represent a sample of single crystal superalloys. By using the material parameters given in Table 1, a good fit to 10 MPa experimental creep curve is first obtained (see Figure 1). Subsequently, the model is validated using the 8 MPa and 16 MPa tensile creep load cases, as shown in Figure 1. This calibrated creep model can now be used to study the pore shrinkage mechanism during the HIP process.
It has been reported in [3,21], by synchrotron tomography investigations, that the shape of the pores in heat-treated CMSX-4 is approximately spherical, and the volume fraction of the voids has been estimated to be about 0.23% [21]. Using this as initial reference porosity, a spherical void with a volume fraction of 0.23% is modeled in the microstructure. Assuming the void is located in the middle of cube-shaped material, only 1/8th dimension of the complete model is used in the calculation, due to symmetrical geometry. The representative 3D setup is shown as a planar view in Figure 2 with loads and boundary conditions. To reach a compromise between the computational cost and the solution accuracy, 1648 hexahedral elements are used. The standard Abaqus self-contact algorithms (frictionless) are set on the free surface of the void to treat the contact interaction during void closure.
Following the experimental HIP conditions reported in [21], in the first step (henceforth referred to as Stage 1), a 103 MPa isostatic pressure is applied on the surrounding borders at 1561 K for 10 min. This is followed by the holding step (henceforth referred to as Stage 2), where the temperature and the pressure are held constant for 6 h. The void volume fraction is plotted against the HIP simulation time in Figure 3. The experimental and the Epishin HIP model volume fraction evolution curves are obtained from [21]. The root mean square error (RMSE) between the experimental and the current model curves is computed to be 0.024. Comparing the curves and considering the RMSE value obtained, reasonably good agreement can be observed between the experimental and the current model simulation results.
The two stages of the HIP process are indicated in the inset of Figure 3 as Stage 1 and Stage 2. It is important to note here that the void closure already begins during Stage 1 and that the closure rate at this stage is very high in comparison to Stage 2. The decrease in the closure rate at the end of Stage 2 is due to the relaxation of the von Mises stresses around the void. The von Mises stress fields as well as the plastic strain contours around the spherical void under the isostatic pressure are depicted in Figure 8. In practice, the material has many voids with various sizes, which will indeed influence the void annihilation behavior. However, our simplified model with its unique round void can capture the main regulation of void reduction and is computationally efficient.

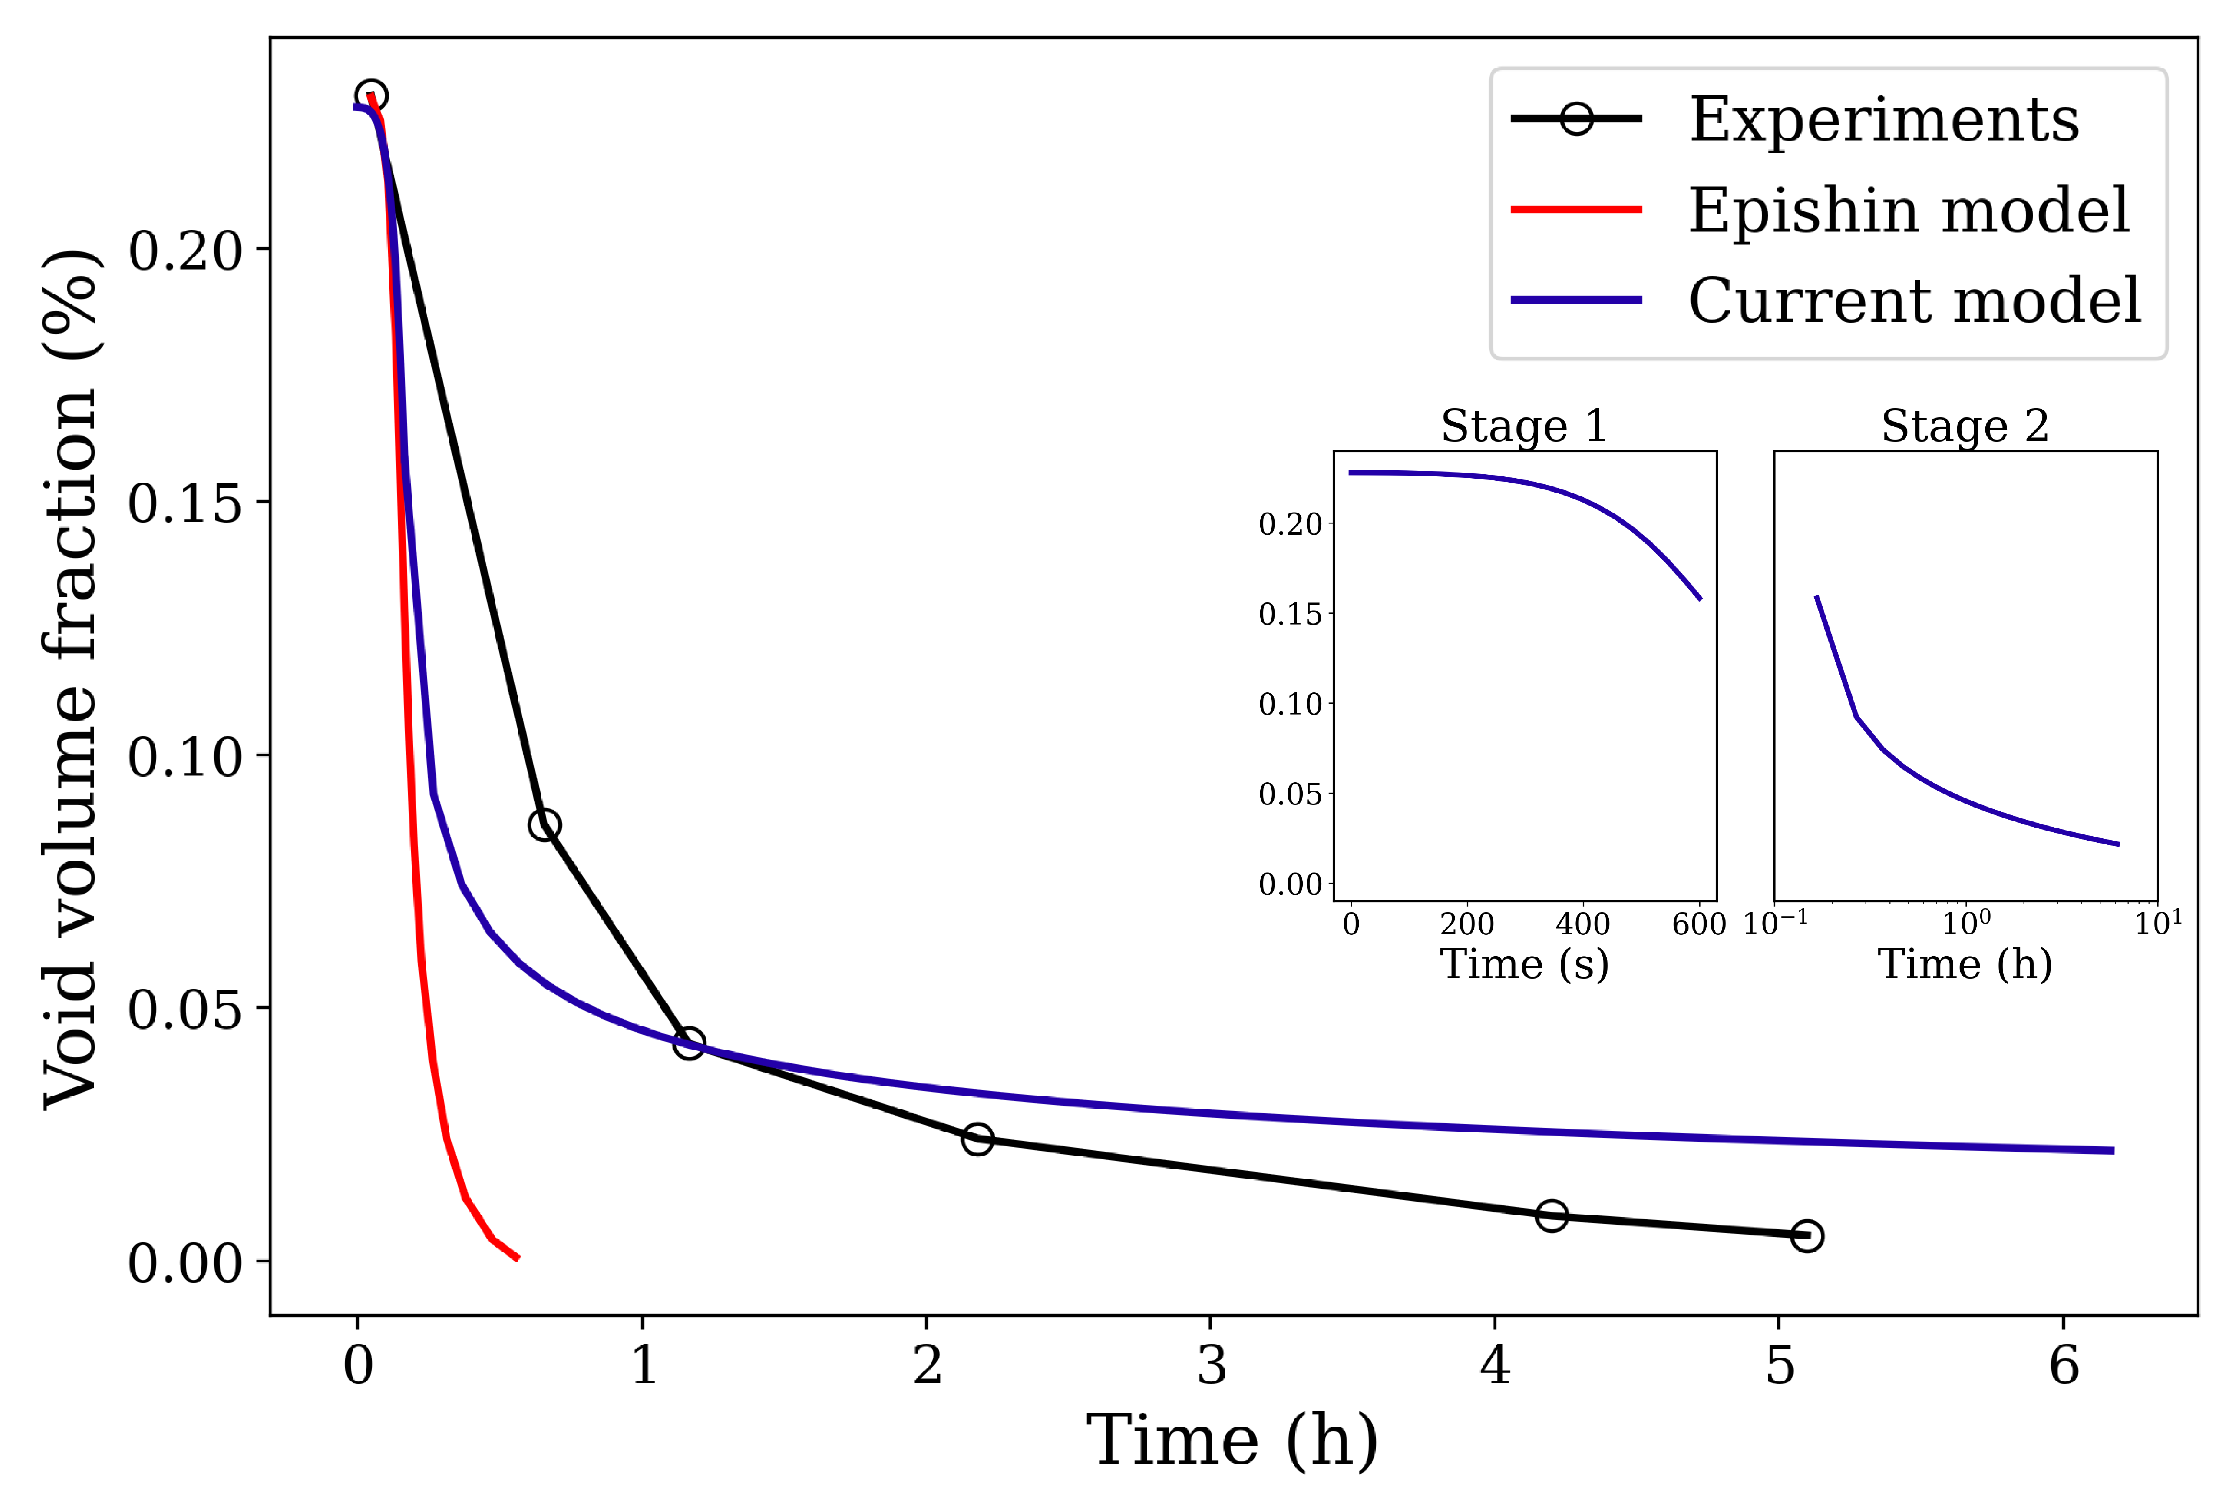
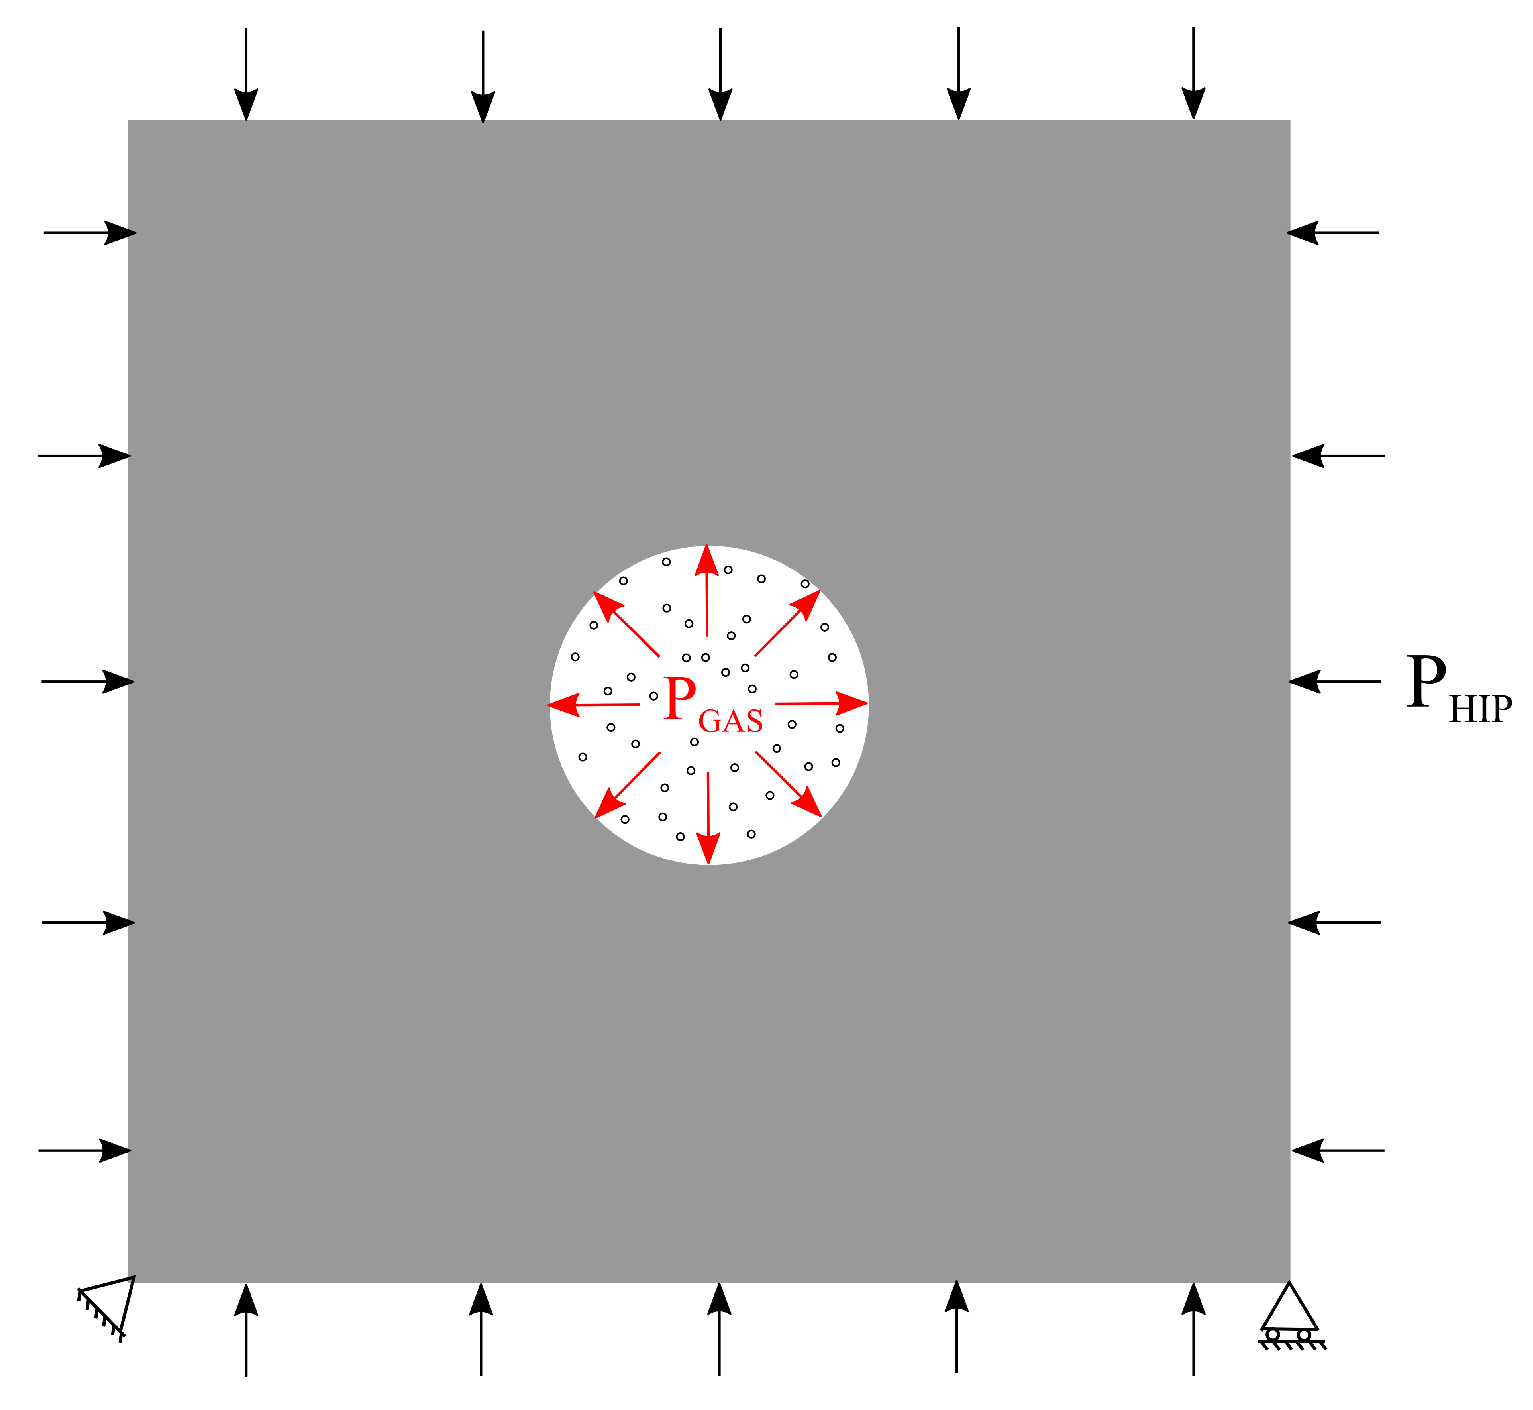
2.3. Modeling Gas inside Pores

The primary difficulty in addressing the mechanical response of a gas-filled pore is the coupling between the deformation of the material and the pressure exerted by the contained gas on the surrounding material. Figure 4 depicts a gas-filled pore subjected to external loads. The response of the material depends not only on the external loads, but also on the pressure exerted by the gas, which, in turn, is affected by the deformation of the material. The surface-based fluid cavity capability in Abaqus [24] provides the coupling needed to analyze such situations in which the cavity (here pore) is filled by fluid (here gas) with uniform properties and state.
The structure is discretized by a finite element mesh and the boundary of the pore is defined by an element-based surface with normals pointing to the inside of the pore. The gas is associated with a node known as the cavity reference node and has a single degree of freedom representing the pressure inside the pore. The cavity reference node is also used in the calculation of the pore volume. The gas inside the pore is assumed compressible, and, using the ideal gas assumption, the density of the gas inside the pore can be calculated as
ρ ( P , T ) = M w ( P + P amb ) R T
where M w is the molecular weight of the gas, R is the gas constant, T is the gas temperature, P is the gas pressure, and P amb is the ambient pressure. At the start of the analysis (prior to the first iteration), the reference gas density calculated in the user subroutine UFLUID (for the reference pressure P = P ref , and reference temperature T = T ref ) is used to calculate the mass of gas from the initial pore volume (using Equation (7)). During the analysis, the expected pore volume is calculated from the gas mass and the current density. The parameters used for modeling gas inside pores are listed in Table 2.
During AM, the pressure inside the build chamber is ≈0.1 MPa, and as solidification begins the argon gas gets trapped in the melt pool (from the argon atmosphere). The trapped gas can be assumed to have an internal pressure equal to the AM build chamber pressure. Upon solidification, the temperature decreases to room temperature, but the size of the pore can be assumed to remain constant, as the thermal expansion rate of metals is negligible. During the subsequent HIP loading (before Stage 1), the temperature is raised to 0.7T m (T m -melting temperature of the metal), and again the pore size is assumed to remain constant. During the HIP loading stages, the pore size decreases due to a combination of externally applied pressure P H I P and the pressure due to surface tension of the pore P ν . Hence, for pore equilibrium, the gas pressure inside the pore must balance the externally applied pressure and surface tension pressure P G A S = P H I P + P ν [27]. The pressure due to surface tension is modeled using the DLOAD subroutine in Abaqus. P ν is computed as 2 ν / r , where r is the pore radius and ν is the surface energy of the pore. However, this is not used in the calculation of gas pressure, but rather the equation of state described in Equation (7). Although there may be some limitations to using Equation (7), it is a good approximation to describe the behavior of argon under HIP processing conditions.

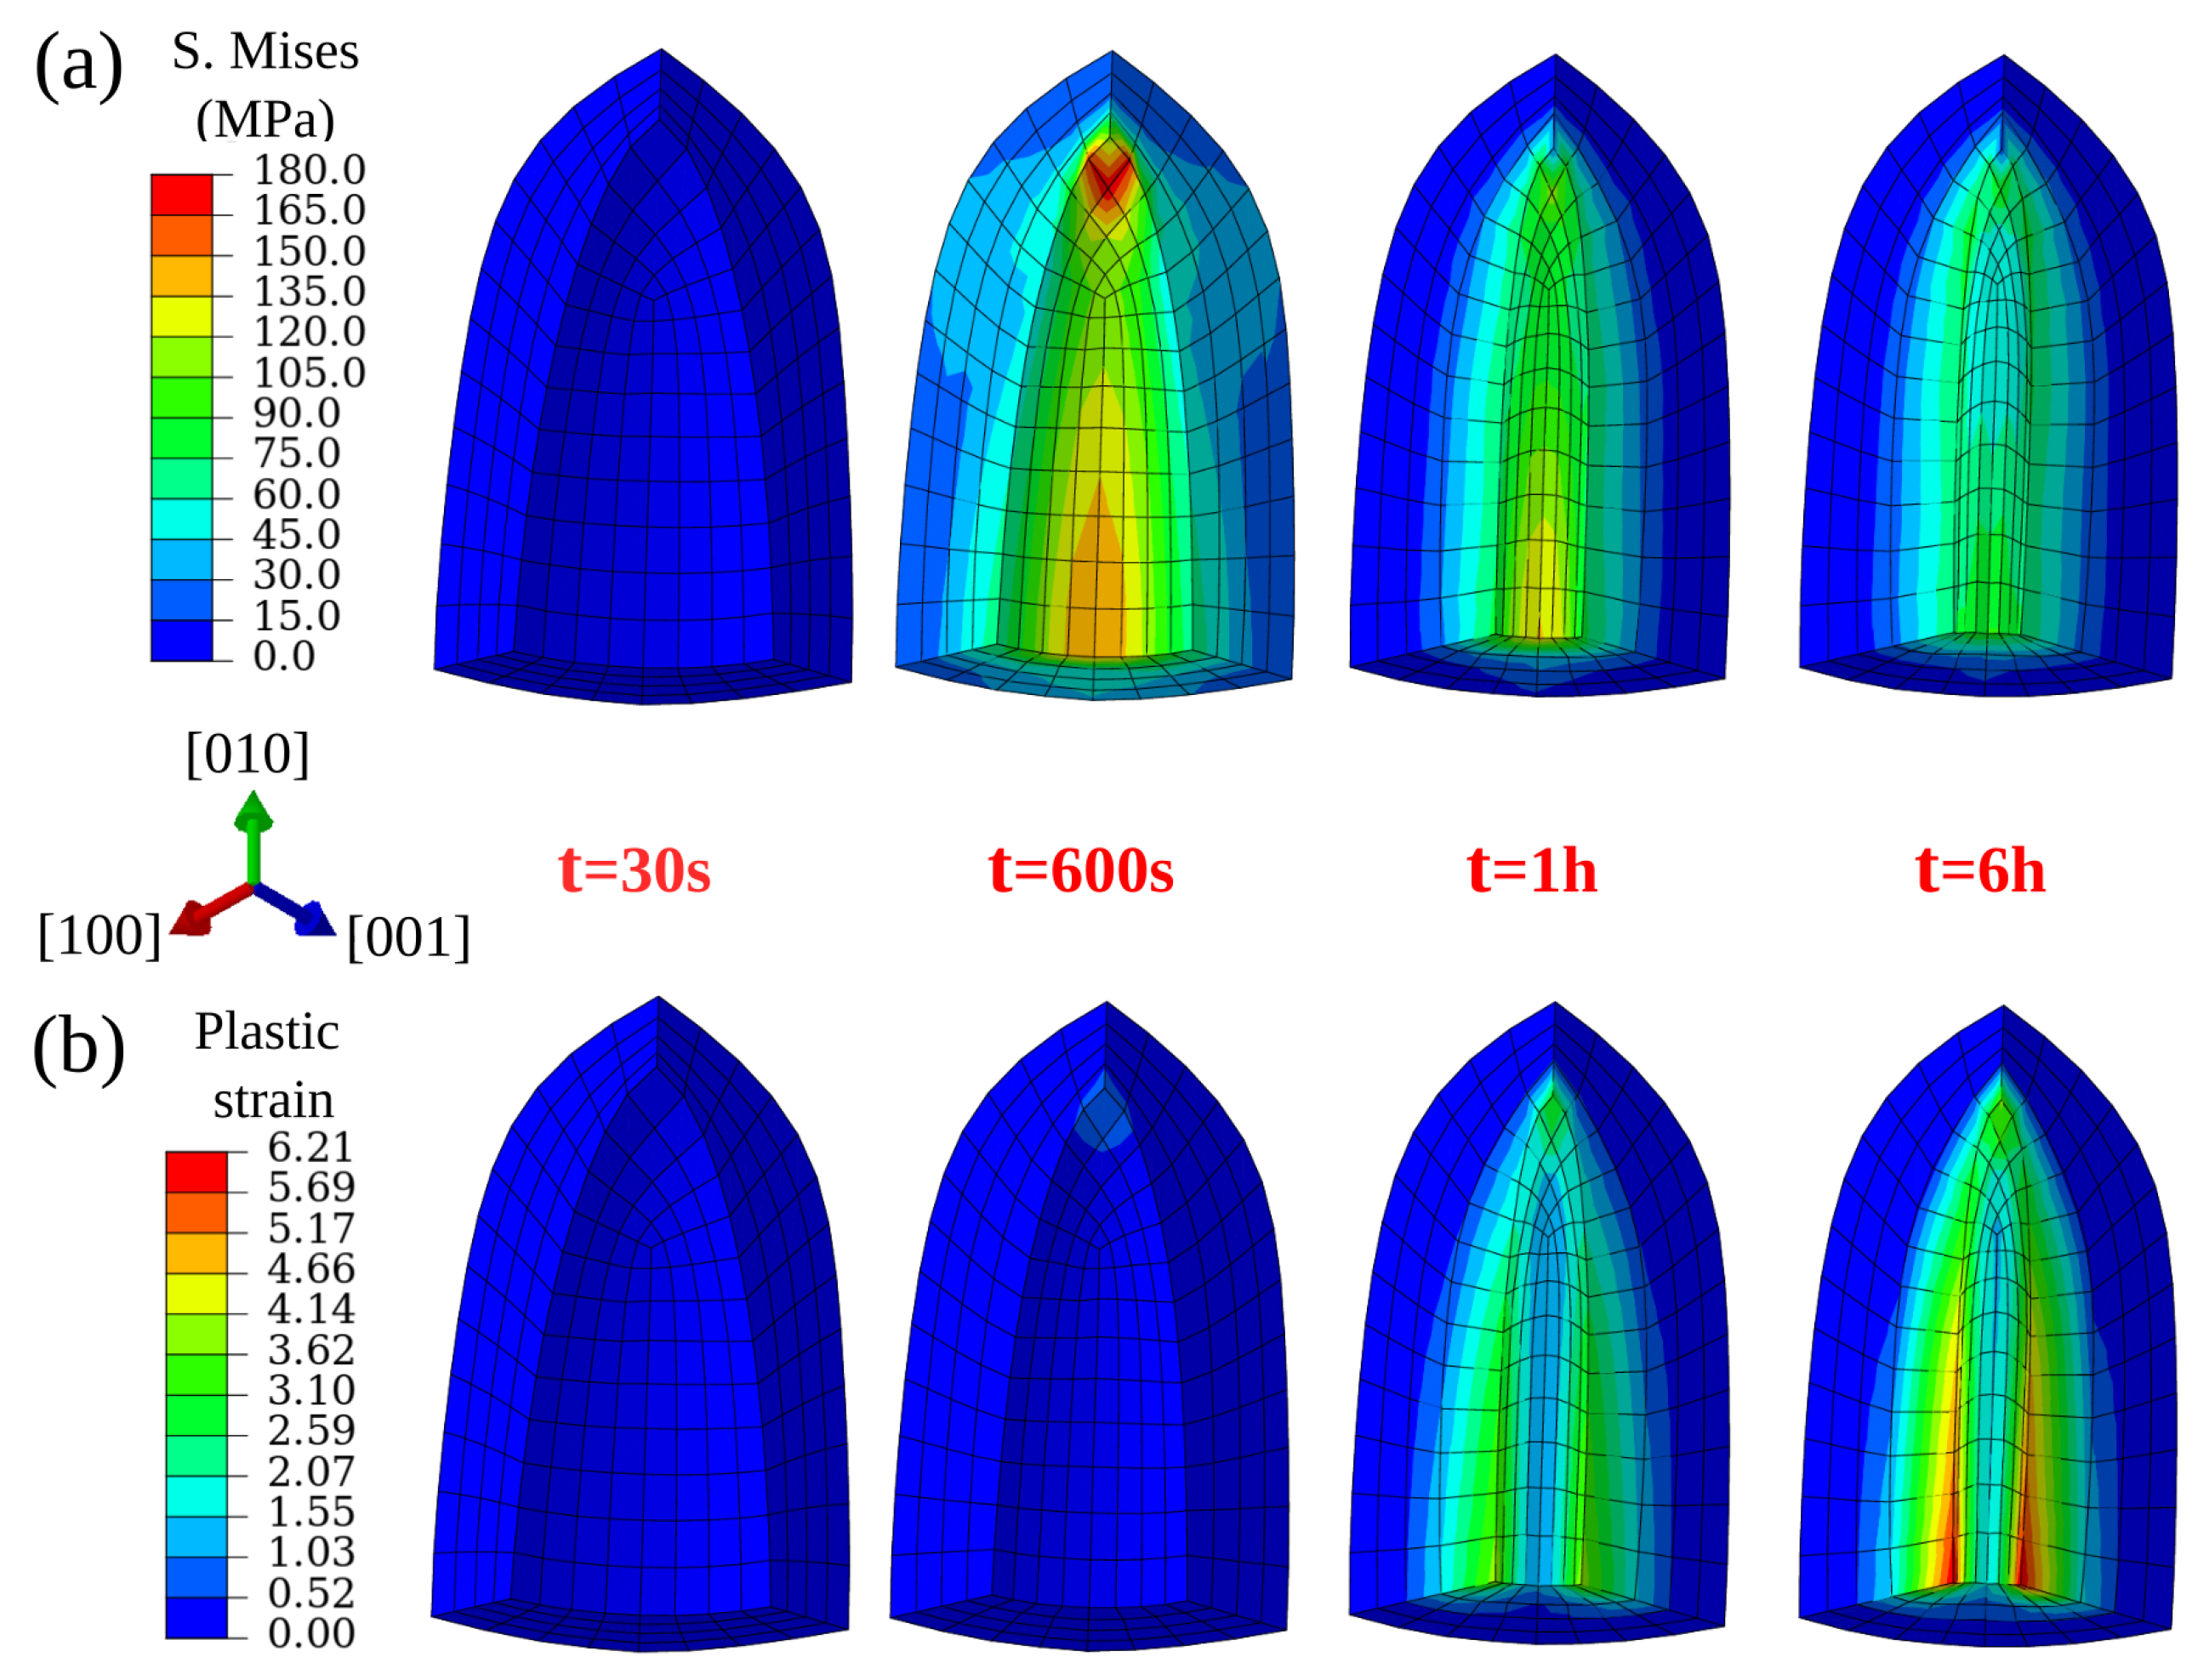
3. Numerical Study and Results

In this section, the micromechanical model described above is applied to study the void and pore closure mechanisms and to investigate the relationship between the HIP parameters, pore characteristics, and porosity reduction.

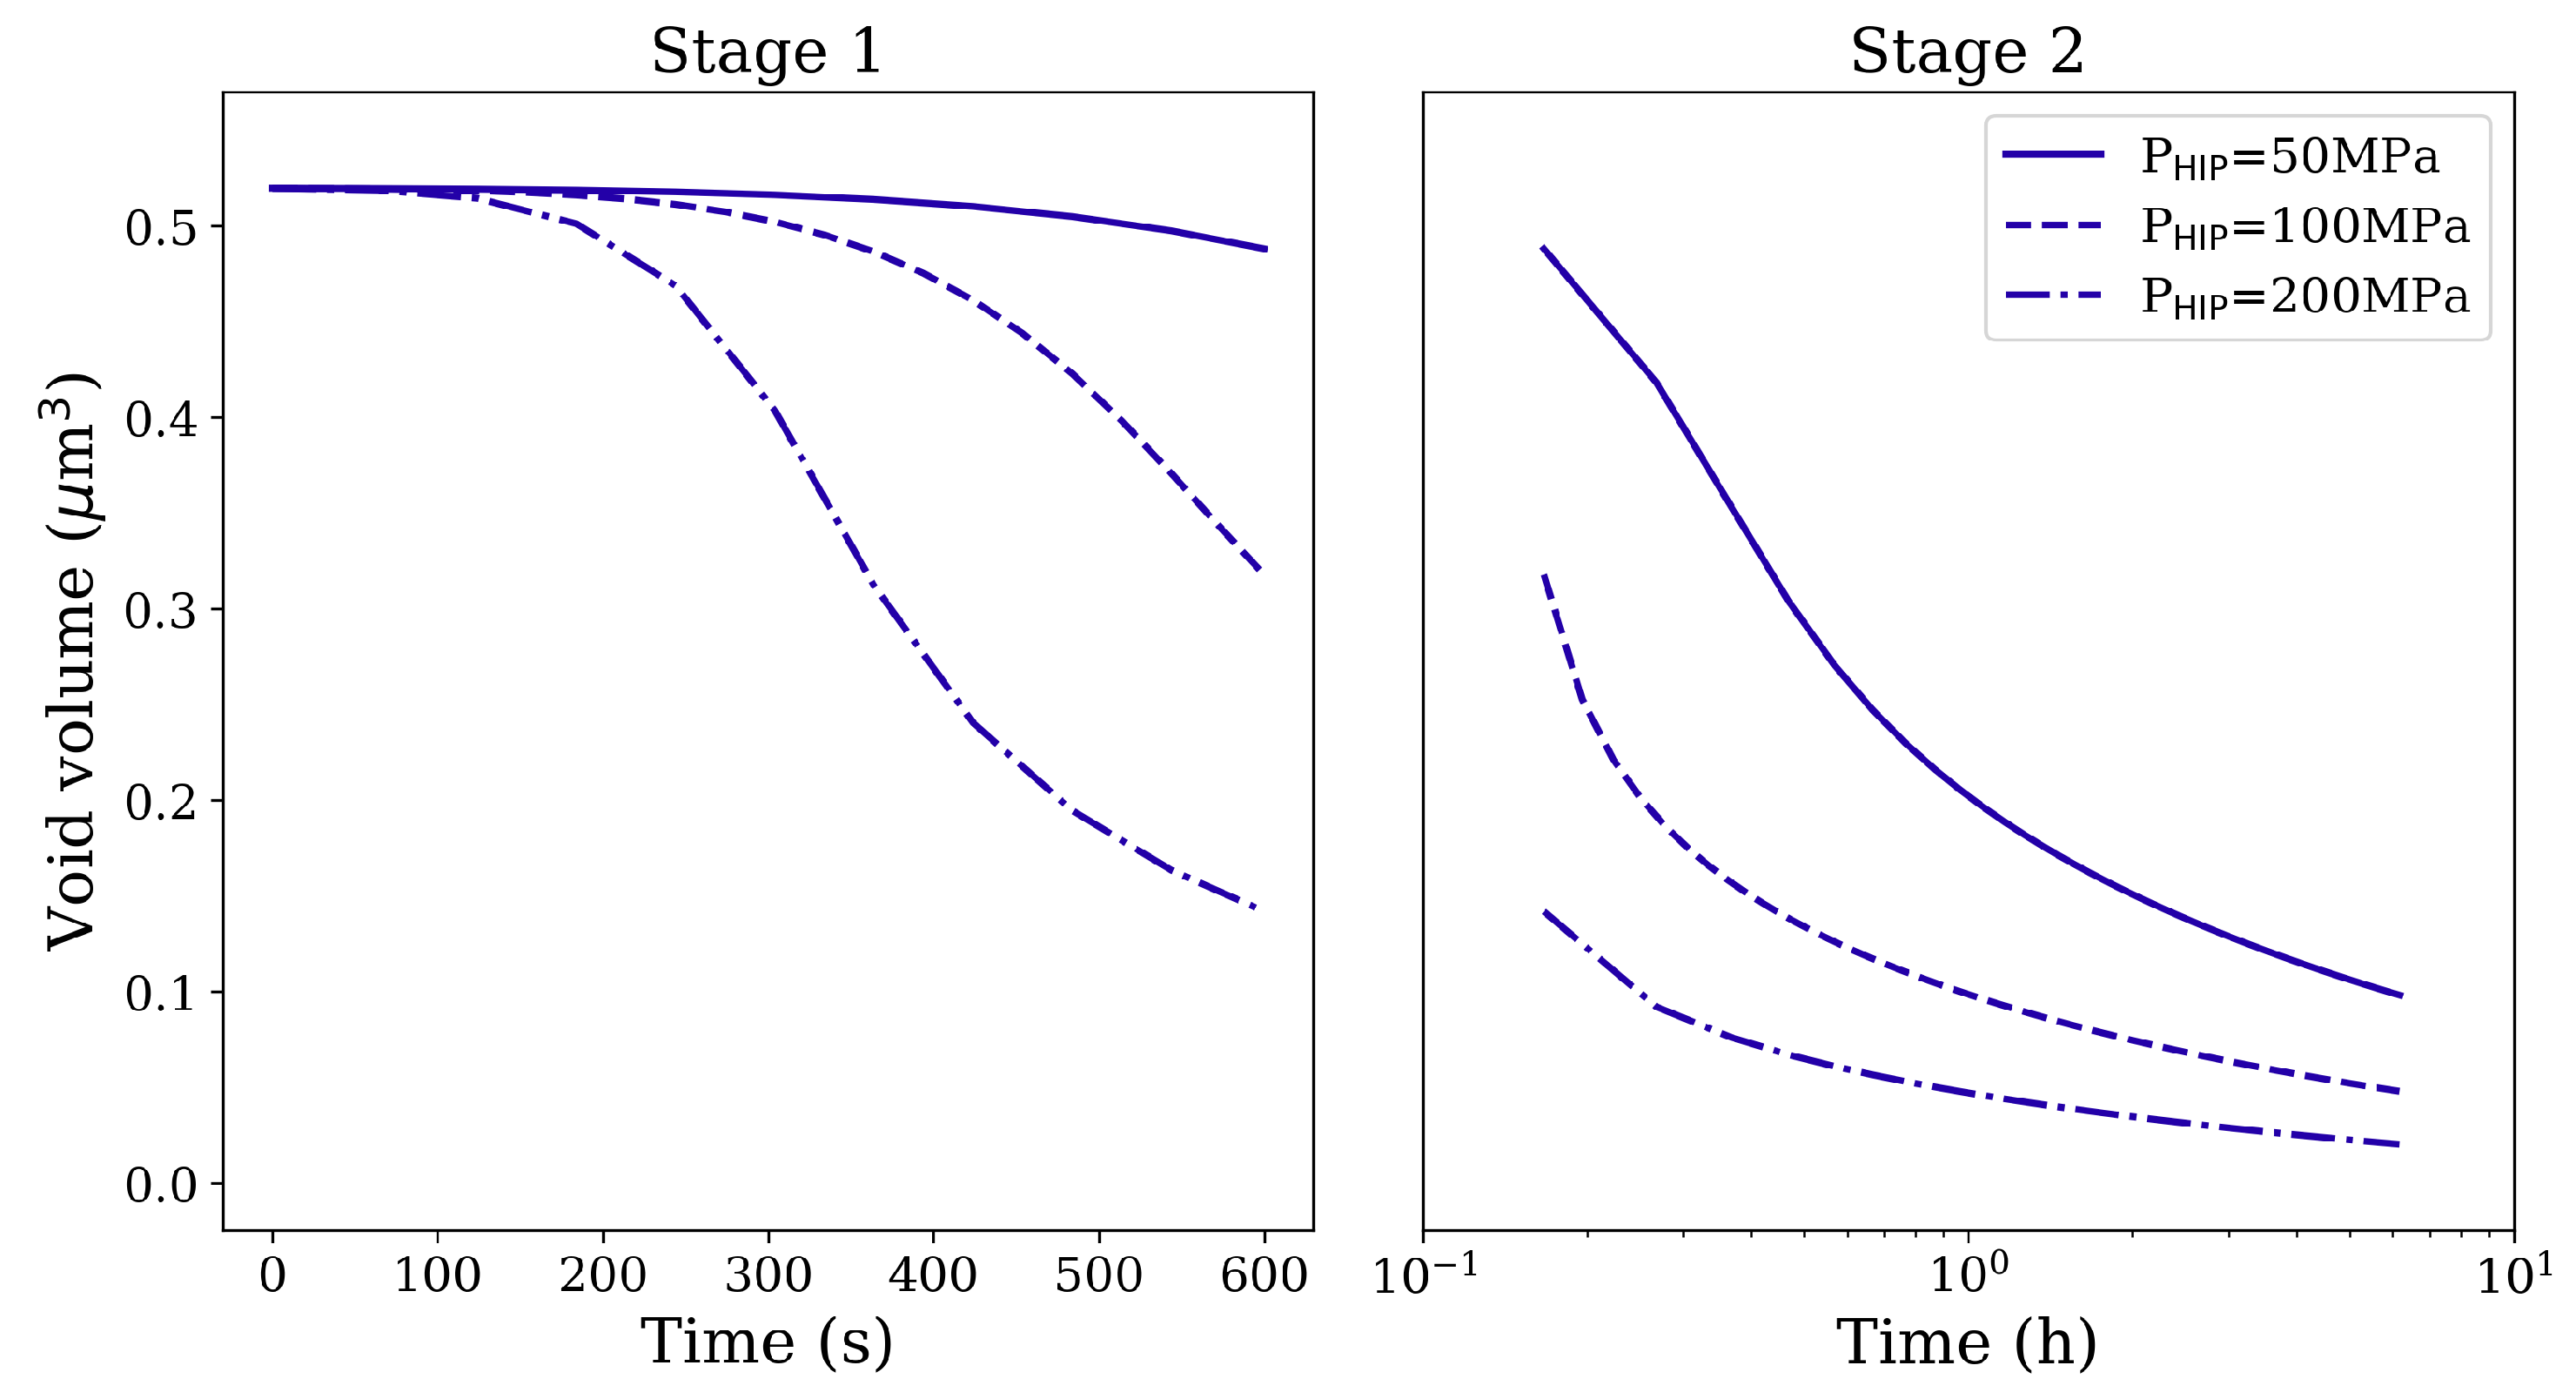
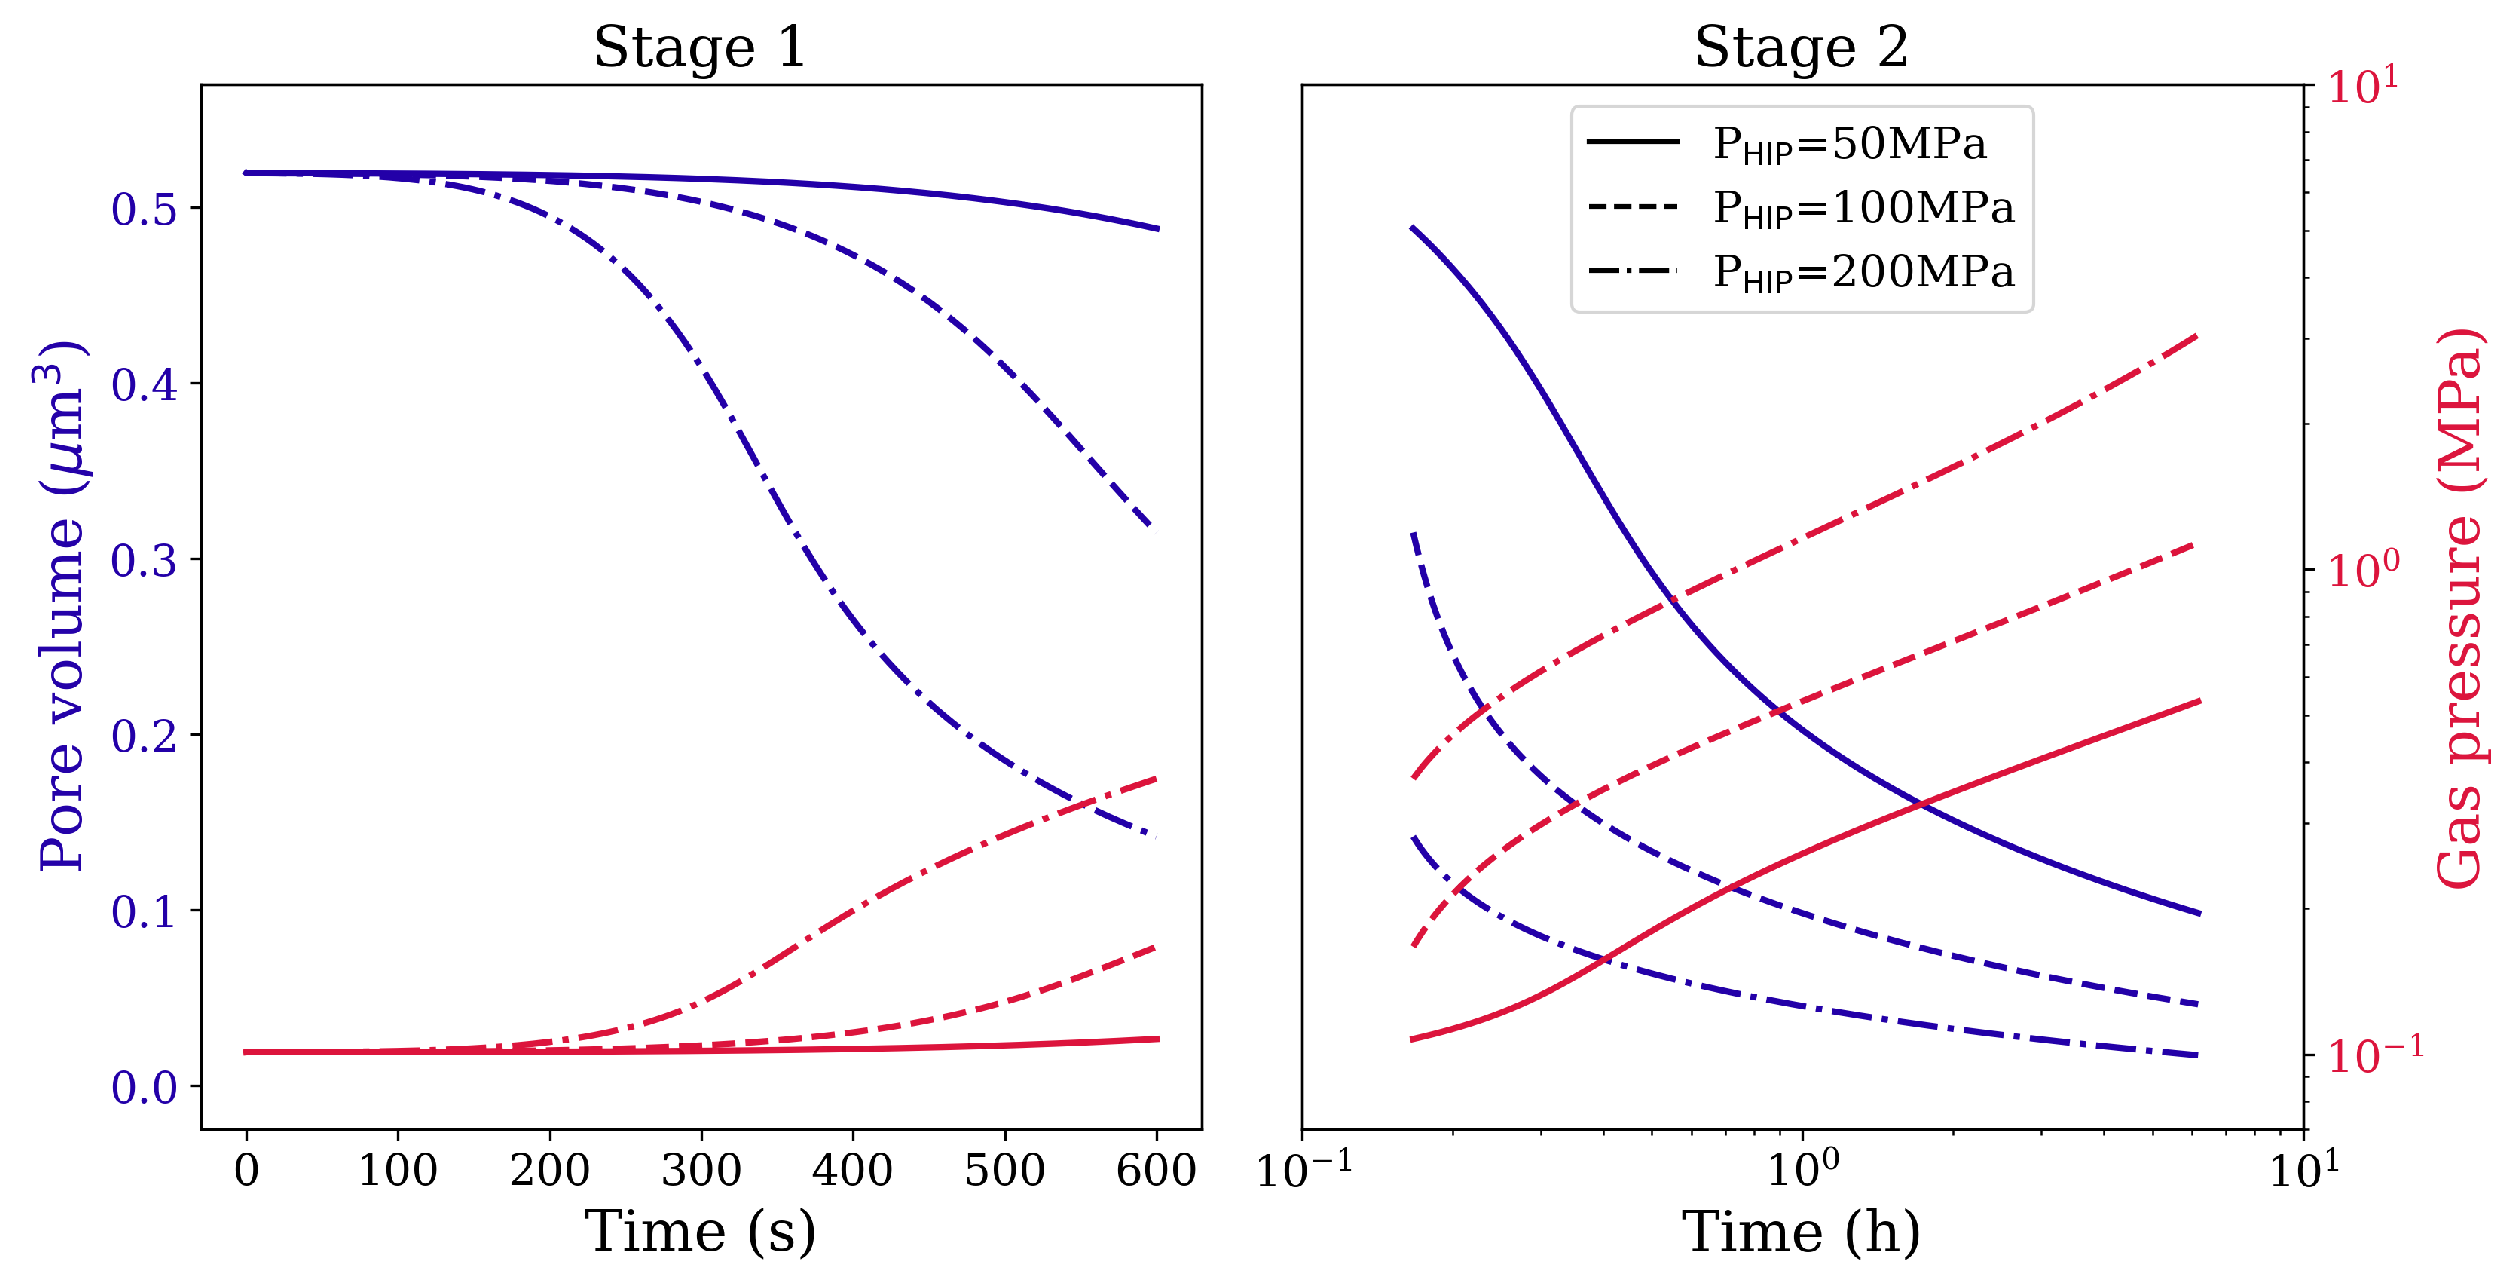
3.1. Influence of HIP Processing Conditions

The isostatic pressure, the holding time, and the temperature play crucial roles in void/pore reduction during the HIP treatment. Compared to the applied pressure and holding time, the void/pore shrinkage is more sensitive to temperature due to the strongly temperature-dependent dissolution of the γ phase and the self-diffusion effect. As the HIP processing temperature is above the γ -solvus, we assume that the whole material contains only the soft γ phase. Thus, without the obstruction of γ precipitates for dislocation glide, the deformation resistance decreases dramatically, so that the void/pore shrinkage turns out to be easier at such high temperatures. The reduction of void and pore volumes under different isostatic pressures and different holding times at 1561 K is shown in Figure 5 and Figure 6, respectively. It is clear that a higher applied pressure and longer holding time lead to better void/pore shrinkage.
At constant pressure, the void/pore shrinkage velocity decreases with increasing holding time. This feature is more evident when higher pressure is used. The reason is that the local stress around the void/pore becomes smaller as local plastic strain increases during the process of closure (see Figure 8a,b). The local strain hardening retards further shrinkage. For the gas-filled pores, the evolution of gas pressure is plotted on the secondary y-axis as a function of simulation time for various isostatic pressures (see Figure 6). Since the gas pressure inside the pores does not reach very high values, the resistance to pore shrinkage by the gas is negligible.
The current model addresses the influence of isostatic pressure and holding time on the void/pore closure at temperatures above the γ solvus. However, it does not simulate void/pore closure below this temperature as the presence and possible evolution of γ precipitates during the HIP process must be taken into account. In fact, the complicated stress field around the voids/pores could cause the γ precipitates to raft along different directions, and such rafted precipitates would influence void/pore annihilation and the mechanical properties of the materials after HIP. Future work will address the influence of γ precipitates on the void/pore healing and the optimal HIP parameters in this context.

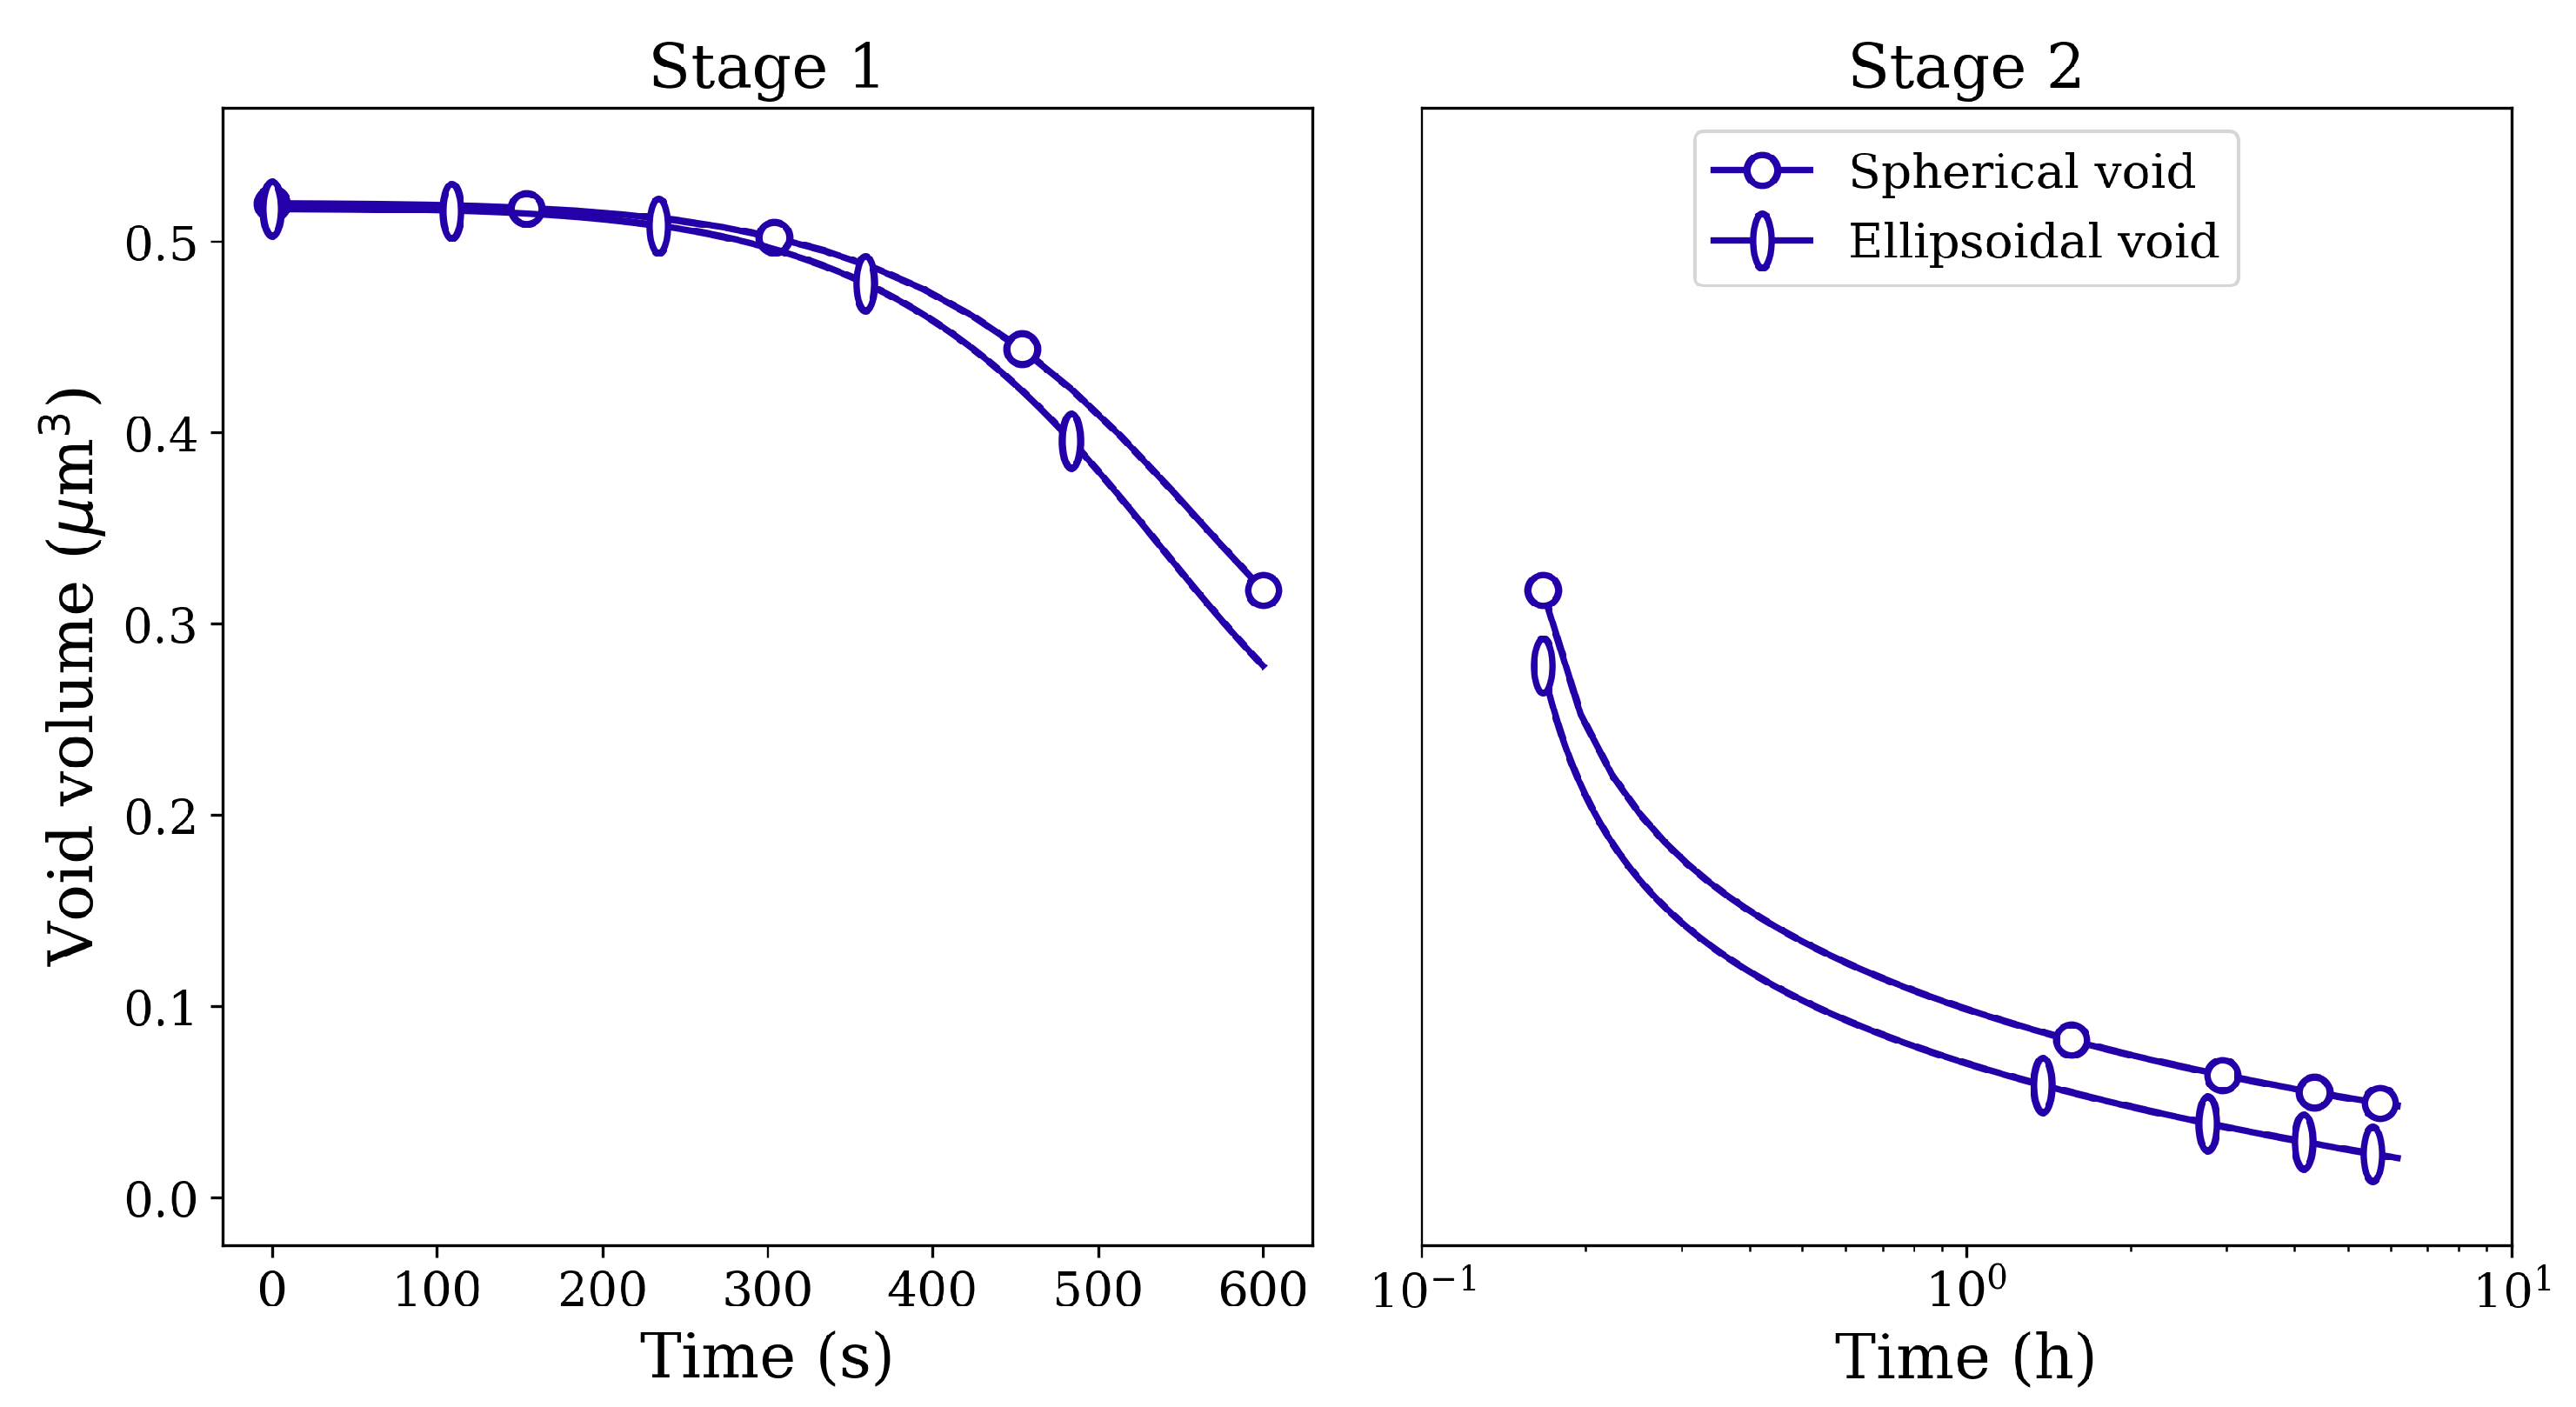
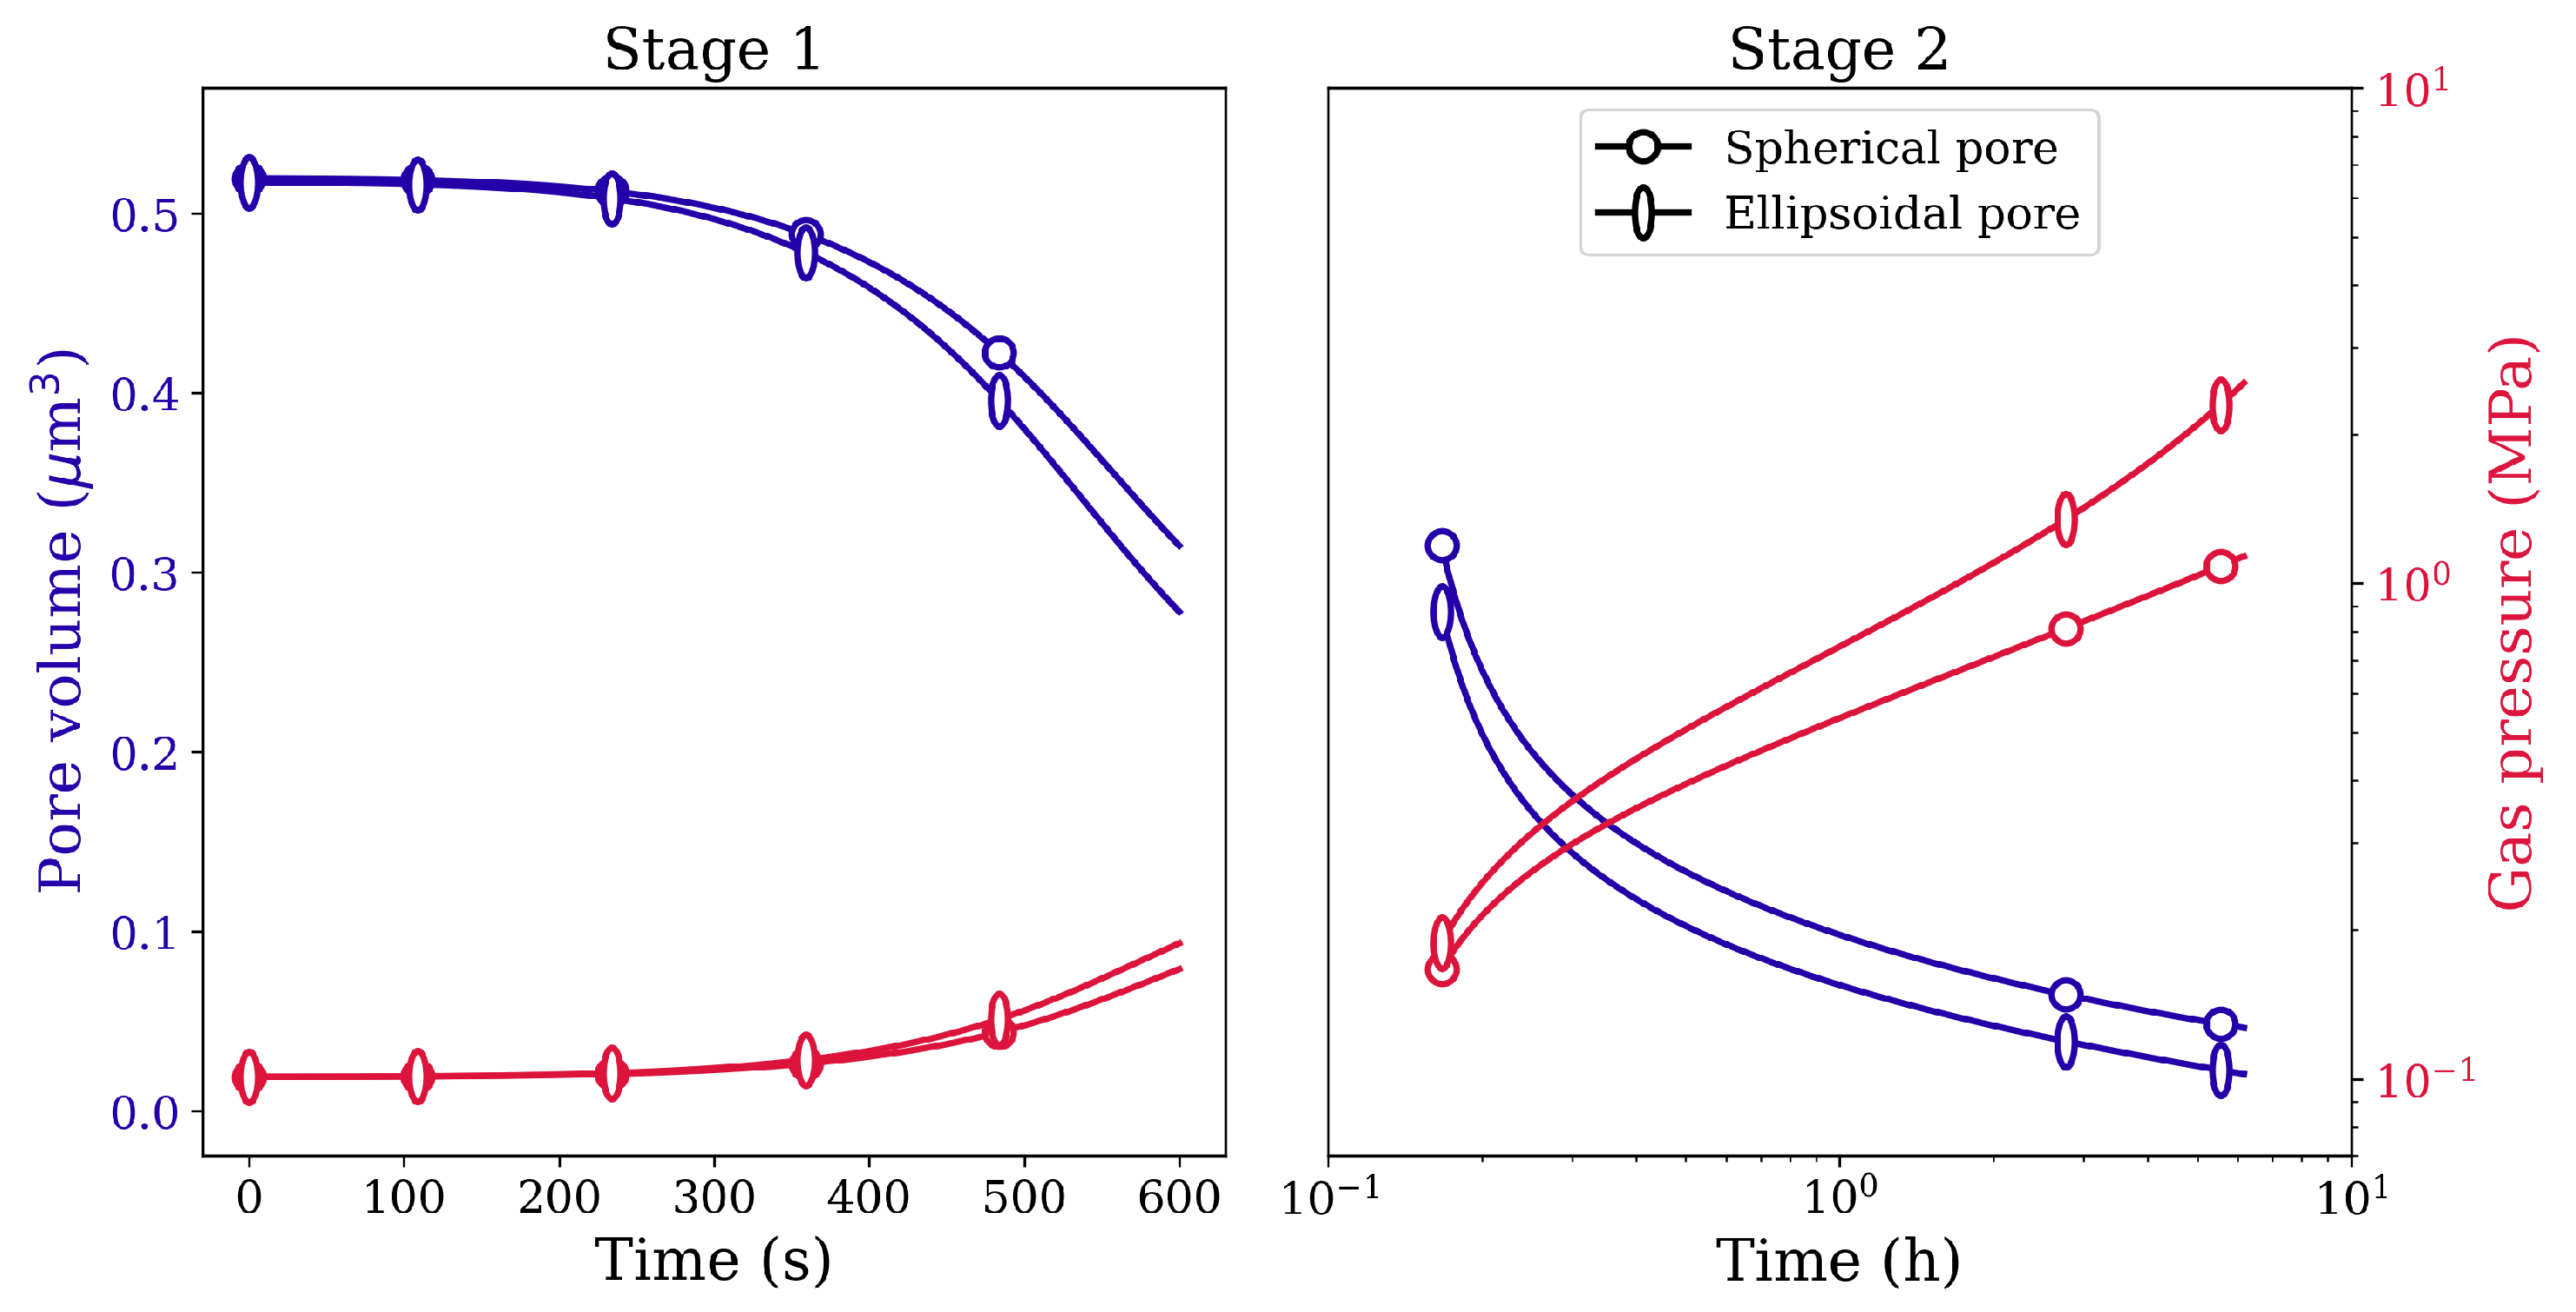
3.2. Influence of Pore Shape

For the same HIP conditions, different shapes of voids/pores could give rise to different shrinkage behaviors. Figure 7 depicts the 3D view of model mesh configurations containing idealized spherical and ellipsoidal voids. Due to symmetry, only 1/8th of the complete model is used in simulations. To isolate and study only the shape effect, the spherical and ellipsoidal voids are modeled off the same volume. The radius of the spherical void is 1 μm. The ellipsoid dimensions are calculated by using 4 / 3 π R 3 = 4 / 3 π a b c and assuming b = c and a = 3 b .
For the spherical void, during Stage 1 loading, stress accumulates around the void’s surface as depicted in Figure 8a. Anisotropy in elastic properties contributes to high Mises stress that is observed along the <111> orientation. During the subsequent Stage 2 loading, the material creeps and the stresses around the void relax due to increasing plastic strains. Since the crystal is soft along the axial directions and stiff at the corners, the void deforms along the axial directions to reduce the total mechanical energy of the system. This is depicted in Figure 8b, where high plastic strains are observed along <001> orientations.
For the ellipsoidal void, although the local von Mises stress is high at the acute angle (see Figure 9a), the closure starts from the waist position and results in a large plastic stain field there (see Figure 9b). This is due to the combined effect of elastic anisotropy and the complex distribution of stresses on the void surface due to its curvature.
Figure 10 depicts the corresponding void volume reduction for spherical and ellipsoidal voids. Although the initial void volume is the same for both kinds of voids, the closure rate is higher for the ellipsoidal void. Similar closure behavior is observed between spherical and ellipsoidal pores filled with gas. The evolution of gas pressure as a function of simulation time is plotted in Figure 11 on the secondary y-axis. Owing to the difference in the closure rates between the two-pore shapes, the gas pressure inside the pores also evolves with the difference in magnitudes. Nevertheless, since the pressure due to surface tension ( P ν ) is very small, the gas pressure inside the pores does not reach very high values.
Apart from the two idealized void shapes considered in the current study, an additional configuration with an irregular shaped void, consistent with the real case in the scanning electron microscope (SEM) observations [28], is considered for comparison. The void is modeled as a quasi-two-dimensional structure with one layer of element thickness (0.5 μm) in the z-direction, and the whole model cannot be deformed in this direction. Loads and boundary conditions applied are as shown in Figure 12, where the bottom-left corner node is fixed in the x- and y-directions and the bottom-right corner node is fixed in the y-direction only. The other used conditions, element type, and UMAT with the determined material parameters are the same as in the previous models.
Figure 13 depicts the evolution of von Mises stress and plastic strain fields around the irregular shaped void during its closure. Void closure starts from the position close to the acute angles where the local von Mises stresses are high. As the void shrinks gradually, the void-centered heterogeneous stress field shrinks, whereas the corresponding plastic strain field expands. By comparing these three void shapes (irregular, spherical, and ellipsoidal), it can be said that the spherical void is the most difficult to annihilate due its geometry and the corresponding stress distribution.

3.3. Influence of Pore Size

To clarify the effect of void/pore size on the closure behavior, a comparison of three cases with the same spherical void but of different sizes (radii 1 μm, 0.1 μm, and 0.01 μm) is made here. All three void configurations are loaded under 100 MPa isostatic pressure at 1561 K. Figure 14 depicts the evolution of the void volume reduction ratio (defined as the ratio of current void volume to the initial void volume) as a function of simulation time. It can be seen that the void closure rate accelerates with decreasing void size, and the void with 0.01 μm radius closes completely during Stage 1 loading itself. Here, the voids are considered to be closed when the void surfaces along any two orthogonal axial directions come in contact. After this stage, the solution loses its validity and the computation of void volume becomes significantly difficult.
The increasing closure rates for decreasing void sizes can be attributed to the effect of pressure due to surface tension ( P ν ). Since P ν varies inversely with the void size, its influence on the void surface becomes dominant at smaller void sizes. Similar closure behavior is observed for gas-filled pores of varying sizes. In Figure 15, the final pore volumes (obtained from the HIP simulations) are plotted corresponding to the initial pore volumes on a log-log plot. The gas pressures recorded at the end of each HIP simulation are also plotted corresponding to the initial pore volumes on the secondary y-axis of this figure. It can be seen that the pores with larger initial volume decrease by one or two orders in magnitude, and, as reported earlier, the gas pressure inside these larger pores is negligible and does not offer any resistance to pore closure. However, for smaller initial pore sizes, P ν becomes more dominant, and it not only accelerates the pore closure but also makes the gas pressures reach very high values (order of GPa).
From the log-log plot, the almost linear relationship between the final and initial pore volumes dictates that these quantities have a power-law relationship. The power-law fitting is done using the nonlinear least squares fitting method [29] as shown in Figure 15, and the exponent value is calculated to be 1.57. This value indicates that the relationship between these two quantities is nonlinear and pore closure accelerates with decreasing initial pore sizes. Figure 15 also depicts the hydrostatic stress distribution in the vicinity of the pores. Snapshots are taken at the end of each simulation for three pores of radii 0.01 μm, 0.1 μm, and 1 μm. The localized concentration of hydrostatic stress around the pores can be observed in all three cases; however, the magnitude and the direction of stress vary significantly. Negative hydrostatic stress states for 1 μm and 0.1 μm pores indicate that the externally applied pressure is dominant in these pores and is thus undergoing closure. In contrast, a very high positive hydrostatic stress state observed around the 0.01 μm pore indicates that there is significant resistance to pore closure offered by the gas trapped within this pore. Although the resistance increases with decreasing pore size, due to large plastic strains, the pore surfaces establish contact and the cavity reference node becomes ill-defined and terminates the simulation.
During HIP, the complete annihilation of pores is hindered due to argon’s low solubility in metal and the non-existing chemical potential difference between the pore and the surrounding environment (HIP chamber) [30]. However, both the solubility of argon in metals and the chemical potential difference generally increase with increasing pressures [31]. The significantly higher pore pressures could favor the dissolution of argon and act as a driving force to expel argon from the pores to the external environment. From the simulations conducted in this study (see Figure 15), it is evident that the pressure inside the pores reaches very high values (GPa scale) only for very small-sized pores (<0.1 μm). Thus, smaller-sized pores with very high pore pressures are more favorable for closure than larger-sized pores (≥0.1 μm radius) as they lack the necessary solubility and the chemical potential difference. Although the current model accounts for the influence of argon inside the pores, it neglects the diffusion of argon into the metal under high pore pressures. As the argon diffusion plays a significant role in pore annihilation, an in-depth investigation in this matter is expected to increase our understanding of pore healing through the HIP. In fact, a micromechanical model can be developed by coupling crystal plasticity with argon diffusion to understand the diffusion characteristics of argon in the material microstructure.

4. Conclusions

Hot isostatic pressing (HIP) simulations using various pressures and holding times were performed on a nickel-base single crystal superalloy at a temperature above the γ -solvus. A crystal plasticity (CP) finite element model was developed to investigate the relationship between HIP process parameters, pore characteristics, including gas pressure, and pore shrinkage. In this CP-based creep model, pore shrinkage via plastic deformation is controlled by dislocation slip, and the temperature dependency is introduced through an Arrhenius term. Despite using a simple model, the initial simulation results show similar features for the pore closure as the experimental observations. The mechanical response of gas-filled pores is modeled by coupling the deformation of the material and the pressure exerted by the trapped gas on the surrounding material. In line with experimental observations, our simulations also predict significant pore reductions by either increasing the applied pressure or the holding time. It is also found from simulations that, under the same conditions for pores with the same shape, the smaller pores shrink faster than the larger ones due to increasing pore surface energies with decreasing pore sizes. This nonlinear mechanical response gives rise to very high gas pressures (orders of GPa) in smaller gas-filled pores (radius < 0.1 μm) and offers significant resistance to further pore closure. In contrast, the resistance offered by the trapped gas is negligible for larger pores (radius ≥ 0.1 μm) as the gas pressures do not reach very high values due to low pore surface energies. Furthermore, the pore shape strongly affects the rate of shrinkage through a combined effect of elastic anisotropy and the complex distribution of stresses around the pore due to its shape. The current CP model can capture various aspects of pore healing during HIP, and it can be extended to incorporate other aspects, such as diffusion of argon into the metal and the evolution of γ -precipitates in the vicinity of pore. From a future perspective, an in-depth investigation into the re-growth of pores after HIP (due to the very high pressure in the trapped gas) can increase our understanding of optimizing the HIP process parameters.

Author Contributions

Conceptualization, M.R.G.P., N.V., and A.H.; Data curation, S.G.; Formal analysis, M.R.G.P., S.G., and A.H.; Investigation, S.G. and N.V.; Methodology, M.R.G.P. and S.G.; Project administration, N.V. and A.H.; Resources, A.H.; Supervision, N.V. and A.H.; Writing—original draft, M.R.G.P.; Writing—review and editing, N.V. and A.H. All authors have read and agreed to the published version of the manuscript.

Funding

This research received no external funding.

Acknowledgments

We acknowledge support by the DFG Open Access Publication Funds of the Ruhr-Universität Bochum.

Conflicts of Interest

The authors declare no conflict of interest.

Abbreviations

The following abbreviations are used in this manuscript:
HIPHot isostatic pressing
AMAdditive manufacturing
CPCrystal plasticity

References

  1. Reed, R.C. The Superalloys: Fundamentals and Applications; Cambridge University Press: Cambridge, UK, 2006. [Google Scholar]
  2. Bokstein, B.; Epishin, A.; Link, T.; Esin, V.; Rodin, A.; Svetlov, I. Model for the porosity growth in single-crystal nickel-base superalloys during homogenization. Scr. Mater. 2007, 57, 801–804. [Google Scholar] [CrossRef]
  3. Link, T.; Zabler, S.; Epishin, A.; Haibel, A.; Bansal, M.; Thibault, X. Synchrotron tomography of porosity in single-crystal nickel-base superalloys. Mater. Sci. Eng. A 2006, 425, 47–54. [Google Scholar] [CrossRef]
  4. Atkinson, H.; Davies, S. Fundamental aspects of hot isostatic pressing: An overview. Metall. Mater. Trans. A 2000, 31, 2981–3000. [Google Scholar] [CrossRef]
  5. Mälzer, G.; Hayes, R.; Mack, T.; Eggeler, G. Miniature Specimen Assessment of Creep of the Single-Crystal Superalloy LEK 94 in the 1000 Temperature Range. Metall. Mater. Trans. A 2007, 38, 314–327. [Google Scholar] [CrossRef]
  6. Wangyao, P.; Lothongkum, G.; Krongtong, V.; Homkrajai, W.; Chuankrerkkul, N. Microstructural Restoration by HIP and Heat Treatment Processes in Cast Nickel Based Superalloy, IN-738. Chiang Mai J. Sci. 2009, 36, 287–295. [Google Scholar]
  7. Bor, H.; Hsu, C.; Wei, C. Influence of hot isostatic pressing on the fracture transitions in the fine grain MAR-M247 superalloys. Mater. Chem. Phys. 2004, 84, 284–290. [Google Scholar] [CrossRef]
  8. Kim, M.; Chang, S.; Won, J. Effect of HIP process on the micro-structural evolution of a nickel-based superalloy. Mater. Sci. Eng. A 2006, 441, 126–134. [Google Scholar] [CrossRef]
  9. Appa Rao, G.; Sankaranarayana, M.; Balasubramaniam, S. Hot Isostatic Pressing Technology for Defence and Space Applications. Def. Sci. J. 2012, 62, 73–80. [Google Scholar]
  10. Whitesell, H.; Overfelt, R. Influence of solidification variables on the microstructure, macrosegregation, and porosity of directionally solidified Mar-M247. Mater. Sci. Eng. A 2001, 318, 264–276. [Google Scholar] [CrossRef]
  11. Gu, D.D.; Meiners, W.; Wissenbach, K.; Poprawe, R. Laser additive manufacturing of metallic components: Materials, processes and mechanisms. Int. Mater. Rev. 2012, 57, 133–164. [Google Scholar] [CrossRef]
  12. Tammas-Williams, S.; Zhao, H.; Léonard, F.; Derguti, F.; Todd, I.; Prangnell, P. XCT analysis of the influence of melt strategies on defect population in Ti–6Al–4V components manufactured by Selective Electron Beam Melting. Mater. Charact. 2015, 102, 47–61. [Google Scholar] [CrossRef]
  13. Kasperovich, G.; Haubrich, J.; Gussone, J.; Requena, G. Correlation between porosity and processing parameters in TiAl6V4 produced by selective laser melting. Mater. Des. 2016, 105, 160–170. [Google Scholar] [CrossRef] [Green Version]
  14. Blackwell, P. The mechanical and microstructural characteristics of laser-deposited IN718. J. Mater. Process. Technol. 2005, 170, 240–246. [Google Scholar] [CrossRef]
  15. Yadollahi, A.; Shamsaei, N.; Thompson, S.M.; Elwany, A.; Bian, L. Effects of building orientation and heat treatment on fatigue behavior of selective laser melted 17-4 PH stainless steel. Int. J. Fatigue 2017, 94, 218–235. [Google Scholar] [CrossRef]
  16. Frazier, W.E. Metal additive manufacturing: A review. J. Mater. Eng. Perform. 2014, 23, 1917–1928. [Google Scholar] [CrossRef]
  17. Tammas-Williams, S.; Withers, P.J.; Todd, I.; Prangnell, P.B. The effectiveness of hot isostatic pressing for closing porosity in titanium parts manufactured by selective electron beam melting. Metall. Mater. Trans. A 2016, 47, 1939–1946. [Google Scholar] [CrossRef] [Green Version]
  18. Beretta, S.; Romano, S. A comparison of fatigue strength sensitivity to defects for materials manufactured by AM or traditional processes. Int. J. Fatigue 2017, 94, 178–191. [Google Scholar] [CrossRef]
  19. Yadollahi, A.; Shamsaei, N. Additive manufacturing of fatigue resistant materials: Challenges and opportunities. Int. J. Fatigue 2017, 98, 14–31. [Google Scholar] [CrossRef] [Green Version]
  20. Tammas-Williams, S.; Withers, P.; Todd, I.; Prangnell, P. Porosity regrowth during heat treatment of hot isostatically pressed additively manufactured titanium components. Scr. Mater. 2016, 122, 72–76. [Google Scholar] [CrossRef]
  21. Epishin, A.; Fedelich, B.; Link, T.; Feldmann, T.; Svetlov, I. Pore annihilation in a single-crystal nickel-base superalloy during hot isostatic pressing: Experiment and modelling. Mater. Sci. Eng. A 2013, 586, 342–349. [Google Scholar] [CrossRef]
  22. Epishin, A.; Fedelich, B.; Nolze, G.; Schriever, S.; Feldmann, T.; Ijaz, M.F.; Viguier, B.; Poquillon, D.; Le Bouar, Y.; Ruffini, A. Creep of single crystals of nickel-based superalloys at ultra-high homologous temperature. Metall. Mater. Trans. A 2018, 49, 3973–3987. [Google Scholar] [CrossRef] [Green Version]
  23. Ashby, M.F. Mechanisms of deformation and fracture. Adv. Appl. Mech. 1983, 23, 117–177. [Google Scholar]
  24. ABAQUS. Analysis User’s Manual, Version 6.14. 2017. Available online: http://130.149.89.49:2080/v6.14/books/usb/default.htm (accessed on 16 December 2020).
  25. Lee, E. Elastic-plastic deformation at finite strains. J. Appl. Mech. 1969, 36, 1–6. [Google Scholar] [CrossRef]
  26. MacEwan, J.R.; MacEwan, J.U.; Yaffe, L. Self-diffusion in polycrystalline Nickel. Can. J. Chem. 1959, 37, 1623–1628. [Google Scholar] [CrossRef] [Green Version]
  27. Stevens, R.A.; Flewitt, P.E.J. Hot isostatic pressing to remove porosity & creep damage. Mater. Des. 1982, 3, 461–469. [Google Scholar]
  28. Epishin, A.; Svetlov, I. Evolution of pore morphology in single-crystals of nickel-base superalloys. Inorg. Mater. Appl. Res. 2016, 7, 45–52. [Google Scholar] [CrossRef]
  29. Björck, A. Numerical Methods for Least Squares Problems; Society for Industrial and Applied Mathematics: Philadelphia, PA, USA, 1996. [Google Scholar]
  30. Shao, S.; Mahtabi, M.J.; Shamsaei, N.; Thompson, S.M. Solubility of argon in laser additive manufactured α-titanium under hot isostatic pressing condition. Comput. Mater. Sci 2017, 131, 209–219. [Google Scholar] [CrossRef]
  31. Boom, R.; Kamperman, A.A.; Dankert, O.; Van Veen, A. Argon solubility in liquid steel. Metall. Mater. Trans. B 2000, 31, 913–919. [Google Scholar] [CrossRef]
Figure 1. Comparison of simulation results and experimental data for creep under different tensile loads along [100] direction at 1561 K. The experimental creep curves are obtained from the works of Epishin et al. [21,22].
Crystals 10 01147 g001
Figure 2. Planar view of a 3D model with 1/8th spherical void with loads and boundary conditions.
Crystals 10 01147 g002
Figure 3. Comparison of void volume fraction evolution curves between experimental and simulation results. The experimental curve is obtained from Epishin et al. [21]. The figure inset indicates the two stages of HIP loading.
Crystals 10 01147 g003
Figure 4. Planar view of a gas-filled spherical pore subjected to external applied load P H I P . The pressure exerted by the trapped gas on the pore surface is represented as P G A S .
Crystals 10 01147 g004
Figure 5. Void volume reduction in Stage 1 and Stage 2 HIP loading for spherical void of radius 1 μm under different magnitudes of the isostatic pressure and different holding times at 1561 K.
Crystals 10 01147 g005
Figure 6. Pore volume reduction and gas pressure evolution in Stage 1 and Stage 2 HIP loading for spherical pore of radius 1 μm under different magnitudes of the isostatic pressure and different holding times at 1561 K.
Crystals 10 01147 g006
Figure 7. 1/8th spherical (left) and 1/8th ellipsoidal (right) model mesh configurations used in HIP simulations.
Crystals 10 01147 g007
Figure 8. Von Mises stress (a) and plastic strain (b) evolution around a spherical void (zoomed area) with increasing simulation time under 100 MPa isostatic pressure at 1561 K.
Crystals 10 01147 g008
Figure 9. Von Mises stress (a) and plastic strain (b) evolution around an ellipsoidal void (zoomed area) with increasing simulation time under 100 MPa isostatic pressure at 1561 K.
Crystals 10 01147 g009
Figure 10. Void volume reduction in Stage 1 and Stage 2 HIP loading for spherical and ellipsoidal voids of identical volume under 100 MPa isostatic pressure at 1561 K.
Crystals 10 01147 g010
Figure 11. Pore volume reduction in Stage 1 and Stage 2 HIP loading for spherical and ellipsoidal pores of identical volume under 100 MPa isostatic pressure at 1561 K.
Crystals 10 01147 g011
Figure 12. Quasi-2D representative CPFE model with finite element mesh and boundary conditions for the irregular shaped void. ‘P’ represents the isostatic pressure applied on the outer boundaries.
Crystals 10 01147 g012
Figure 13. Von Mises stress (a) and plastic strain (b) evolution around irregular-shaped void (Quasi-2D) with increasing simulation time under 100 MPa isostatic pressure at 1561 K.
Crystals 10 01147 g013
Figure 14. Void volume reduction ratio in Stage 1 and Stage 2 HIP loading for spherical voids of various radii under 100 MPa isostatic pressure at 1561 K.
Crystals 10 01147 g014
Figure 15. (Top) Final pore volume and final gas pressure under HIP loading as a function of initial pore volume. (Bottom) Snapshots of hydrostatic stress distribution around pores (zoomed area) taken at the end of simulations. Simulations are done with spherical pores of various radii under 100 MPa isostatic pressure at 1561 K.
Crystals 10 01147 g015
Table 1. Fitted material parameters for CMSX-4 superalloy. τ ^ 0 slip is the initial slip resistance produced by dislocation interaction.
ParameterValueUnit
G69.4GPa
b0.254nm
D 0 3.36 × 10 4 [26] m 2 s 1
Q s d 292 [26] kJ mol 1
A1.2 × 10 10 -
p 1 3.0-
p 2 0.05-
τ ^ 0 slip 40MPa
τ ^ sat 600MPa
h 0 60MPa
v 1 60MPa
v 2 2.0-
Table 2. Parameters used for modeling gas inside pores. The gas considered for simulations is argon.
M w (kg mol 1 )R (JK 1 mol 1 ) P ref (MPa) P amb (MPa) T ref (K)
0.0399488.31400.1011728.15
Publisher’s Note: MDPI stays neutral with regard to jurisdictional claims in published maps and institutional affiliations.

