Discovery, Characterization, and Pharmaceutical Applications of Two Loratadine–Oxalic Acid Cocrystals


Abstract

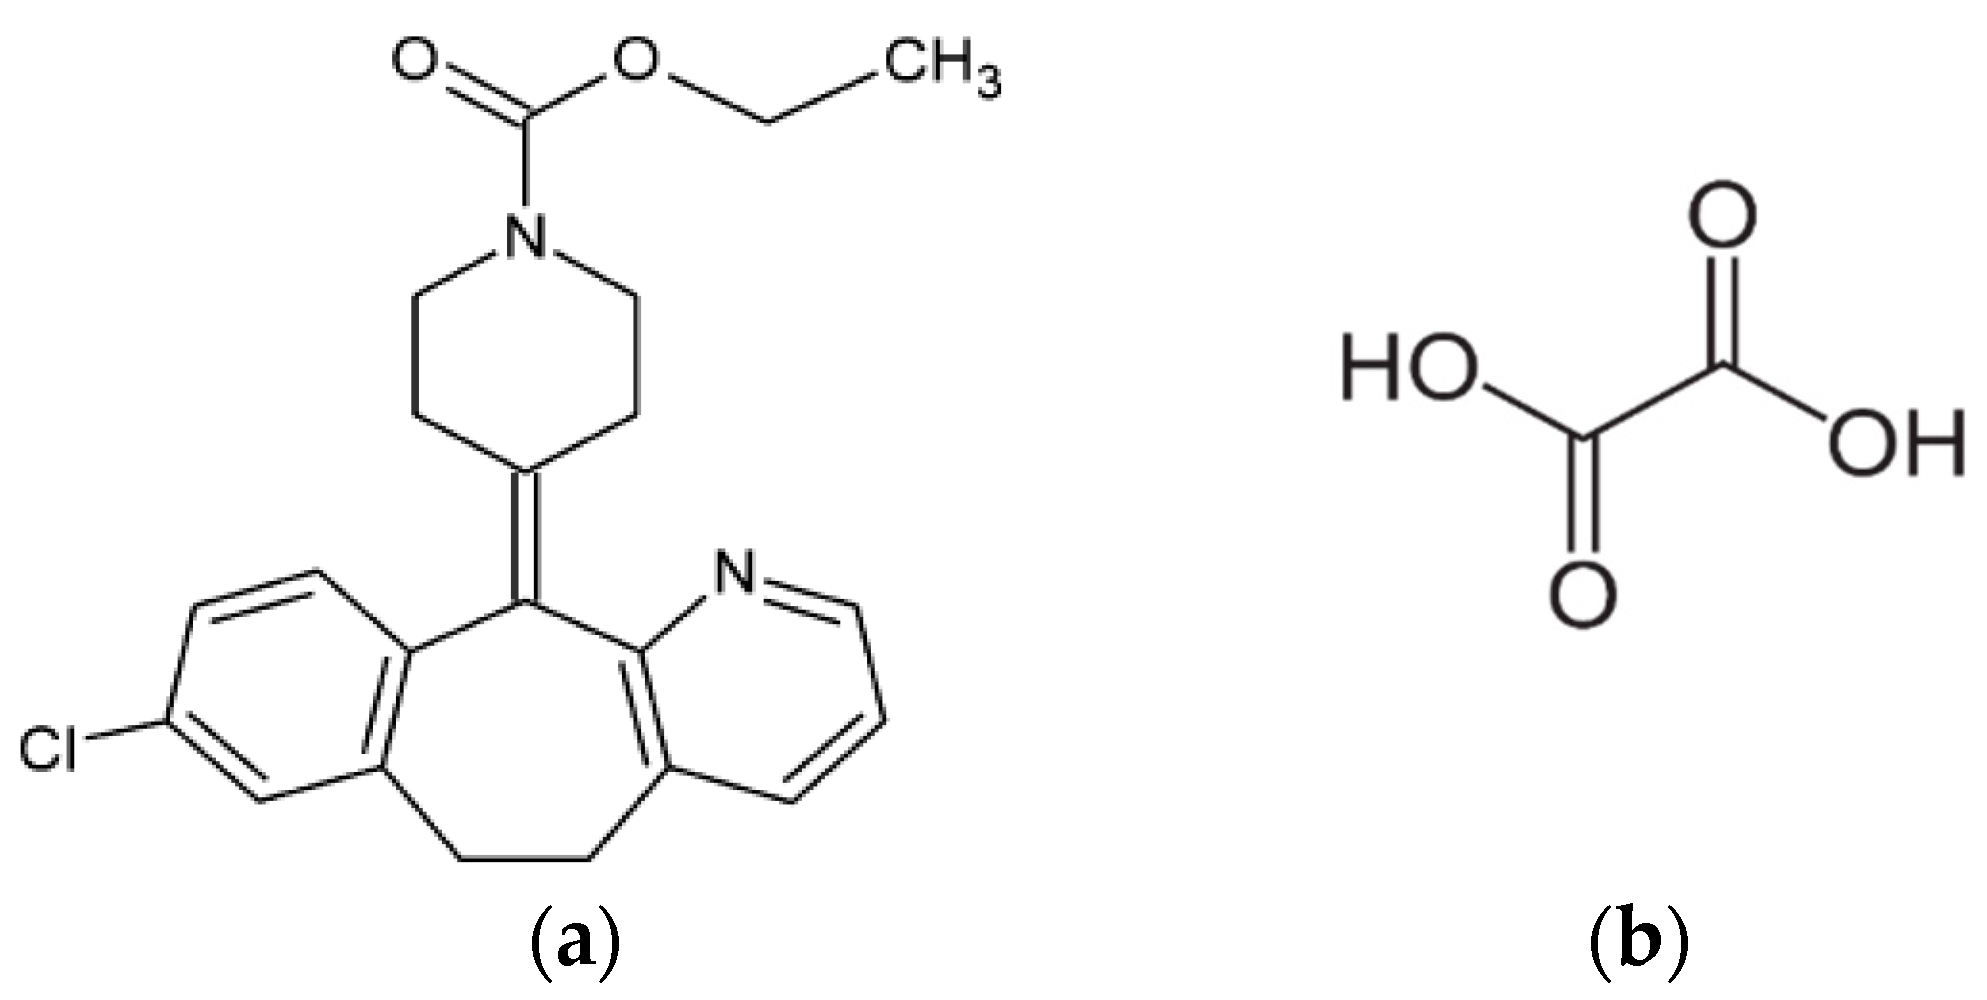
1. Introduction
2. Materials and Methods
2.1. Materials
2.2. Screen for New Solid Forms of Loratadine
2.3. Single Crystal Preparation
2.4. Single Crystal X-ray Diffractometry (SCXRD)
2.5. Bulk Powder Preparation
2.6. Powder X-ray Diffractometry (PXRD)
2.7. Thermal Analysis
2.8. Hot-Stage Microscopy (HSM)
2.9. Fourier Transformation Infrared Spectroscopy (FT-IR)
2.10. Moisture Sorption Isotherm
2.11. Solubility and Intrinsic Dissolution Rate (IDR)
2.12. Tabletability
3. Results and Discussion
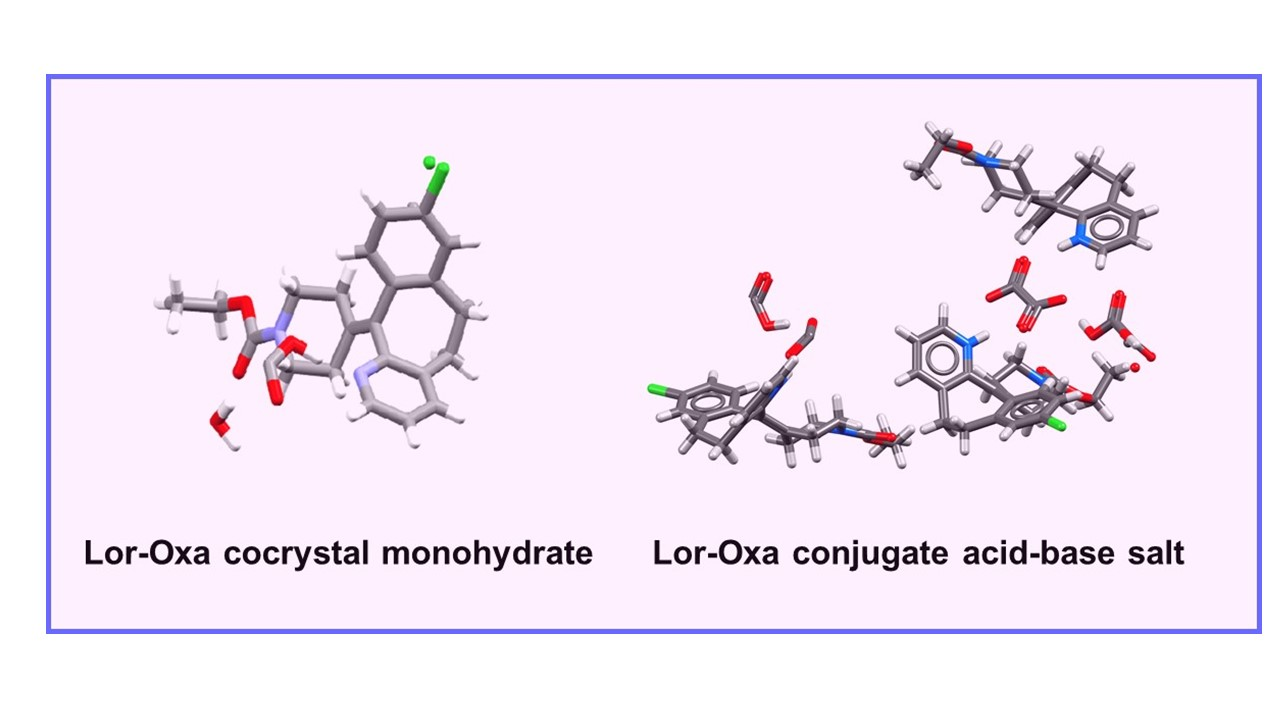
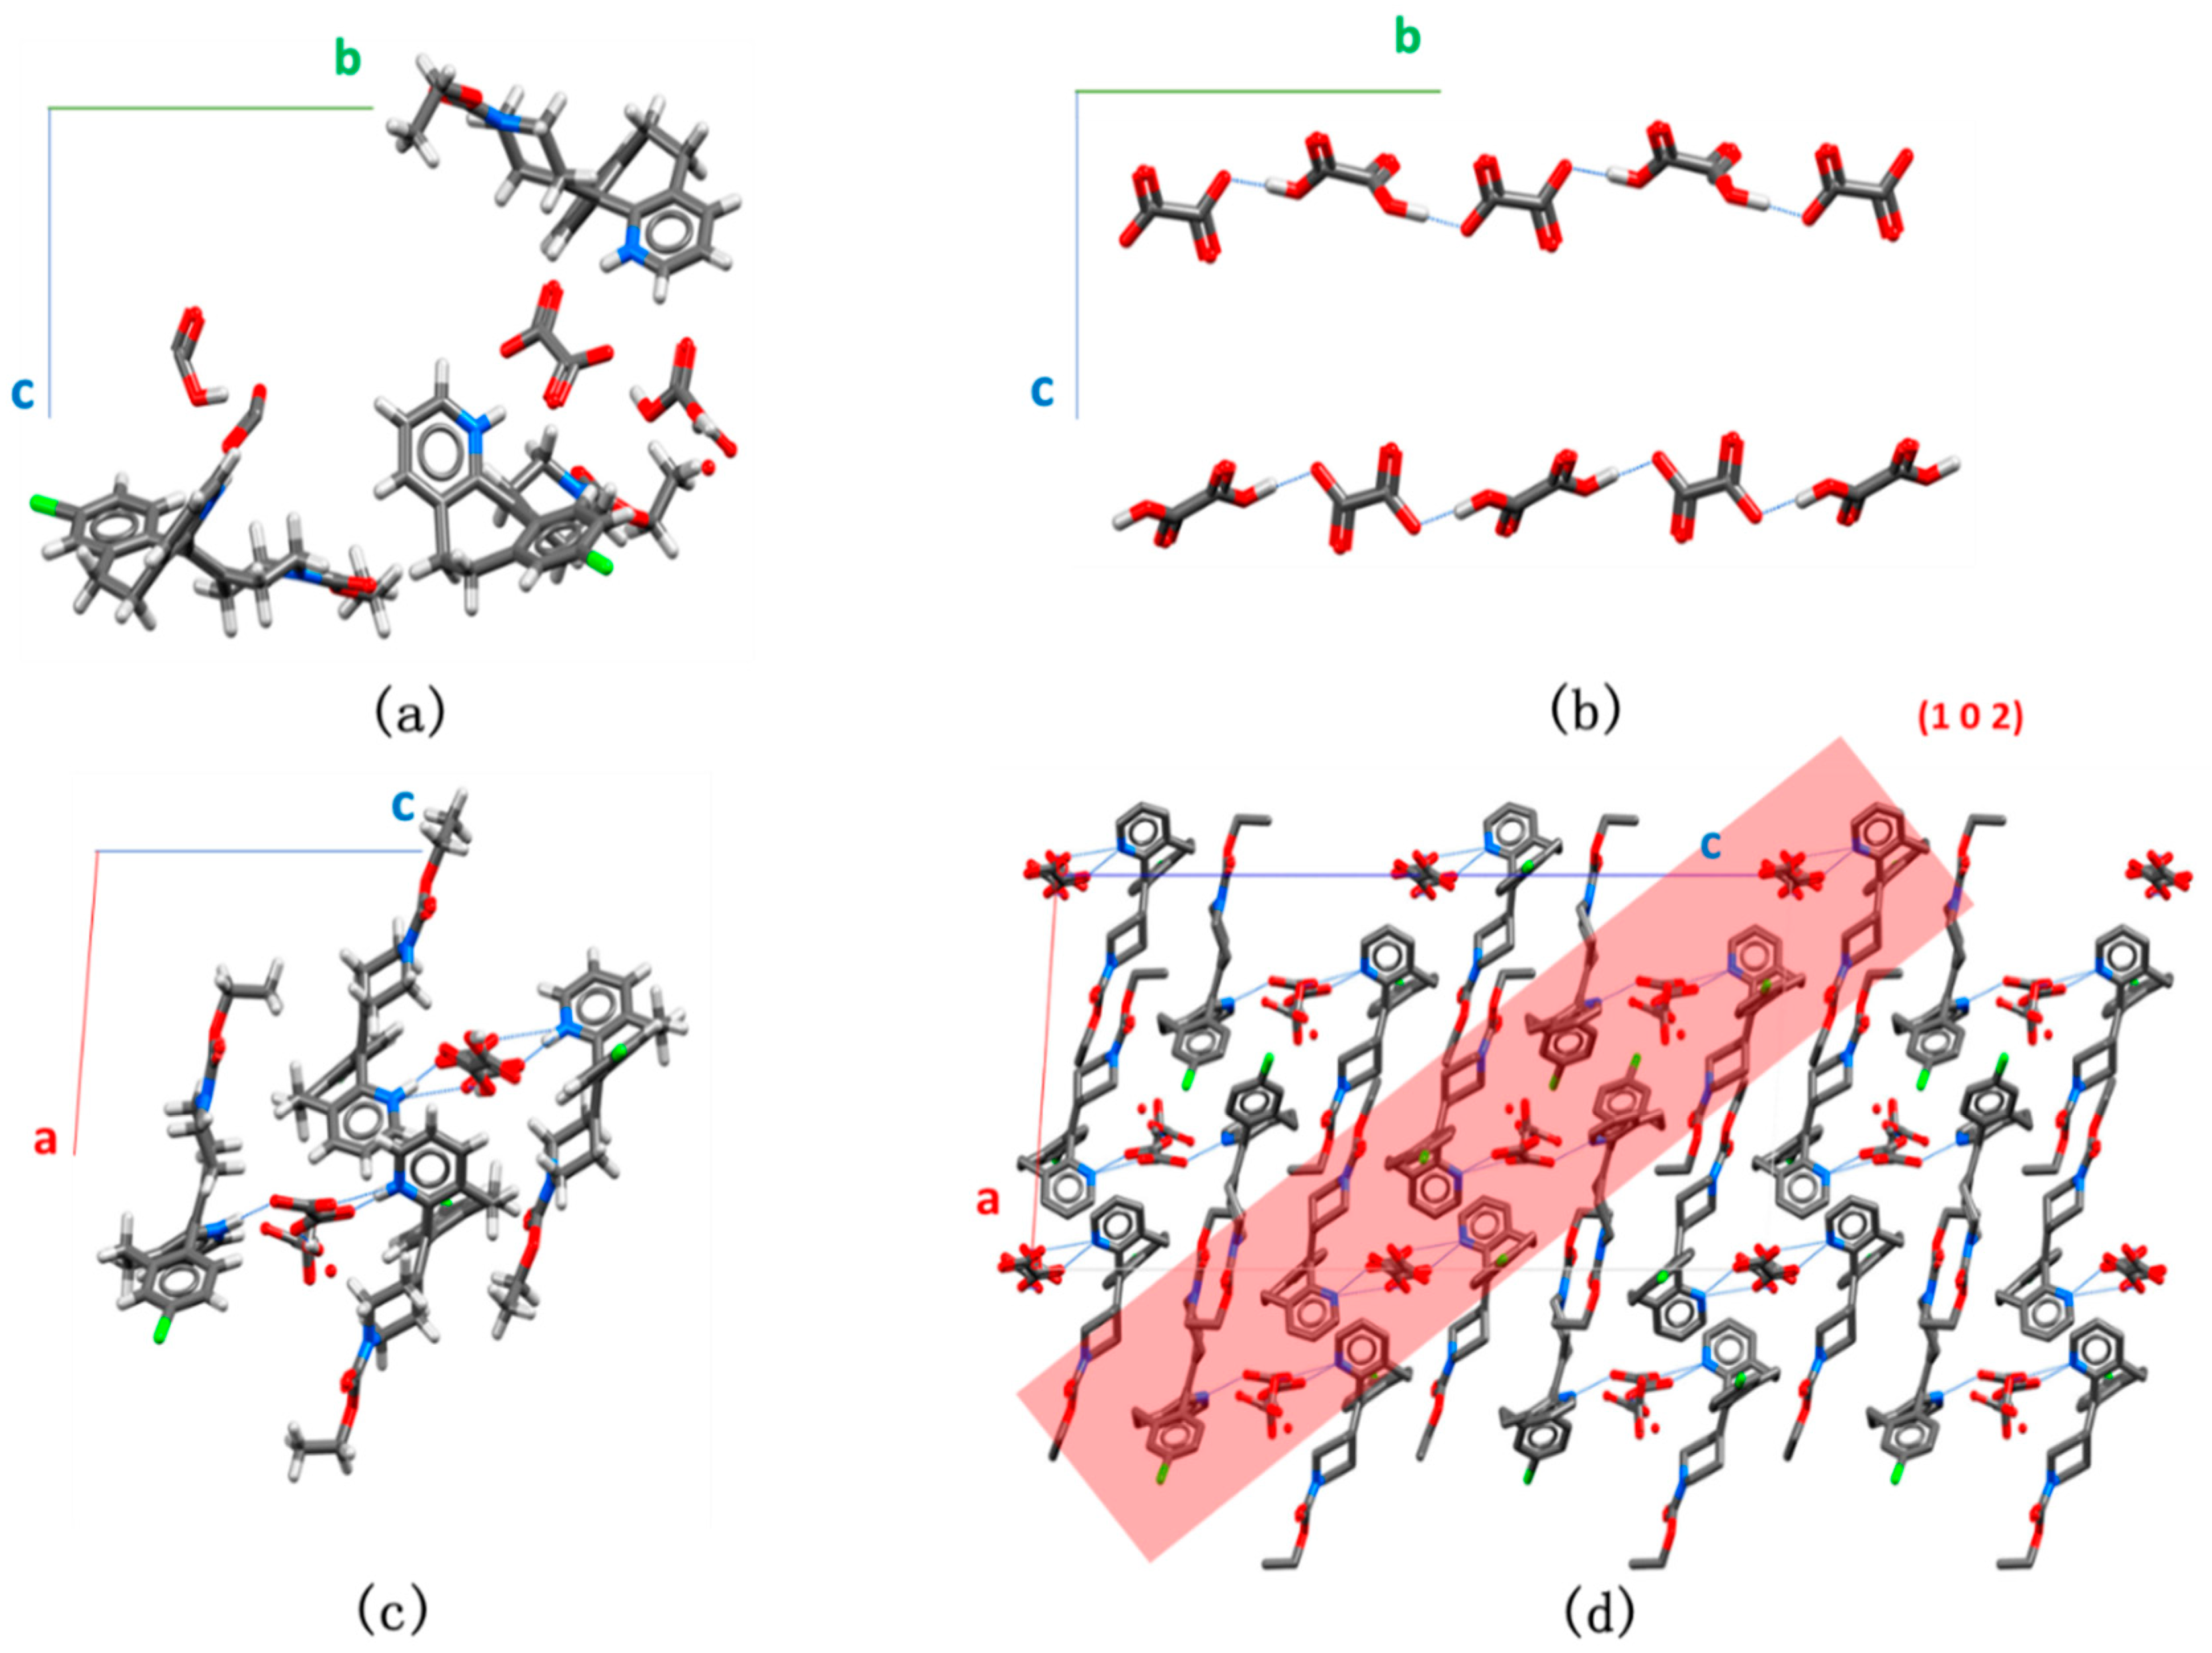
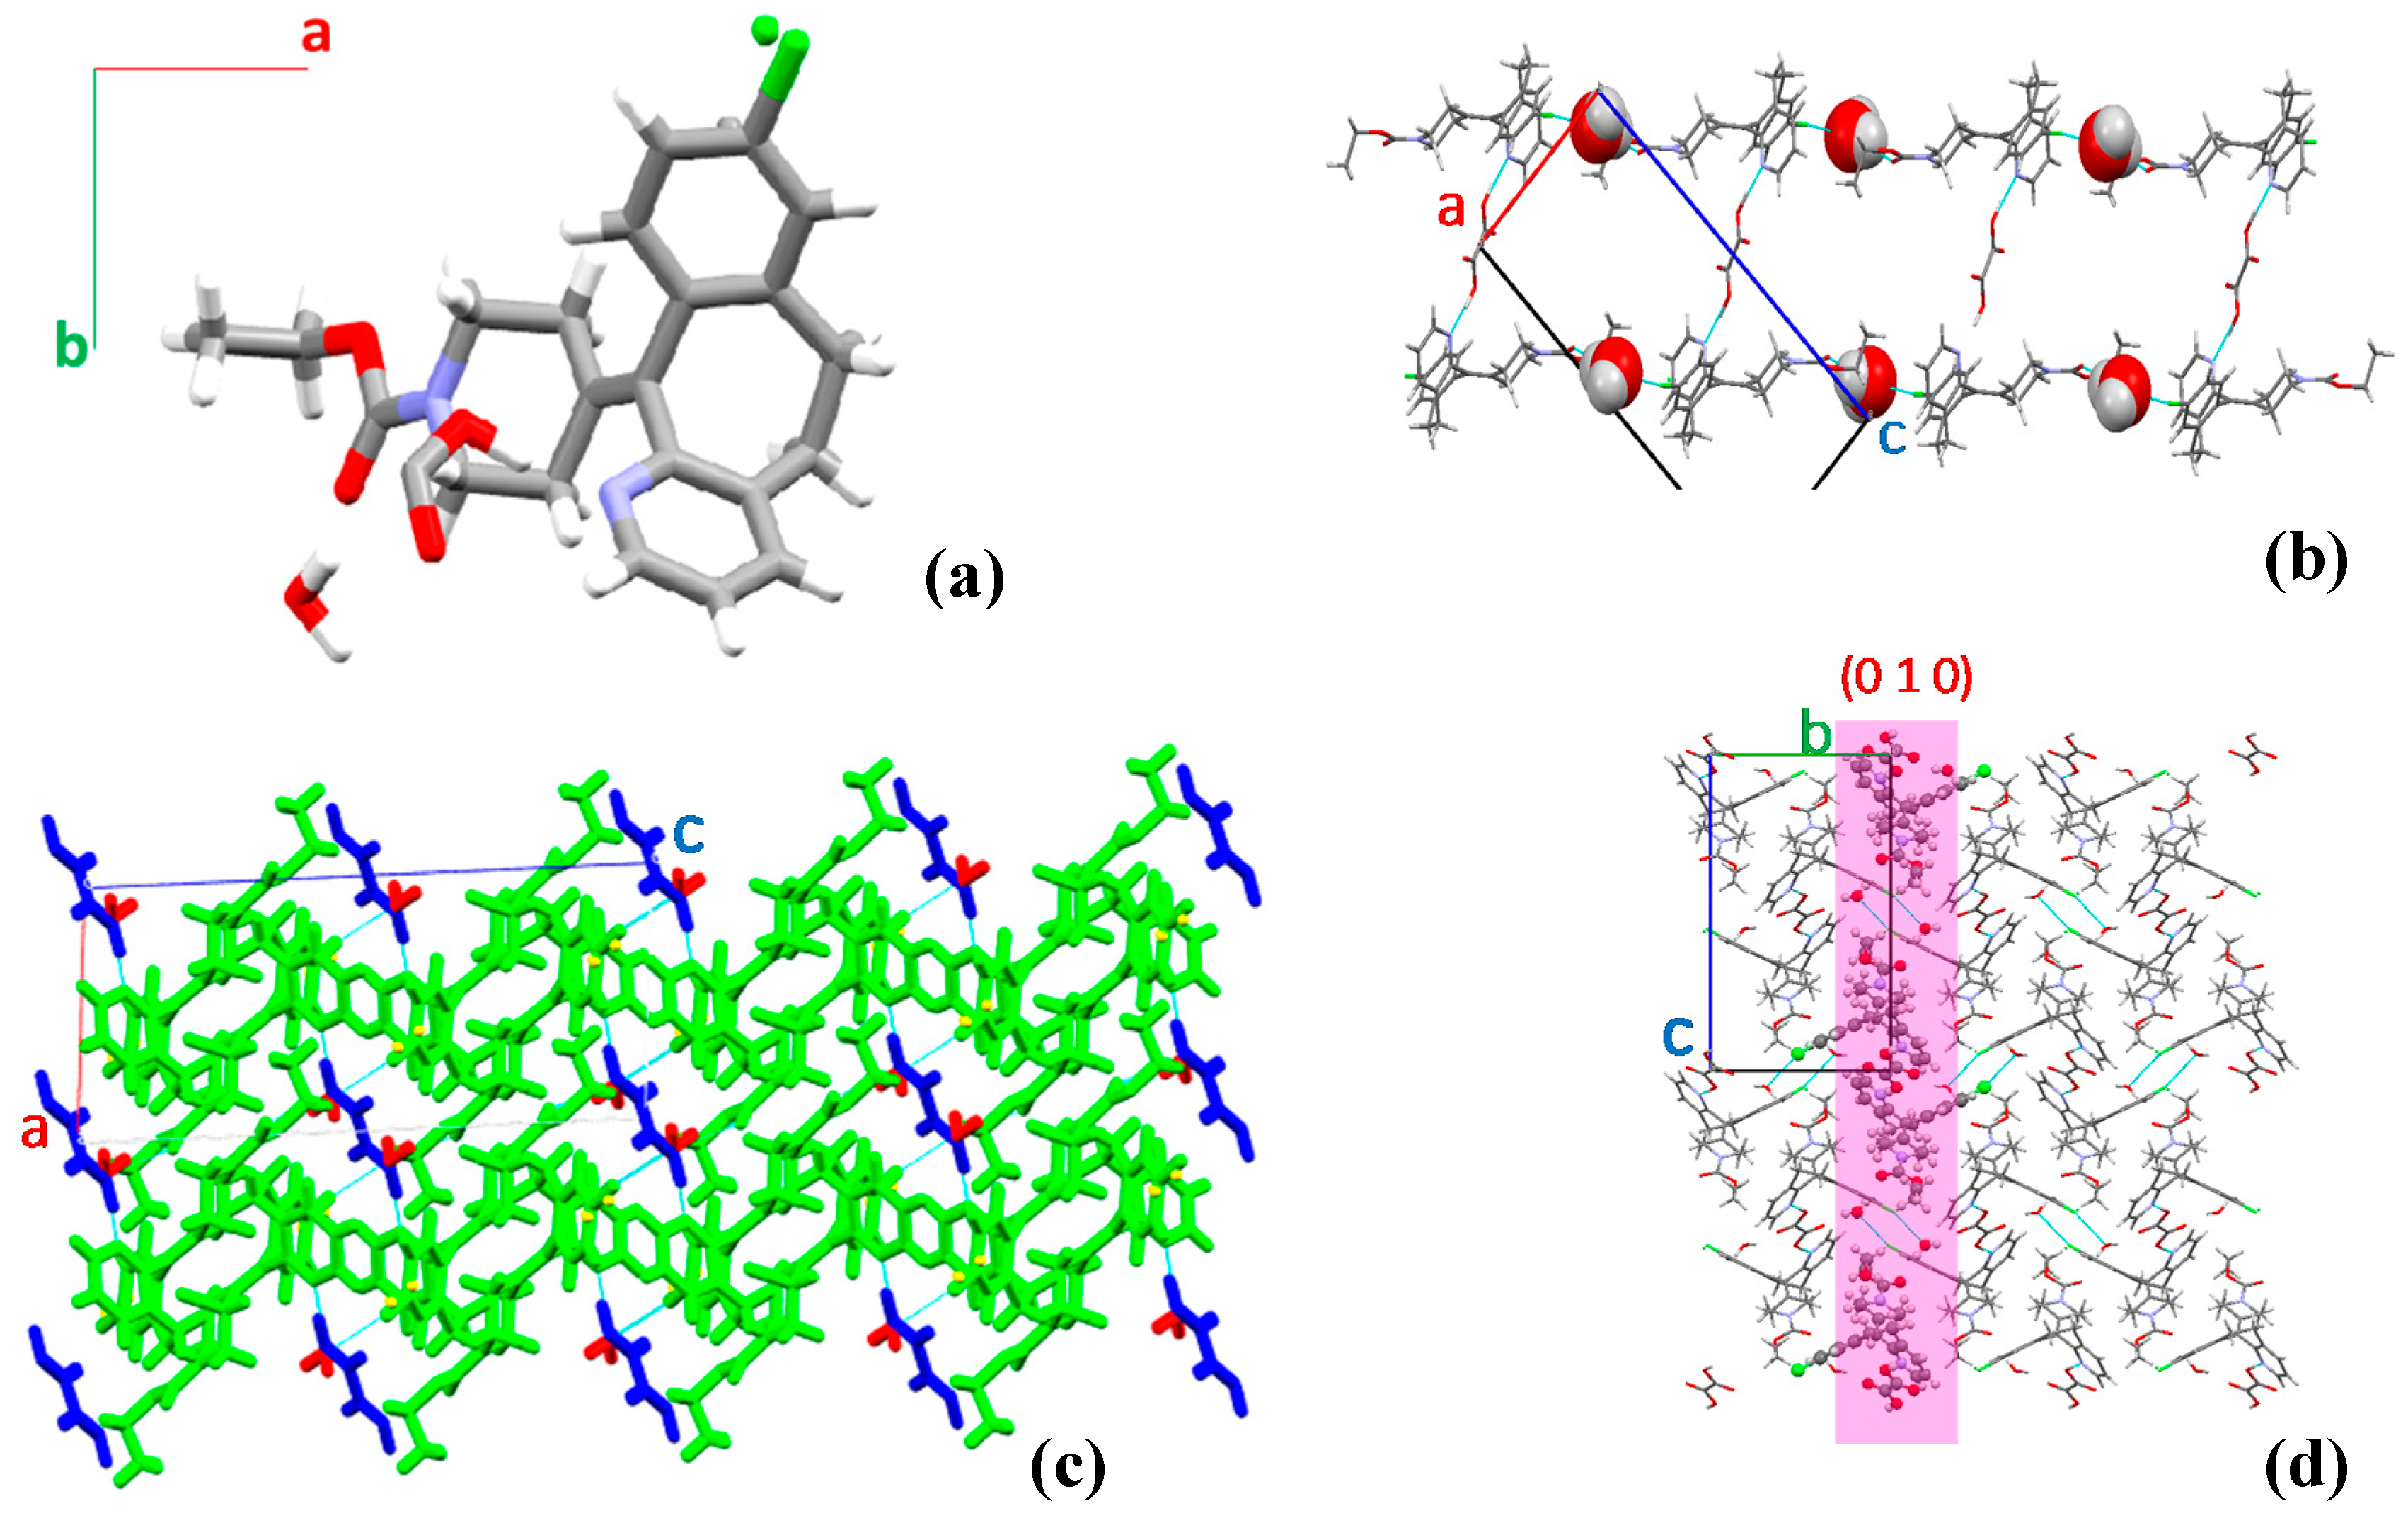
3.1. Crystal Screening and Structure Analysis
3.2. Formation Conditions of the Two Crystals
3.3. Solid State Characterization
3.4. Moisture Sorption and Desorption Behavior
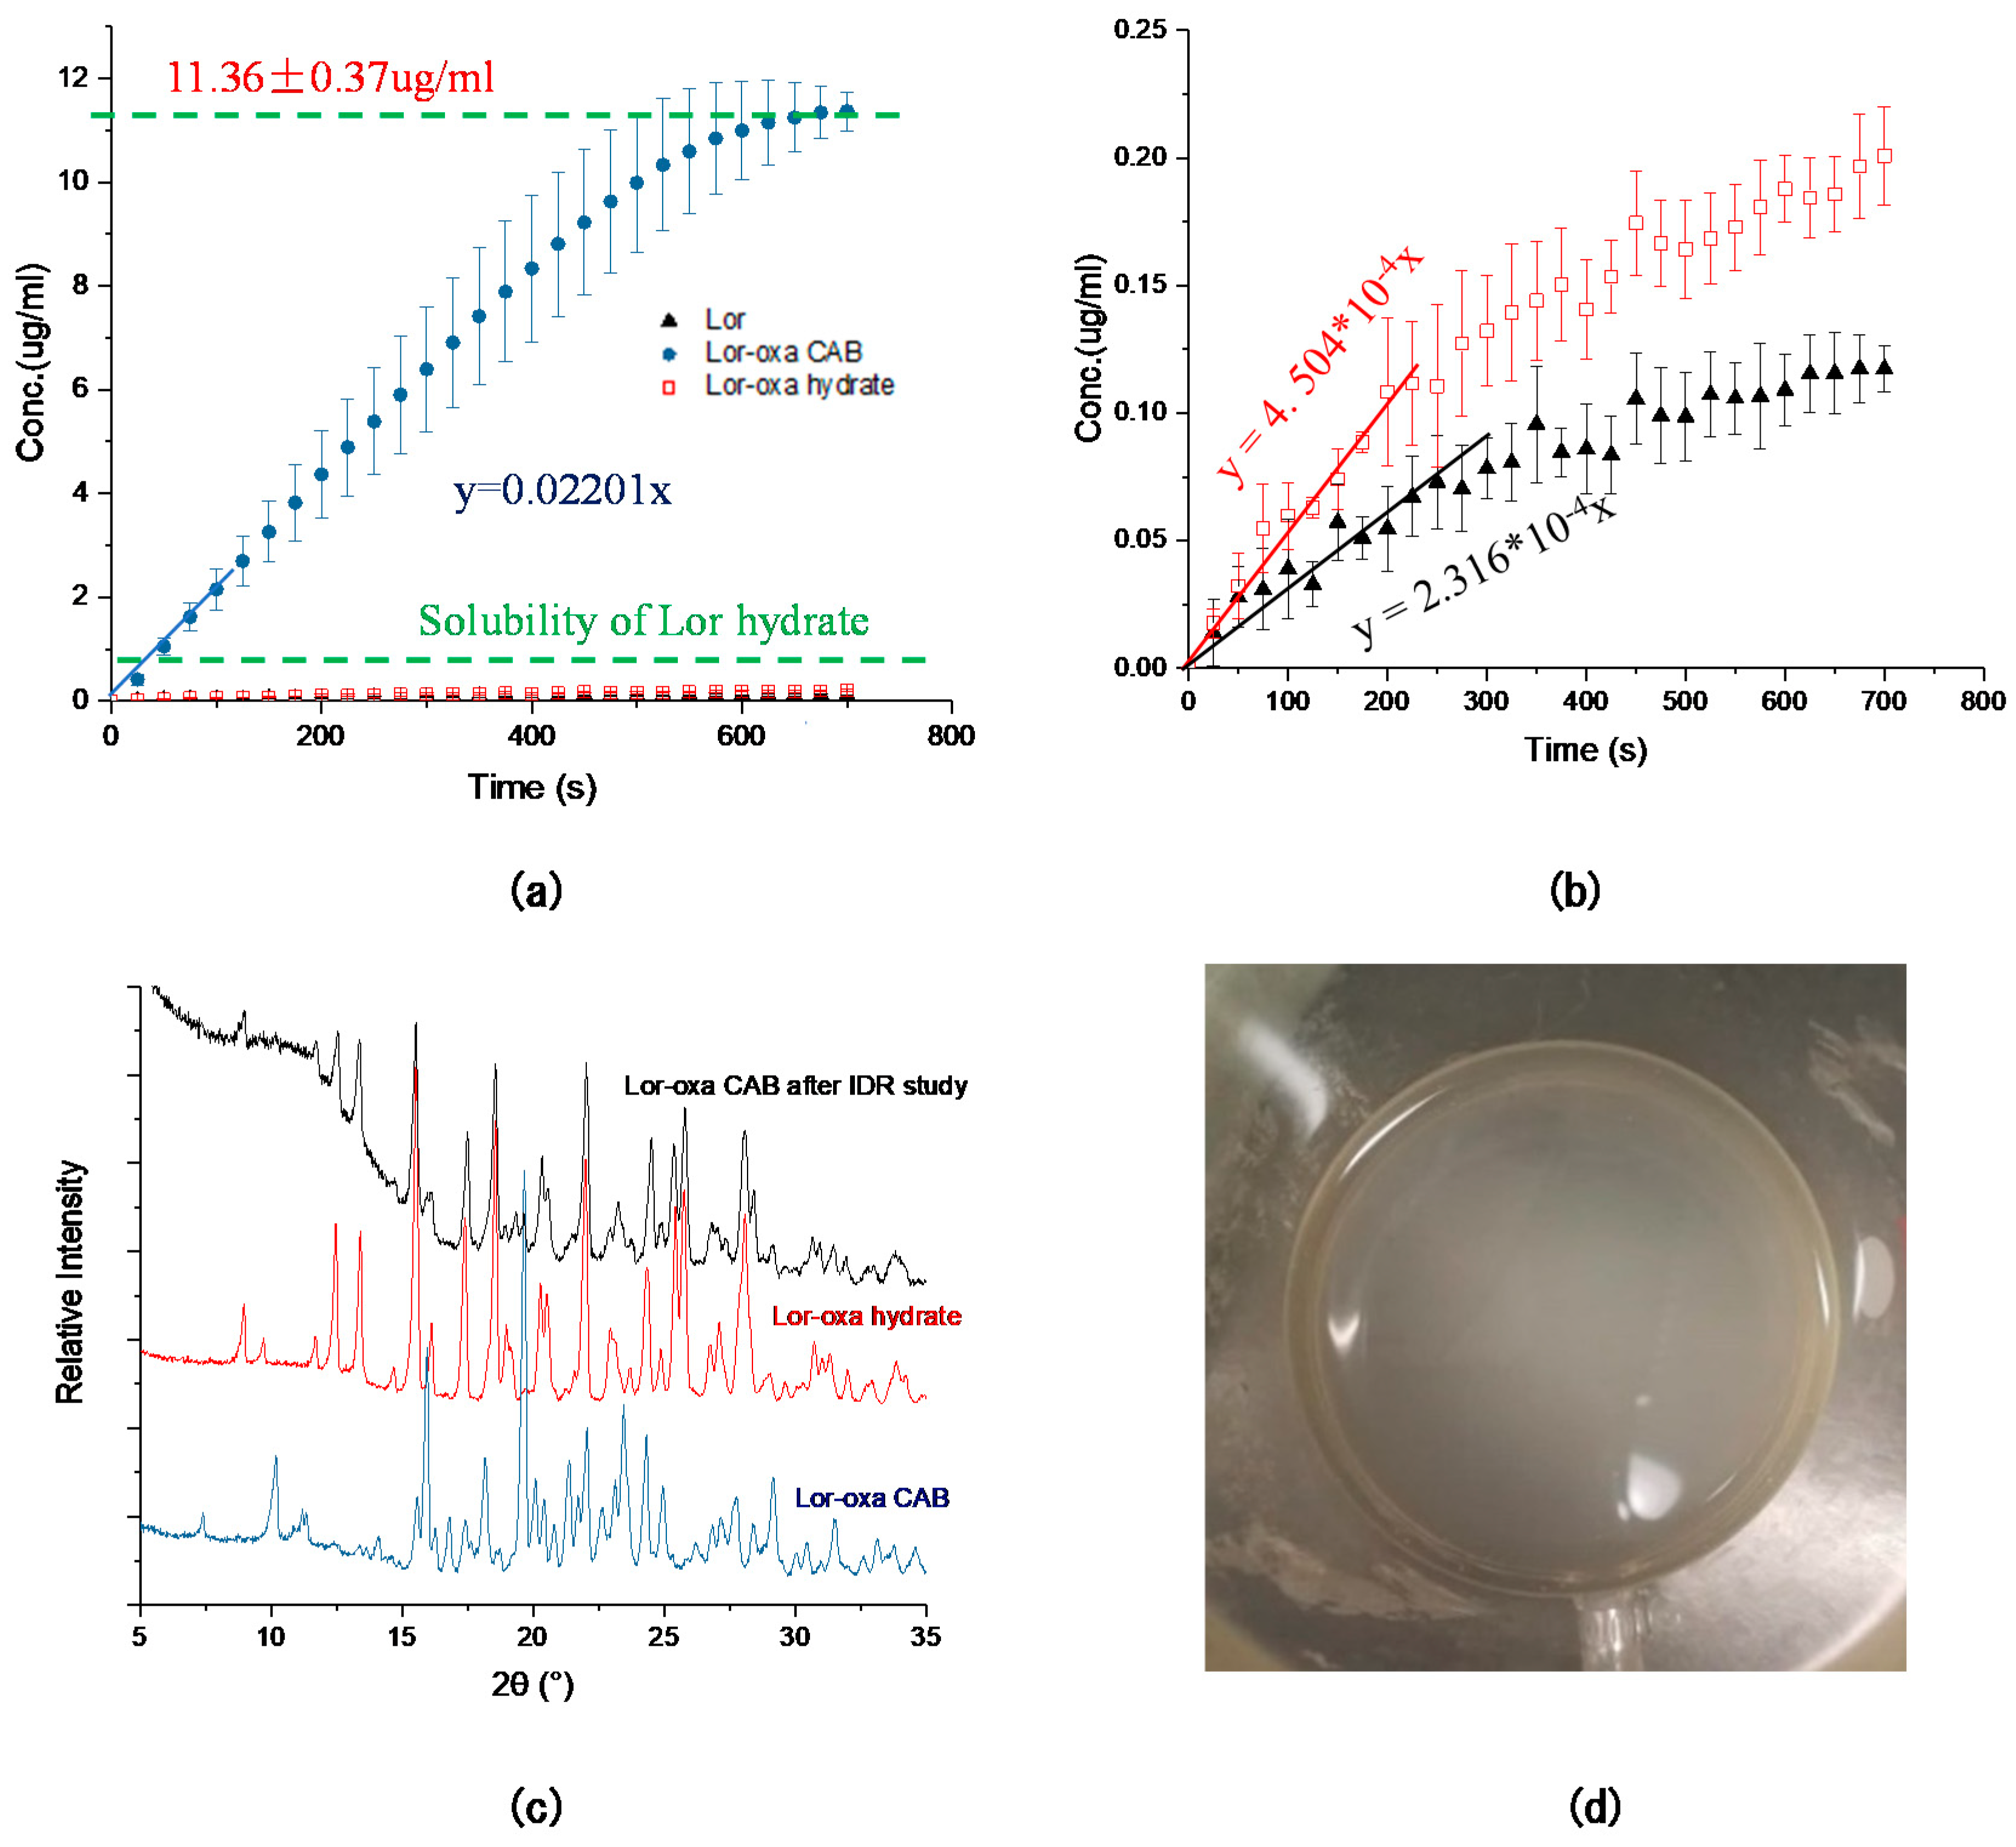
3.5. Solubility and Intrinsic Dissolution Rate
3.6. Tabletability
4. Conclusions
Supplementary Materials
Author Contributions
Funding
Acknowledgments
Conflicts of Interest
References
- Vieth, M.; Siegel, M.G.; Higgs, R.E.; Watson, I.A.; Robertson, D.H.; Savin, K.A.; Durst, G.L.; Hipskind, P.A. Characteristic Physical Properties and Structural Fragments of Marketed Oral Drugs. J. Med. Chem. 2004, 47, 224–232. [Google Scholar] [CrossRef] [PubMed]
- Williams, H.D.; Trevaskis, N.L.; Charman, S.A.; Shanker, R.M.; Charman, W.N.; Pouton, C.W.; Porter, C.J. Strategies to address low drug solubility in discovery and development. Pharm. Rev. 2013, 65, 315–499. [Google Scholar] [CrossRef] [PubMed]
- Bučar, D.-K.; Filip, S.; Arhangelskis, M.; Lloyd, G.O.; Jones, W. Advantages of mechanochemical cocrystallisation in the solid-state chemistry of pigments: Colour-tuned fluorescein cocrystals. CrystEngComm 2013, 15, 6289–6291. [Google Scholar] [CrossRef]
- Sun, C.C. Cocrystallization for successful drug delivery. Expert Opin. Drug Deliv. 2013, 10, 201–213. [Google Scholar] [CrossRef] [PubMed]
- Aitipamula, S.; Banerjee, R.; Bansal, A.K.; Biradha, K.; Cheney, M.L.; Choudhury, A.R.; Desiraju, G.R.; Dikundwar, A.G.; Dubey, R.; Duggirala, N.; et al. Polymorphs, Salts, and Cocrystals: What’s in a Name? Cryst. Growth Des. 2012, 12, 2147–2152. [Google Scholar] [CrossRef]
- Perumalla, S.R.; Sun, C.C. Improved solid-state stability of salts by cocrystallization between conjugate acid–base pairs. CrystEngComm 2013, 15, 5756–5759. [Google Scholar] [CrossRef]
- Deng, J.-H.; Lu, T.-B.; Sun, C.C.; Chen, J.-M. Dapagliflozin-citric acid cocrystal showing better solid state properties than dapagliflozin. Eur. J. Pharm. Sci. 2017, 104, 255–261. [Google Scholar] [CrossRef] [PubMed]
- Wang, C.; Tong, Q.; Hou, X.; Hu, S.; Fang, J.; Sun, C.C. Enhancing bioavailability of dihydromyricetin through inhibiting precipitation of soluble cocrystals by a crystallization inhibitor. Cryst. Growth Des. 2016, 16, 5030–5039. [Google Scholar] [CrossRef]
- Yamashita, H.; Sun, C.C. Improving dissolution rate of carbamazepine-glutaric acid cocrystal through solubilization by excess coformer. Pharm. Res. 2018, 35, 4. [Google Scholar] [CrossRef]
- Sun, C.C.; Hou, H. Improving mechanical properties of caffeine and methyl gallate crystals by cocrystallization. Cryst. Growth Des. 2008, 8, 1575–1579. [Google Scholar] [CrossRef]
- Yan, Y.; Chen, J.-M.; Lu, T.-B. Simultaneously enhancing the solubility and permeability of acyclovir by crystal engineering approach. CrystEngComm 2013, 15, 6457–6460. [Google Scholar] [CrossRef]
- Wang, C.; Paul, S.; Sun, D.J.; Nilsson Lill, S.O.; Sun, C.C. Mitigating punch sticking propensity of celecoxib by cocrystallization–an integrated computational and experimental approach. Cryst. Growth Des. 2020, 20, 4217–4223. [Google Scholar] [CrossRef]
- Chen, H.; Guo, Y.; Wang, C.; Dun, J.; Sun, C.C. Spherical Cocrystallization—An Enabling Technology for the Development of High Dose Direct Compression Tablets of Poorly Soluble Drugs. Cryst. Growth Des. 2019, 19, 2503–2510. [Google Scholar] [CrossRef]
- Simons, F.E. Advances in H1-antihistamines. N. Engl. J. Med. 2004, 351, 2203–2217. [Google Scholar] [CrossRef]
- Popović, G.; Čakar, M.; Agbaba, D. Acid–base equilibria and solubility of loratadine and desloratadine in water and micellar media. J. Pharm. Biomed. Anal. 2009, 49, 42–47. [Google Scholar] [CrossRef] [PubMed]
- Khan MZ, I.; Raušl, D.; Zanoški, R.; Zidar, S.; Mikulčić, J.H.; Krizmanić, L.; Knežević, Z. Classification of Loratadine Based on the Biopharmaceutics Drug Classification Concept and Possible i in Vitro–in VivoCorrelation. Biol. Pharm. Bull. 2004, 27, 1630–1635. [Google Scholar] [CrossRef]
- Sora, D.I.; Udrescu, S.; David, V.; Medvedovici, A. Validated ion pair liquid chromatography/fluorescence detection method for assessing the variability of the loratadine metabolism occurring in bioequivalence studies. Biomed. Chromatogr. 2007, 21, 1023–1029. [Google Scholar] [CrossRef]
- Zhang, S.; Sun, M.; Zhao, Y.; Song, X.; He, Z.; Wang, J.; Sun, J. Molecular mechanism of polymer-assisting supersaturation of poorly water-soluble loratadine based on experimental observations and molecular dynamic simulations. Drug Deliv. Transl. Res. 2017, 7, 738–749. [Google Scholar] [CrossRef]
- Kuminek, G.; Cavanagh, K.L.; da Piedade, M.F.M.; Rodríguez-Hornedo, N. Posaconazole Cocrystal with Superior Solubility and Dissolution Behavior. Cryst. Growth Des. 2019, 19, 6592–6602. [Google Scholar] [CrossRef]
- Nacsa, A.; Ambrus, R.; Berkesi, O.; Szabo-Revesz, P.; Aigner, Z. Water-soluble loratadine inclusion complex: Analytical control of the preparation by microwave irradiation. J. Pharm. Biomed. Anal. 2008, 48, 1020–1023. [Google Scholar] [CrossRef]
- Lin, S.-Y.; Hsu, C.-H.; Sheu, M.-T. Curve-fitting FTIR studies of loratadine/hydroxypropyl-β-cyclodextrin inclusion complex induced by co-grinding process. J. Pharm. Biomed. Anal. 2010, 53, 799–803. [Google Scholar] [CrossRef]
- Frizon, F.; Eloy, J.d.O.; Donaduzzi, C.M.; Mitsui, M.L.; Marchetti, J.M. Dissolution rate enhancement of loratadine in polyvinylpyrrolidone K-30 solid dispersions by solvent methods. Powder Technol. 2013, 235, 532–539. [Google Scholar] [CrossRef]
- Bandari, S.; Jadav, S.; Eedara, B.B.; Dhurke, R.; Jukanti, R. Enhancement of Solubility and Dissolution Rate of Loratadine with Gelucire 50/13. J. Pharm. Innov. 2014, 9, 141–149. [Google Scholar] [CrossRef]
- Milak, S.; Medlicott, N.; Tucker, I.G. Solid lipid microparticles containing loratadine prepared using a Micromixer. J. Microencapsul. 2006, 23, 823–831. [Google Scholar] [CrossRef]
- Üner, M.; Karaman, E.F.; Aydoğmuş, Z. Solid Lipid Nanoparticles and Nanostructured Lipid Carriers of Loratadine for Topical Application: Physicochemical Stability and Drug Penetration through Rat Skin. Trop. J. Pharm. Res. 2014, 13. [Google Scholar] [CrossRef]
- Madhav, K.V.; Kishan, V. Self microemulsifying particles of loratadine for improved oral bioavailability: Preparation, characterization and in vivo evaluation. J. Pharm. Investig. 2018, 48, 497–508. [Google Scholar] [CrossRef]
- Wang, J.; Chang, R.; Zhao, Y.; Zhang, J.; Zhang, T.; Fu, Q.; Chang, C.; Zeng, A. Coamorphous Loratadine-Citric Acid System with Enhanced Physical Stability and Bioavailability. Aaps Pharmscitech 2017, 18, 2541–2550. [Google Scholar] [CrossRef]
- Alatas, F.; Aprilliana, M.; Gozali, D. The Preparation And Solubility Of Loratadine-Fumaric Acid Binary Mixture. Asian J. Pharm. Clin. Res. 2016, 10. [Google Scholar] [CrossRef]
- Wang, C.; Perumalla, S.R.; Lu, R.; Fang, J.; Sun, C.C. Sweet Berberine. Cryst. Growth Des. 2016, 16, 933–939. [Google Scholar] [CrossRef]
- Wen, H.; Wang, C.; Sun, C.C. Fast Determination of Phase Stability of Hydrates Using Intrinsic Dissolution Rate Measurements. Cryst. Growth Des. 2019, 19, 5471–5476. [Google Scholar] [CrossRef]
- Fell, J.T.; Newton, J.M. Determination of Tablet Strength by the Diametral-Compression Test. J. Pharm. Sci. 1970, 59, 688–691. [Google Scholar] [CrossRef]
- Leane, M.; Pitt, K.; Reynolds, G. A proposal for a drug product Manufacturing Classification System (MCS) for oral solid dosage forms. Pharm. Dev. Technol. 2015, 20, 12–21. [Google Scholar] [CrossRef]
- Wang, C.; Chopade, S.A.; Guo, Y.; Early, J.T.; Tang, B.; Wang, E.; Hillmyer, M.A.; Lodge, T.P.; Sun, C.C. Preparation, characterization, and formulation development of drug–drug protic ionic liquids of diphenhydramine with ibuprofen and naproxen. Mol. Pharm. 2018, 15, 4190–4201. [Google Scholar] [CrossRef] [PubMed]
- Good, D.J.; Rodríguez-Hornedo, N.R. Solubility Advantage of Pharmaceutical Cocrystals. Cryst. Growth Des. 2009, 9, 2252–2264. [Google Scholar] [CrossRef]
- Chen, H.; Aburub, A.; Sun, C.C. Direct Compression Tablet Containing 99% Active Ingredient—A Tale of Spherical Crystallization. J. Pharm. Sci. 2019, 108, 1396–1400. [Google Scholar] [CrossRef]
- Paul, S.; Sun, C.C. Gaining insight into tablet capping tendency from compaction simulation. Int. J. Pharm. 2017, 524, 111–120. [Google Scholar] [CrossRef]
- Osei-Yeboah, F.; Chang, S.-Y.; Sun, C.C. A critical examination of the phenomenon of bonding area-bonding strength interplay in powder tableting. Pharm. Res. 2016, 33, 1126–1132. [Google Scholar] [CrossRef]
- Paul, S.; Wang, C.; Sun, C.C. Tabletability Flip—Role of Bonding Area and Bonding Strength Interplay. J. Pharm. Sci. 2020. [Google Scholar] [CrossRef]
- Sun, C.C.; Hou, H.; Gao, P.; Ma, C.; Medina, C.; Alvarez, F.J. Development of a high drug load tablet formulation based on assessment of powder manufacturability: Moving towards quality by design. J. Pharm. Sci. 2009, 98, 239–247. [Google Scholar] [CrossRef]


| Lor-Oxa CAB | Lor-Oxa Hydrate | |
|---|---|---|
| Formula | C48H50Cl2N4O12 | C23H26ClN2O5 |
| Formula weight | 945.82 | 445.91 |
| Temperature/K | 100 | 100 |
| Crystal system | Monoclinic | Monoclinic |
| Space group | P21/c | P21/c |
| a, Å | 16.5860 (8) | 9.1806 (3) |
| b, Å | 10.6133 (5) | 11.4581 (3) |
| c, Å | 38.1283 (17) | 20.1427 (6) |
| β, deg | 94.606 (2) | 94.084 (1) |
| Volume, Å3 | 6690.1 (5) | 2113.48 (11) |
| z | 6 | 4 |
| Dc/g.cm3 | 1.409 | 1.401 |
| F(000) | 2976.0 | 940 |
| R1 [I > 2σ(I)] | 0.0550 | 0.0552 |
| wR2 [I > 2sigma(I)] | 0.1291 | 0.1647 |
| CCDC | 1,840,642 | 2,023,546 |
| Lor | Lor-Oxa CAB | Lor-Oxa Hydrate | |
|---|---|---|---|
| Solubility (mg·L−1) | 0.7 ± 0.0 | -- | 1.15 ± 0.04 |
| IDR × 104 (μg·cm−2·s−1) | 2.32 ± 0.16 | 220.1 ± 4.8 | 4.28 ± 0.22 |
Publisher’s Note: MDPI stays neutral with regard to jurisdictional claims in published maps and institutional affiliations. |
© 2020 by the authors. Licensee MDPI, Basel, Switzerland. This article is an open access article distributed under the terms and conditions of the Creative Commons Attribution (CC BY) license (http://creativecommons.org/licenses/by/4.0/).
Share and Cite
Liang, Z.; Chen, H.; Wang, C.; Sun, C.C. Discovery, Characterization, and Pharmaceutical Applications of Two Loratadine–Oxalic Acid Cocrystals. Crystals 2020, 10, 996. https://doi.org/10.3390/cryst10110996
Liang Z, Chen H, Wang C, Sun CC. Discovery, Characterization, and Pharmaceutical Applications of Two Loratadine–Oxalic Acid Cocrystals. Crystals. 2020; 10(11):996. https://doi.org/10.3390/cryst10110996
Chicago/Turabian StyleLiang, Zhengxuan, Hongbo Chen, Chenguang Wang, and Changquan Calvin Sun. 2020. "Discovery, Characterization, and Pharmaceutical Applications of Two Loratadine–Oxalic Acid Cocrystals" Crystals 10, no. 11: 996. https://doi.org/10.3390/cryst10110996
APA StyleLiang, Z., Chen, H., Wang, C., & Sun, C. C. (2020). Discovery, Characterization, and Pharmaceutical Applications of Two Loratadine–Oxalic Acid Cocrystals. Crystals, 10(11), 996. https://doi.org/10.3390/cryst10110996