Effect of Cavity Structure on Acoustic Characteristics of Phononic Crystals Based on Double-Layer Plates


Abstract

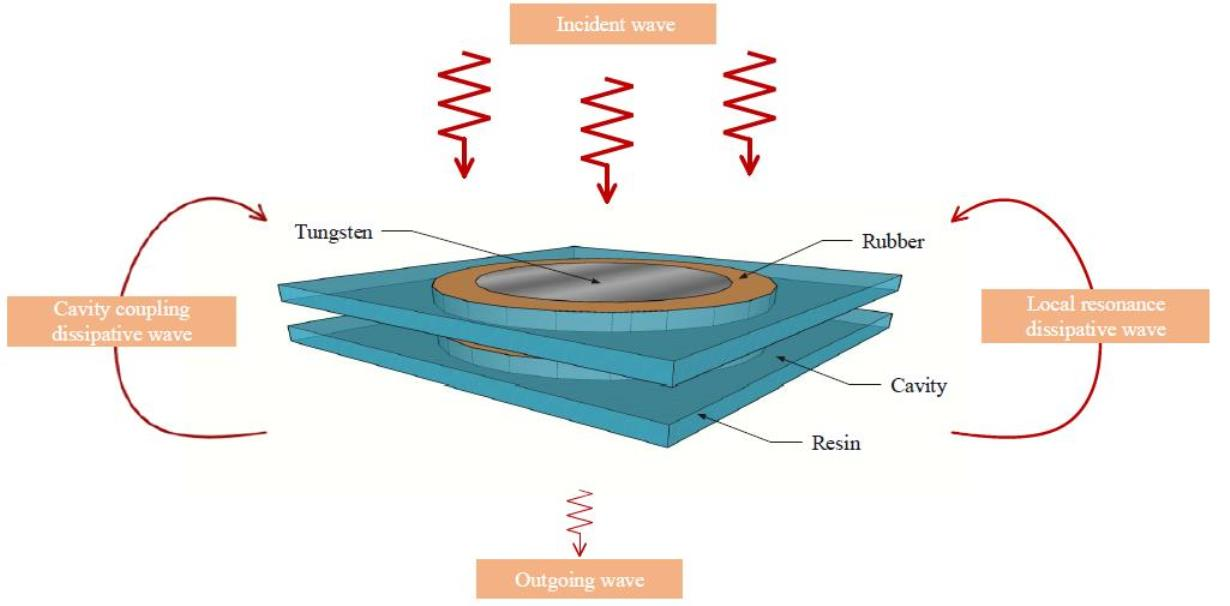
1. Introduction
2. Principle and Method of Band Structure
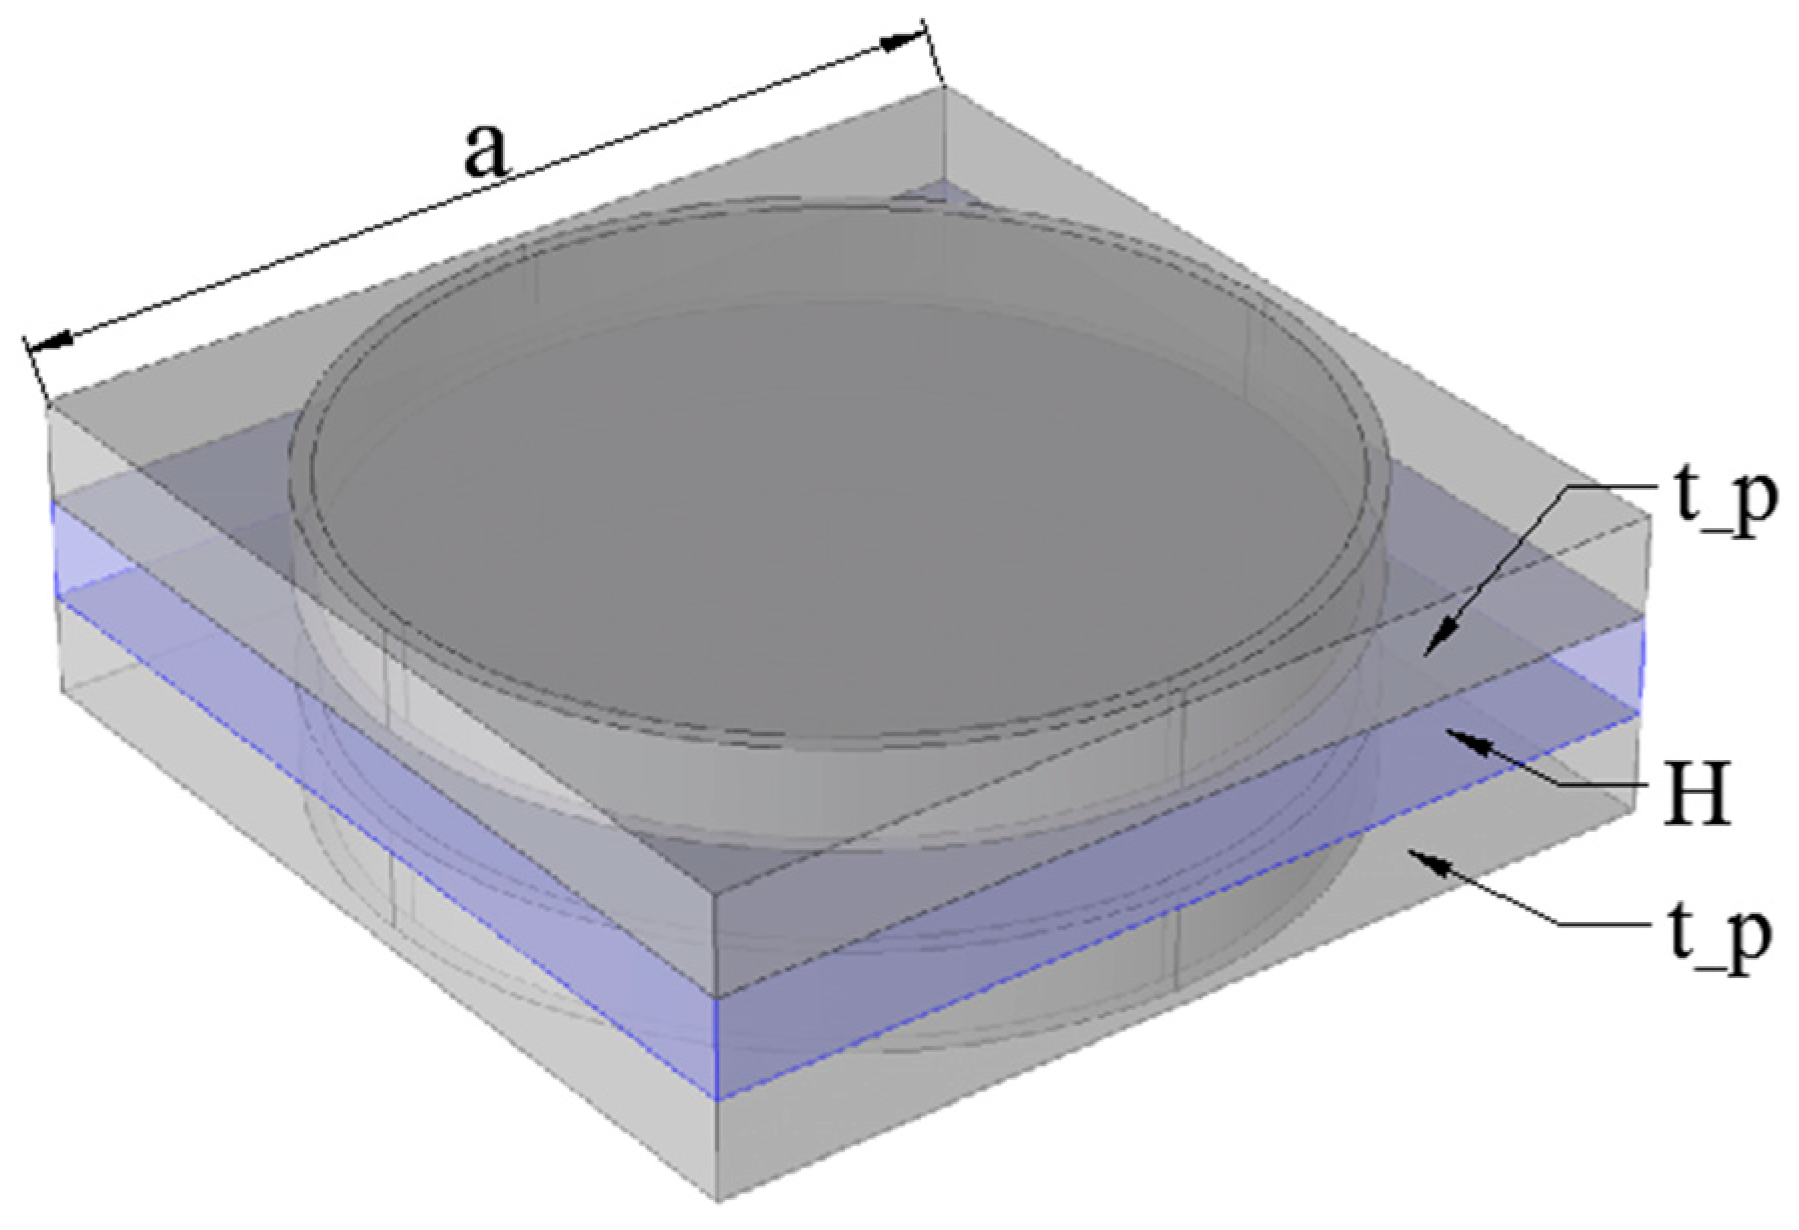
3. Material and Method of STL
4. Results and Discussion
4.1. Band Structure Analysis
4.2. Influence of Phononic Crystals Plate Structure on the STL of the Plate and the Phononic Crystals Cavity Plates
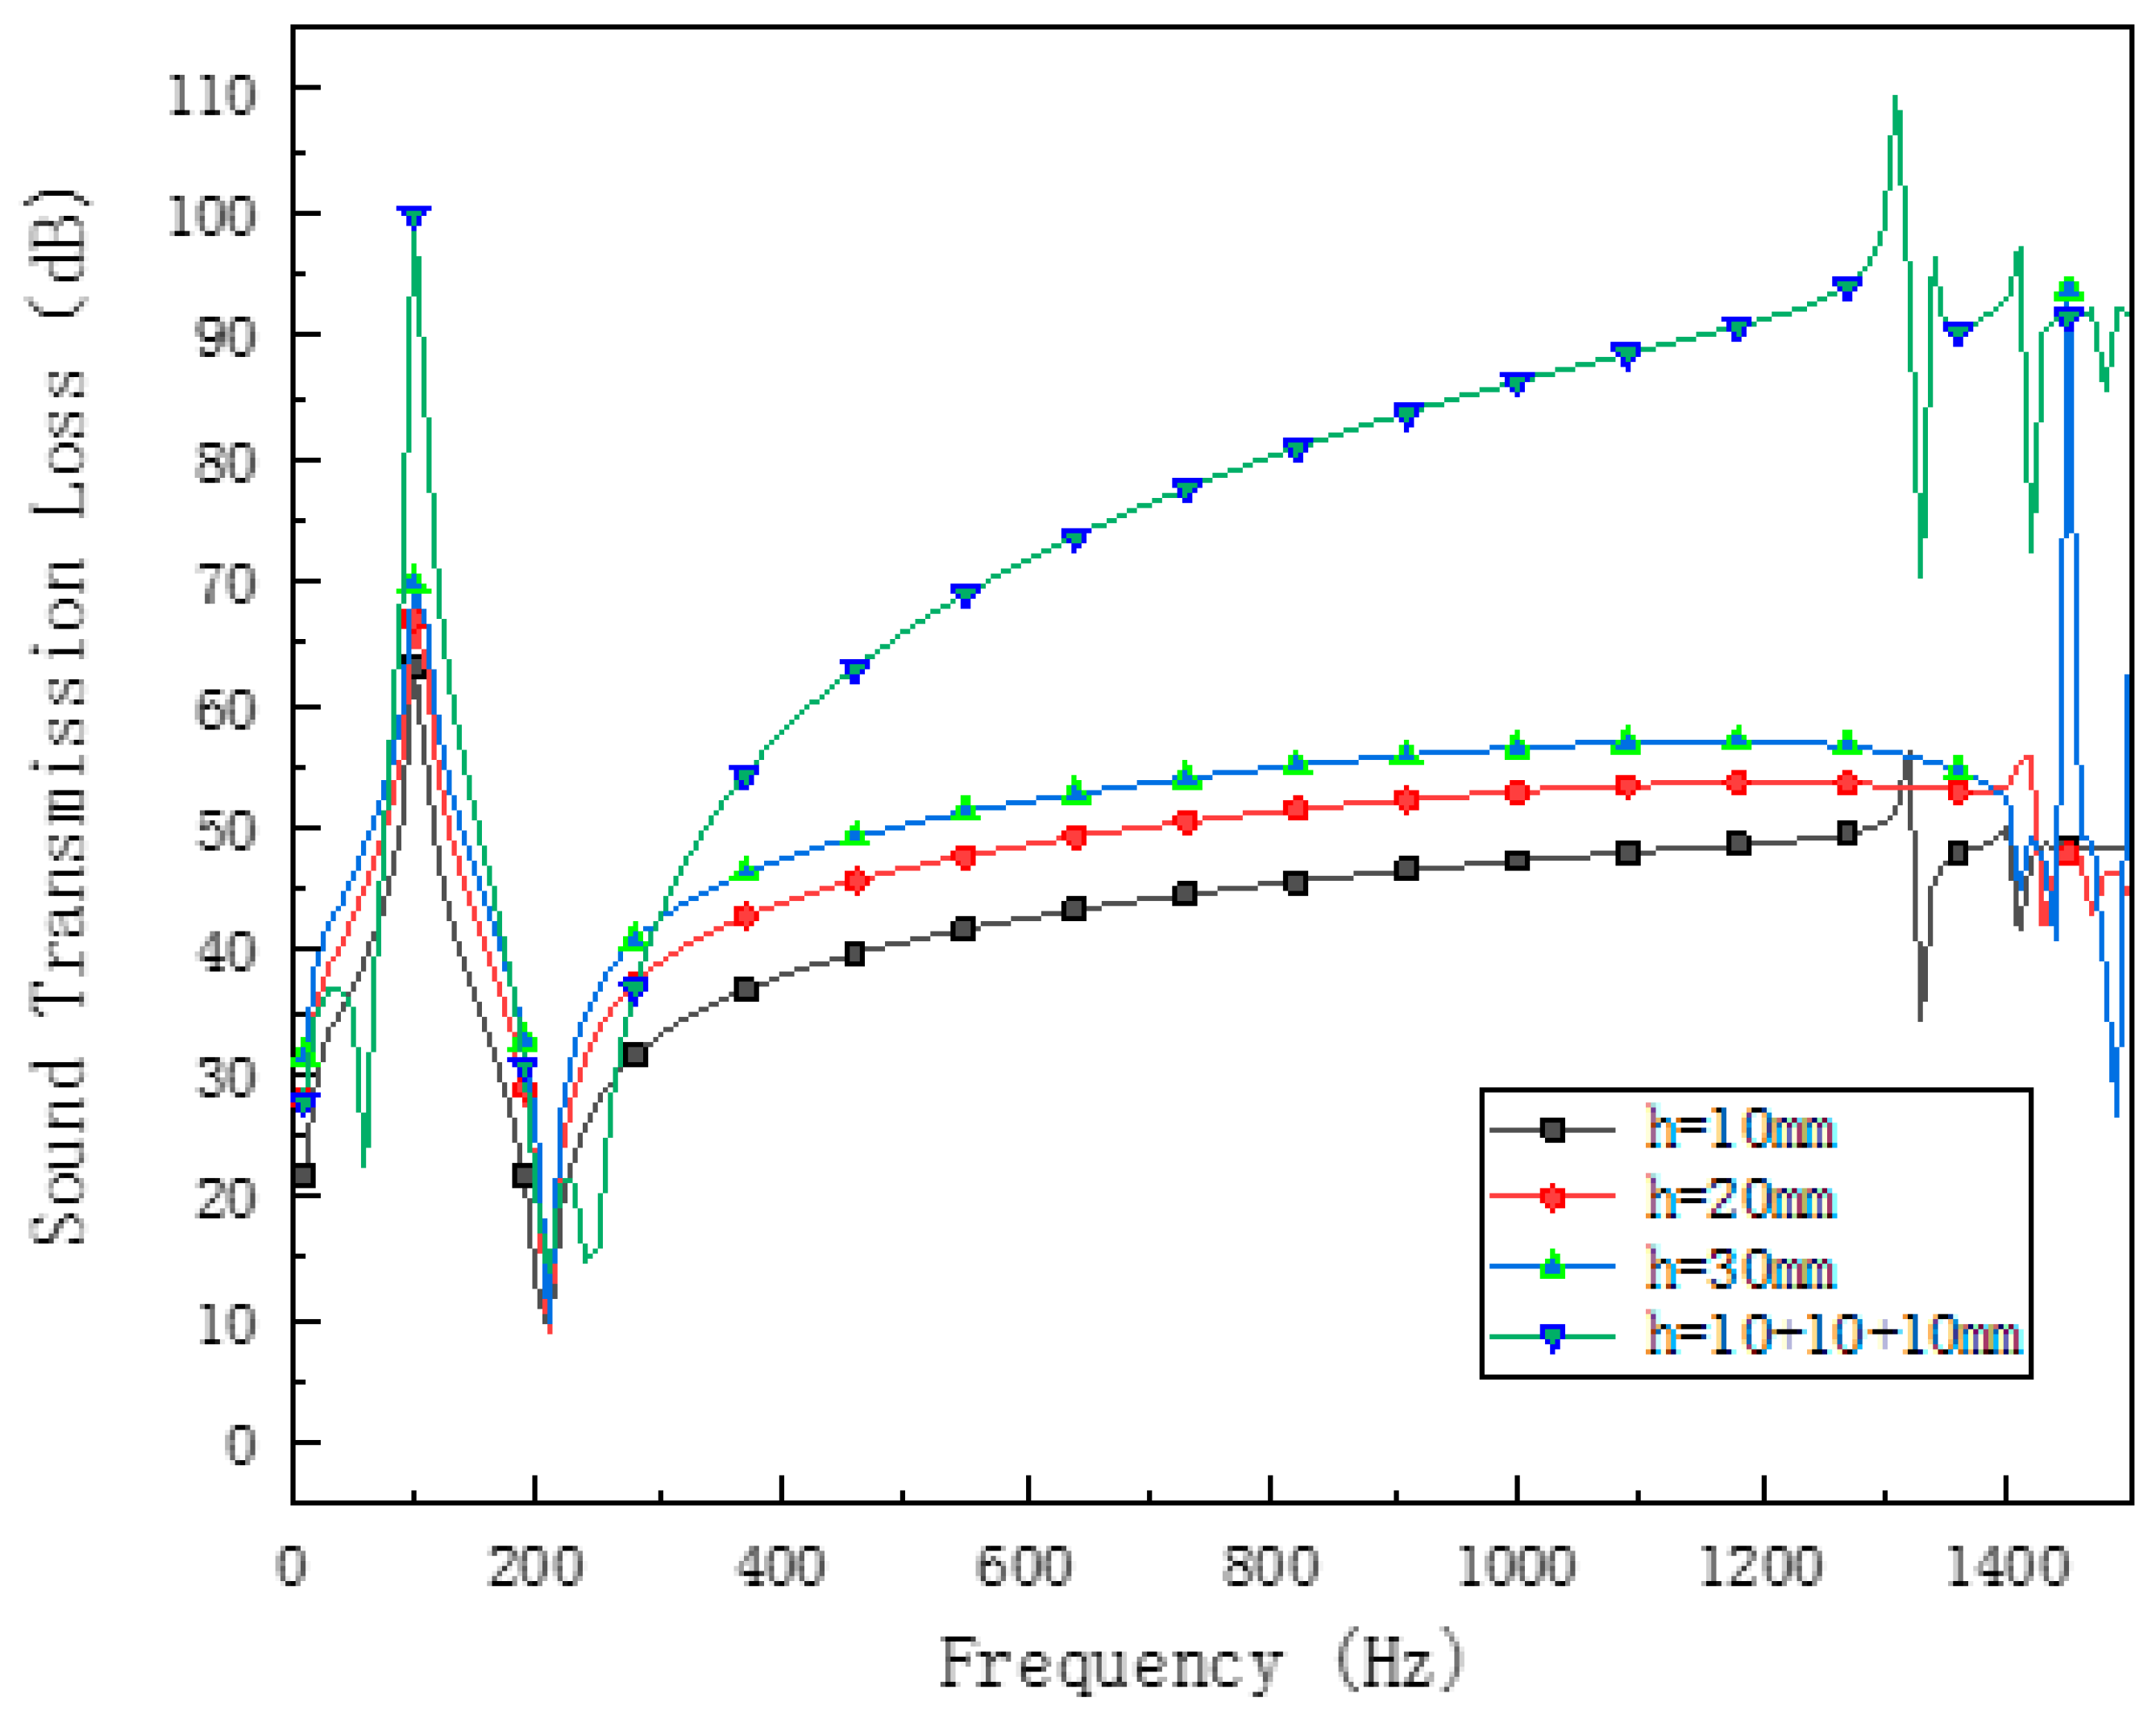
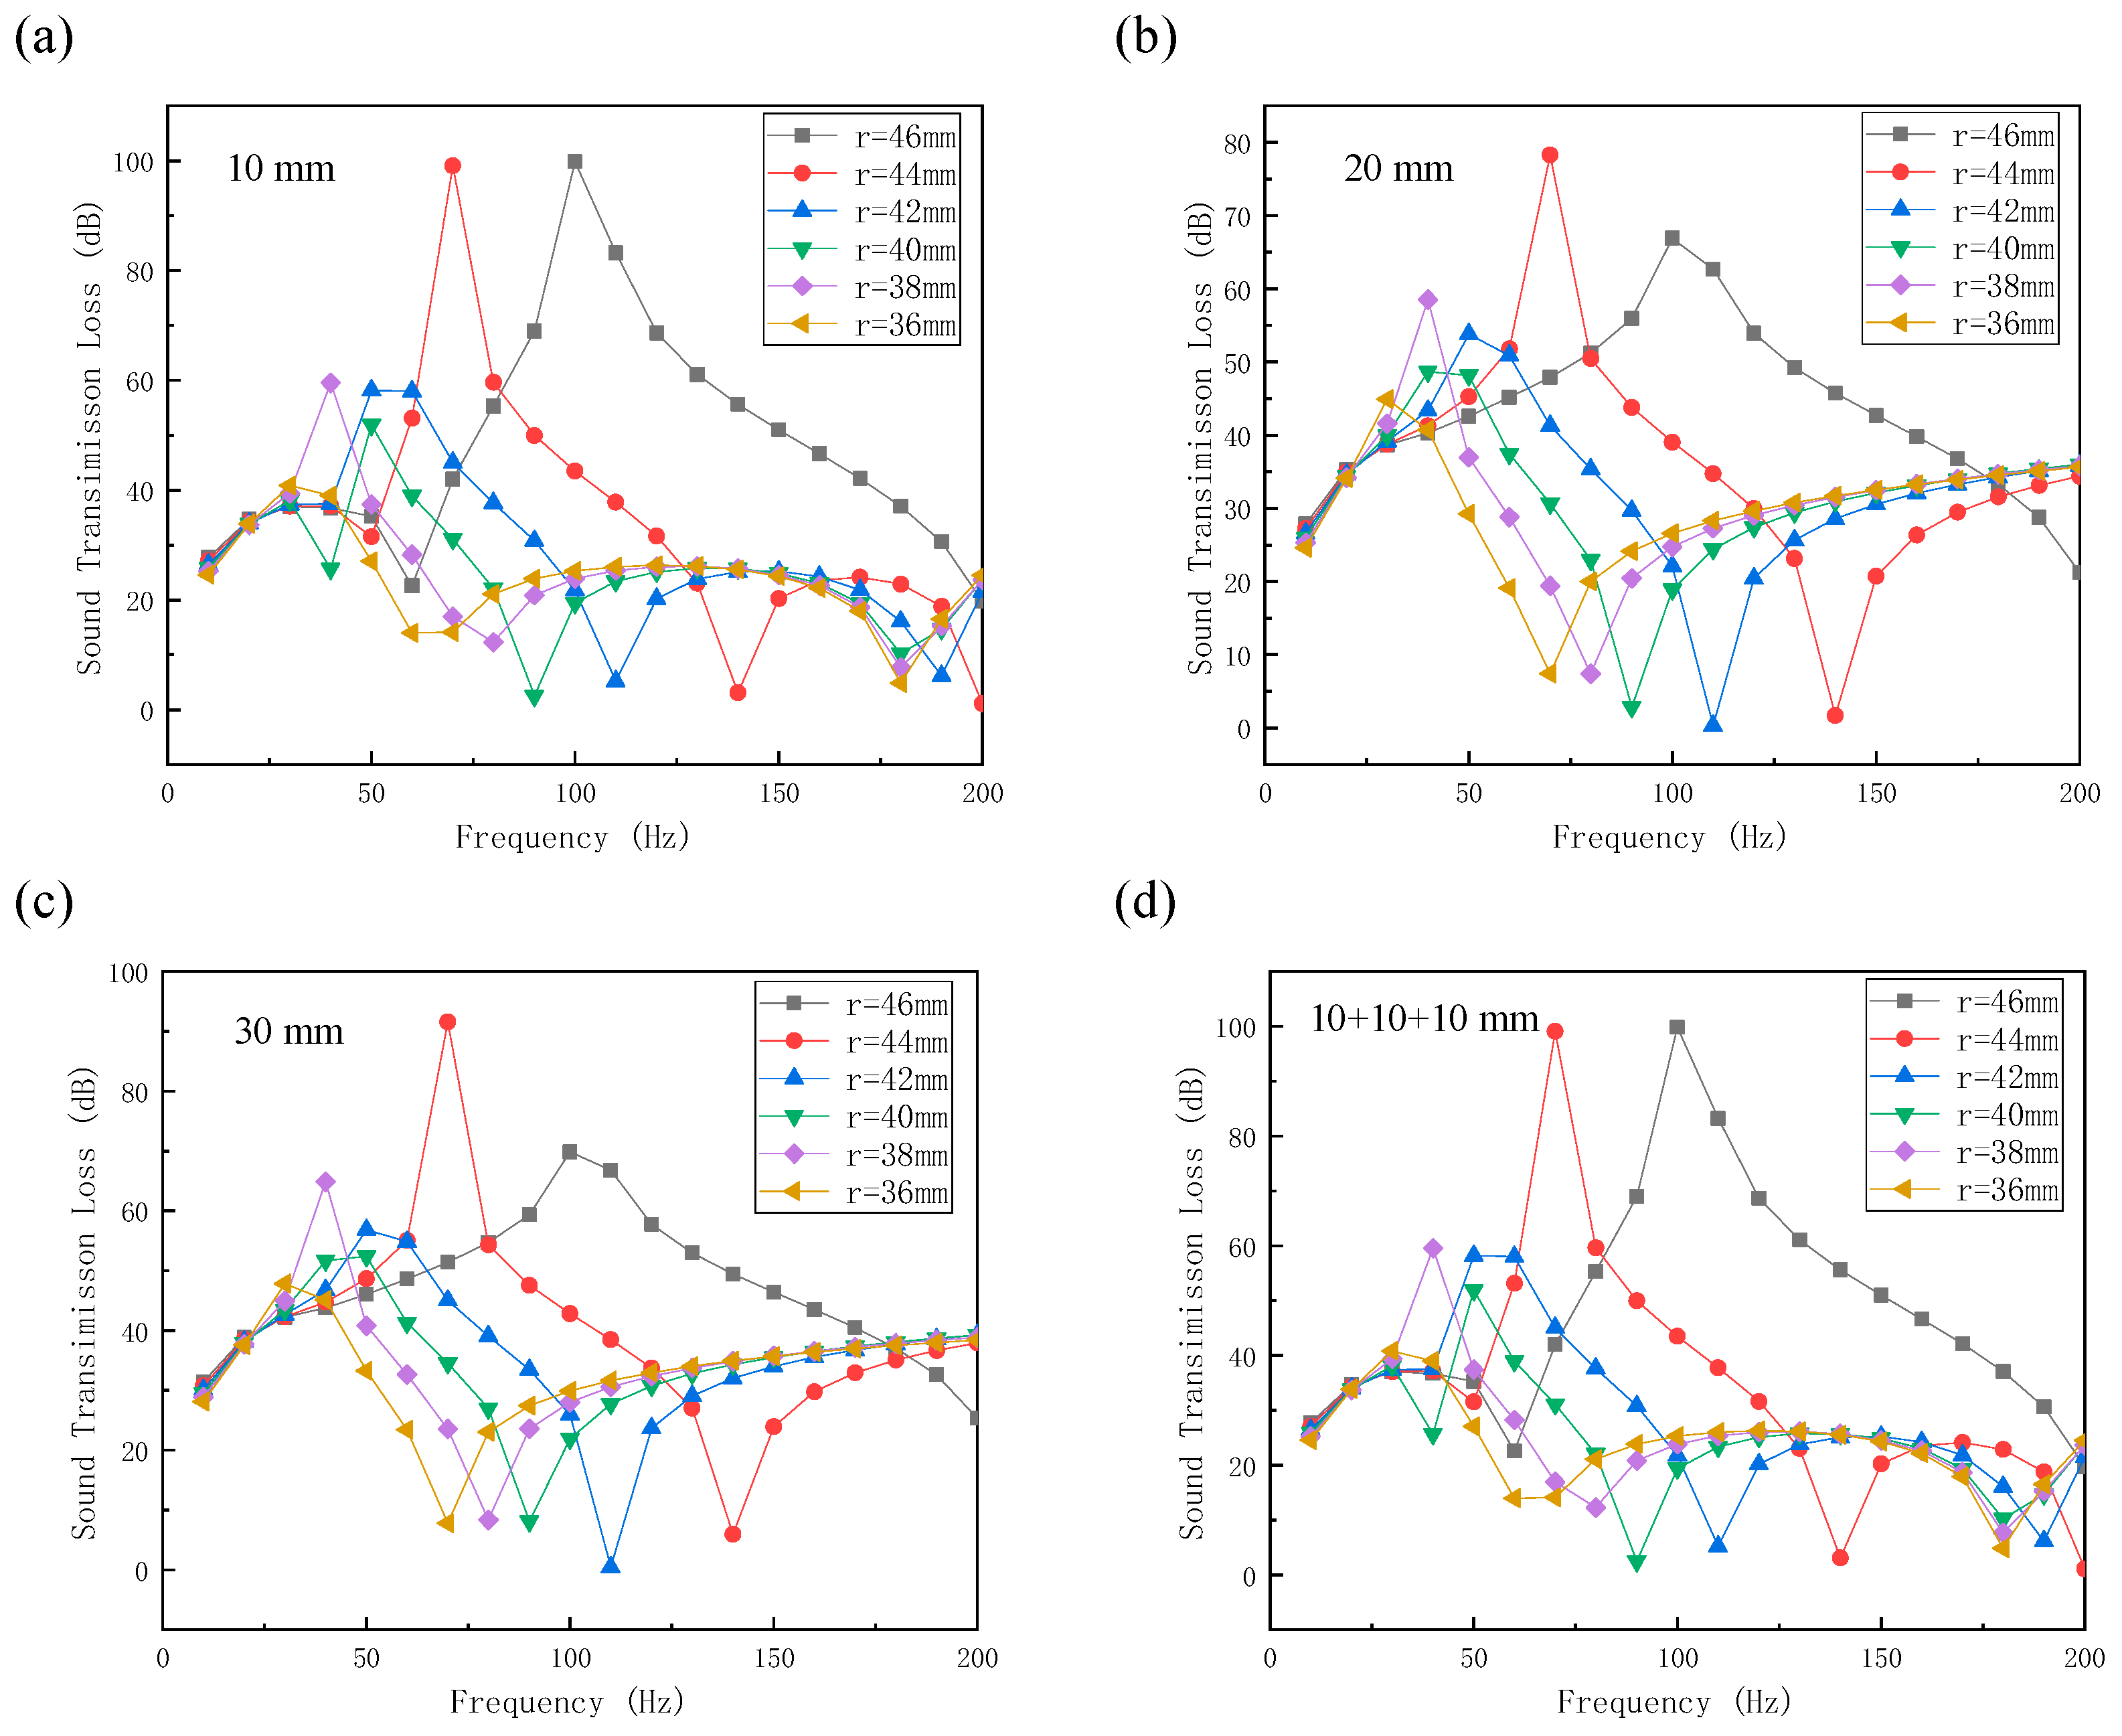
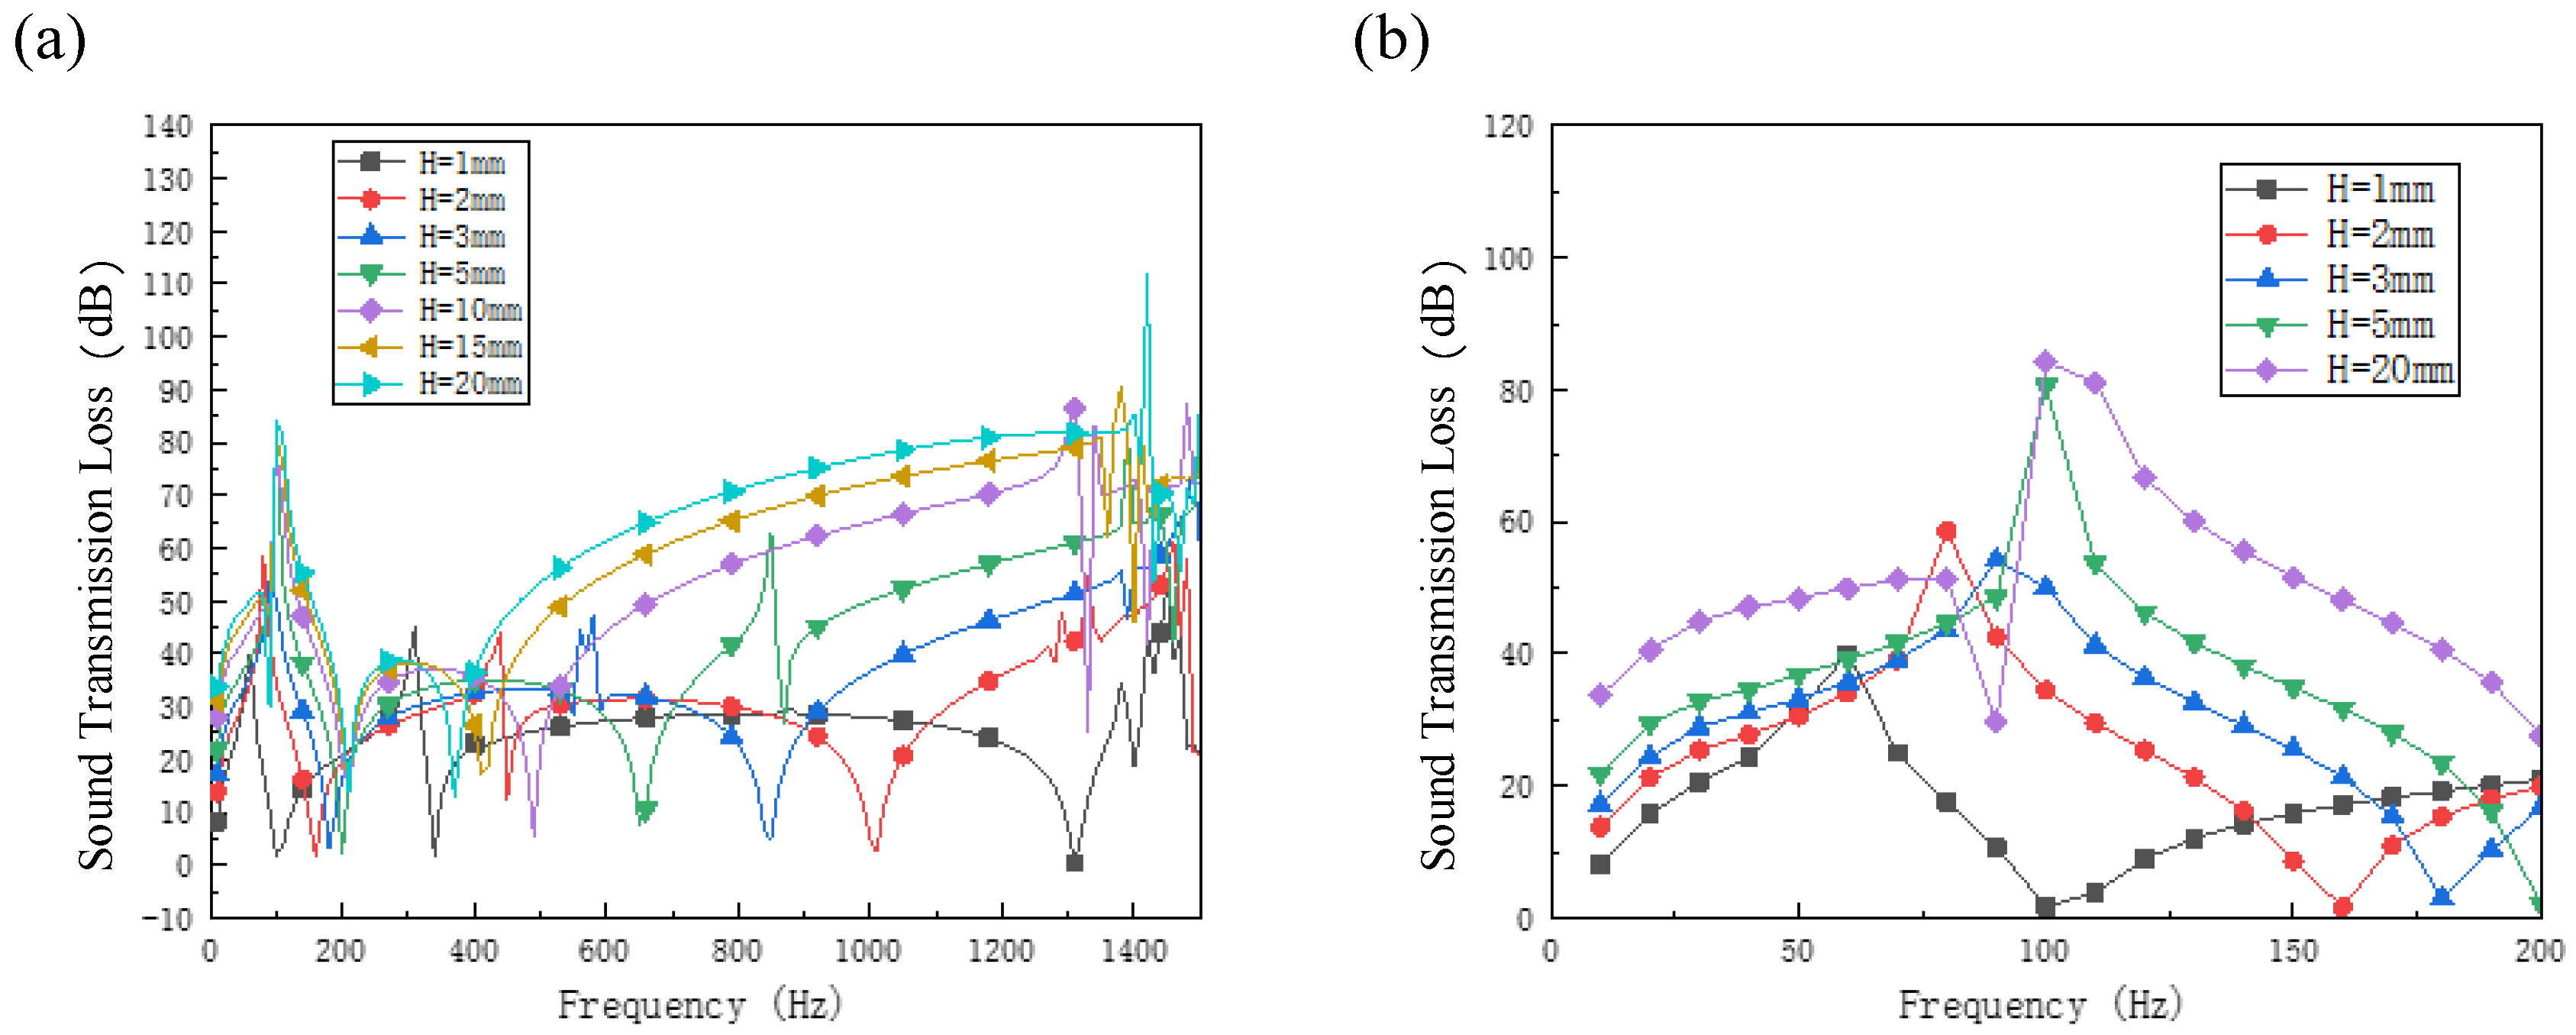
4.3. Effect of Cavity Thickness on STL of Phononic Crystals Cavity Plates
4.4. Effect of Plate Thickness on STL of Phononic Crystals Cavity Plates
5. Conclusions and Prospect
Author Contributions
Funding
Conflicts of Interest
References
- Goffaux, C.; Vigneron, J.P. Theoretical study of a tunable phononic band gap system. Phys. Rev. B 2001, 64, 075118. [Google Scholar] [CrossRef]
- Wen, J.; Zhao, H.; Lv, L.; Yuan, B.; Wang, G.; Wen, X. Effects of locally resonant modes on underwater sound absorption in viscoelastic materials. J. Acoust. Soc. Am. 2011, 130, 1201–1208. [Google Scholar] [CrossRef] [PubMed]
- Gao, J.; Zou, X.-Y.; Cheng, J.-C.; Li, B. Band gaps of lower-order Lamb wave in thin plate with one-dimensional phononic crystal layer: Effect of substrate. Appl. Phys. Lett. 2008, 92, 023510. [Google Scholar] [CrossRef]
- Sigalas, M.; Economou, E. Elastic and acoustic wave band structure. J. Sound Vib. 1992, 158, 377–382. [Google Scholar] [CrossRef]
- Kushwaha, M.S.; Halevi, P.; Dobrzynski, L.; Djafari-Rouhani, B. Acoustic band structure of periodic elastic composites. Phys. Rev. Lett. 1993, 71, 2022–2025. [Google Scholar] [CrossRef] [PubMed]
- Kushwaha, M.S.; Halevi, P.; Martínez, G.; Dobrzynski, L.; Djafari-Rouhani, B. Theory of acoustic band structure of periodic elastic composites. Phys. Rev. B 1994, 49, 2313. [Google Scholar] [CrossRef] [PubMed]
- Wang, X.P.; Jiang, P.; Chen, T.N.; Yu, K.P. Frequency characteristics of defect states in a two-dimensional phononic crystal with slit structure. Int. J. Mod. Phys. B 2016, 30, 1650025. [Google Scholar] [CrossRef]
- Shi, X.; Shu, H.; Zhu, J.; Wang, X.; Dong, L.; Zhao, L.; Liang, S.; Liu, R. Research on wave bandgaps inacircular plate of radial phononic crystal. Int. J. Mod. Phys. B 2016, 30, 1650162. [Google Scholar] [CrossRef]
- Gao, N.; Wu, J.H.; Yu, L. Large band gaps in two-dimensional phononic crystals with self-similarity structure. Int. J. Mod. Phys. B 2015, 29, 1550017. [Google Scholar] [CrossRef]
- Martínez-Sala, R.; Sancho, J.; Sánchez, J.V.; Gómez, V.; Llinares, J.; Meseguer, F. Sound attenuation by sculpture. Nature 1995, 378, 241. [Google Scholar] [CrossRef]
- Liu, Z.; Zhang, X.; Mao, Y.; Zhu, Y.Y.; Yang, Z.; Chan, C.T.; Sheng, P. Locally resonant sonic materials. Science 2000, 289, 1734–1736. [Google Scholar] [CrossRef]
- Liu, Z.; Chan, C.T.; Sheng, P. Analytic model of phononic crystals with local resonances. Phys. Rev. B 2005, 71, 014103. [Google Scholar] [CrossRef]
- Goffaux, C.; Sánchez-Dehesa, J. Two-dimensional phononic crystals studied using a variational method: Application to lattices of locally resonant materials. Phys. Rev. B 2003, 67, 144–301. [Google Scholar] [CrossRef]
- Steurer, W.; Sutter-Widmer, D. Photonic and phononic quasicrystals. J. Phys. D: Appl. Phys. 2007, 40, R229–R247. [Google Scholar] [CrossRef]
- Vasseur, J.O.; Deymier, P.A.; Chenni, B.; Djafari-Rouhani, B.; Dobrzynski, L.; Prevost, D. Experimental and theoretical evidence for the existence of absolute acoustic band gaps in two-dimensional solid phononic crystals. Phys. Rev. Lett. 2001, 86, 3012. [Google Scholar] [CrossRef]
- Jensen, J. Phononic band gaps and vibrations in one- and two-dimensional mass–spring structures. J. Sound Vib. 2003, 266, 1053–1078. [Google Scholar] [CrossRef]
- Sigmund, O.; Jensen, J.S. Systematic design of phononic band–gap materials and structures by topology optimization. Philos. Trans. R. Soc. A Math. Phys. Eng. Sci. 2003, 361, 1001–1019. [Google Scholar] [CrossRef] [PubMed]
- Yu, J.-K.; Mitrovic, S.; Tham, D.; Varghese, J.; Heath, J.R. Reduction of thermal conductivity in phononic nanomesh structures. Nat. Nanotechnol. 2010, 5, 718–721. [Google Scholar] [CrossRef] [PubMed]
- Alegre, T.P.M.; Safavi-Naeini, A.H.; Winger, M.; Painter, O. Full phononic bandgap in 2D-optomechanical crystals. In CLEO: Science and Innovations; Optical Society of America: Washington, DC, USA, 2011. [Google Scholar]
- Graczykowski, B.; Vogel, N.; Bley, K.; Butt, H.-J.; Fytas, G. Multiband Hypersound Filtering in Two-Dimensional Colloidal Crystals: Adhesion, Resonances, and Periodicity. Nano Lett. 2020, 20, 1883–1889. [Google Scholar] [CrossRef]
- Yang, S.; Page, J.H.; Liu, Z.; Cowan, M.L.; Chan, C.T.; Sheng, P. Focusing of Sound in a 3D Phononic Crystal. Phys. Rev. Lett. 2004, 93, 024301. [Google Scholar] [CrossRef]
- Alonso-Redondo, E.; Schmitt, M.; Urbach, Z.; Hui, C.M.; Sainidou, R.; Rembert, P.; Matyjaszewski, K.; Bockstaller, M.R.; Fytas, G. A new class of tunable hypersonic phononic crystals based on polymer-tethered colloids. Nat. Commun. 2015, 6, 1–8. [Google Scholar] [CrossRef]
- Lin, J.; Lin, S. Study on a Large-Scale Three-Dimensional Ultrasonic Plastic Welding Vibration System Based on a Quasi-Periodic Phononic Crystal Structure. Crystals 2020, 10, 21. [Google Scholar] [CrossRef]
- Hussein, M.I.; Frazier, M.J. Damped phononic crystals and acoustic metamaterials. In Acoustic Metamaterials and Phononic Crystals; Springer: Berlin/Heidelberg, Germany, 2013; pp. 201–215. [Google Scholar]
- Dong, Y.; Yao, H.; Du, J.; Zhao, J.; Chao, D.; Wang, B. Research on low-frequency band gap property of a hybrid phononic crystal. Mod. Phys. Lett. B 2018, 32, 1850165. [Google Scholar] [CrossRef]
- Zhou, X.; Xu, Y.; Liu, Y.; Lv, L.; Peng, F.; Wang, L. Extending and lowering band gaps by multilayered locally resonant phononic crystals. Appl. Acoust. 2018, 133, 97–106. [Google Scholar] [CrossRef]
- Li, Y.F.; Meng, F.; Li, S.; Jia, B.; Zhou, S.; Huang, X. Designing broad phononic band gaps for in-plane modes. Phys. Lett. A 2018, 382, 679–684. [Google Scholar] [CrossRef]
- Zuo, S.; Huang, H.; Wu, X.; Zhang, M.; Ni, T. Low-frequency band gap of locally resonant phononic crystals with a dual-base plate. J. Acoust. Soc. Am. 2018, 143, 1326–1332. [Google Scholar] [CrossRef]
- Jia, Z.; Chen, Y.; Yang, H.; Wang, L. Designing Phononic Crystals with Wide and Robust Band Gaps. Phys. Rev. Appl. 2018, 9, 044021. [Google Scholar] [CrossRef]
- Anvariyeh, F.S.; Jalili, M.; Fotuhi, A.R. Nonlinear vibration analysis of a circular plate–cavity system. J. Braz. Soc. Mech. Sci. Eng. 2019, 41, 66. [Google Scholar] [CrossRef]
- Dowell, E.H. Transmission of Noise from a Turbulent Boundary Layer through a Flexible Plate into a Closed Cavity. J. Acoust. Soc. Am. 1969, 46, 238–252. [Google Scholar] [CrossRef]
- Qaisi, M.I. Free vibrations of a rectangular plate-cavity system. Appl. Acoust. 1988, 24, 49–61. [Google Scholar] [CrossRef]
- Frampton, K.D.; Clark, R.L. Sound transmission through an aeroelastic plate into a cavity. AIAA J. 1997, 35, 1113–1118. [Google Scholar] [CrossRef]
- Zhang, H.; Shi, D.; Zha, S.; Wang, Q. Vibro-acoustic analysis of the thin laminated rectangular plate-cavity coupling system. Compos. Struct. 2018, 189, 570–585. [Google Scholar] [CrossRef]
- Sarıgül, A.S.; Karagözlü, E. Vibro-acoustic coupling in composite plate-cavity systems. J. Vib. Control. 2018, 11, 2274–2283. [Google Scholar] [CrossRef]
- Xin, F.X.; Lu, T.J.; Chen, C. Sound Transmission Through Simply Supported Finite Double-Panel Partitions With Enclosed Air Cavity. J. Vib. Acoust. 2010, 132, 011008. [Google Scholar] [CrossRef]
- Muzar, E.; Aval, G.A.; Stotz, J.A.H. Wet-etched phononic crystal waveguiding on GaAs. J. Phys. D Appl. Phys. 2018, 51, 044001. [Google Scholar] [CrossRef]
- Wang, Y.-F.; Wang, Y.-S.; Wang, L. Two-dimensional ternary locally resonant phononic crystals with a comblike coating. J. Phys. D Appl. Phys. 2013, 47, 015502. [Google Scholar] [CrossRef]
- Peiffer, A.; Grunewald, M.; Lempereur, P. Comment on “A lightweight yet sound-proof honeycomb acoustic metamaterial” [Appl. Phys. Lett. 106, 171905 (2015)]. Appl. Phys. Lett. 2015, 107, 216101. [Google Scholar] [CrossRef]


| Material | (kg/m3) | E (Pa) | ν |
|---|---|---|---|
| Resin | 1180 | 4.35 × 10⁹ | 0.3679 |
| Rubber | 1300 | 1.175 × 10⁵ | 0.46875 |
| Tungsten | 19350 | 3.54 × 10¹¹ | 0.35 |
| Band Position | 10 mm Start and Stop Frequency (Hz) | 20 mm Start and Stop Frequency (Hz) | 30 mm Start and Stop Frequency (Hz) | Band Gap Direction |
|---|---|---|---|---|
| 1–2 | 33.98–47.69 | 34.04–48.76 | 34.05–48.77 | XM |
| 2–3 | - | - | 49.15–56.1 | XM |
| 4–5 | 50–84.09 | 52.26–92.51 | 56.16–94.45 | XM |
| 6–7 | 87.04–208.59 | 96.78–208.88 | 98.57–208.93 | complete |
| 6–7 | 208.59–610.87 | 208.88–939.03 | 208.93–953.38 | XM |
Publisher’s Note: MDPI stays neutral with regard to jurisdictional claims in published maps and institutional affiliations. |
© 2020 by the authors. Licensee MDPI, Basel, Switzerland. This article is an open access article distributed under the terms and conditions of the Creative Commons Attribution (CC BY) license (http://creativecommons.org/licenses/by/4.0/).
Share and Cite
Chen, C.; Guo, Z.; Liu, S.; Feng, H.; Qiao, C. Effect of Cavity Structure on Acoustic Characteristics of Phononic Crystals Based on Double-Layer Plates. Crystals 2020, 10, 995. https://doi.org/10.3390/cryst10110995
Chen C, Guo Z, Liu S, Feng H, Qiao C. Effect of Cavity Structure on Acoustic Characteristics of Phononic Crystals Based on Double-Layer Plates. Crystals. 2020; 10(11):995. https://doi.org/10.3390/cryst10110995
Chicago/Turabian StyleChen, Chuanmin, Zhaofeng Guo, Songtao Liu, Hongda Feng, and Chuanxi Qiao. 2020. "Effect of Cavity Structure on Acoustic Characteristics of Phononic Crystals Based on Double-Layer Plates" Crystals 10, no. 11: 995. https://doi.org/10.3390/cryst10110995
APA StyleChen, C., Guo, Z., Liu, S., Feng, H., & Qiao, C. (2020). Effect of Cavity Structure on Acoustic Characteristics of Phononic Crystals Based on Double-Layer Plates. Crystals, 10(11), 995. https://doi.org/10.3390/cryst10110995