Article

Service Life Modeling of Concrete with SCMs Using Effective Diffusion Coefficient and a New Binding Model

by
Mukhtar Oluwaseun Azeez
1 and
Ahmed Abd El Fattah
2,*
1
Department of Civil & Environmental Engineering, King Fahd University of Petroleum and Minerals, Dhahran 31261, Saudi Arabia
2
Department of Architecture, King Fahd University of Petroleum and Minerals, Dhahran 31261, Saudi Arabia
*
Author to whom correspondence should be addressed.
Crystals 2020, 10(11), 967; https://doi.org/10.3390/cryst10110967
Submission received: 22 September 2020 / Revised: 23 October 2020 / Accepted: 24 October 2020 / Published: 26 October 2020
(This article belongs to the Special Issue Properties and Performance of Concrete Materials and Structures)

Abstract

:
This paper presents a new algorithm that predicts the service life of concrete contains supplementary cementitious materials, SCMs, and determines time of corrosion initiation. The algorithm drives effective diffusivity from an apparent diffusion model, using experimental binding data performed in the lab, temperature, free ion concentration, and carbonation, and generates free chloride profiles for concrete with and without SCMs by using Fick’s law in a finite element model. Adjusting diffusion coefficient at each step of the solution, by addressing the impact of different parameters, simplifies the algorithm and reduces calculation time without jeopardizing the results’ quality. Results generated by the model compare well to the performance of concrete blocks constructed in an exposure site on the east coast of Saudi Arabia. The exposure site hosted five different mixes of Portland cement and SCMs, and the concrete blocks were exposed to harsh weather over the period of two years. Linear polarization and chloride profiling assessed the performance of the mixes against corrosion activities. Lab work identified the performance of the mixes through binding capacity and chloride profiling. Statistical analysis evidenced the accuracy of the model through correlation and regression analysis. Furthermore, a new proposed binding model, produced from binding data in different studies, alters the experimental binding data in the algorithm to decouple the solution from experimental values. The algorithm proves its accuracy when compared to the experimental free chloride profile. The proposed transport model proves that using effective diffusion and binding capacity are enough to generate reliable results, and the effective diffusion can be calibrated with environmental conditions such as temperature, age, and carbonation. Finally, the algorithm presents its features in an object-oriented programming using C# and user friendly web interface.

1. Introduction

Concrete remains the most widely used material around the world with over six billion tons of concrete used to establish the required infrastructures. This is due, in general, to its reliable structural integrity such as high compressive strength, good fire resistance, relatively low cost, good durability, and availability. Durability of reinforced concrete structures is a great challenge because factors affecting concrete durability are numerous, including the concrete permeability, aggregate content, cement type and quantity, water/cement ratio, and environmental factors such as temperature, humidity, and level of concentrations of aggressive species which lead to concrete deterioration over time.
Among all the durability challenges facing reinforced concrete structures, resistance to chloride diffusion and subsequent reinforcement corrosion is still a major durability index that greatly influences the structural integrity of reinforced concrete members. Chloride attacks concrete structures in aggressive environments, such as marine environments, ground water, and de-icing salts. Chloride itself does not directly result in damage to concrete in normal circumstances, but can cause steel corrosion within concrete if not monitored [1]. Upon reaching chloride threshold value at the steel location, the corrosion initiates and increases the volume of concrete which leads to concrete cracking and cover spalling over time. Consequently, there will be serious economic and social effects as more funds will be diverted to repair damaged areas of structural facilities [2,3,4]. In extreme cases, the facility might even be completely closed during repair if the extent of damage is huge. To mitigate economic distress and to ensure quality of concrete structures at design stage, it is essential to have a good understanding of chloride diffusion mechanism, measurement methods, and relevant service life prediction modeling.
Over the past decades, researchers have devoted efforts to understanding the chloride diffusion mechanism, measurement, and prediction in Portland cement concrete (PCC) as evidenced by volumes of published high quality papers on chloride diffusion in PCC. Some of the works have focused on explaining the diffusion mechanism and experimental measurements while others devoted effort to specifying various prediction models for concrete service life. A detailed experimental study on the mechanism of chloride transport in non-saturated concrete and its interaction with moisture diffusion was investigated by Ababneh and Xi [5] and Ababneh et al. [6]. The influence of the incorporation of supplementary cementitious materials and chemical admixture on chloride penetration in concrete have also been studied, such as the work of Liu et al. [7], Zhang et al. [8], and Lee and Lee [9]. A good number of the published articles on the subject have sought to address the complexities inherent in the chloride transport in different capacities. A pure chloride ion transport model in saturated concrete was studied by Xi and Bažant [10] while Samson et al. [11], Samson and Marchand [12], and Nguyen et al. [13] focused on the development of models that couple chloride ion transport with moisture transport in unsaturated cement-based materials. Saetta et al. [14] analyzed and experimentally compared results of chloride diffusion in partially saturated concrete under the influence of moisture diffusion and temperature gradient. The improvement of the chloride models to include the chemical activity of other ions in concrete pore solution on chloride diffusion has also been considered in the literature [15,16].
The general equation describing the flux of chloride ions through any medium is given by [1]:
J D = D i C i x + C i ln γ i x + C i u i ϕ x ,
where J D is the diffusion flux of the ion (mol/m2 s), C i is the concentration of the ion (mol/m3), D i is the effective diffusion coefficient of the ion (m2/s), γ i is the chemical activity coefficient of the ion, u i is the ion mobility, and ϕ is the electric potential between multi-ions in a solution (Volt). Applying the equation specifically for the diffusion of chloride ion, it describes the diffusion of chloride under concentration gradient (first term in the right-hand side of the equation) taking the ionic strength of the solution (advective flux) and electric field induced (electric flux) into consideration (second and third terms, respectively).
It is generally known that because of the formation of what is known as Friedel’s salt in PCC hydration product and the huge surface area of hydration gel, a portion of chloride ions entering into concrete from environmental solutions will be captured by the concrete [1]. This phenomenon is referred to as ‘chloride binding’ [1]. The binding due to huge surface area is termed physical binding while that due to reaction with Friedel’s salt is termed chemical binding [1]. Even though, in previous studies, the bound chloride was thought to be harmless as it is not freely available to induce reinforcement corrosion, Luping and Nilsson [17] argued that the bound chloride might be released in the event of carbonation or sulfate ingress thereby increasing the volume of the free chloride. Since the chloride binding effect is a complex phenomenon in cement-based materials, researchers have generally addressed the relation between free and bound chlorides with what is known as binding isotherm. Various binding isotherms have been proposed in the literature from linear isotherms [18] to non-linear isotherms [19,20,21,22].
Since Equation (1) is a steady state description of chloride diffusion in a medium that assumes constant diffusion coefficient and absence of binding capacity of concrete, a more general non-steady state equation considering the variable nature of the diffusion coefficient, the binding capacity, ionic strength, and ionic interaction has been proposed and used in different capacities to describe chloride transport. The equation otherwise known as the Nernst–Planck equation is described next:
C f i t 1 + C b C = x D i C i x + C i ln γ i x + C i u i ϕ x ,
where C b c is the binding capacity of concrete.
Equation (2) is a complex non-steady state description of ion transport in a porous medium as a result of its dependence on various factors, including the extent of hydration products formed, the chemical activity, and electric potential between pore solution ions. The hydration products in turn depend on many factors from material parameters, such as water/binder (w/b) ratio, binder content, admixture quantities, and environmental factors, such as temperature, humidity, and chloride concentration. However, some authors have indicated that chemical activity is only relevant for unsaturated conditions and that it has a weak influence in the case of saturated conditions [23,24].
Due to the inherent complexity of Equation (2), an early development of chloride transport models has ignored many terms in the equation leading to the well-known general form of Fick’s law of diffusion:
J D = D i C i x .
The assumptions of Fick’s law are obviously questionable, because under the assumptions, chloride ions are treated as uncharged particles [1]. The need to incorporate the effect of surrounding ions in a solution on chloride diffusion has made many researchers utilize the Nernst–Planck equation in their models [11], albeit in different capacities.
Riding et al. [25] developed a model for chloride concentration that used the apparent diffusion coefficient and Fick’s second law of diffusion using finite difference and validated their model against results from concrete blocks exposed to marine environment for 25 years. They pointed out that diffusion is the main chloride transport mechanism for concrete exposed to water and chloride.
Recently, Fenaux et al. [16] have shown that using solely diffusion and chloride binding generates good results. In addition, they pointed out the difficulty of distinguishing whether the variation of the apparent diffusion coefficient was based on the microstructure or binding capacity of the concrete. They have shown the superiority of using the effective diffusion coefficient over the apparent diffusion coefficient.
Therefore, the present work uses Fick’s law of diffusion and the effective diffusion coefficient, which accounts for effects of age, temperature, carbonation, free chloride, and experimental binding capacity, to predict free chloride concentrations along the depth of concrete using 1D finite element modeling. The outcome of the transport model was validated against results from marine exposure site and coastal zone on shore. Then, the paper proposes a new binding model using the oxides content of the cement and supplementary cementitious materials (SCMs) and uses the model in the transport model. The results show good correlation to the experimental results. Finally, the transport model was incorporated into user friendly software application developed using object-oriented based C-Sharp programming language.

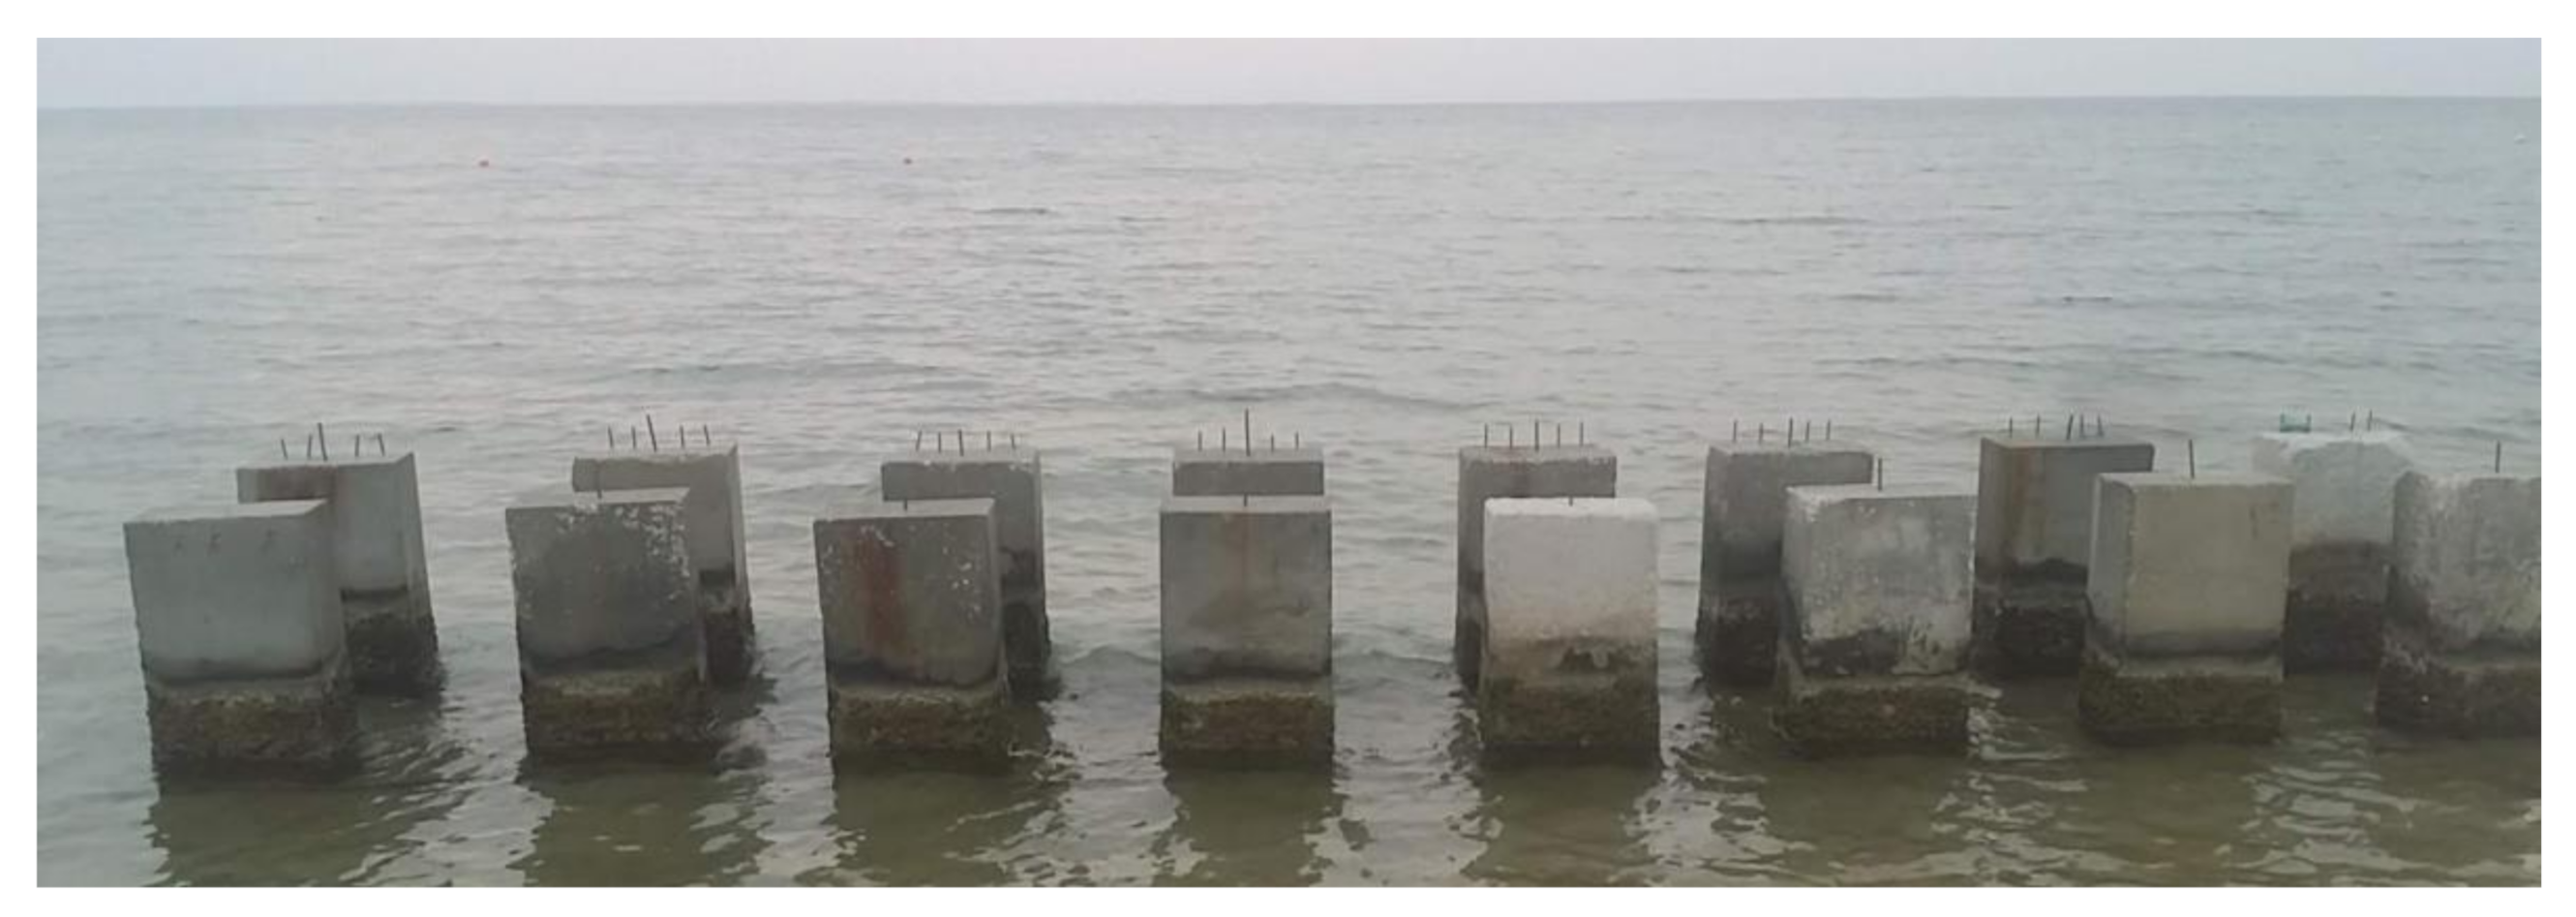
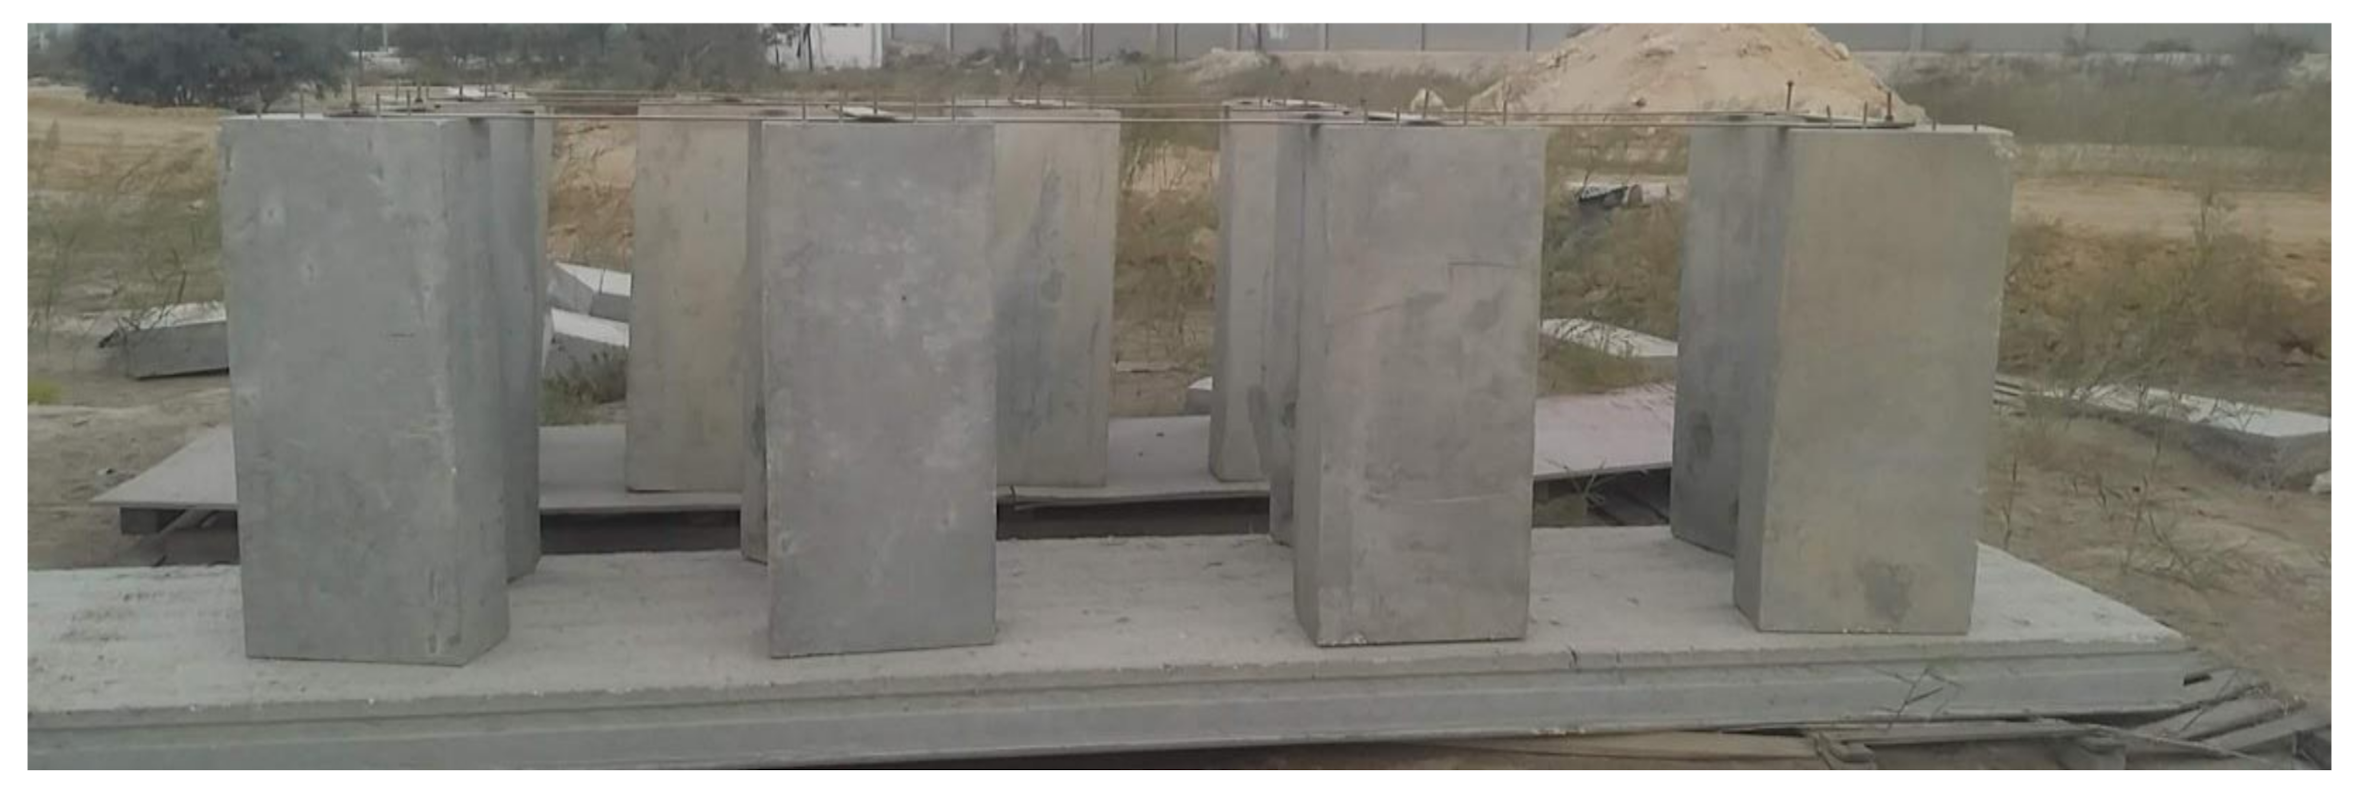
2. Materials and Experimental Investigation

Experimental investigation to study the ingress of chloride ion into reinforced concrete was carried out under a laboratory setting and field exposure, and its details and results were published in previous works [26,27]. In the main study for field exposure, five different mixture proportions were developed to study the effect of cement compositions and supplementary cementitious materials on the resistance of reinforced concrete to chloride ingress. Replicate mixtures were also prepared in the laboratory. Table 1 shows the mixture proportions used in this study. ASTM C150 [28] type I (OPC) and V (Sulfate attack resistant) cements were used in order to quantify the impact of the cement aluminate content and consequent chloride binding amount on the chloride ingress rate. Three different supplementary cementitious materials (SCMs) were used in this project: an ASTM C1240 silica fume (SF) [29], an ASTM C618 class F fly ash (FA) [30], and an ASTM C989 slag cement (SC) [31]. FA, SC, and SF were used at replacement percentages of 25%, 70%, and 6% by weight of cement, respectively. These ratios also were chosen based on the optimal percentages found in the literature and according to the common mixes used by local stakeholders. The high percentage of SC used was similar to the percentage used in King Fahd Causeway constructed to Bahrain. A common fixed water-to-cementitious materials ratio (w/cm) of 0.40 was used because it showed better performance of concrete compared to other values [32]. Fine dune sand was used as fine aggregate in addition to limestone coarse aggregates in all the concrete mixtures.
Reinforced concrete blocks (230 mm × 460 mm × 1200 mm) and 75 mm × 150 mm cylinders were made in a ready mix company. Concrete temperatures ranged from 26 to 29 °C. Concrete blocks were covered during the first day of curing using plastic sheets and shaded to prevent plastic and drying shrinkage. They were cured using wet burlap layers that covered each block after demolding for 28 days. Then the blocks were located on a marine-exposure site (Figure 1 and Figure 2). Figure 1 shows the specimens located in the tidal zone with apparent fluctuation of the tides—the frontal row shows plain concrete samples and the back row shows the reinforced blocks. Each reinforced block contained four black steel rebars positioned at different cover depths (12.7, 25.4, 38.1, and 50.8 mm) and connected at the top to stainless steel bars which were needed for measurements. The specimens rested on solid marine-based plywood to avoid sinking and toppling. Specimens in Figure 2 were located about 15 m away from the shoreline, positioned on a solid base and laterally tied to each other using galvanized steel. Chloride profiling and linear polarization, using Gamry Reference 3000 Potentiostat [33], determined the performance of the different mixtures to corrosion activities.
Cylinder specimens with dimensions of 75 mm × 150 mm were exposed to 5% NaCl solution after 28 days of lab curing in water saturated with calcium hydroxide to avoid leaching. The NaCl exposure was carried out according to the specifications of ASTM C1556 [34]. A chloride profile procedure was carried out for the laboratory specimens. The results were produced and averaged from three readings. The chloride binding capacity was determined by taking measurements of both the free chloride and total chloride ion in concentration in exposed specimens according to [27].

3. Methodology

This section is split into three divisions: the formulation of the effective diffusion model, the proposition of a new binding model, and the logic of the solution of the transport model.
General Conventions: The general naming conventions used throughout this work are such that for an ion i , its free concentration is expressed as C f i (kg/m3 of concrete), bound concentration expressed as C b i (kg/m3 of concrete), and total concentration as C t i (kg/m3 of concrete). Its free concentration is also expressed as C i (kg/m3 or g/l of pore solution). The total concentration is the summation of the free concentration and bound concentration.
Therefore, for the model of ingress of chloride ion i into concrete, the total, free, and bound chloride concentrations are   C t i , C f i , and C b i , respectively.
The apparent chloride diffusion coefficient is expressed as D a i (m2/s) and the effective chloride diffusion coefficient is expressed as D i (m2/s).

3.1. Effective Diffusion Model

The simplest approach to modeling the transport of chloride ion in concrete is the so-called apparent diffusion model that considers only the diffusive flux of chloride ion in pore solution of concrete. By ignoring the terms for ionic interaction, electric potential, and binding capacity in Equation (2), the apparent diffusion model can be expressed as
C f i t = x D a i C i x ,
where D a i is the apparent chloride diffusion coefficient taken as constant in the model. In order to obtain the apparent chloride diffusion coefficient, the solution of the apparent diffusion model would be fitting a numerical solution of Fick’s second law into the chloride concentration profiles obtained from experimental procedure at a specific period. The apparent chloride diffusion coefficient results could then be used for a subsequent prediction of chloride concentration profiles at different ages. In the present study, the apparent diffusion model is used to determine the effective diffusion coefficient by accounting for several parameters, as shown in the following section, and the free chloride concentration profiles in the field exposed specimens.
In the effective diffusion model, the variable nature of the chloride diffusion coefficient and the chloride binding capacity is taken into consideration for the development of the chloride transport model written as
θ i C f i t = . D i C i ,
where θ i is the chloride binding capacity and is expressed as (1 + C b i C f i ).
The effective chloride diffusion coefficient in this case is dependent on many factors making the solution of Equation (5) to be more complex. Ababneh et al. [6] expressed the chloride diffusion coefficient in concrete in terms of such multi-factors as given in Equation (6).
D i = f 1 f 2 g i f 3 H f 4 T f 5 C f i ,
where the dependence of chloride diffusion coefficient is on water/cement ratio f 1 , aggregate and cement paste diffusivities f 2 g i , humidity f 3 H , temperature f 4 T , and free chloride ion concentration f 5 C f i [6].
In the present study, a simplified version of Equation (6) was used to depict the variability of the chloride diffusion coefficient with age, temperature, and carbonation as given by Equation (7).
D i = D ti f t T f t C f i g c .
Dti is the apparent chloride diffusion coefficient (m2/s) which depends on factors such as water/cement ratio, cement content, admixture type, and content and age as shown in the empirical Equations (8)–(10) derived by Riding et al. [25].
D ti = D a o 28 t m + D u l t 1 28 t m ,
D ao = 2.17 × 10 12   e w / c m / 0.279 ,
D u l t = D a o 28 36 , 500 m ,
where t is time (days), D a o is the initial apparent chloride diffusion coefficient, m is a decay constant, and w / c m is the water/cement ratio. It should be mentioned that the parameter m embeds the cementitious materials impact and the parameter Dao accommodates the effect of w/cm ratio [25]. This study uses 0.4 for w/cm ratio and using Equation (9) gives similar results to the experimental ones [27].
f t T accounts for the effect of temperature at time t on chloride diffusion coefficient.
f t T = E x p U R 1 T o 1 T ,
where U is the activation energy of diffusion process (kJ/mol.), R is universal gas constant (8.314 J/mol./K), T o is the reference temperature (usually taken as 296 K [6]), and T is the temperature (K) at time t .
f t C f accounts for the effect of free chloride concentration on the chloride diffusion coefficient.
f t C f = 1 k i o n C f i n ,
where k i o n and n are constants taken as 8.333 and 0.5, respectively [6].
g c is the carbonation constant. Ngala and Page [35] have shown that the effective diffusion coefficient increases when the porosity increases. This was confirmed by [36] which also have shown that carbonation of cement-based materials densifies the structure due to formation of calcium carbonate, which results in decrease of diffusion coefficient by a reduction factor. In this study, a reduction factor of 0.58 is calibrated from the experimental results to reduce diffusion coefficient of carbonated nodes. The depth of carbonation d c can be determined by square root of time equation k t [36] where k is the carbonation coefficient (mm/year0.5) and is determined from [36] as 0.26 cm/year0.5; and t′ is the exposure time to CO2 (year). Mangat and Molloy [37] proposed a relationship between m and the water/cement ratio (w/c) of the concrete (that is, m = 2.5 w/cm − 0.6). However, other researchers have shown the value of m to be mainly influenced by the nature of the cementitious materials, particularly the presence of fly ash or ground-granulated blast-furnace slag (GGBFS) [38,39,40] with the w/c mainly influencing the initial diffusion coefficient [16]. Bamforth [38] proposed a value of m = 0.264 for plain Portland cement concrete and values of 0.699 and 0.621 for concrete containing fly ash and slag, respectively. In the Life-365 model [41], the value of m varies between 0.2 for concrete without fly ash and slag, up to 0.6 for concrete with either 50% fly ash or 70% slag; the value changes linearly for intermediate levels of fly ash and slag. In the present model, a value of m similar to Life-365 model was used as shown in Equation (13).
m = c o n s t + 0.4 F A 50 + S C 70 ,
where const is 0.26 and 0.3 for tidal and coastal exposure, respectively, FA is the fly ash content (class F fly ash or ultra-fine fly ash) as a percentage of the total cementitious material content by weight and SC is the slag cement content as a percentage of the total cementitious material content by weight. Equation (13) shows the value of m to be constant for plain Portland cement concrete and Portland cement concrete replaced with specific percentage of cementitious materials except for FA and SC that vary linearly as FA increases from 0% to 50% and SC increases from 0% to 70%.
In the present work, the outcome of the laboratory experiment has been utilized, as well as the new binding model proposed in the following section, to express the bound chloride as function of free chloride Freundlich isotherm.
The chloride binding capacity 1 + C b i C f i can then be derived from Equation (14) as
1 + C b i C f i = 1 + α β C f i β 1 .
By using the multi-factor approach to express the diffusion coefficient of chloride ion and by incorporating the chloride binding capacity given in Equation (14) into the effective diffusion model of Equation (5), a more accurate expression for chloride transport in concrete can be achieved leading to more realistic prediction of time to corrosion initiation in reinforced concrete. The results produced using the experimental binding values are shown in Section 4.1.

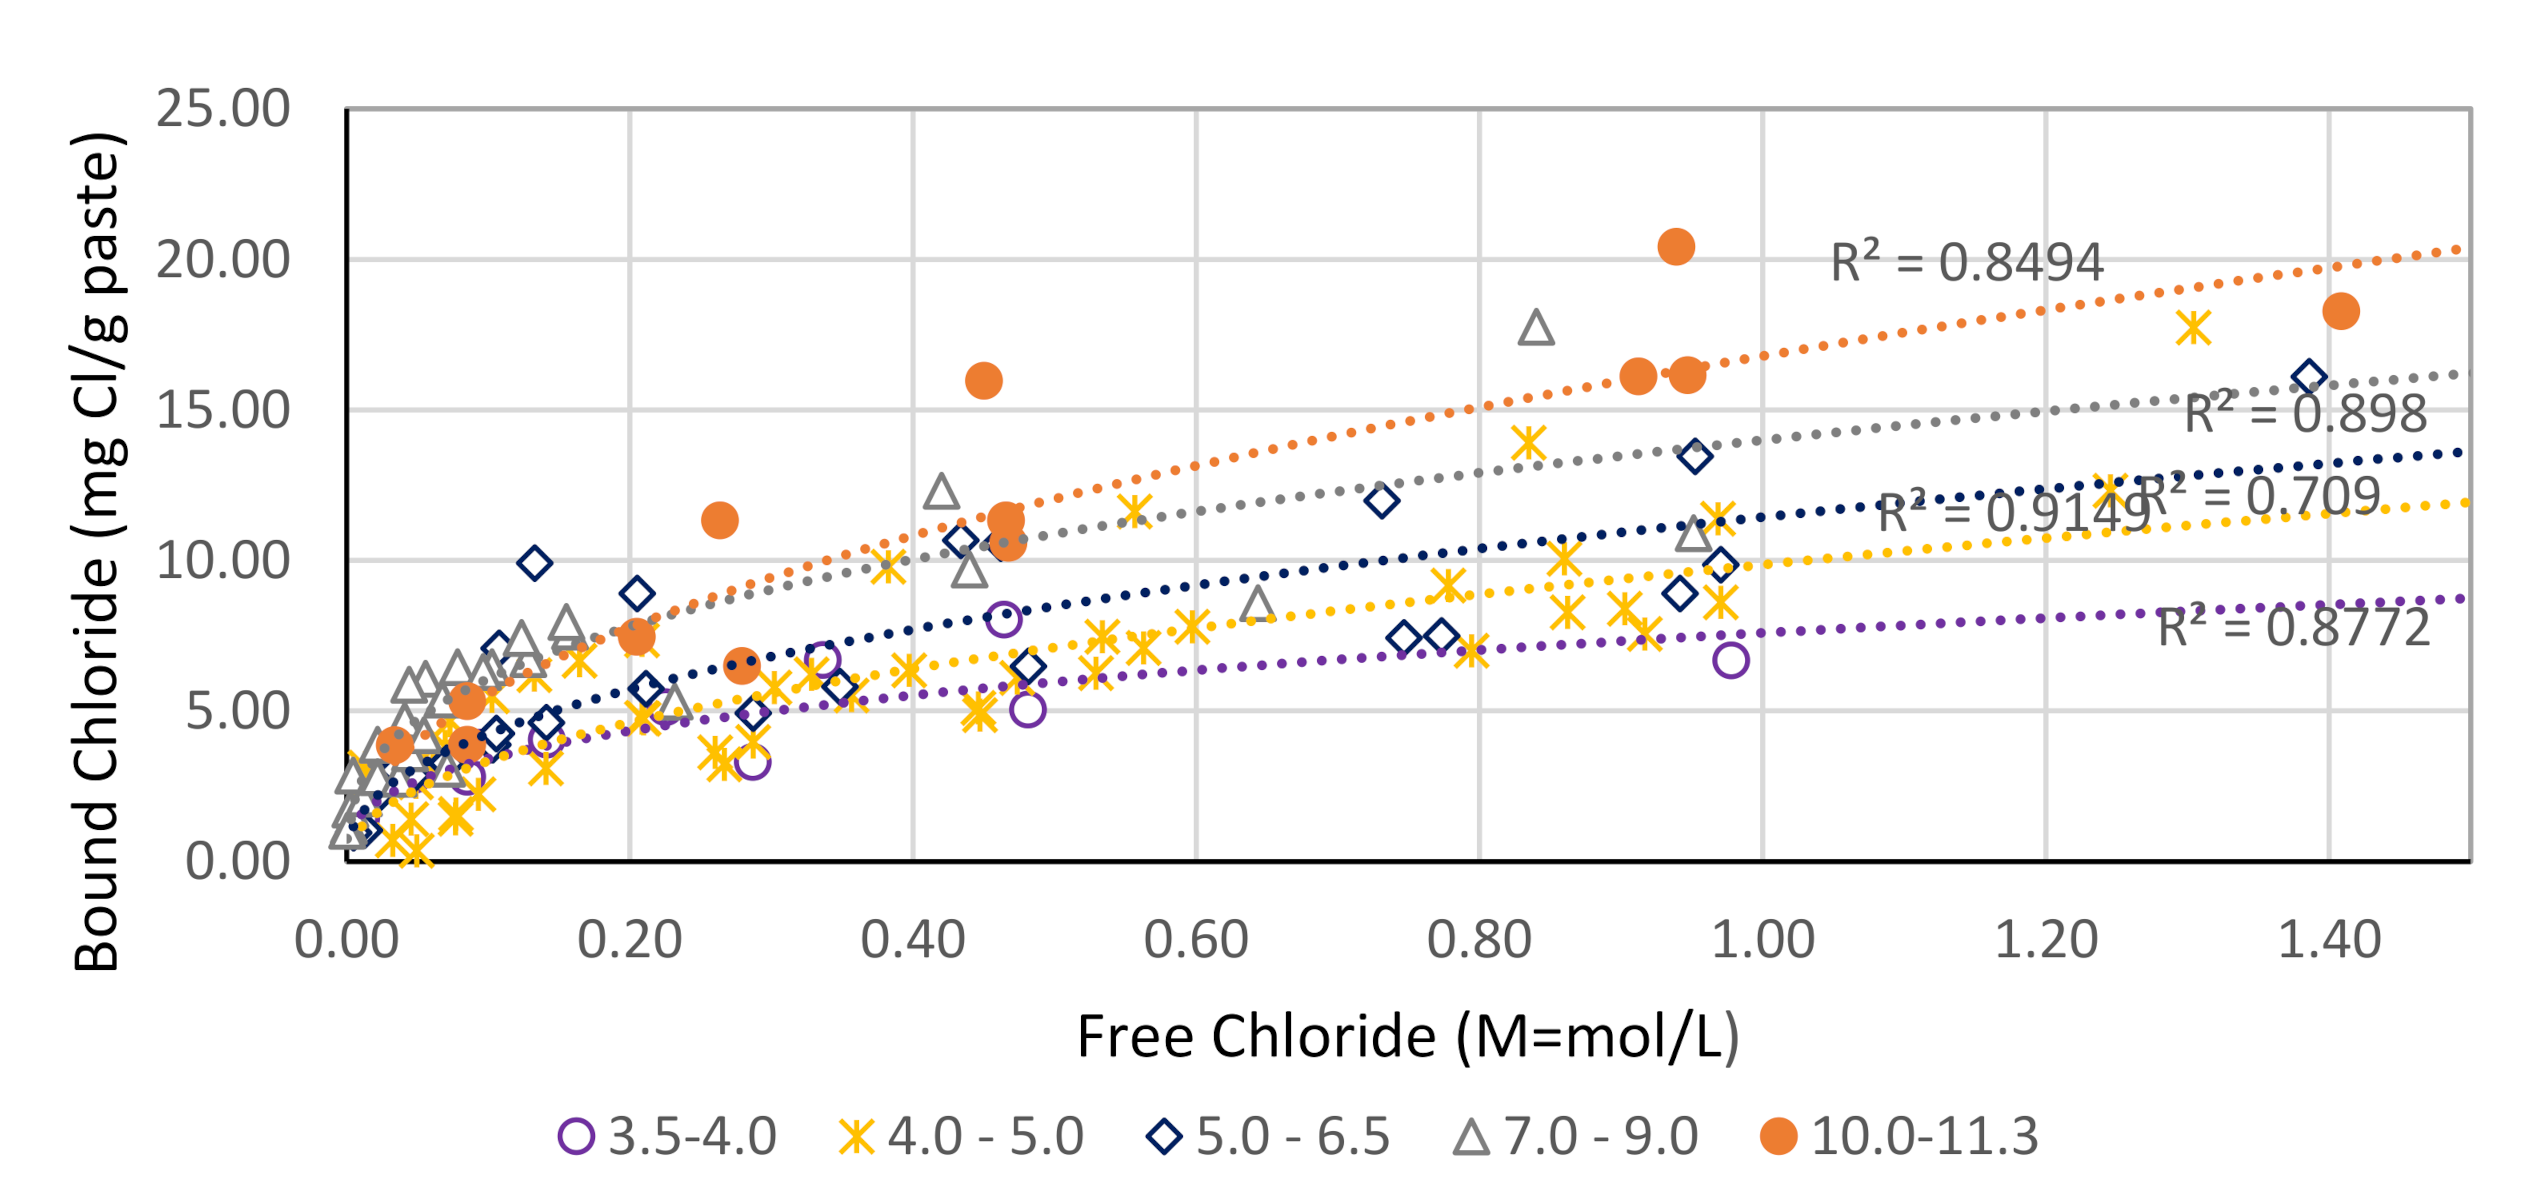
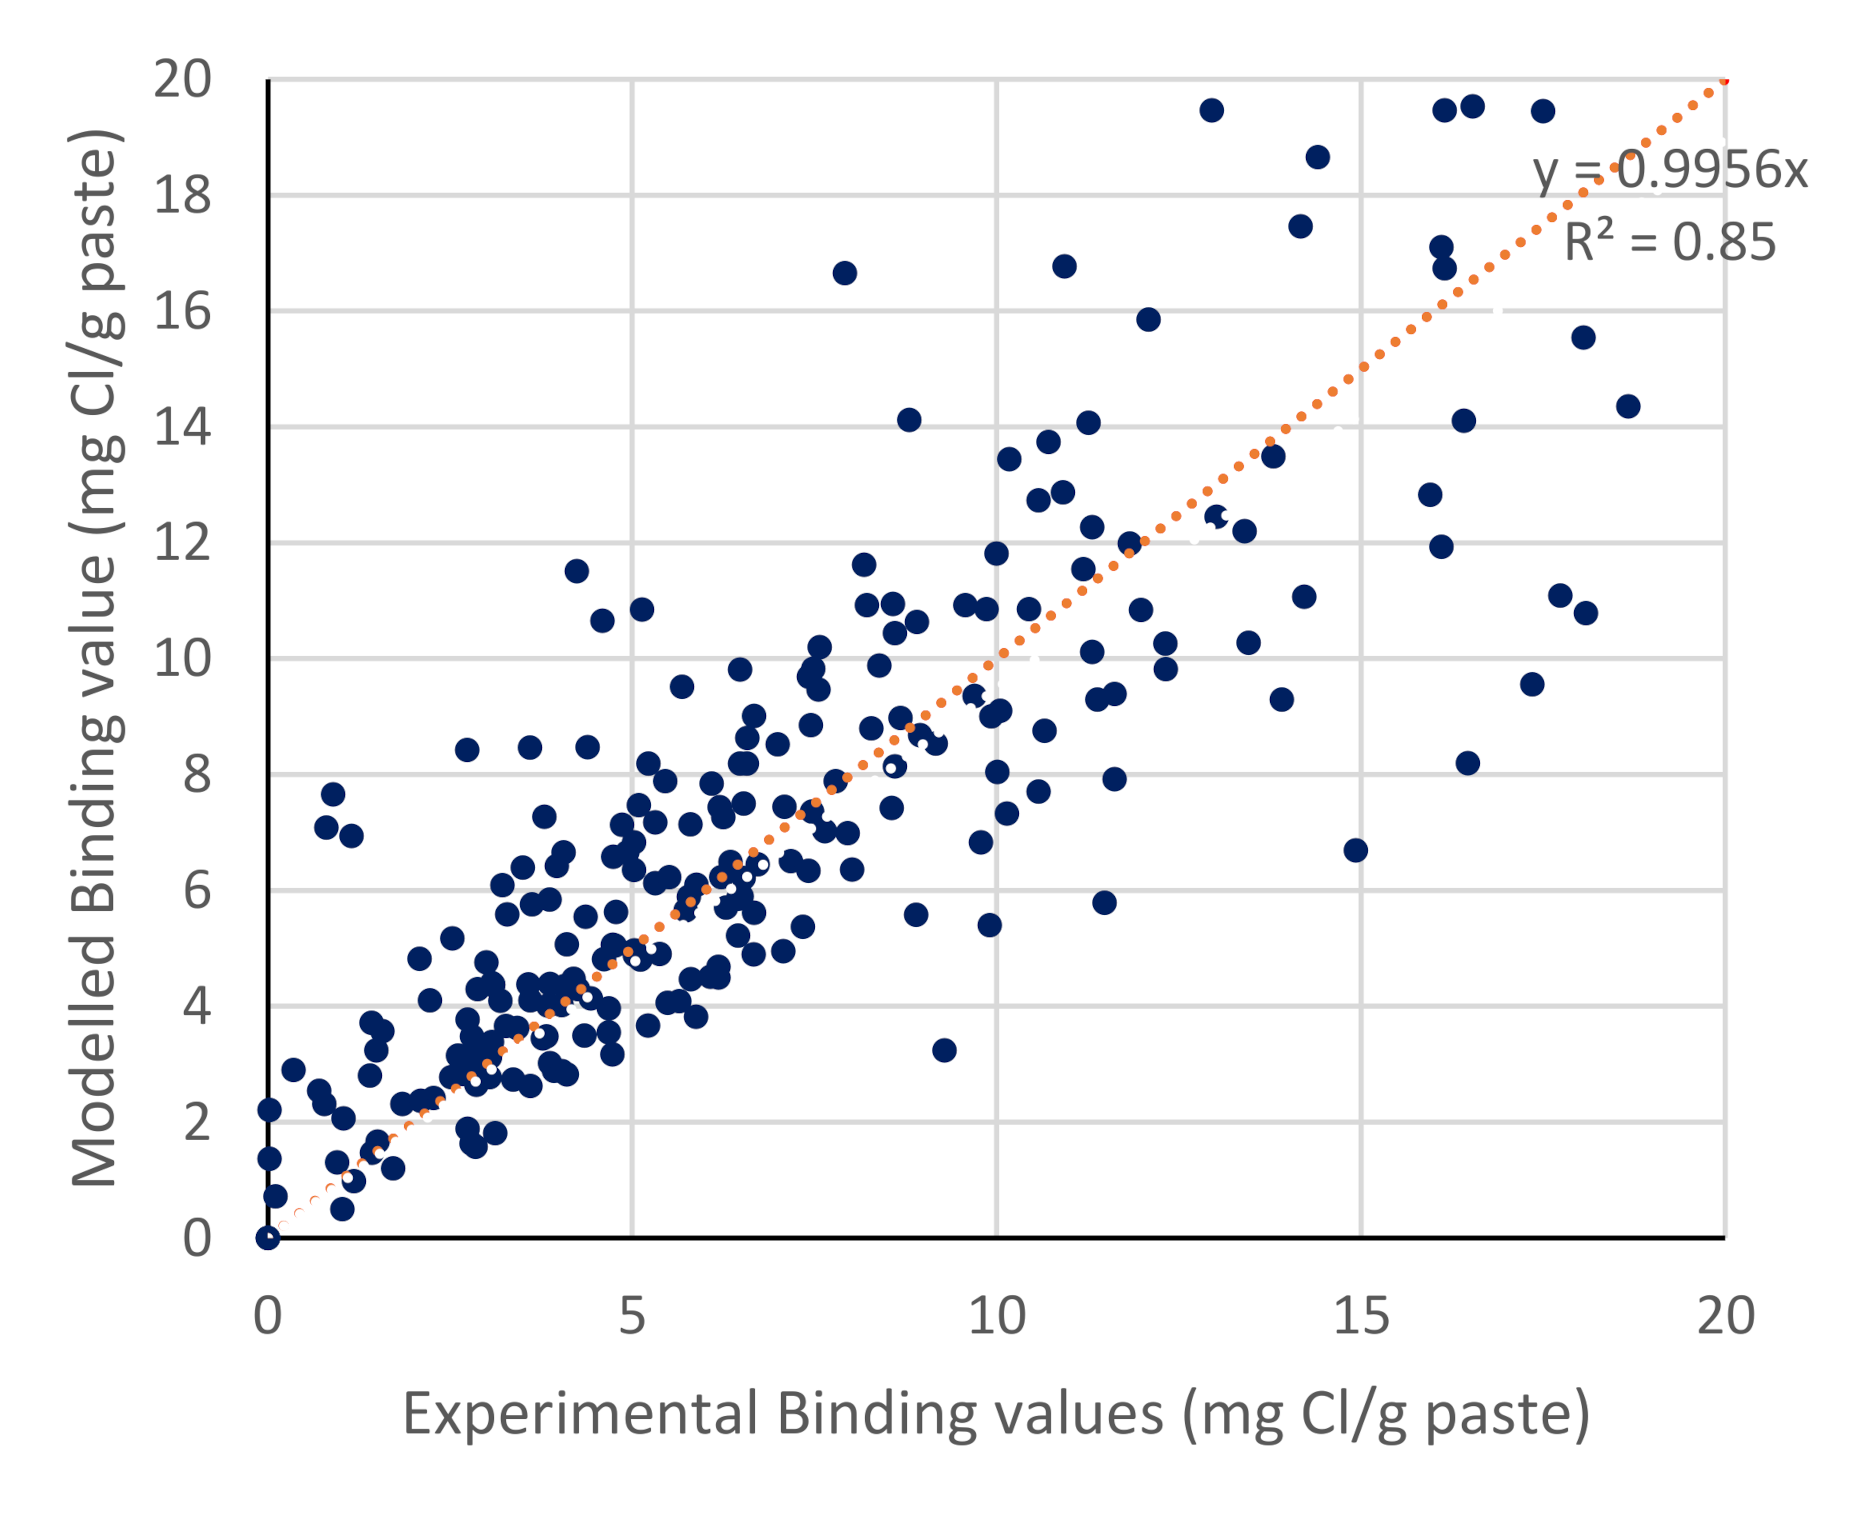
3.2. New Binding Model

The authors collected binding data from different papers [42,43,44,45,46,47,48,49,50,51,52,53,54,55,56] and related the binding results with different oxide components of cement quantitatively. Figure 3 shows the impact of alumina content Al2O3, classified into five groups according to the ratio to the total content, on the bound chloride.
It is clear from Figure 3 that increasing the Al2O3 content increases the binding capacity. Performing the same procedure, the other oxides did not confirm the same trends; they presented, however, mixed results with no consistent trend. Consequently, the model uses Al2O3 content as the main driving parameter on the binding capacity. Based on Figure 4 which shows regression analysis, the terms α and β relate to Al2O3 content ratio (AC) by the following equations:
α =   1.3   A C + 3.44   ,
β =   0.0077   A C + 0.30 .
The proposed binding model solves for α and β in Equations (15) and (16) using the AC as an input, and solves for the bound chloride using the Freundlich isotherm [57]:
C b = α C f β .
Figure 4 shows that the proposed model captures the experimental value very well especially for the realistic moderate values found in water bodies (1.5 M) [58]. The proposed model has a good correlation with R2 = 0.85 to the experimental data given the wide range of the experimental results. Thus, the model is incorporated in the software solution instead of the experimental binding values. The results produced using the binding capacity model are shown in Section 4.2.

3.3. Solution of the Transport Model

Because of the non-linear nature of the effective transport model, it will be difficult to approach its solution analytically. The robust Finite Element Method (FEM) coupled with Finite Difference Method (FDM) was utilized to solve the complex model numerically. For the FEM part, the transformation of the transport model differential equation to FEM compliant equations involved using the Galerkin approach summarized in the steps below:
  • Multiplying the residual (the differential equation) with a weighting function usually taken as the shape function, and integrating over the volume;
  • Rearranging differential terms; and
  • Applying divergence theorem.
Representing Equation (6) with W1 and multiplying with shape function:
W 1 = N T θ i C f i t D i C i d Ω .
By carrying out the integrals in Equation (18) explicitly over a 1D bar element (with length L and cross-section area A), the equation could be transformed to a linear system shown in Equation (19):
M d ˙ + K d = F   ,
where for each finite element, d is the nodal unknown concentrations, K is the stiffness matrix, M is the capacitance matrix, and F is the flux vector, such that
d = C 11 C 21 C i 1 C 1 j C 2 j C i j ,
d ˙ = C 11 ˙ C 21 ˙ C i 1 ˙ C 1 j ˙ C 2 j ˙ C i j ˙ ,
K = A D i L A D i L A D i L A D i L ,
M = A L θ i 3 A L θ i 6 A L θ i 6 A L θ i 3 .
The time derivative of the chloride ion concentration ( d ) ˙ can be evaluated using the FDM. After evaluation, Equation (19) becomes
( M + Δ t   K ) d t Δ t = M   d t + Δ t F t Δ t   ,
where Δ t is the time step chosen for numerical evaluation and t is the current time step.

4. Results and Discussion

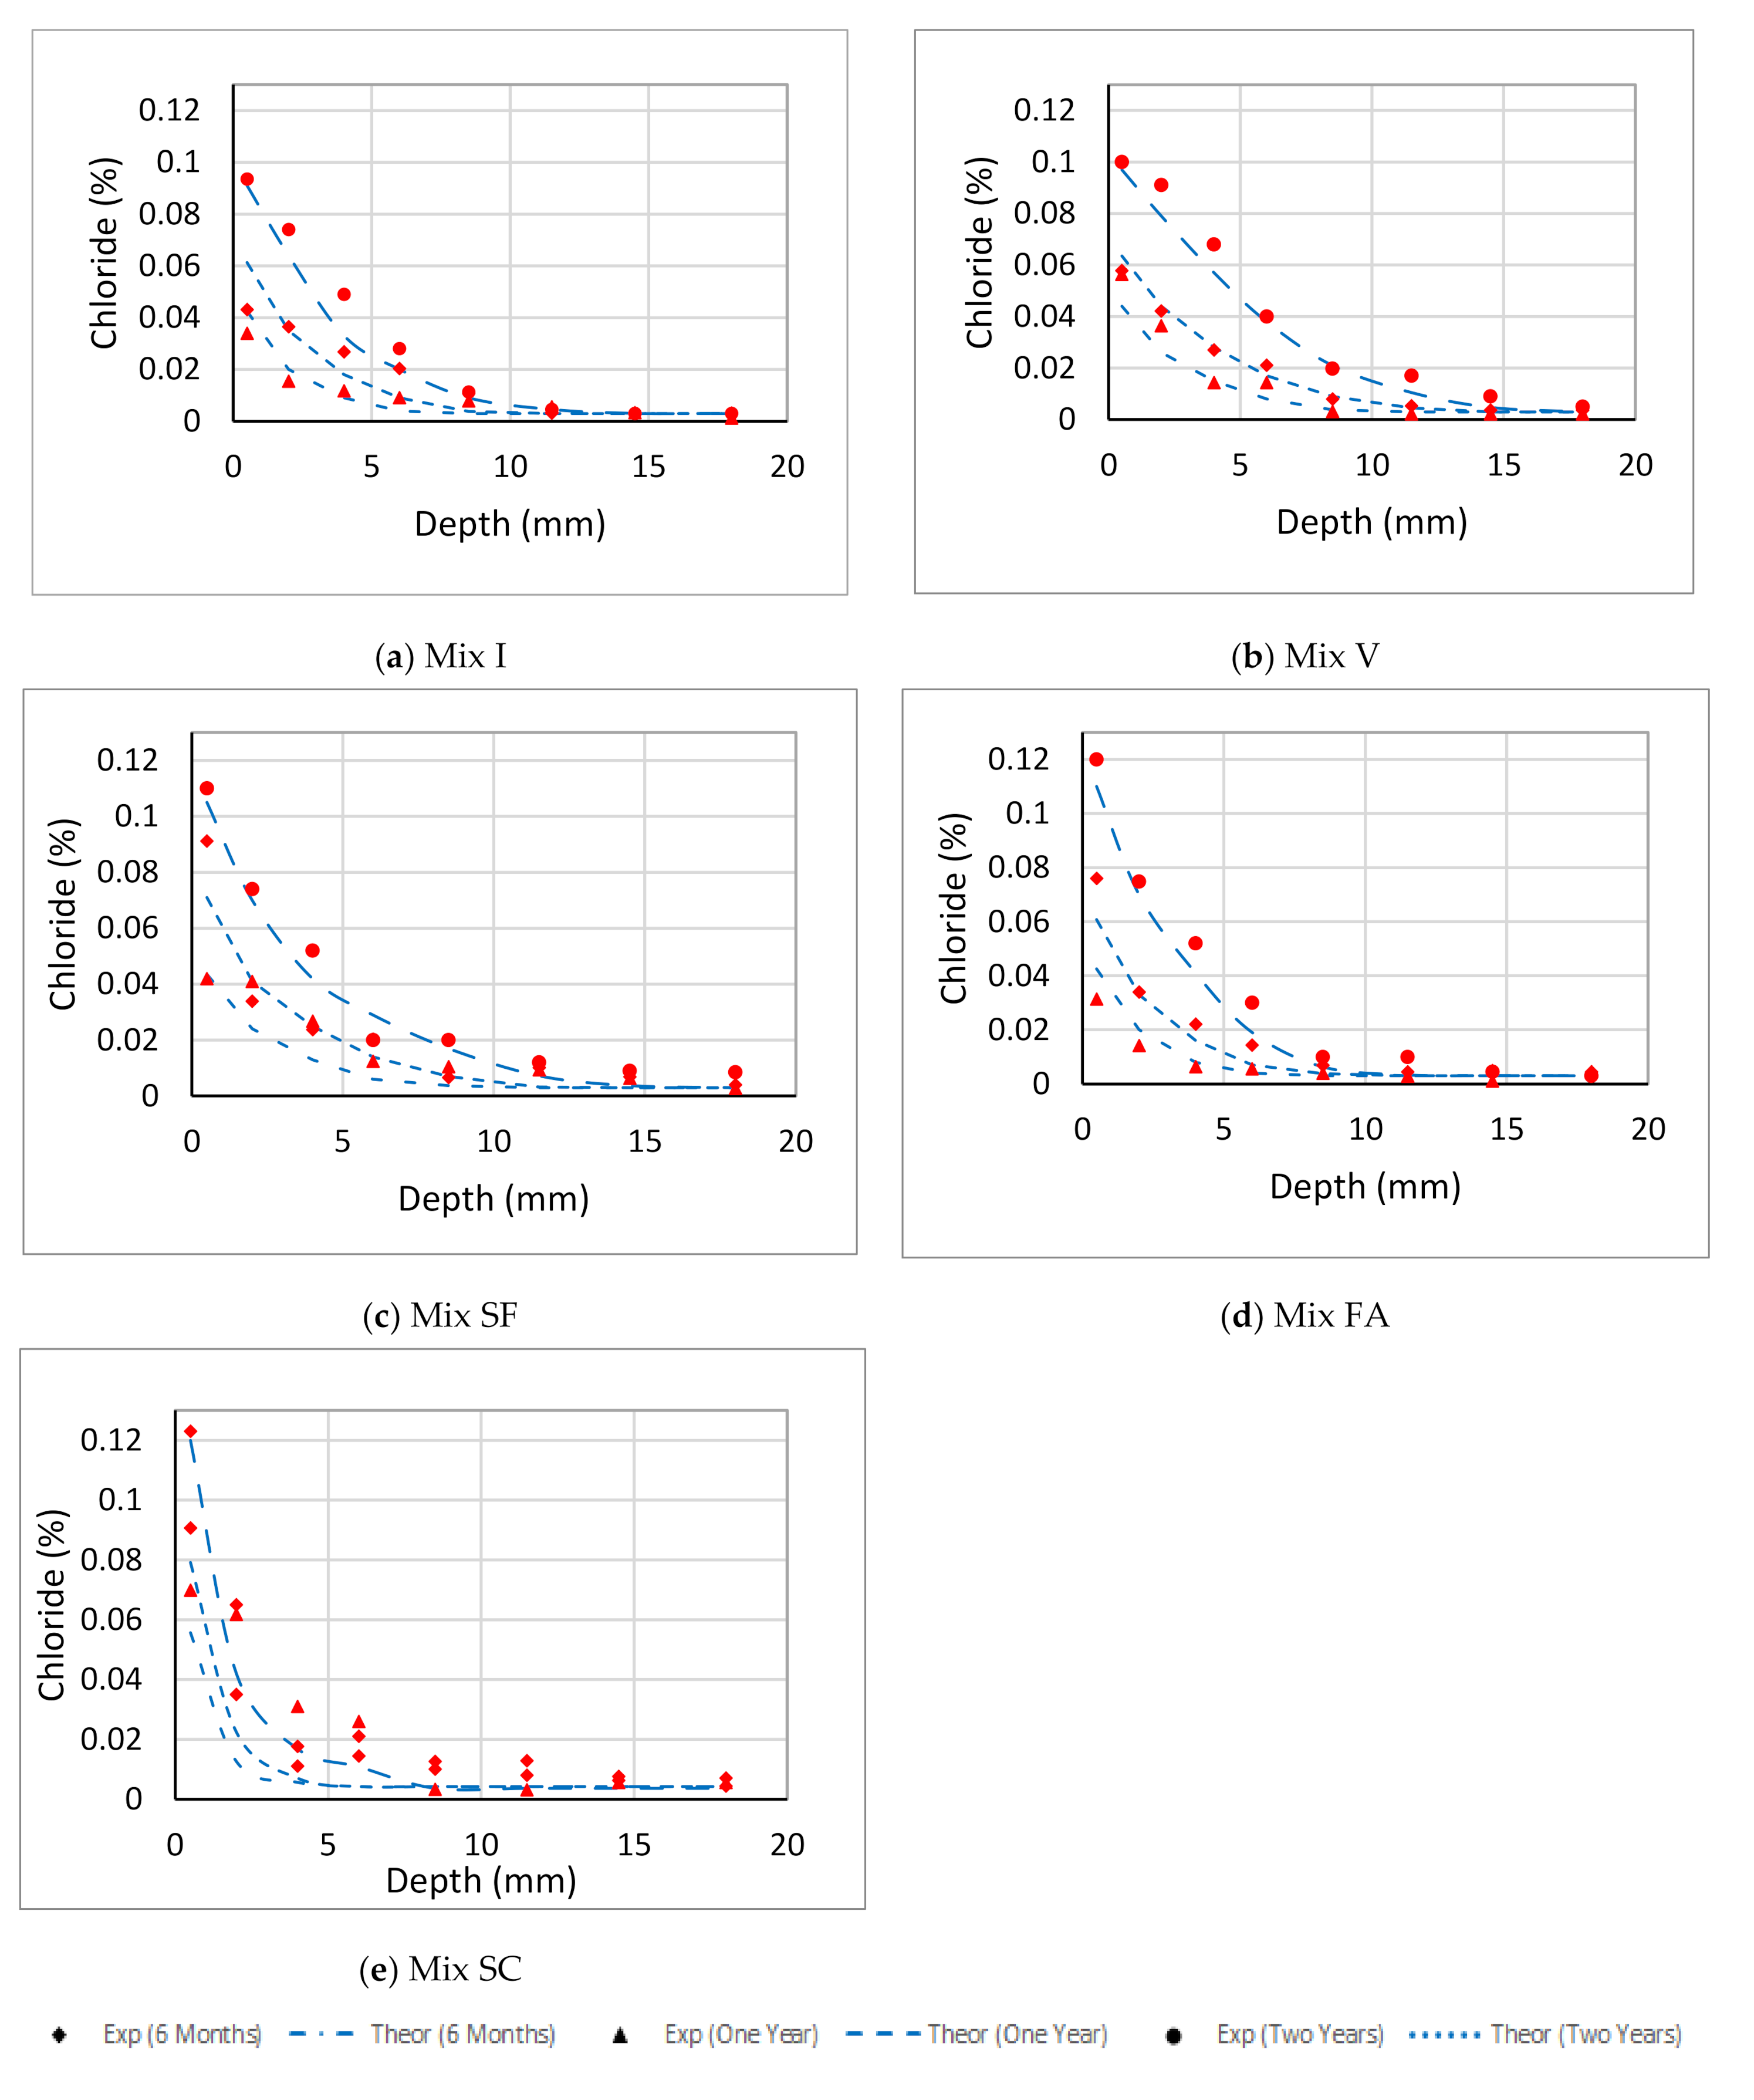
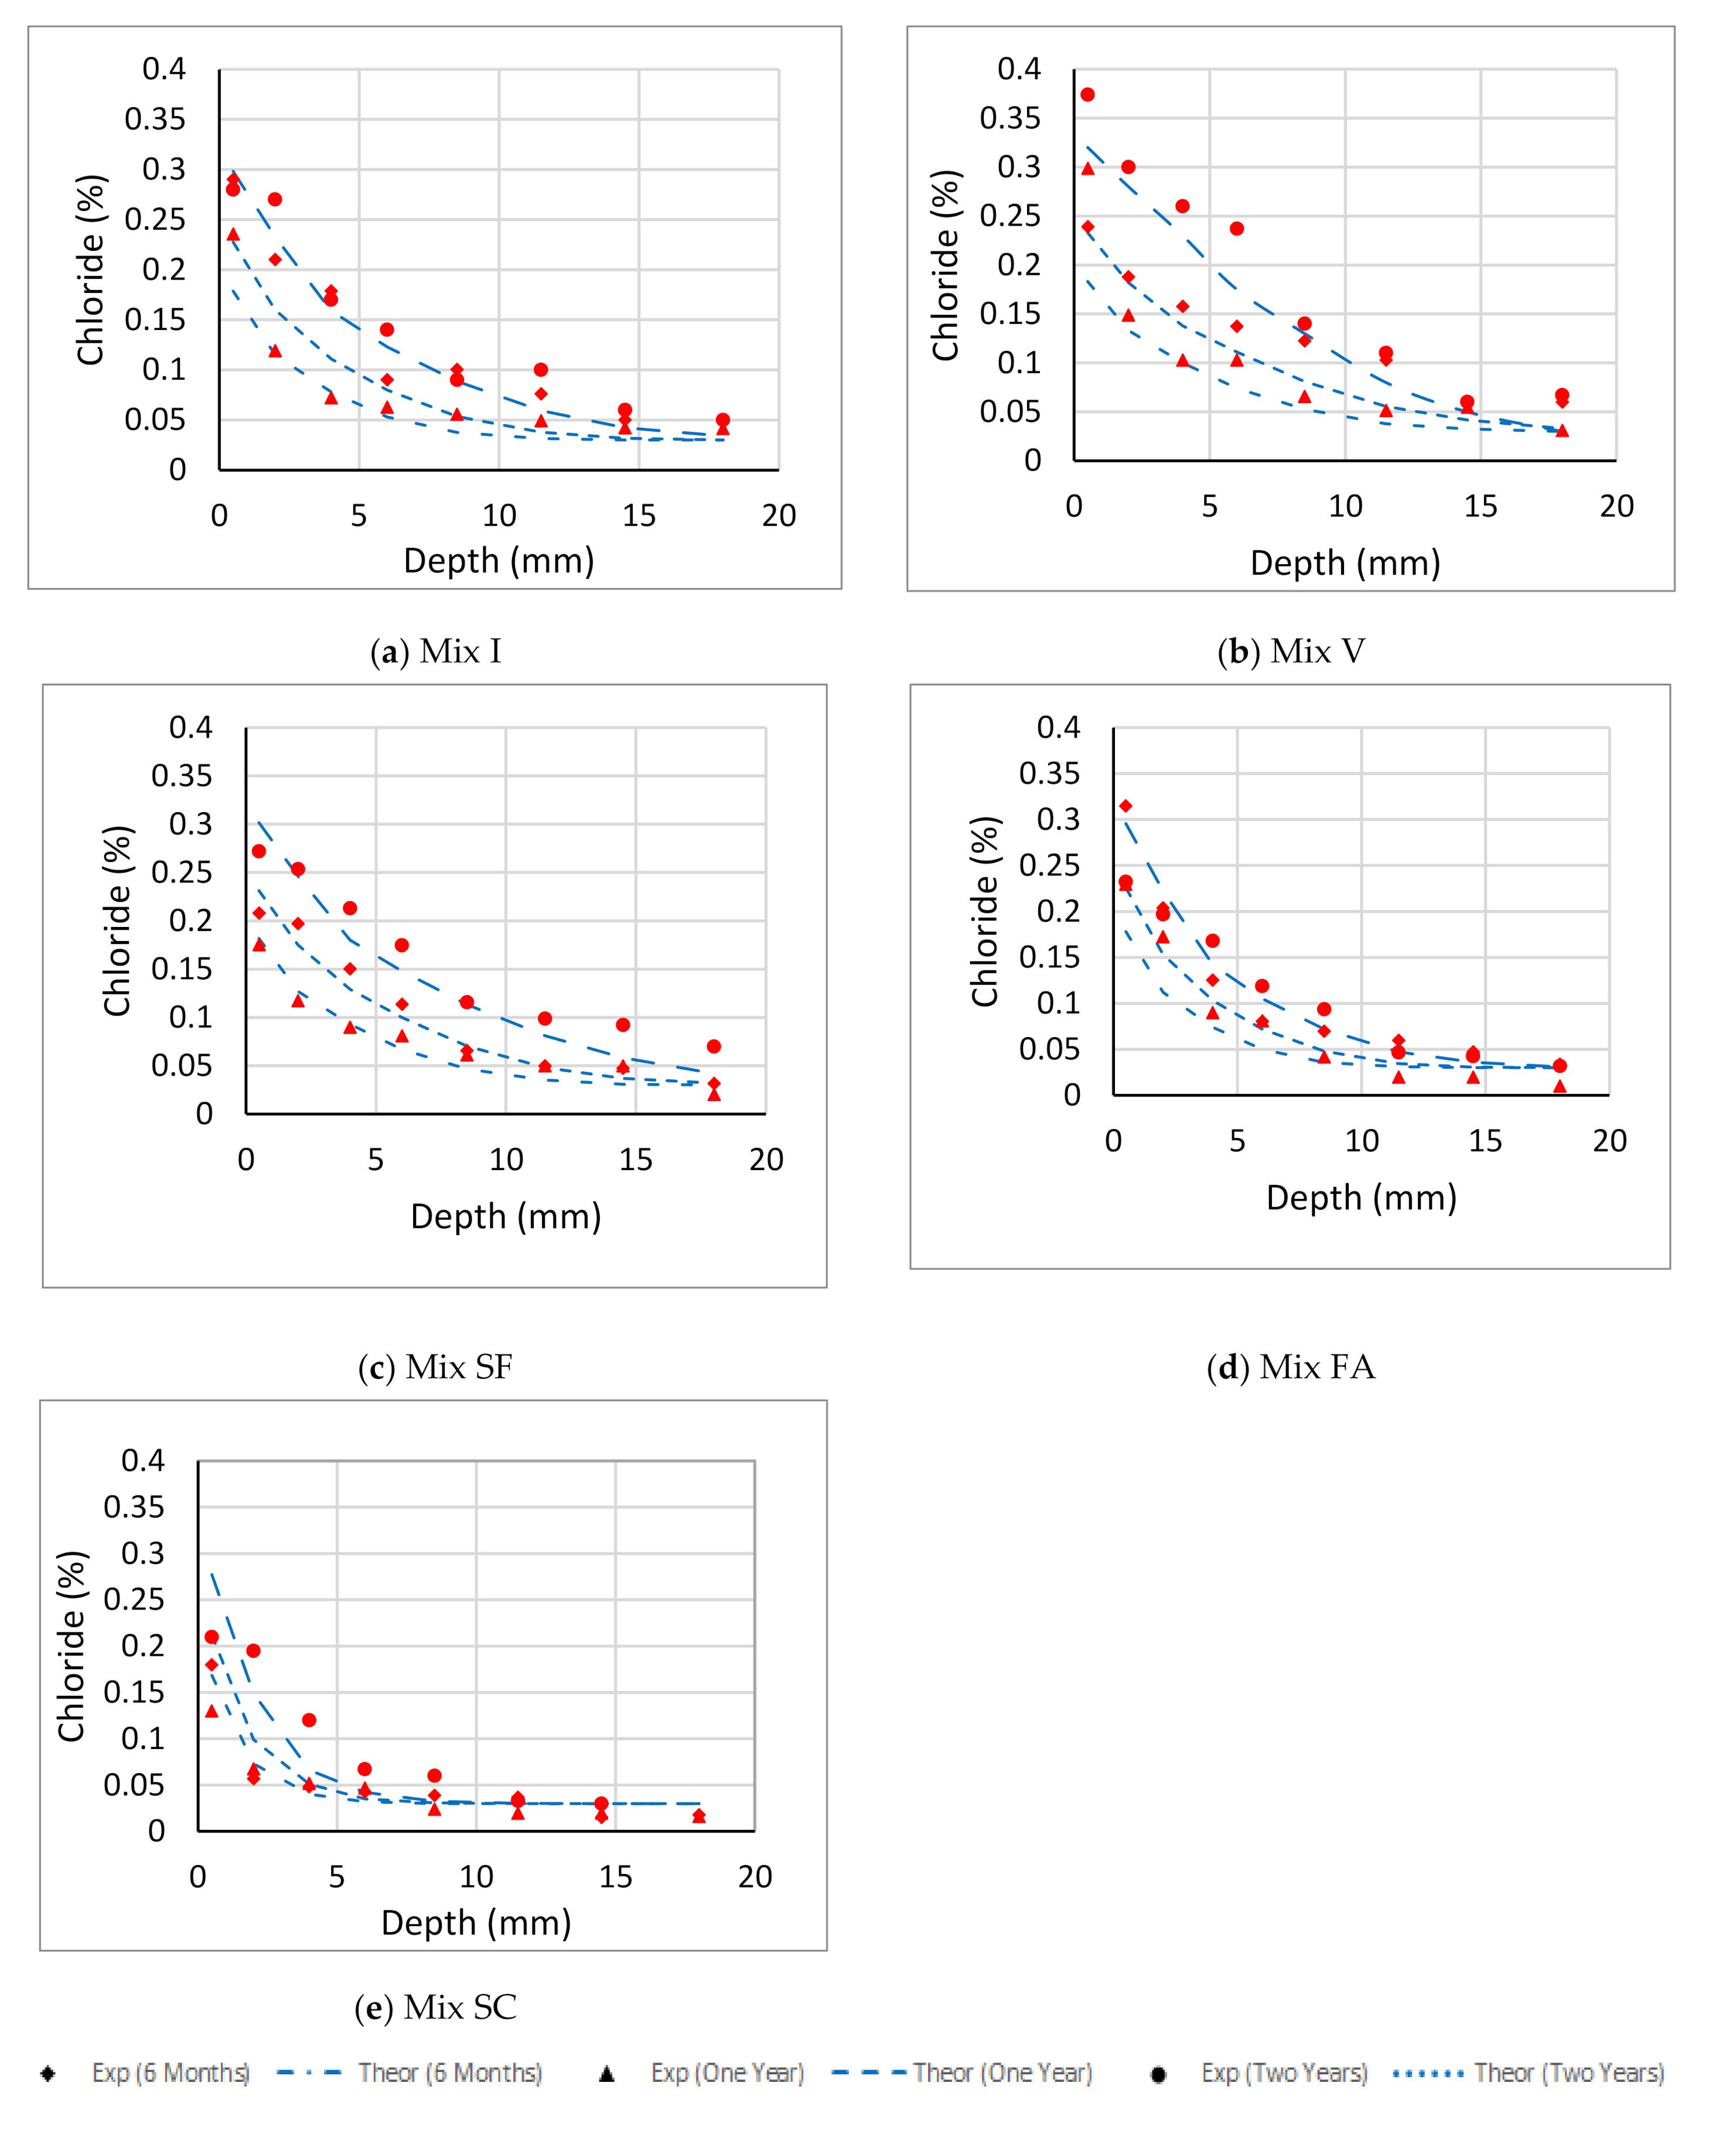
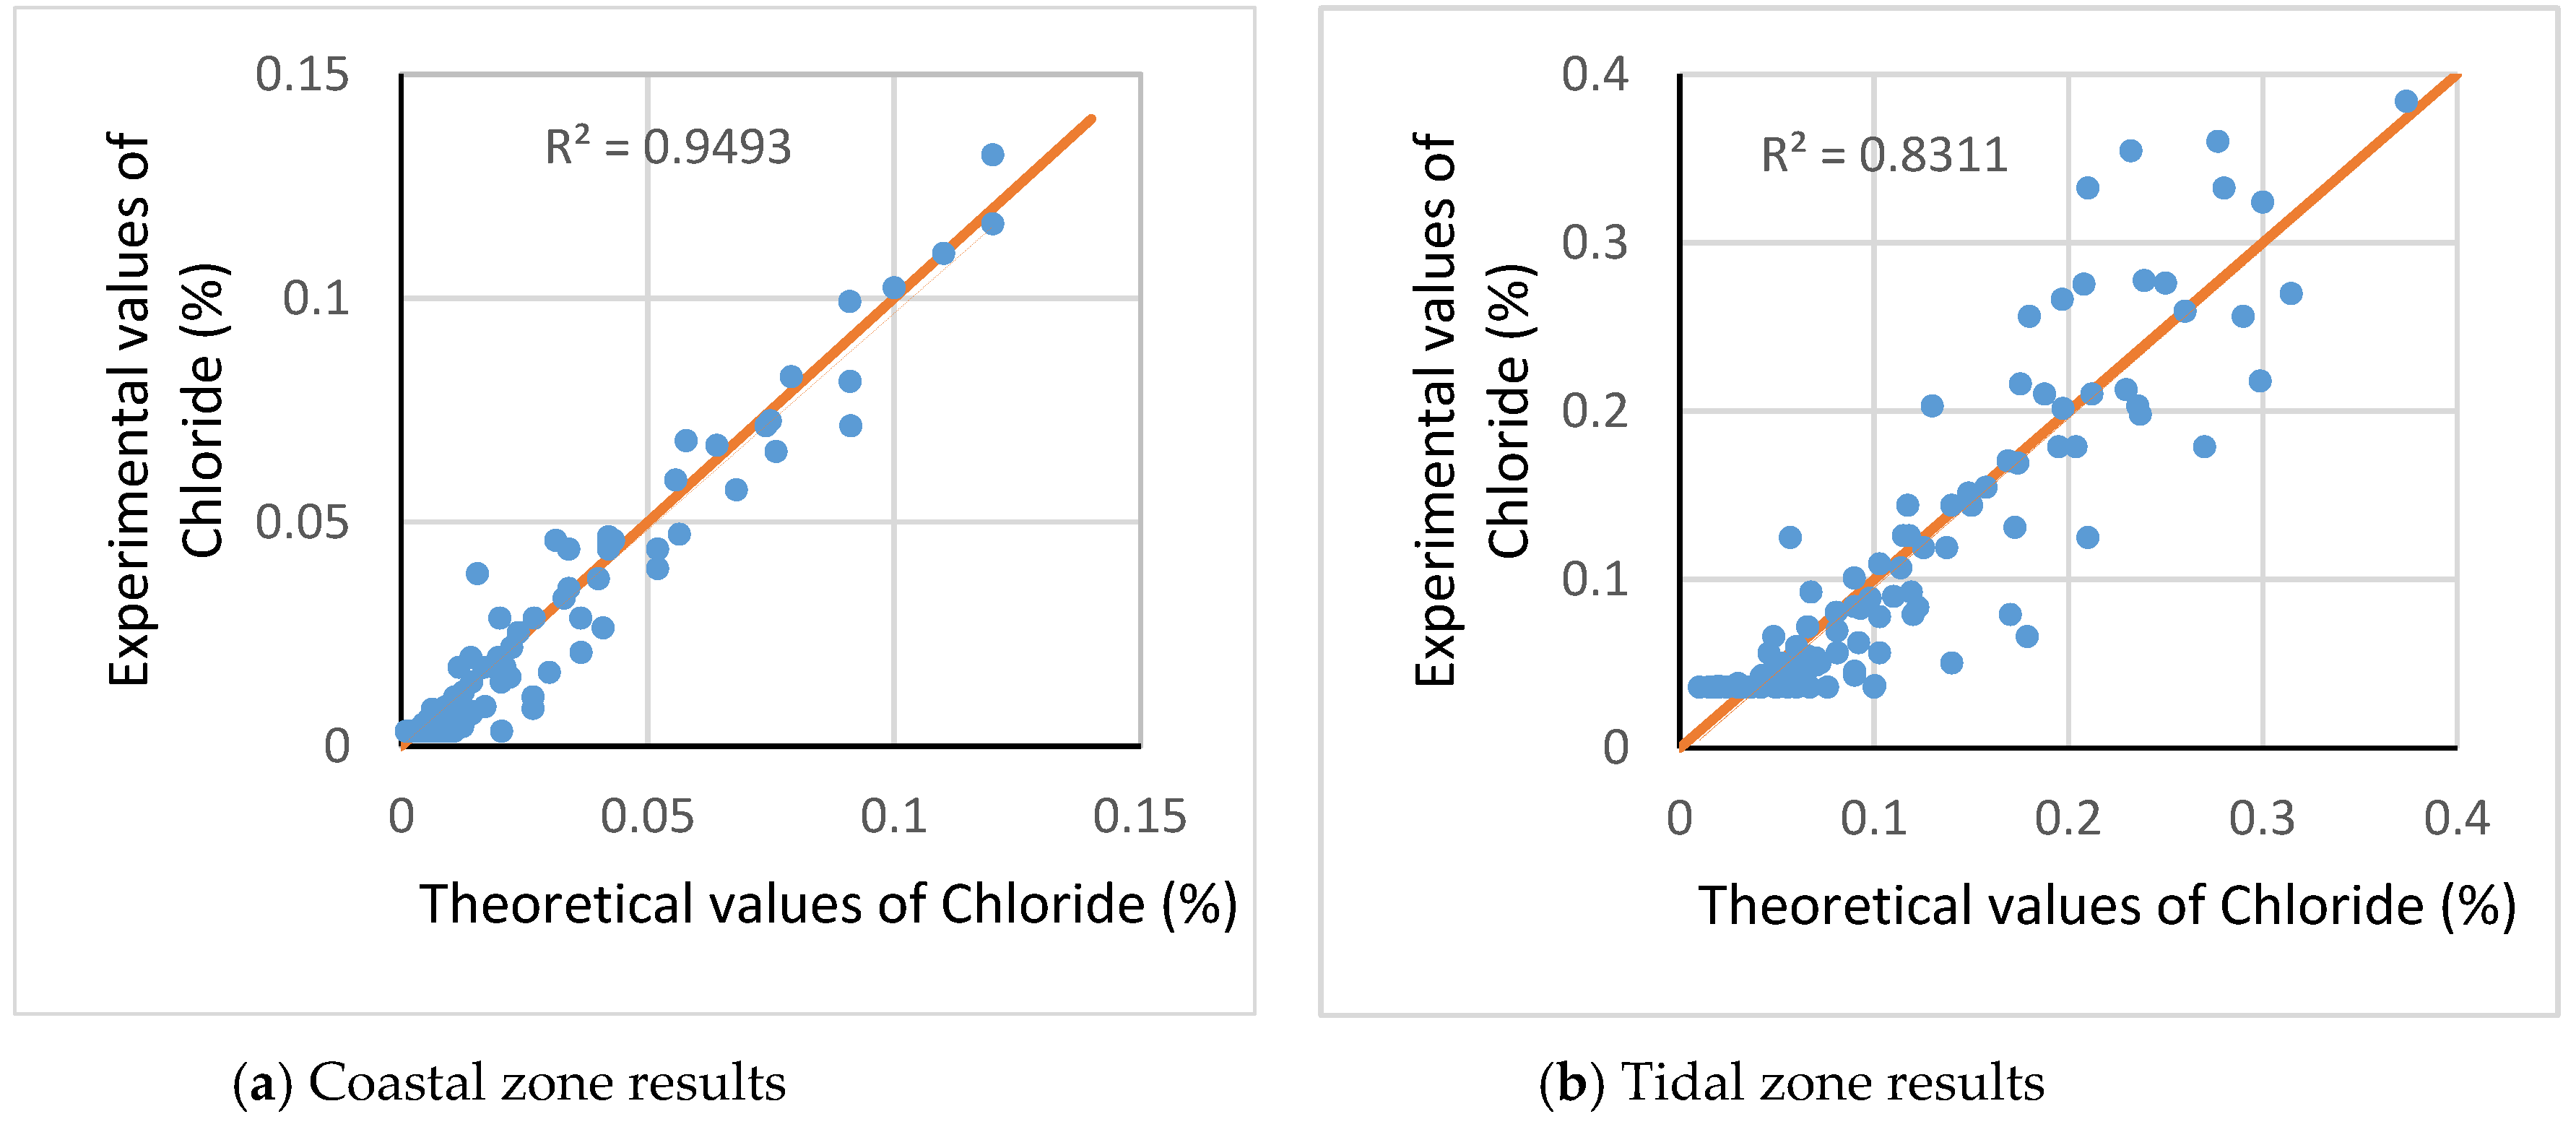
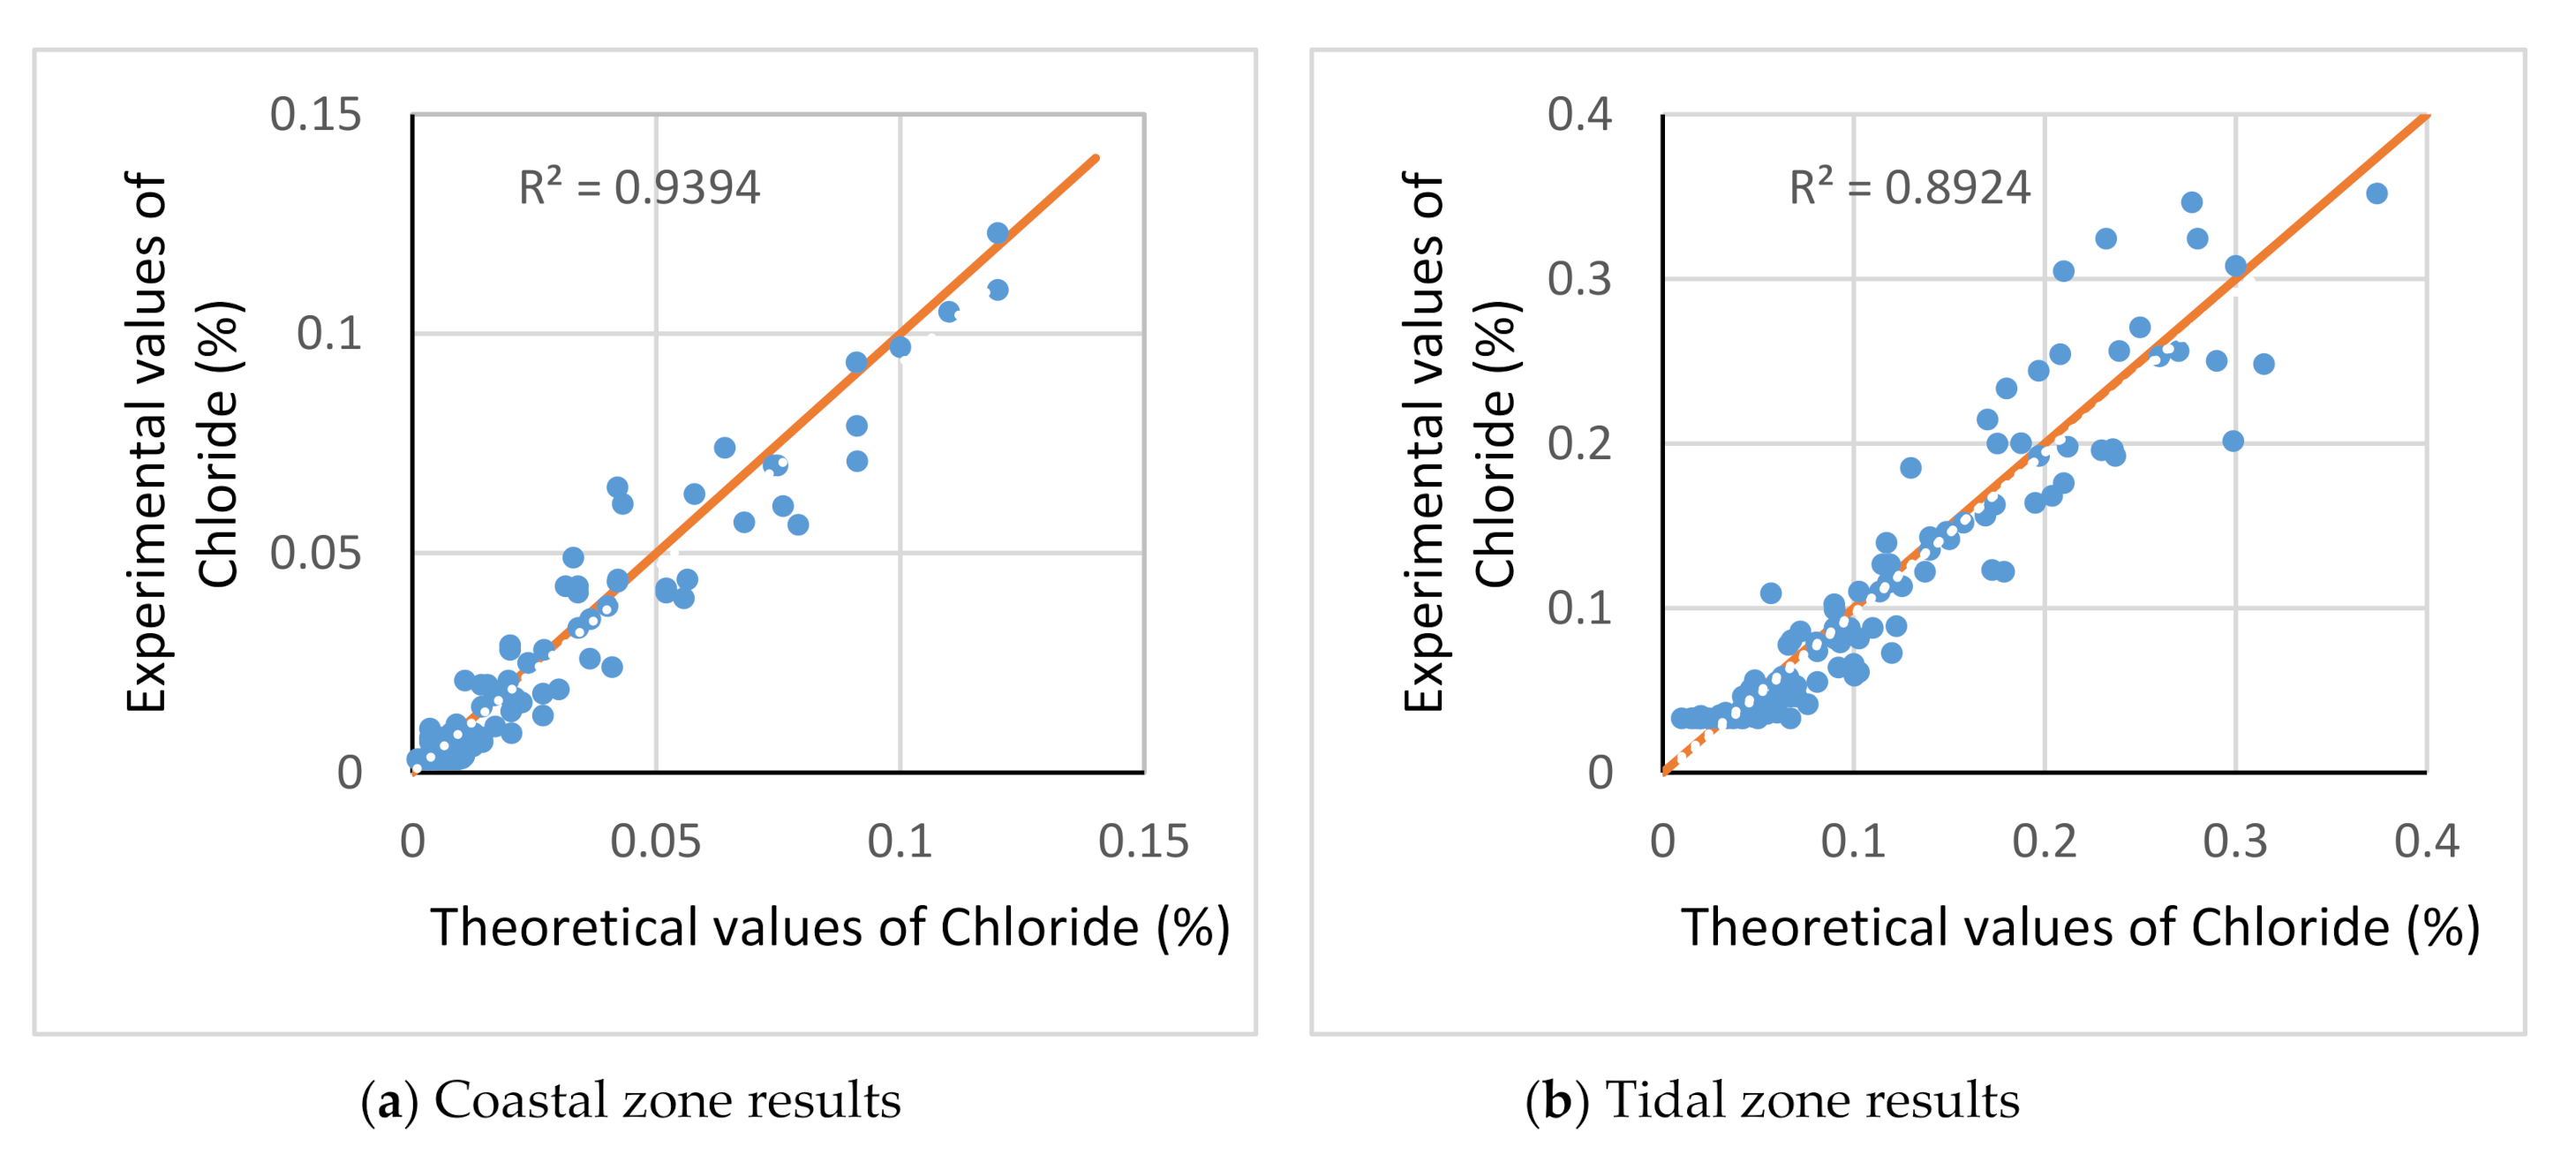
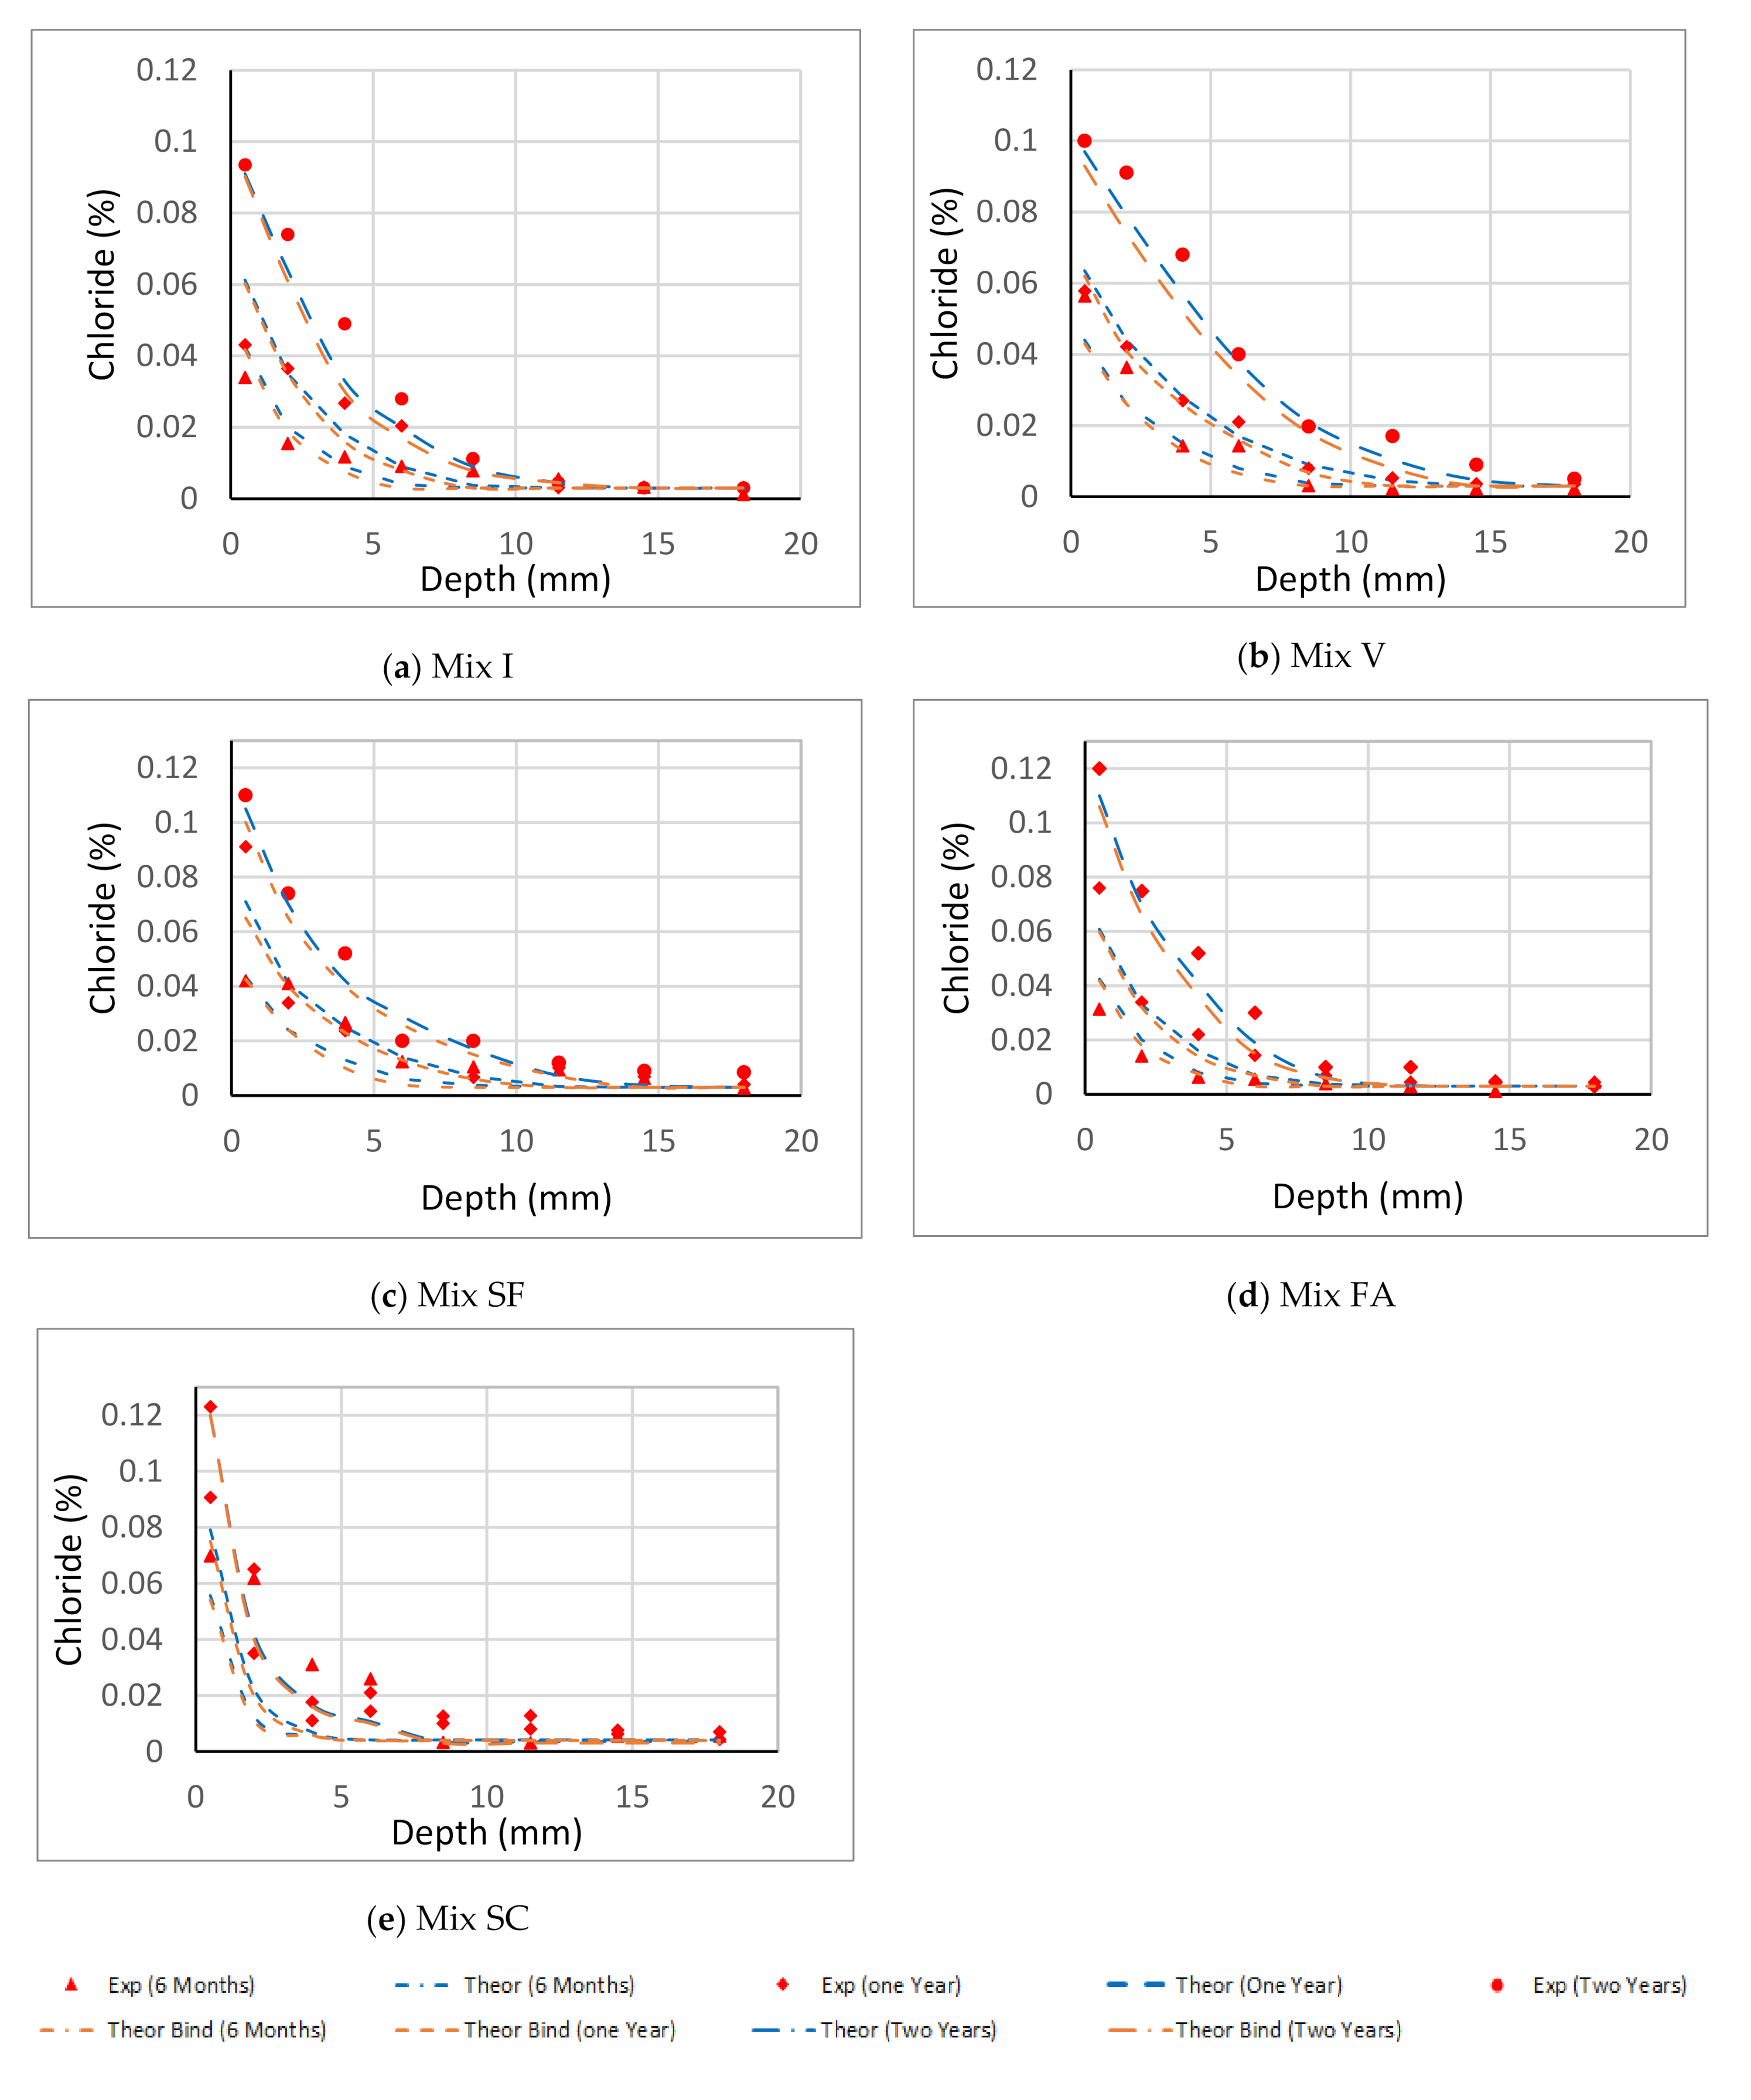
4.1. Transport Model Using Experimental Binding Data

Figure 5 and Figure 6 show the experimental readings and the theoretical chloride profile for the concrete blocks in coastal and tidal zones, respectively. The plots are for duration of exposure for 6, 12, and 24 months. In general, the theoretical plots match well the experimental readings for all of the mixes. Mix SC slightly gives conservative results. This might be attributed to the curing duration of the mixes, which was not sufficient to activate the slag completely [26]. However, there was improvement in the two years readings when the slag functioned effectively in the block.
Owing to the complex nature of chloride diffusion models as a result of the dependence of chloride ion diffusion in concrete on many factors, obtaining a perfectly matching result between the numerical models and experimental investigation is not feasible as evident by results obtained in other studies, such as those by Liu et al. [59], Pradelle et al. [24], Riding et al. [25], and Bernal et al. [2]. However, Table 2 shows the statistical analysis conducted to validate the theoretical results against experimental ones. The β-coefficient and R2 (Figure 7) are equal to 1.00 and 0.94 for coastal zone, and 0.89 and 0.89 for tidal zone. This evidenced the accuracy of the model. It can also be seen that the β-coefficient increases with exposure increase, which implies more accuracy is obtained overtime.

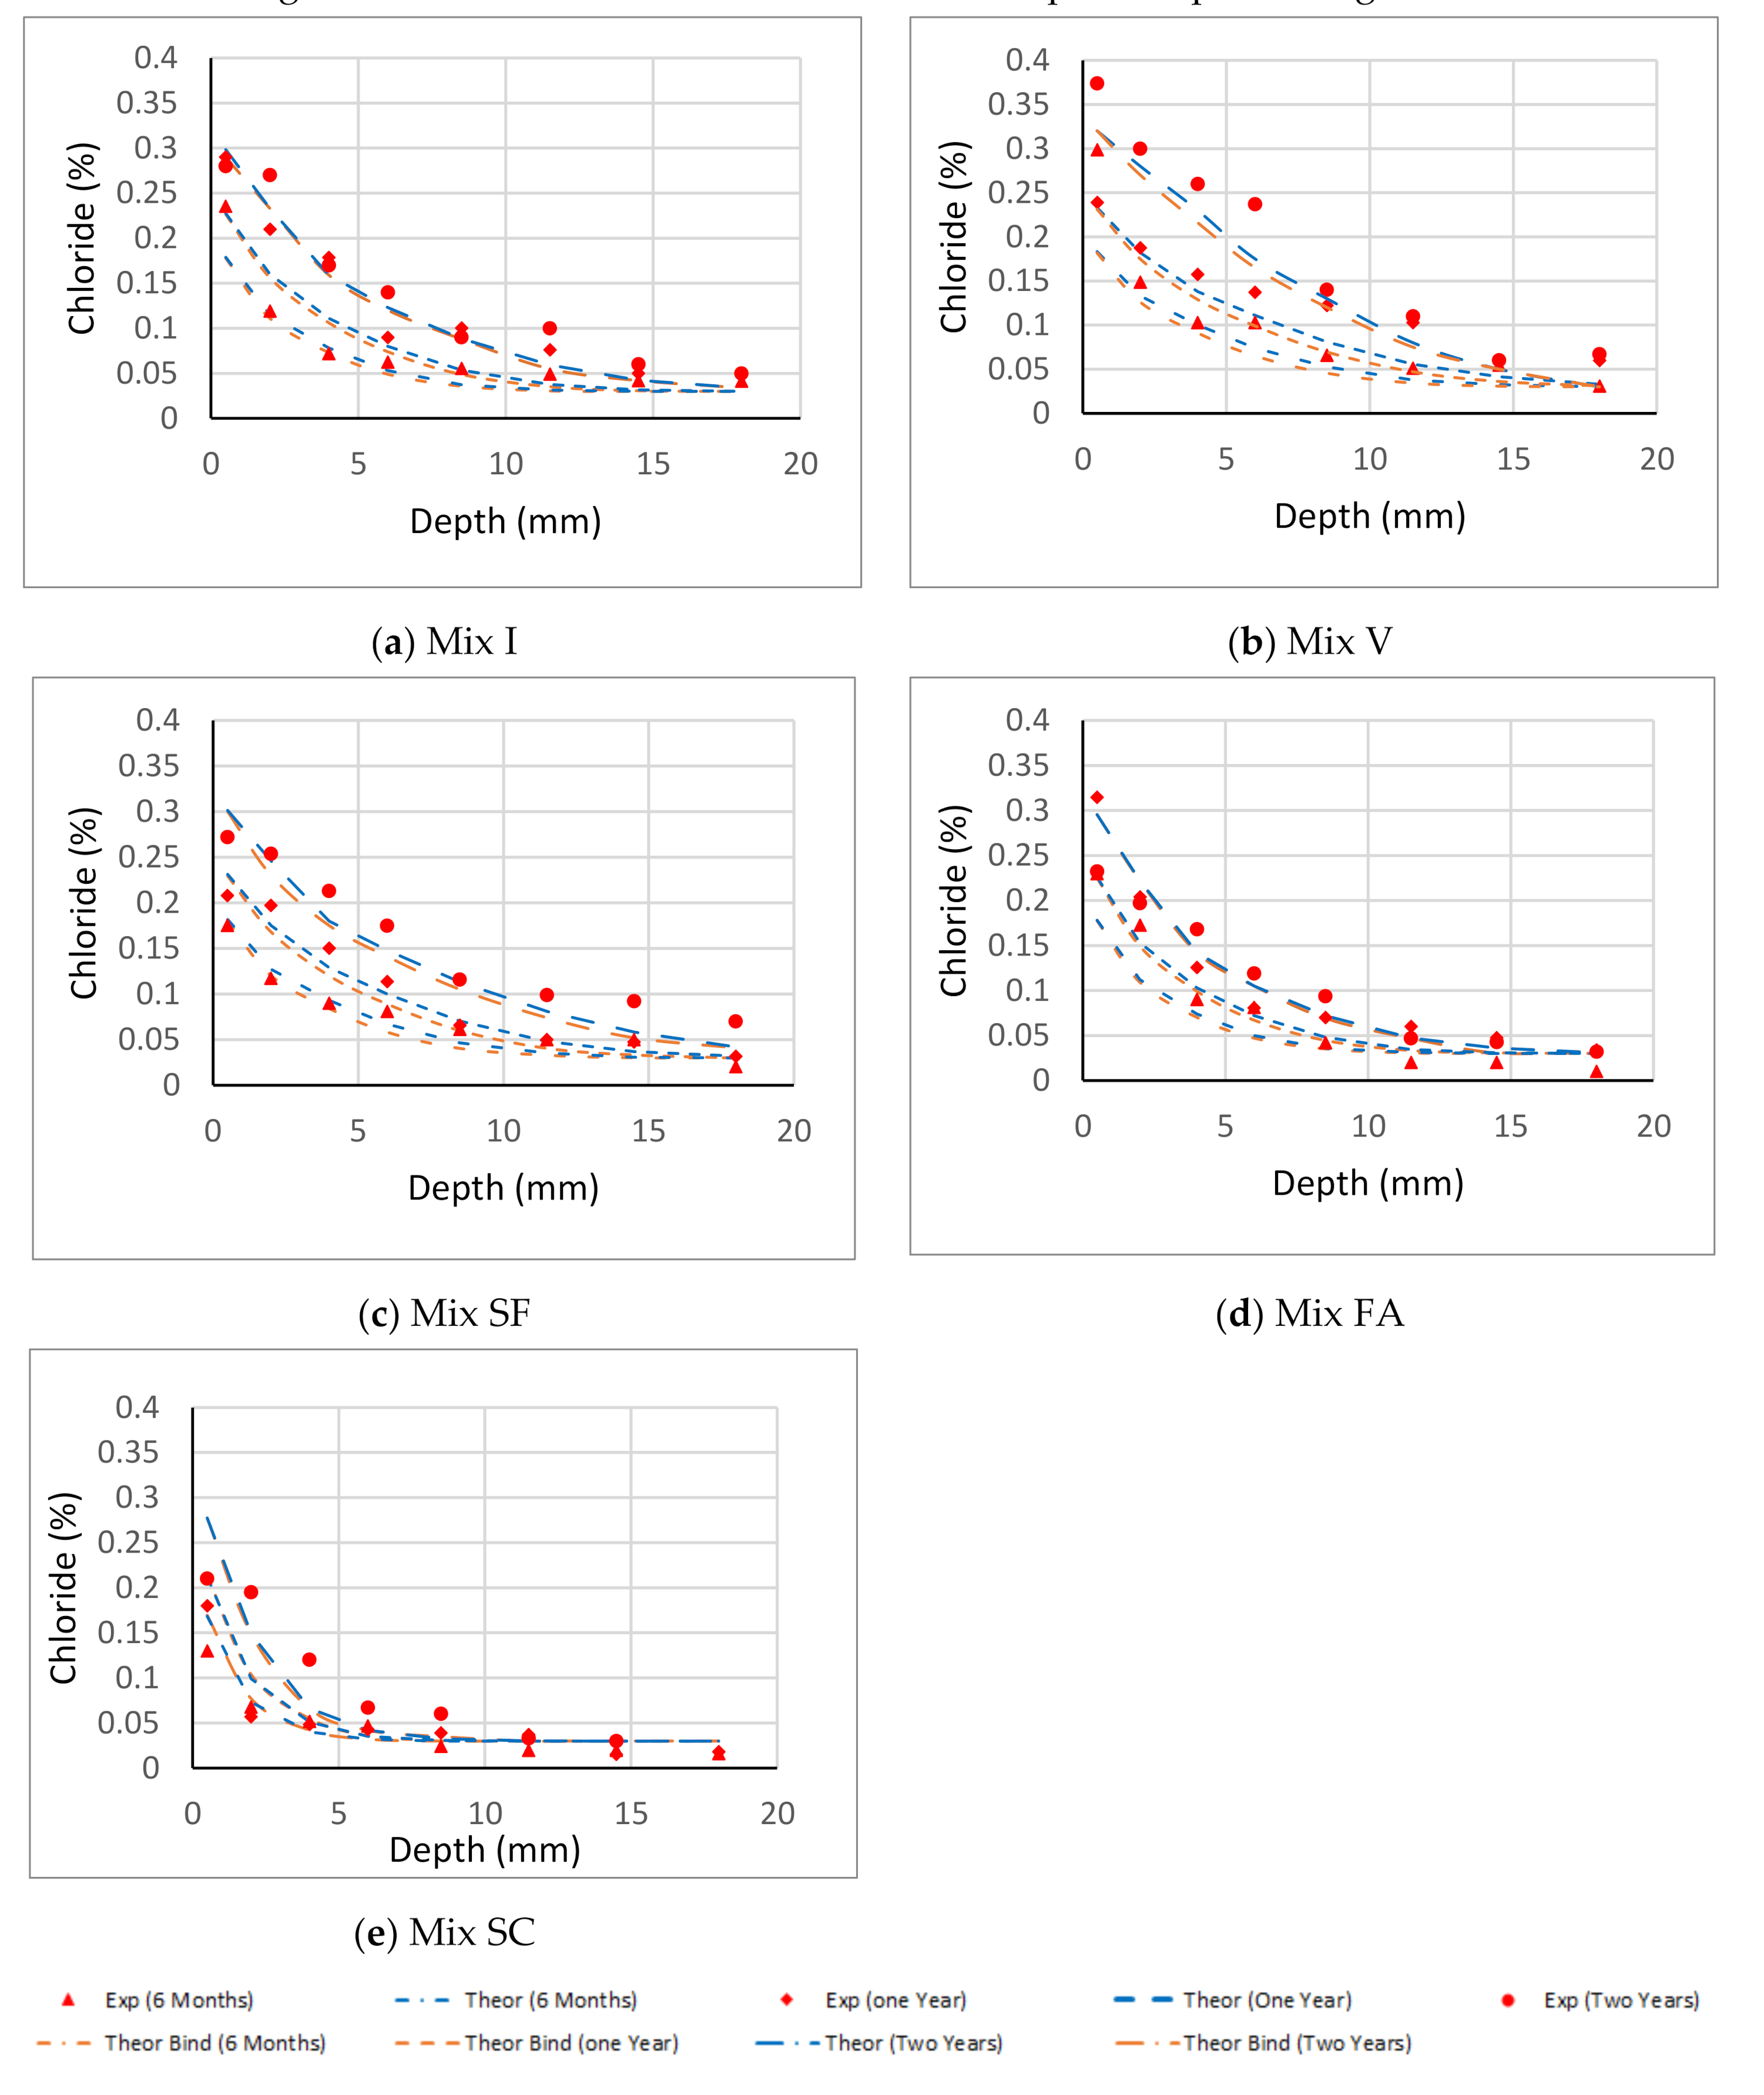
4.2. Transport Model Using the New Binding Model

Figure 8 and Figure 9 show the experimental readings and the theoretical chloride profile for the concrete blocks, using the experimental binding data and the binding model, in coastal and tidal zones, respectively. The chloride profile plots are well correlated to the theoretical plots using the experimental binding data. This shows the accuracy of the proposed binding model in predicting the effective diffusion coefficient.
It is noteworthy that using the proposed binding model produces conservative results. The parameter m serves as a shape function of the chloride profile, and increasing its value yields more concave profiles which indicate the existence of high SCMs in the concrete. The calculations of the initial apparent diffusion and the apparent diffusivity over time in Equations (8) and (9) are good approximations of their counterparts in the experimental testing. Using these and the binding values produces reasonable values of the effective diffusivity [16]. Adopting the effective diffusivity in the transport model can be a direct caliber for prediction of concrete threshold at which steel starts corrosion. On the other hand, using the apparent diffusivity results in determining approximately the total chloride without identifying the state of chlorides. Therefore, free chloride profiling is more realistic in service life modeling and assessing durability of concrete structures. Moreover, the algorithm embeds different environmental parameters, such as temperature and carbonation, in calibrating the effective diffusion coefficient at each step of the solution. This approach simplifies the analysis by decoupling the impacts of the environmental parameters and reduces the time needed for obtaining results. Yet, it produces accurate results. Therefore, the developed algorithm supports using effective diffusion coefficient with calibration along with binding capacity only to predict the free chloride profile in concrete at different depths. Hence, the other terms in the transport laws, such as chemical activities and electrical flux, could be omitted from solution because the expected change in the results might not be noticeable and is not worth the expensive processing.
Figure 10 shows, through statistical analysis, that β-coefficient and R2 are equal to 0.9 and 0.93 for coastal zone, and 0.87 and 0.83 for tidal zone. This evidenced the accuracy of the model using the new binding model when compared with the results generated using experimental binding data.

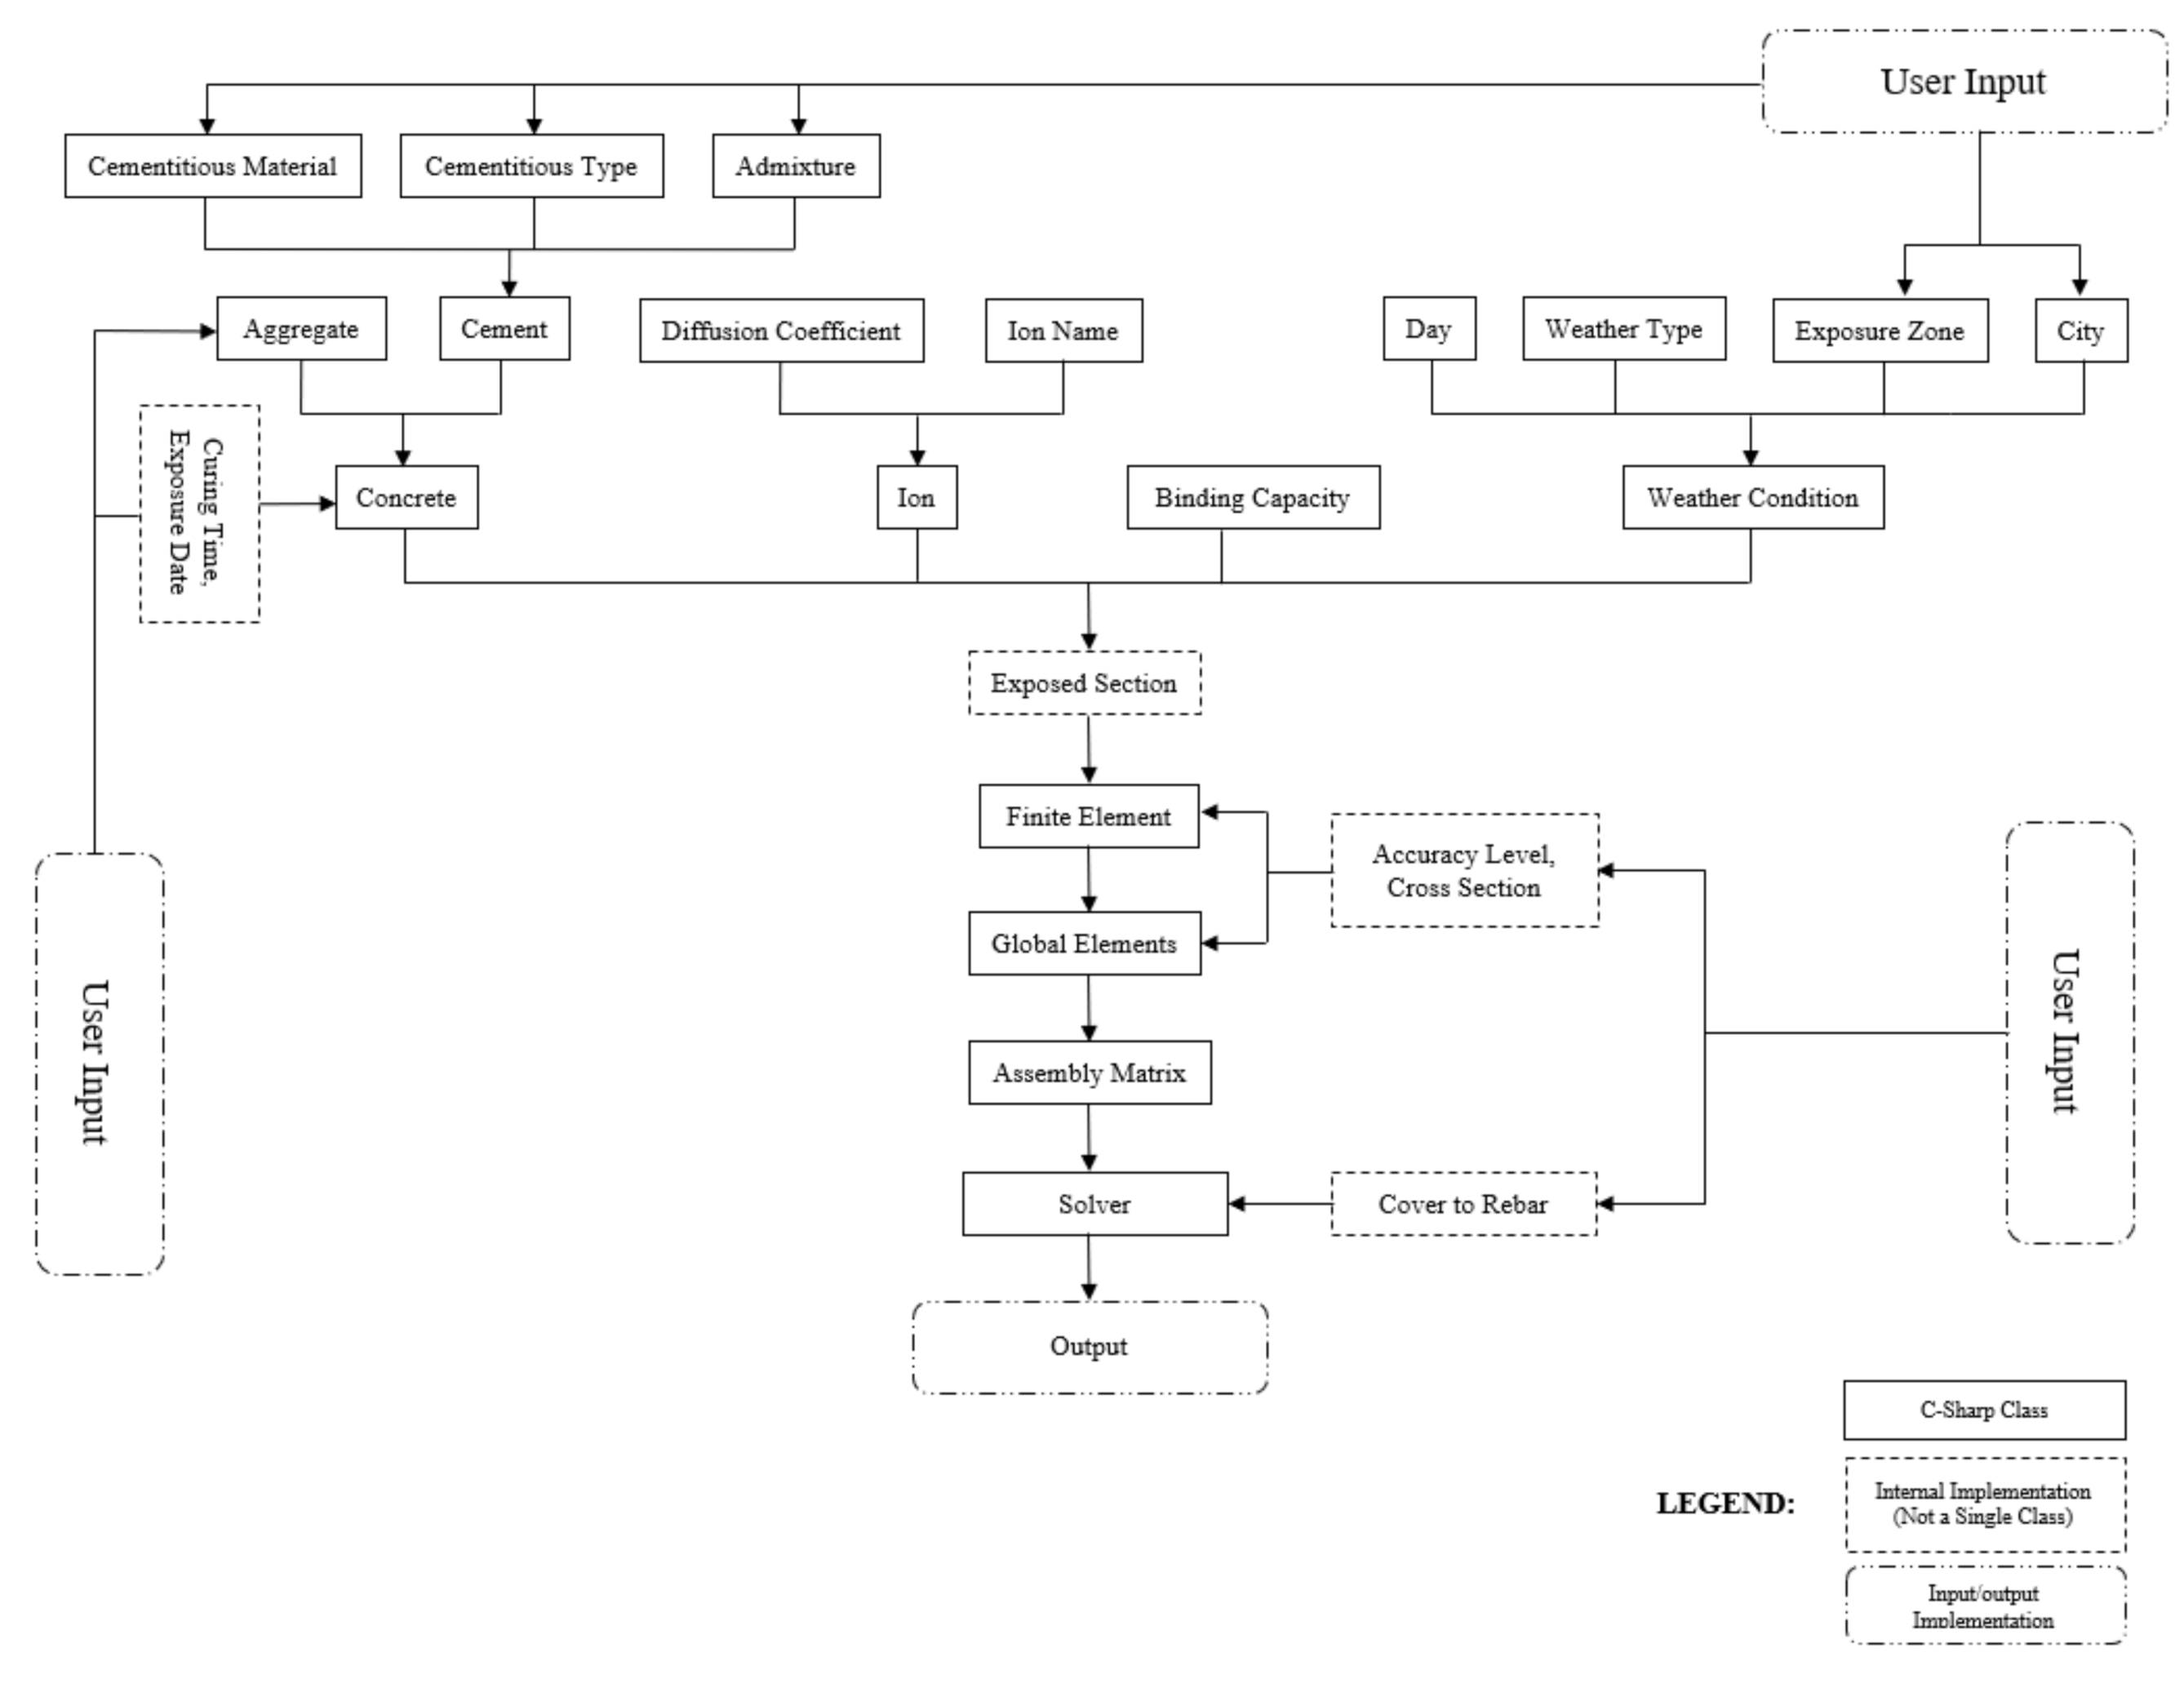
5. Software Implementation

The finite element formulation derived in the previous section was developed into programming code using C-Sharp programming language. The developed software is an object-oriented program that utilizes “classes” to achieve the objective. Figure 11 shows the high-level diagram of the classes utilized in the software. The Exposed Cross Section comprised implementation of various other classes including Concrete, Cement, Binding Capacity, Ion, and Weather Condition. Numerical solution code was implemented using the Assembly Matrices of the Finite Elements of the Exposed Concrete Section by taking the Accuracy Level specified by the user (number of nodes in a Cross-Section) into account.

5.1. Development of GUI

In order to implement the code for practical purpose, various inputs relating to the weather condition, concrete composition, and cross-section must be retrieved from the user. A web-based interface designed for this purpose will be described in this section.

5.1.1. Weather Condition Details

The modeling engine is equipped with weather data for three cities, namely: Dammam, Dhahran, and Jeddah in Saudi Arabia. The data contains temperature and humidity values for the cities for previous years. An algorithm was written to enable extrapolation to future years using the previous years’ weather data. A user will choose the city of interest and the exposure zone, whether tidal or splash, using the interface.

5.1.2. Reinforced Concrete Properties and Member Geometric Details

Reinforced concrete properties, including water/cement ratio, cement type, cementitious material type and ratio, admixture type and ratio, aggregate type and content, as well as concrete curing time and exposure date are collected from the user using the interface. The interface is also used to gather data relating to the geometric properties of the exposed reinforced concrete, including the concrete member cross-sectional area and cover to reinforcement.

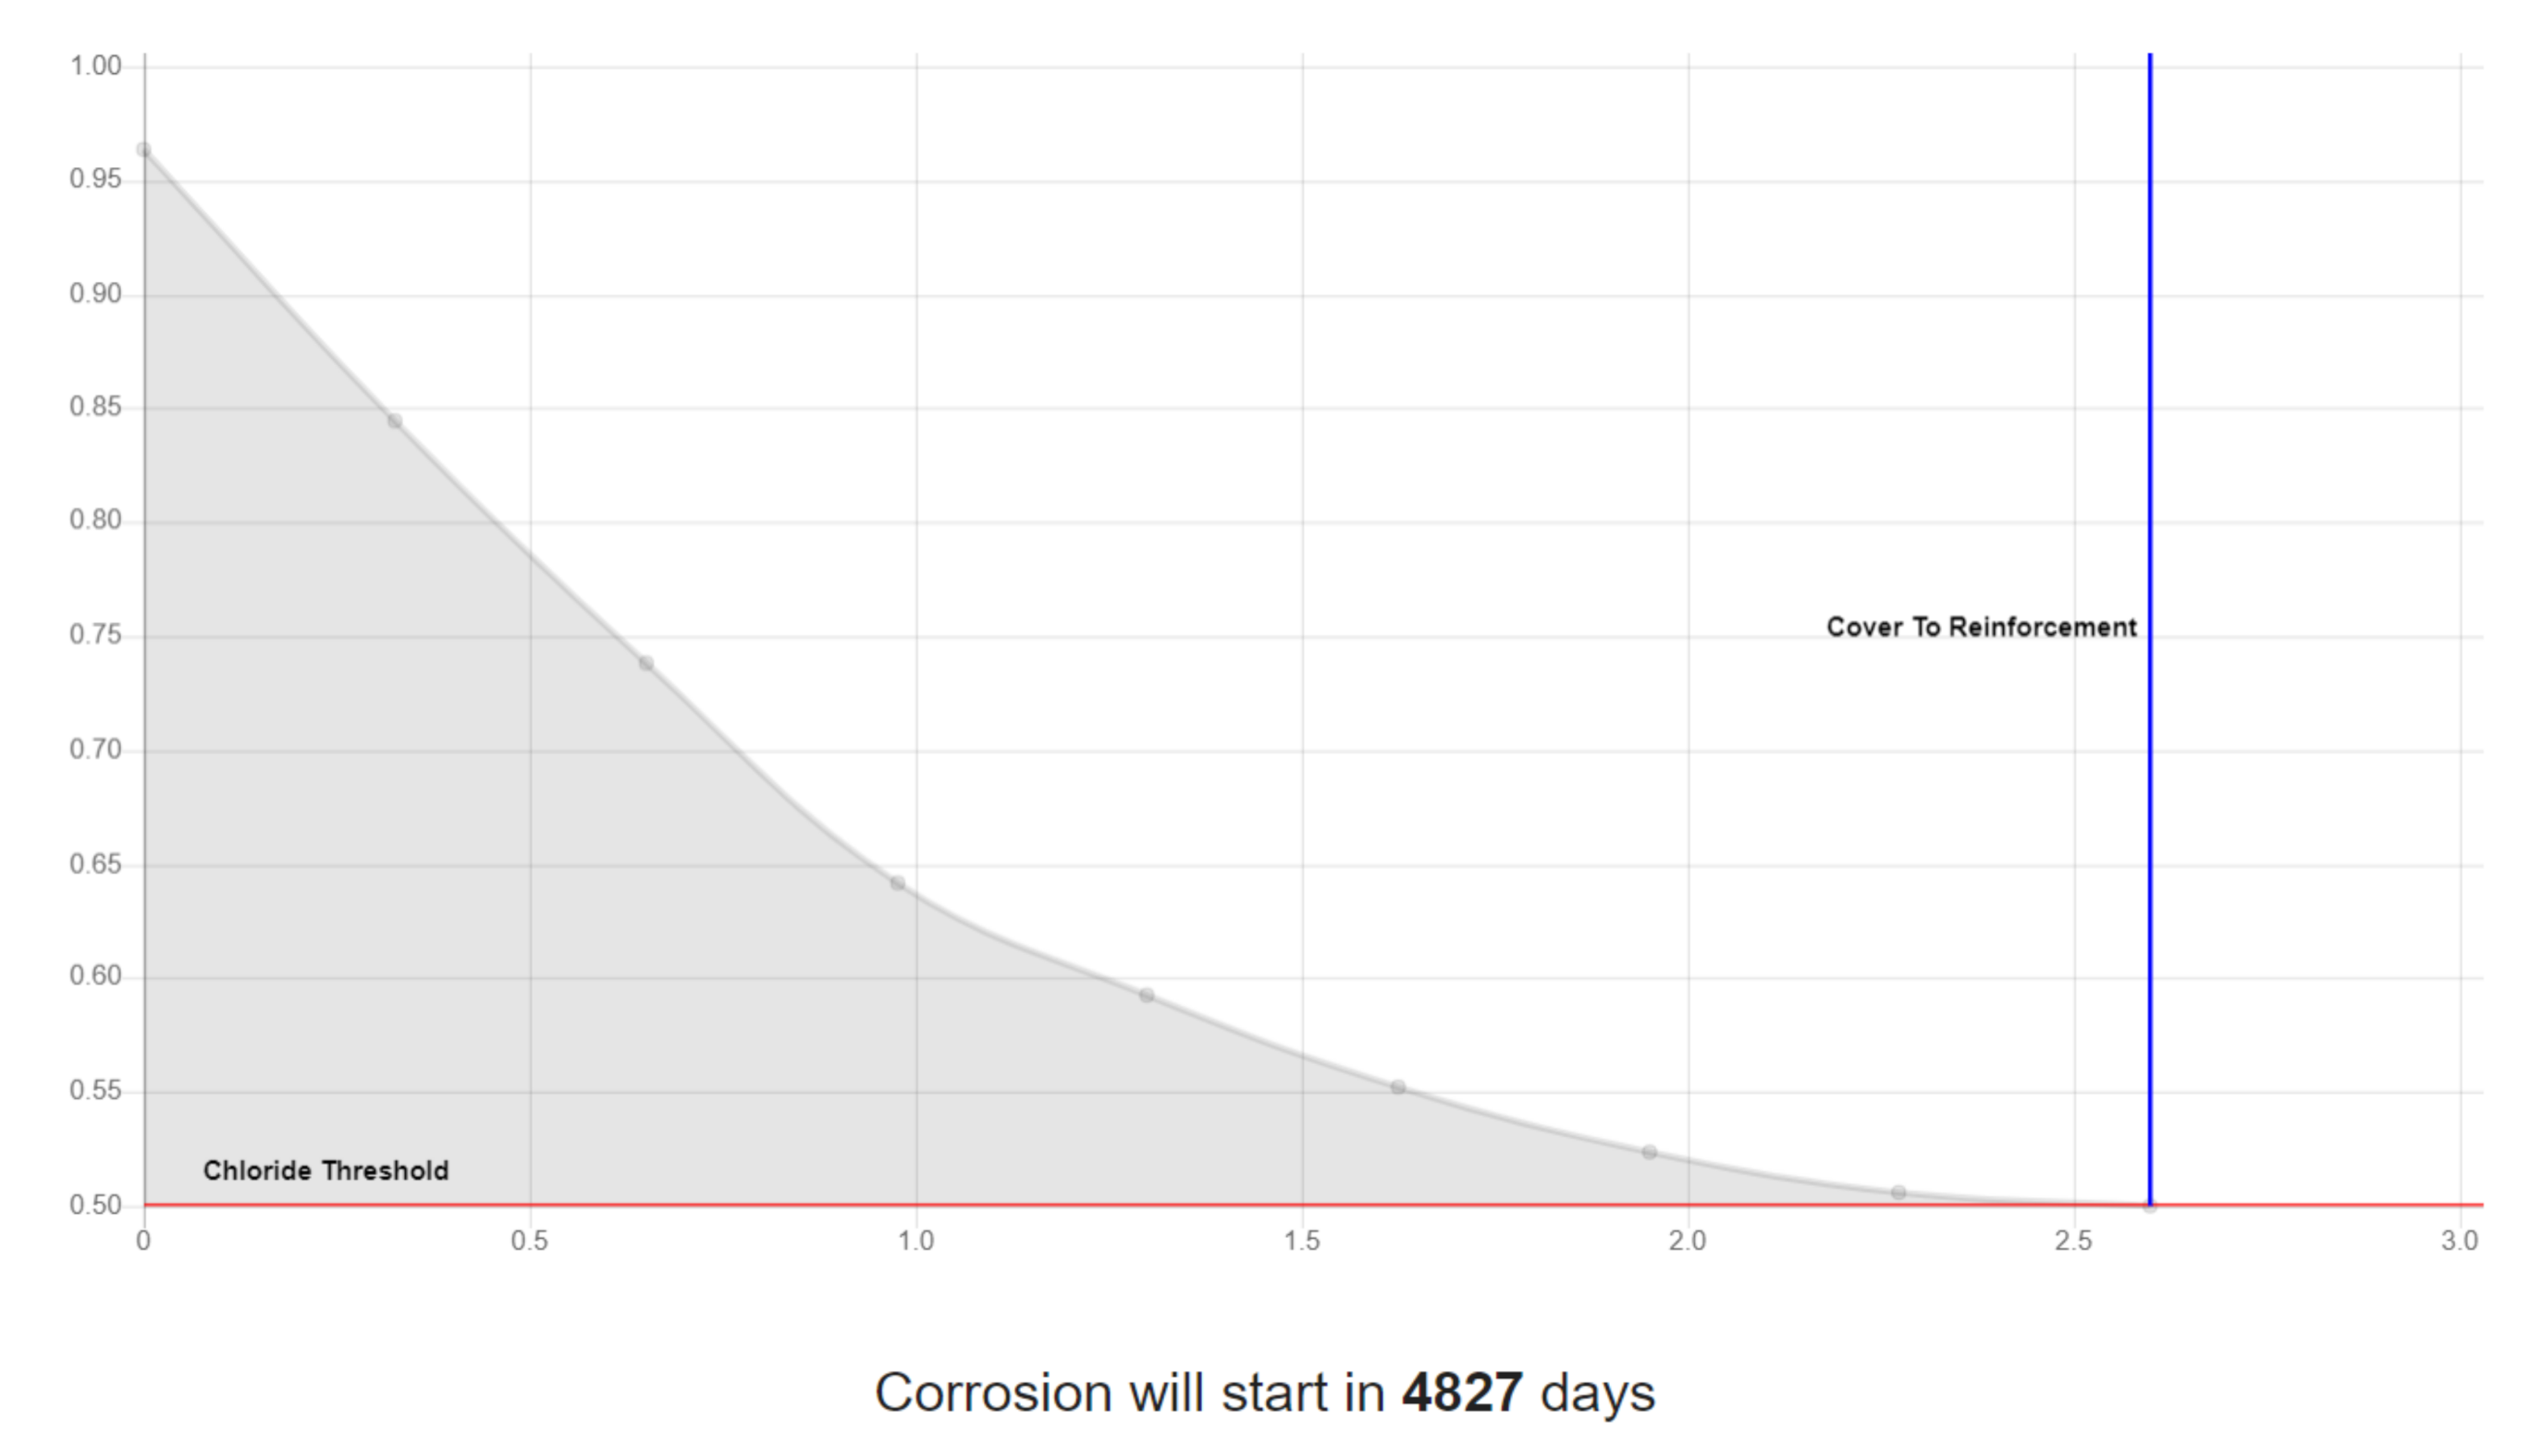
5.2. Modeling Outputs

The details collected from the user through the interfaces described in the previous section were utilized for the modeling since all the parameters are embedded in the ionic diffusion model described in the previous section. The output of the calculation is the chloride ion concentration at various depths from the member surface to the top of the reinforcement in the concrete member. From Equation (5), it is obvious that the diffusion model is time dependent, and hence, the calculation will continue in time until a specified chloride threshold is attained at which point the calculation will stop. The chloride concentration at this point in time will then be saved together with the total period (in days) before the chloride threshold is reached (known as corrosion initiation time) in the reinforced concrete member. Chloride ion threshold in reinforced concrete member varies depending on the code of practice being adopted. ACI specifies a chloride threshold of 0.5% by weight of concrete member being analyzed. This value was utilized in the current model to produce results similar to Figure 12.

6. Conclusions

This paper develops a new model for predicting the effective concrete diffusivity which uses the apparent diffusion along with binding, age, temperature, carbonation, and free chloride effects. Then, the paper develops an algorithm to predict the free chloride concentration at different depths in the concrete. Different OPC and SCMs mixes prepared in the lab determined the experimental binding values which are used in the algorithm. Chloride profiles were measured on two sets of concrete blocks: one exposed daily to seawater, and the other exposed to harsh weather along the coast for two years at the east coast of Saudi Arabia. The proposed transport model proves reliability by comparing its results to the exposure site results. To completely decouple the transport model from any experimental values, the paper introduces a new binding model which relies on the oxides of cements and level of chlorides. The binding model introduces itself in the transport model, and the results compare well to the exposure site results, and the results of the transport model which uses the experimental binding data. The following remarks conclude the work:
A reliable value of the effective diffusion coefficient is developed from the apparent diffusion coefficient by considering the binding capacity of concrete and other environmental impacts. The effective diffusivity decouples the impact of different environmental impact and embeds their effects in its calibration at each step of solution.
A reliable FEM transport model is developed to predict chlorides concentrations for concrete in tidal and harsh environments. The model uses solely calibrated diffusion coefficient and binding data in Fick’s law, and produces accurate results. Hence, the other terms in the transport laws, such as chemical activities and electrical flux, might not be valuable to the solution because the expected refinement against time of processing is marginal.
The transport model predicts the chloride profile effectively using the new proposed binding model. Statistical analysis evidence the accuracy of the proposed model, using experimental binding data, by recording β-coefficient and R2 of 1.00 and 0.94 for coastal zone, and 0.89 and 0.89 for tidal zone; while when using the new binding model, statistical analysis show β-coefficient and R2 of 0.9 and 0.93 for coastal zone, and 0.87 and 0.83 for tidal zone.

Author Contributions

Methodology, Project administration, Supervision; Validation, Resources, Writing—Review & editing, A.A.E.F.; Methodology, Software implementation Writing—original draft, M.O.A. All authors have read and agreed to the published version of the manuscript.

Funding

This research is funded by the Deanship of Scientific Research (DSR) at King Fahd University of Petroleum and Minerals (KFUPM) through project no. IN161050.

Acknowledgments

The authors acknowledge the support provided by the Deanship of Scientific Research (DSR) at King Fahd University of Petroleum and Minerals (KFUPM) for funding this work through project no. IN161050.

Conflicts of Interest

The authors declare no conflict of interest.

References

  1. Luping, T.; Nilsson, L.-O.; Basheer, P.A.M. Resistance of Concrete to Chloride Ingress, 1st ed.; Spon Press: London, UK, 2012. [Google Scholar]
  2. Bernal, J.; Fenaux, M.; Moragues, A.; Reyes, E.; Gálvez, J.C. Study of chloride penetration in concretes exposed to high-mountain weather conditions with presence of deicing salts. Constr. Build. Mater. 2016, 127, 971–983. [Google Scholar] [CrossRef]
  3. Kirkpatrick, T.J.; Weyers, R.E.; Anderson-Cook, C.M.; Sprinkel, M.M. Probabilistic model for the chloride-induced corrosion service life of bridge decks. Cem. Concr. Res. 2002, 32, 1943–1960. [Google Scholar] [CrossRef]
  4. Guzmán, S.; Gálvez, J.C.; Sancho, J.M. Modelling of chloride ingress into concrete through a single-ion approach: Application to an idealized surface crack pattern. Int. J. Numer. Anal. Methods Geomech. 2014, 38, 1683–1706. [Google Scholar] [CrossRef]
  5. Ababneh, A.; Xi, Y. An experimental study on the effect of chloride penetration on moisture diffusion in concrete. Mater. Struct. 2002, 35, 659–663. [Google Scholar] [CrossRef]
  6. Ababneh, A.; Benboudjema, F.; Xi, Y. Chloride penetration in Nonsaturated concrete. J. Mater. Civ. Eng. 2003, 15, 183–191. [Google Scholar] [CrossRef]
  7. Liu, J.; Liu, J.; Huang, Z.; Zhu, J.; Liu, W.; Zhang, W. Effect of Fly Ash as Cement Replacement on Chloride Diffusion, Chloride Binding Capacity, and Micro-Properties of Concrete in a Water Soaking Environment. Appl. Sci. 2020, 10, 6271. [Google Scholar] [CrossRef]
  8. Lee, T.; Lee, J. Evaluation of chloride resistance of early-strength concrete using blended binder and polycarboxylate-based chemical admixture. Appl. Sci. Switz. 2002, 10, 2972–2974. [Google Scholar] [CrossRef]
  9. Zhang, J.; Zhou, X.Z.; Zheng, J.J.; Ye, H.L.; Yang, J. Experimental investigation and analytical modeling of chloride diffusivity of fly ash concrete. Materials 2020, 13, 862. [Google Scholar] [CrossRef] [Green Version]
  10. Xi, Y.; Bažant, Z.P. Modeling Chloride Penetration in Saturated Concrete. J. Mater. Civ. Eng. 1999, 11, 58–65. [Google Scholar] [CrossRef]
  11. Samson, E.; Marchand, J.; Snyder, K.A.; Beaudoin, J.J. Modeling ion and fluid transport in unsaturated cement systems in isothermal conditions. Cem. Concr. Res. 2005, 35, 141–153. [Google Scholar] [CrossRef] [Green Version]
  12. Samson, E.; Marchand, J. Modeling the transport of ions in unsaturated cement-based materials. Comput. Struct. 2007, 85, 1740–1756. [Google Scholar] [CrossRef]
  13. Nguyen, T.Q.; Petković, J.; Dangla, P.; Baroghel-Bouny, V. Modelling of coupled ion and moisture transport in porous building materials. Constr. Build. Mater. 2008, 22, 2185–2195. [Google Scholar] [CrossRef]
  14. Saetta, A.V.; Scotta, R.V.; Vitaliani, R.V. Analysis of chloride diffusion into partially saturated concrete. ACI Mater. J. 1993, 90, 441–451. [Google Scholar]
  15. Samson, E.; Marchand, J. Numerical Solution of the Extended Nernst-Planck Model. J. Colloid Interface Sci. 1999, 215, 1–8. [Google Scholar] [CrossRef]
  16. Fenaux, M.; Reyes, E.; Gálvez, J.C.; Moragues, A. Modelling the transport of chloride and other ions in cement-based materials. Cem. Concr. Compos. 2019, 97, 33–42. [Google Scholar] [CrossRef]
  17. Luping, T.; Nilsson, L.O. Chloride Binding Capacity, Penetration and Pore Structures of Blended Cement Pastes with Slag and Fly Ash. In Proceedings of the Blended Cement in Construction, International Conference, University of Sheffield, Sheffield, UK, 9–12 September 1991. [Google Scholar]
  18. Tuutti, K. Corrosion of Steel in Concrete; Swedish Cement and Concrete Research Institute: Stockholm, Sweden, 1982. [Google Scholar]
  19. Blunk, G.; Gunkel, P.; Smolczyk, H.G. On the distribution of chloride between the hardening cement paste and its por solution. In Proceedings of the 8th International Congress on the Chemistry of Cement, Rio de Janeiro, Brazil, 22–27 September 1986; pp. 85–89. [Google Scholar]
  20. Tritthart, J. Chloride binding in cement I. Investigations to determine the composition of porewater in hardened cement. Cem. Concr. Res. 1989, 19, 586–594. [Google Scholar] [CrossRef]
  21. Tritthart, J. Chloride binding in cement II. The influence of the hydroxide concentration in the pore solution of hardened cement paste on chloride binding. Cem. Concr. Res. 1989, 19, 683–691. [Google Scholar] [CrossRef]
  22. Luping, T.; Nilsson, L.-O. Chloride binding capacity and binding isotherms of OPC pastes and mortars. Cem. Concr. Res. 1993, 23, 247–253. [Google Scholar] [CrossRef]
  23. Samson, E.; Lemaire, G.; Marchand, J.; Beaudoin, J.J. Modeling chemical activity effects in strong ionic solutions. Comput. Mater. Sci. 1999, 15, 285–294. [Google Scholar] [CrossRef]
  24. Pradelle, S.; Thiéry, M.; Baroghel-Bouny, V. Comparison of existing chloride ingress models within concretes exposed to seawater. Mater. Struct. Mater. Constr. 2016, 49, 4497–4516. [Google Scholar] [CrossRef] [Green Version]
  25. Riding, K.A.; Thomas, M.D.; Folliard, K.J. Apparent diffusivity model for concrete containing supplementary cementitious materials. ACI Mater. J. 2013, 110, 705–714. [Google Scholar]
  26. Abd El Fattah, A.; Al-Duais, I.; Riding, K.; Thomas, M.; Al-Dulaijan, S. Field Validation of Concrete Transport Property Measurement Methods. Materials 2020, 13, 1166. [Google Scholar] [CrossRef] [PubMed] [Green Version]
  27. Abd El Fattah, A.; Al-Duais, I.; Riding, K.; Thomas, M. Field evaluation of corrosion mitigation on reinforced concrete in marine exposure conditions. Constr. Build. Mater. 2018, 165, 663–674. [Google Scholar] [CrossRef]
  28. ASTM. Standard C150, 2020, Standard Specification for Portland Cement; ASTM International: West Conshohocken, PA, USA, 2020; Available online: https://www.astm.org/ (accessed on 10 September 2020).
  29. ASTM. Standard C1240, 2020, Standard Specification for Silica Fume Used in Cementitious Mixtures; ASTM International: West Conshohocken, PA, USA, 2020; Available online: https://www.astm.org/ (accessed on 10 September 2020).
  30. ASTM. Standard C618, 2019, Standard Specification for Coal Fly Ash and Raw or Calcined Natural Pozzolan for Use in Concrete; ASTM International: West Conshohocken, PA, USA, 2019; Available online: https://www.astm.org/ (accessed on 7 September 2020).
  31. ASTM. Standard C989, 2018, Standard Specification for Slag Cement for Use in Concrete and Mortars; ASTM International: West Conshohocken, PA, USA, 2018; Available online: https://www.astm.org/ (accessed on 7 September 2020).
  32. Thomas, M.D.; Scott, A.; Bremner, T.; Bilodeau, A.; Day, D. Performance of slag concrete in marine environment. ACI Mater. J. 2008, 105, 628. [Google Scholar]
  33. GAMRY. Referene 3000 Potentiostat. GAMRY Webpage. Available online: https://www.gamry.com/potentiostats/reference-3000/ (accessed on 12 September 2020).
  34. ASTM. Standard C1556, 2016 Standard Test Method for Determining the Apparent Chloride Diffusion Coefficient of Cementitious Mixtures by Bulk Diffusion; ASTM International: West Conshohocken, PA, USA, 2016; Available online: https://www.astm.org/ (accessed on 10 September 2020).
  35. Ngala, V.T.; Page, C.L. Effects of Carbonation on Pore Structure and Diffusional Properties of Hydrated Cem. Pastes 1997, 27, 995–1007. [Google Scholar]
  36. Moffatt, E.T.G.; Thomas, M.D. Effect of Carbonation on the Durability and Mechanical Performance of Ettringite-Based Binders. ACI Mater. J. 2019, 116. [Google Scholar] [CrossRef]
  37. Mangat, P.S.; Molloy, B.T. Prediction of long term chloride concentration in concrete. Mater. Struct. 1994, 27, 338–346. [Google Scholar] [CrossRef]
  38. Bamforth, P.B. CONCRETE DURABILIITY BY DESIGN: Limitations of the current prescriptive approach and alternative methods for durability design. In Proceedings of the NZ Concrete Society Conference, Taupo, New Zealand, 4–6 October 2002. [Google Scholar]
  39. Maage, M.; Helland, S.; Carlsen, J.E. Practical non-steady state chloride transport as a part of a model for predicting the initiation period. In Proceedings of the RILEM International Workshop on Chloride Penetration into Concrete, Saint-Rémy-lès-Chevreuse, France, 15–18 October 1995; pp. 398–406. [Google Scholar]
  40. Thomas, M.D.A.; Bamforth, P.B. Modelling chloride diffusion in concrete effect of fly ash and slag. Cem. Concr. Res. 1999, 29, 487–495. [Google Scholar] [CrossRef]
  41. Ehlen, M.; Thomas, M.D.; Bentz, E.C. Life-365 Service Life Prediction Model. Concr. Int. 2009, 31, 41–46. [Google Scholar]
  42. Thomas, M.D.A.; Hooton, R.D.; Scott, A.; Zibara, H. The effect of supplementary cementitious materials on chloride binding in hardened cement paste. Cem. Concr. Res. 2012, 42, 1–7. [Google Scholar] [CrossRef]
  43. Zibara, H. Binding of External Chlorides by Cement Pastes; University of Toronto: Toronto, ON, Canada, 2001. [Google Scholar]
  44. Delagrave, A.; Marchand, J.; Ollivier, J.; Julien, S.; Hazrati, K. Chloride Binding Capacity of Various Hydrated Cement Paste Systems. Adv. Cem. Based Mater. 1997, 6, 28–35. [Google Scholar] [CrossRef]
  45. Guo, Y.; Zhang, T.; Tian, W.; Wei, J.; Yu, Q. Physically and chemically bound chlorides in hydrated cement pastes: A comparison study of the effects of silica fume and metakaolin. J. Mater. Sci. 2019, 54, 2152–2169. [Google Scholar] [CrossRef]
  46. Saillio, M.; Baroghel-Bouny, V.; Barberon, F. Chloride binding in sound and carbonated cementitious materials with various types of binder. Constr. Build. Mater. 2014, 68, 82–91. [Google Scholar] [CrossRef]
  47. Ogirigbo, O.R.; Black, L. Chloride binding and diffusion in slag blends: Influence of slag composition and temperature. Constr. Build. Mater. 2017, 149, 816–825. [Google Scholar] [CrossRef]
  48. Saillio, M.; Baroghel-Bouny, V.; Pradelle, S. Effect of carbonation and sulphate on chloride ingress in cement pastes and concretes with supplementary cementitious materials. In Proceedings of the 8th International Conference on Concrete under Severe Conditions–Environment and Loading, Lecco, Italy, 12–14 September 2016; Volume 711, pp. 241–248. [Google Scholar]
  49. Song, H.W.; Lee, C.H.; Jung, M.S.; Ann, K.Y. Development of chloride binding capacity in cement pastes and influence of the pH of hydration products. Can. J. Civ. Eng. 2008, 35, 1427–1434. [Google Scholar] [CrossRef]
  50. Yang, Z.; Gao, Y.; Mu, S.; Chang, H.; Sun, W.; Jiang, J. Improving the chloride binding capacity of cement paste by adding nano-Al2O3. Constr. Build. Mater. 2019, 195, 415–422. [Google Scholar] [CrossRef]
  51. Ann, K.Y.; Hong, S.I. Modeling chloride transport in concrete at pore and chloride binding. ACI Mater. J. 2018, 115, 595–604. [Google Scholar] [CrossRef]
  52. Jung, M.S.; Kim, K.B.; Lee, S.A.; Ann, K.Y. Risk of chloride-induced corrosion of steel in SF concrete exposed to a chloride-bearing environment. Constr. Build. Mater. 2018, 166, 413–422. [Google Scholar] [CrossRef]
  53. Ann, K.Y.; Kim, T.S.; Kim, J.H.; Kim, S.H. The resistance of high alumina cement against corrosion of steel in concrete. Constr. Build. Mater. 2010, 24, 1502–1510. [Google Scholar] [CrossRef]
  54. Ramírez-Ortíz, A.E.; Castellanos, F.; de Cano-Barrita, P.F. Ultrasonic Detection of Chloride Ions and Chloride Binding in Portland Cement Pastes. Int. J. Concr. Struct. Mater. 2018, 12, 20. [Google Scholar] [CrossRef]
  55. Wang, Y.; Shui, Z.; Gao, X.; Yu, R.; Huang, Y.; Cheng, S. Understanding the chloride binding and diffusion behaviors of marine concrete based on Portland limestone cement-alumina enriched pozzolans. Constr. Build. Mater. 2019, 198, 207–217. [Google Scholar] [CrossRef]
  56. Qiao, C.; Suraneni, P.; Ying, T.N.W.; Choudhary, A.; Weiss, J. Chloride binding of cement pastes with fly ash exposed to CaCl2 solutions at 5 and 23 °C. Cem. Concr. Compos. 2019, 97, 43–53. [Google Scholar] [CrossRef]
  57. Freundlich, H. Kapillarchemie: Eine Darstellung der Chemie der Kolloide und verwandter Gebiete; Akademische Verlagsgesellschaf: Leipzig, Germanny, 1909. [Google Scholar]
  58. Lee, J.S.; Ray, R.I.; Little, B.J. Comparison of Key West and Persian Gulf Seawaters. In Proceedings of the NACE–International Corrosion Conference Series, Nashville, TN, USA, 11–15 March 2007. [Google Scholar]
  59. Liu, Q.F.; Hu, Z.; Y, X.L.; Yang, J.; Azim, I.; Sun, W. Prediction of chloride distribution for offshore concrete based on statistical analysis. Materials 2020, 13, 174. [Google Scholar] [CrossRef] [PubMed] [Green Version]
Figure 1. Concrete blocks setup in the tidal zone (inner blocks: reinforced; outer blocks: plain).
Crystals 10 00967 g001
Figure 2. Concrete blocks setup in the coastal zone, with the proper bracing on top and isolation from sand.
Crystals 10 00967 g002
Figure 3. Relationship between bound and free chloride for concrete with different Al2O3 content.
Crystals 10 00967 g003
Figure 4. Linear regression analysis of the proposed binding model versus experimental results in the literature.
Crystals 10 00967 g004
Figure 5. Chloride profiles for mixes in the coastal zone using the experimental binding results. (a) concrete with 100% ordinary Portland cement (OPC), (b) concrete with 100% type V cement (Sulfate resistance), (c) concrete with 6% silica fumes and 94% OPC, (d) concrete with 25% fly ash and 75% OPC, (e) concrete with 70% slag cement and 30% OPC.
Crystals 10 00967 g005
Figure 6. Chloride profiles for mixes in the tidal zone using the experimental binding results. (a) concrete with 100% ordinary Portland cement (OPC), (b) concrete with 100% type V cement (Sulfate resistance), (c) concrete with 6% silica fumes and 94% OPC, (d) concrete with 25% fly ash and 75% OPC, (e) concrete with 70% slag cement and 30% OPC.
Crystals 10 00967 g006
Figure 7. Regression analysis of the theoretical results of the transport model against experimental results. (a) Results from blocks located in coastal zone, (b) Results from blocks located in tidal zone.
Crystals 10 00967 g007
Figure 8. Chloride profiles for mixes in the coastal zone using the new binding model. (a) concrete with 100% ordinary Portland cement (OPC), (b) concrete with 100% type V cement (Sulfate resistance), (c) concrete with 6% silica fumes and 94% OPC, (d) concrete with 25% fly ash and 75% OPC, (e) concrete with 70% slag cement and 30% OPC.
Crystals 10 00967 g008
Figure 9. Chloride profiles for mixes in the tidal zone using the new binding model. (a) concrete with 100% ordinary Portland cement (OPC), (b) concrete with 100% type V cement (Sulfate resistance), (c) concrete with 6% silica fumes and 94% OPC, (d) concrete with 25% fly ash and 75% OPC, (e) concrete with 70% slag cement and 30% OPC.
Crystals 10 00967 g009
Figure 10. Regression analysis of the theoretical results of the transport model using the new binding model against experimental results. (a) Results from blocks located in coastal zone, (b) Results from blocks located in tidal zone.
Crystals 10 00967 g010
Figure 11. Class diagram/software implementation flowchart.
Crystals 10 00967 g011
Figure 12. Typical modeling results of chloride profile and duration to corrosion initiation.
Crystals 10 00967 g012
Table 1. Mix proportioning.
MixW/CCement kg/m3Coarse Aggregate kg/m3Sand kg/m3Water kg/m3Silica Fume kg/m3Fly Ash kg/m3Slag Cement kg/m3Notes
I0.43401070775136---Type OP/CEM 1
V3401070775136---Type V
SF320110073513621--OP + SF
FA2551090735136-85-OP + FA
SC1001095735136--240OP + SC
Table 2. Statistical analysis results.
Coastal
6 Months 12 Months 24 Months
β-Coefficient R2β-Coefficient R2β-Coefficient R2
Mix 10.6930.9180.7130.9690.9280.988
Mix 20.7370.9900.9050.9960.9370.994
Mix 30.9790.9140.8160.9680.9680.989
Mix 40.7010.9920.8370.9910.9410.996
Mix 50.7140.8500.7760.9900.9620.980
Tidal
6 Months12 Months24 Months
β-CoefficientR2β-CoefficientR2β-CoefficientR2
Mix 10.7890.9740.8060.9830.8950.972
Mix 20.6120.9570.8510.9850.9200.988
Mix 30.8640.9780.9590.9780.9650.980
Mix 40.6500.9780.7250.9940.7790.966
Mix 50.7580.9550.7950.9650.7610.907
Publisher’s Note: MDPI stays neutral with regard to jurisdictional claims in published maps and institutional affiliations.

