Article

Influence of Al and N Content and Cooling Rate on the Characteristics of Complex MnS Inclusions in AHSS

Department of Material Science and Engineering, Faculty of Engineering, McMaster University, 1280 Main Street West, Hamilton, ON L8S 4L7, Canada
*
Author to whom correspondence should be addressed.
Crystals 2020, 10(11), 1054; https://doi.org/10.3390/cryst10111054
Submission received: 18 October 2020 / Revised: 16 November 2020 / Accepted: 17 November 2020 / Published: 19 November 2020
(This article belongs to the Special Issue Liquid Steel Alloying Process)

Abstract

:
This study focused on the characteristics of complex MnS inclusions in advanced high strength steels. The effect of metal chemistry (Al and N) and the cooling rate of steel were evaluated by analyzing the inclusions present in five laboratory produced steels. The observed complex MnS inclusions contained Al2O3-MnS, AlN-MnS, and AlON-MnS. An increase in Al content from 0.5% to 6% increased the number of complex MnS inclusions by ~4 times. In comparison, a decrease of ~80% was observed due to the increased N content of steel from <10 ppm to ~50 ppm. MnS precipitation ratio was used to determine the potency of different inclusions forming complex MnS inclusions due to heterogeneous nucleation. It was found that the MnS precipitation ratio of the observed inclusions was related to their misfit with MnS, and it decreased in the order of AlN > AlON > Al2O3. Moreover, it was determined that AlN particles could be easily engulfed at the solidification front relative to Al2O3, which resulted in a higher MnS precipitation ratio for Al2O3 under slow cooling conditions.

Graphical Abstract

1. Introduction

An excellent combination of high strength, high toughness, and lightweight of advanced high strength steels (AHSS) makes them suitable for various applications. AHSS contain high concentrations of alloying elements such as Mn, Al, and Si. Therefore, these steels are likely to have a large number of inclusions having a range of compositions. There has been thorough research on the microstructure and mechanical properties of AHSS [1,2,3,4,5,6,7,8], while knowledge related to non-metallic inclusions in AHSS is still limited. Previous studies [9,10,11,12,13,14,15] on non-metallic inclusions have identified the primary type of inclusions as MnS, Al2O3, and AlN. The presence of Al2O3-MnO is also reported. In addition, a considerable amount of multiphase inclusions (complex), such as Al2O3-MnS, AlN-MnS, AlON, and AlON-MnS, has been observed.
During cooling of liquid steel, MnS precipitates on the existing inclusions resulting in the formation of complex MnS inclusions. In AHSS, these complex inclusions include Al2O3-MnS, AlN-MnS, and AlON-MnS. Park et al. [9] reported that in Fe-10Mn-yAl (y = 1, 3, and 6) steels ~20% to 40% of the total inclusions were complex MnS. In the work of Gigacher et al. [15] ~42% of the inclusions observed in TWIP steel with 25% Mn were duplex inclusions containing MnS. Alba et al. [12] studied the characteristics of inclusions in Fe-xMn-3Al-3Si (x = 2,5 and 20) steels and found that the fraction of complex MnS inclusions increased from ~10% to over 70% with an increase in Mn content. The characteristics of complex MnS inclusions are related to the potency of different inclusion to serve as a nucleation site for MnS. In previous work, the authors [16] reported that the order of effectiveness of inclusions for the precipitation of MnS in AHSS is AlN > AlON > Al2O3.
The current work investigates the influence of Al and N contents of steel on the characteristics of complex MnS inclusions. Moreover, the effect of the cooling rate of steel samples is considered. For this purpose, Al content is varied from 0.5% to 6% (0.5, 1, 3, and 6) in Fe-5Mn-3Si-Al alloy, and samples from Fe-5Mn-3Si-3Al alloy containing different levels of N (<10 ppm to 54 ppm) are analyzed. Moreover, air cooled and furnace cooled samples obtained from these alloys are investigated to study the effect of cooling rate.

2. Materials and Methods

The experimental steels were produced in a vertical resistance tube furnace. The steels contain 0.5%, 1%, 3%, or 6% Al, 5% Mn, 3% Si, and 0.1% C. They are labeled based on their Mn, Al, and Si contents, i.e., 50.53, 513, 533, and 563. The reagents were melted in an alumina crucible at 1873 K under Ar atmosphere (5N purity). The Ar gas was passed through Ti turnings at 973 K to reduce oxygen from it. The molten steel was homogenized for 30 minutes, and then the system was evacuated and backfilled with Ar. Several quartz tube samples (Dia. = 5 mm, Length ≈ 8mm) were taken at different holding times and were air cooled (20–30 K/sec [17]). The remaining steel material (bulk steel) was cooled along with the furnace at a rate of 10 °C/min (0.167 K/sec). The remaining bulk steel had a diameter of 58 mm, and its height was 30 mm. In another experiment, N2 gas was introduced into a 533 steel. In this experiment (533N-P), the furnace chamber was evacuated at 1873 K, and then it was backfilled by purging a mixture of Ar and N2 gas (1:1). The mixing ratio was changed to Ar:N2 = 1:2 after 180 min of purging. Quartz tube samples were collected before and after purging the mixture of Ar and N2 gas.
Induction coupled plasma optical emission spectrometry (ICP-OES) was used to analyze the chemical composition of steel samples. The oxygen-nitrogen and carbon-sulfur contents of samples were measured by LECO O/N (ON736, LECO Co. St. Joseph, MI, USA) and LECO C/S (CS744, LECO Co. St. Joseph, MI, USA) analyzer, respectively. Both air cooled quartz tube samples and furnace cooled bulk steel samples were analyzed for inclusions by using Jeol 6610 (Jeol Co. Akishima, Tokyo, Japan) scanning electron microscope (SEM) equipped with the ASPEX inclusion analysis system. The inclusions having a maximum diameter (Dmax) > 2 µm were considered for analysis. A detailed description of experimental materials and procedure is presented elsewhere [18].

3. Results

An insignificant difference was observed in the chemical composition of all the samples taken during an experiment except 533N-P. A variation in the N content was observed in the samples of 533N-P due to the purging of N2 gas. The average composition of the air cooled samples obtained during an experiment is given in Table 1. For the case of 533N-P, three samples were selected to represent different N contents, which are low N, medium N, and high N. The low N, medium N, and high N samples were obtained before introducing N2 gas to the steel, 45 min, and 270 min after purging N2 gas to the steel, respectively. It can be seen in Table 1 that the N content of 50.53, 513, 533, and 563 steel samples fall in the low N category (<10 ppm). The detected values for total O content were scattered and less than 10 ppm, which is close to the detection threshold. Further, it is expected to have ± 2 ppm in the calibration of N and O analyses. Therefore, <10 ppm is used for representation. The composition of furnace cooled steel was similar to that of air cooled samples. In the case of 533N-P, the furnace cooled steel, and air cooled samples containing high N had a similar composition.

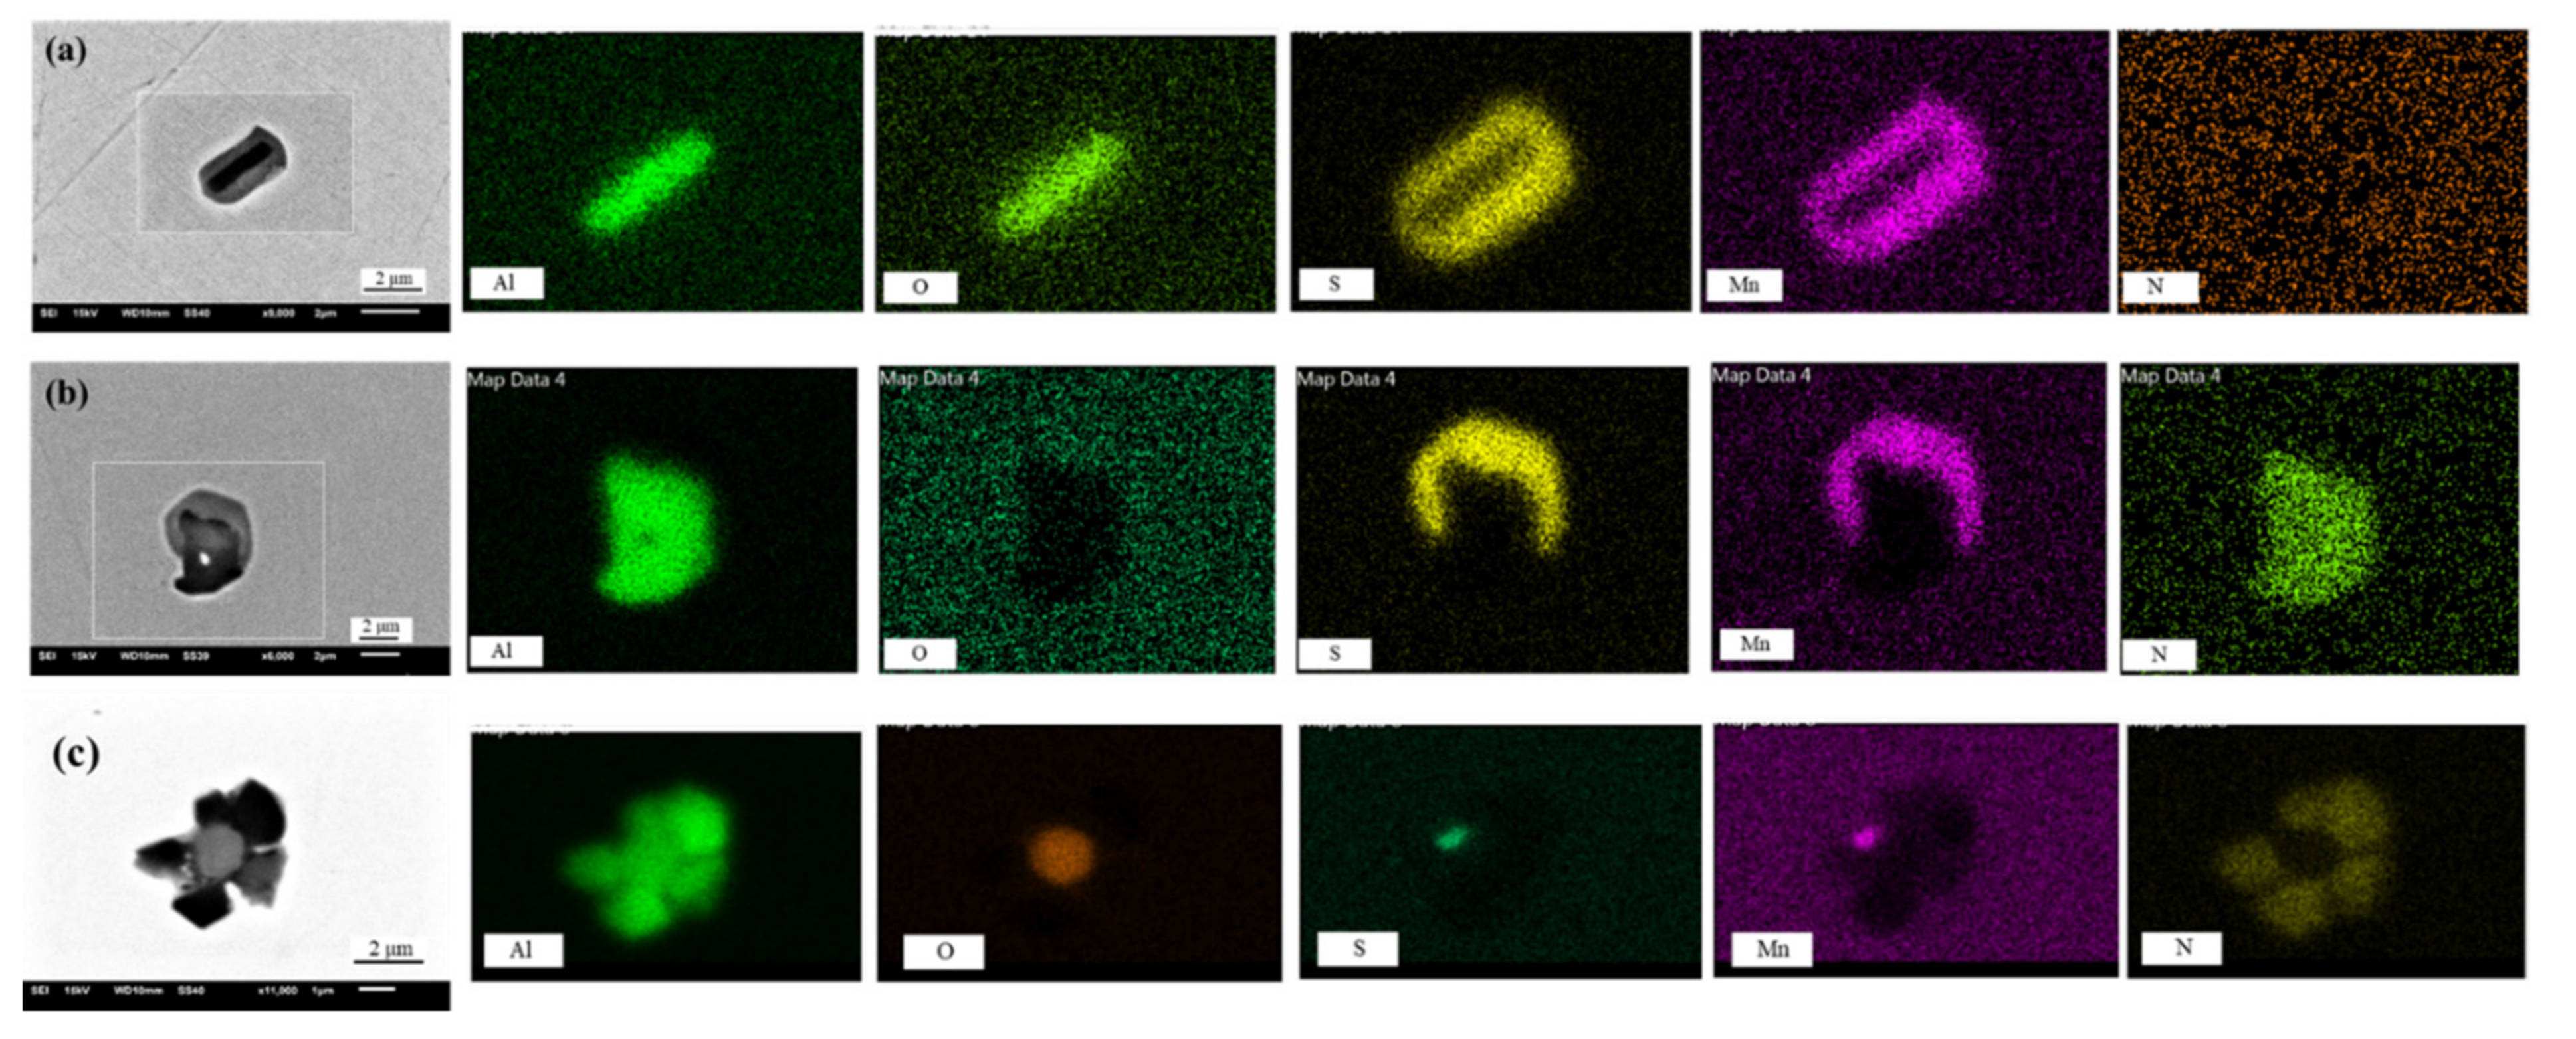
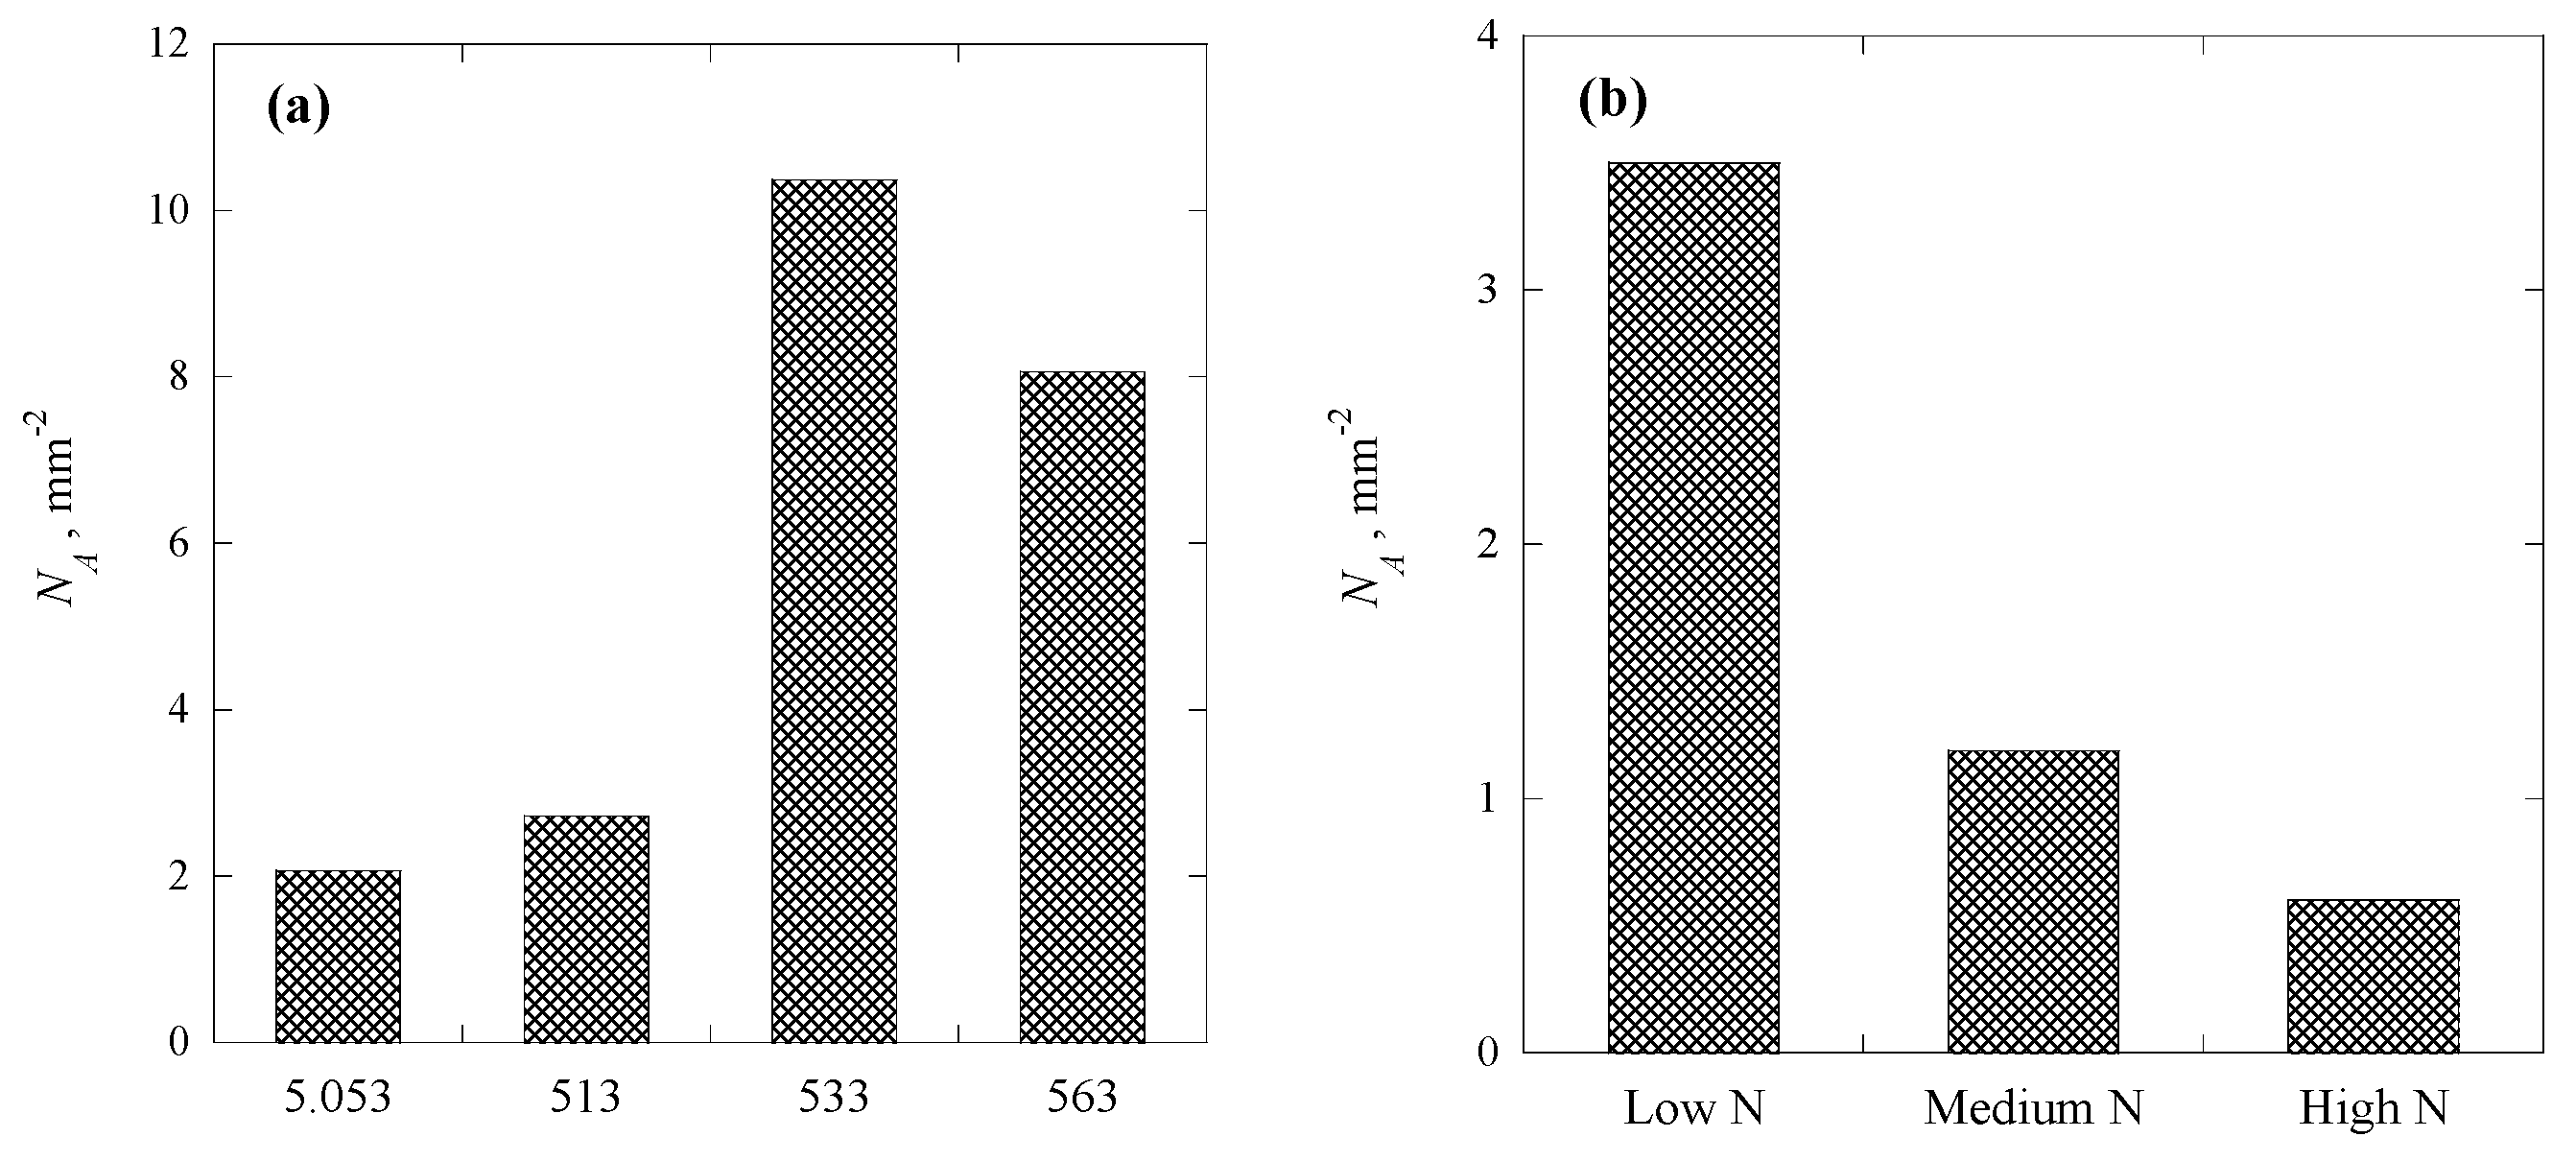
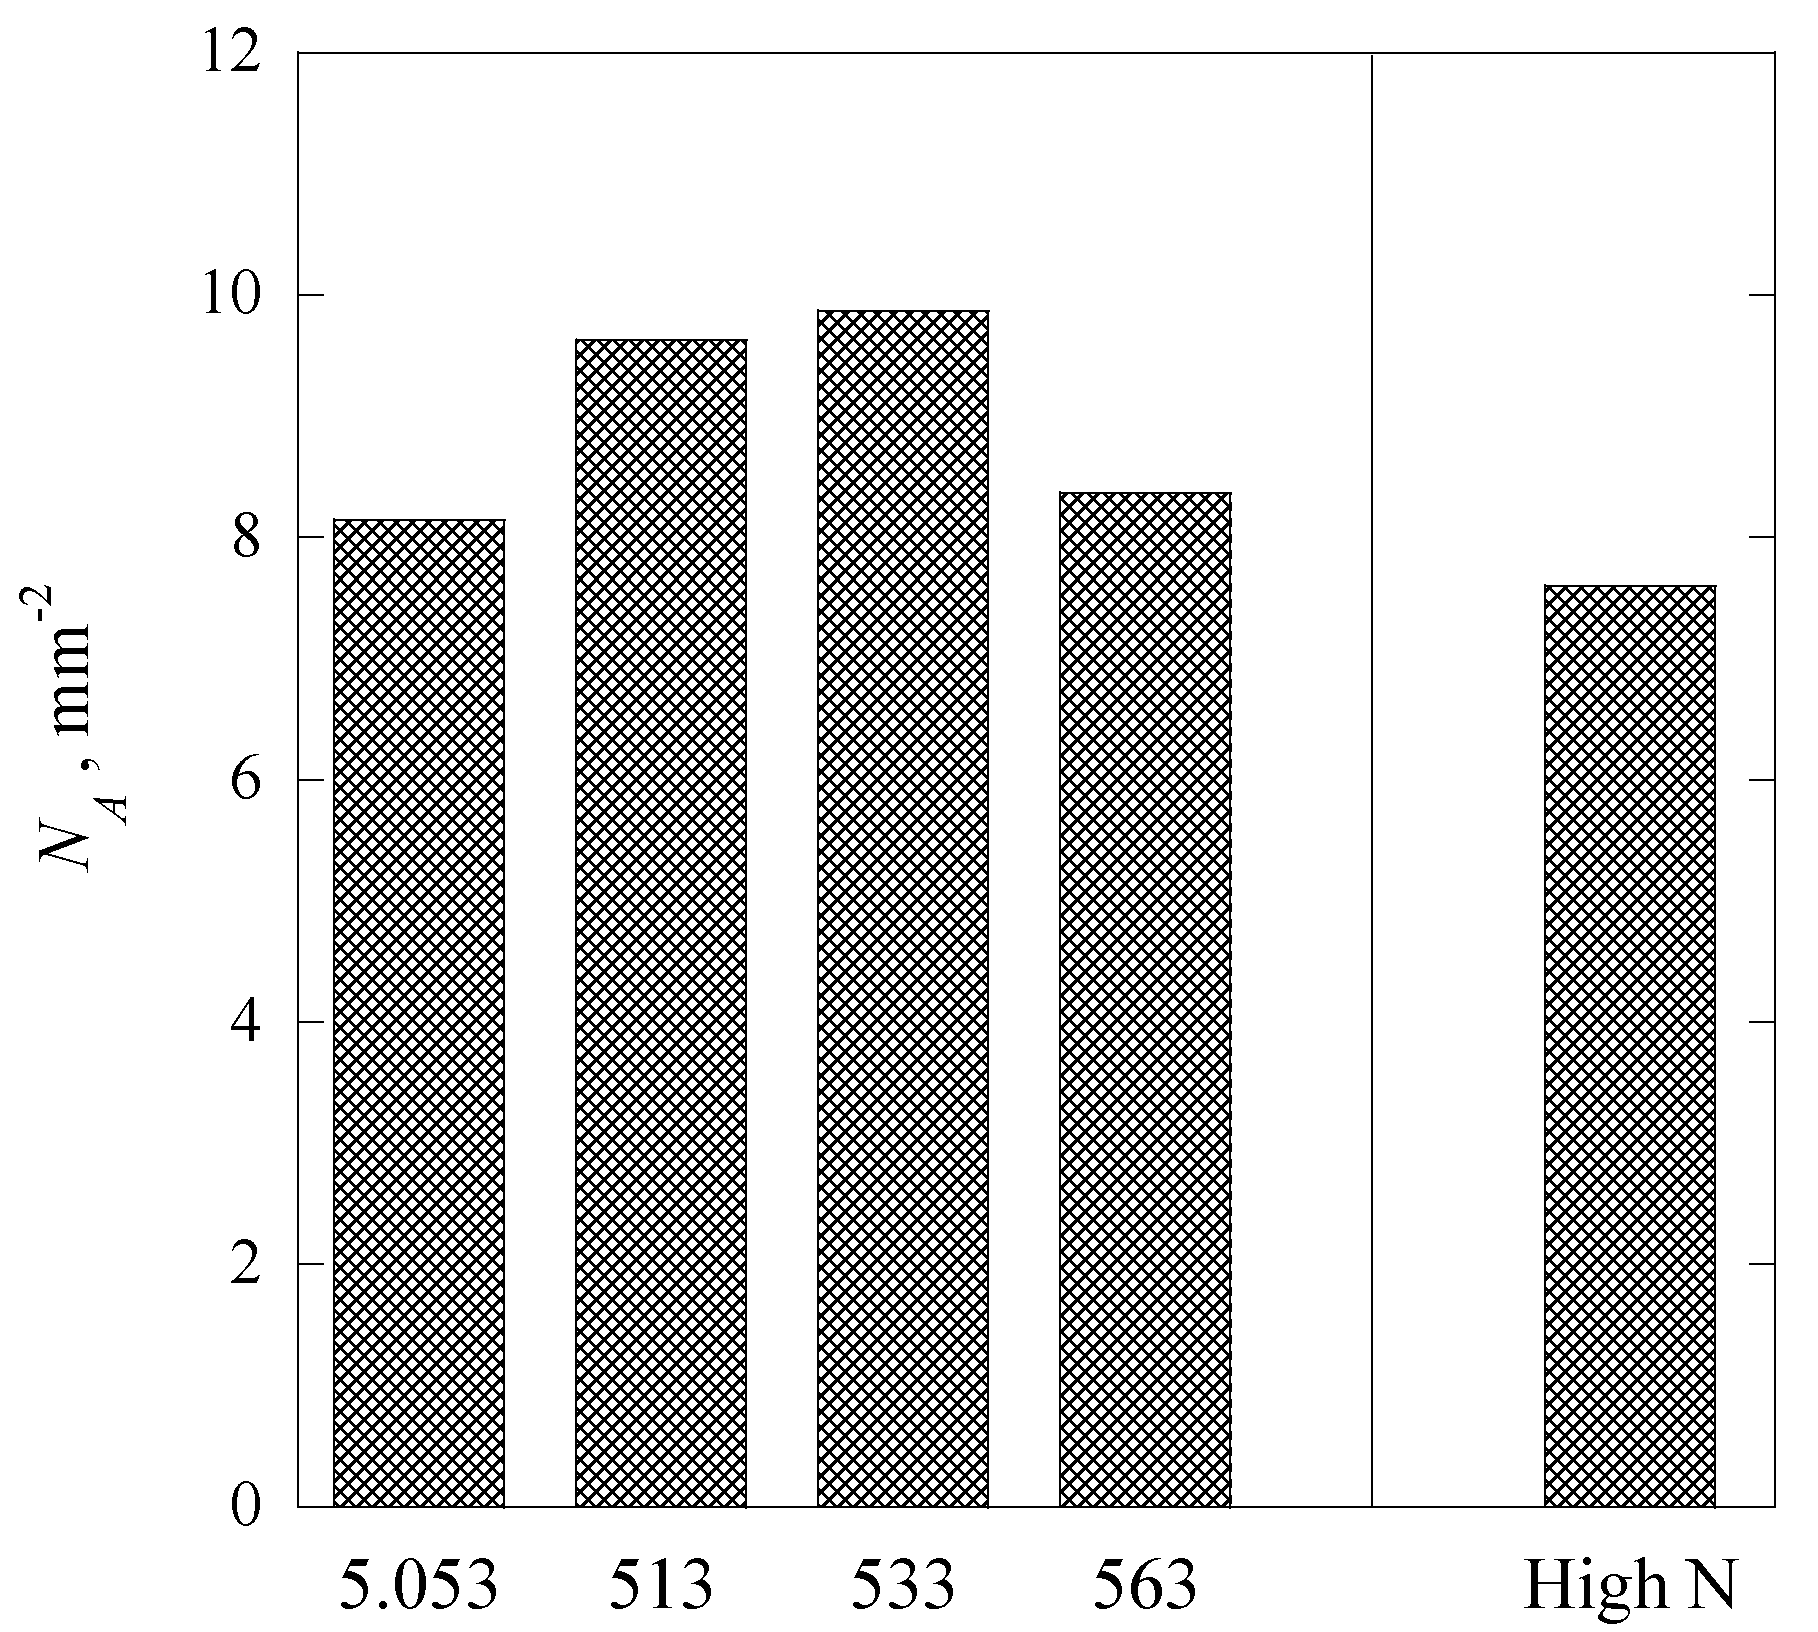
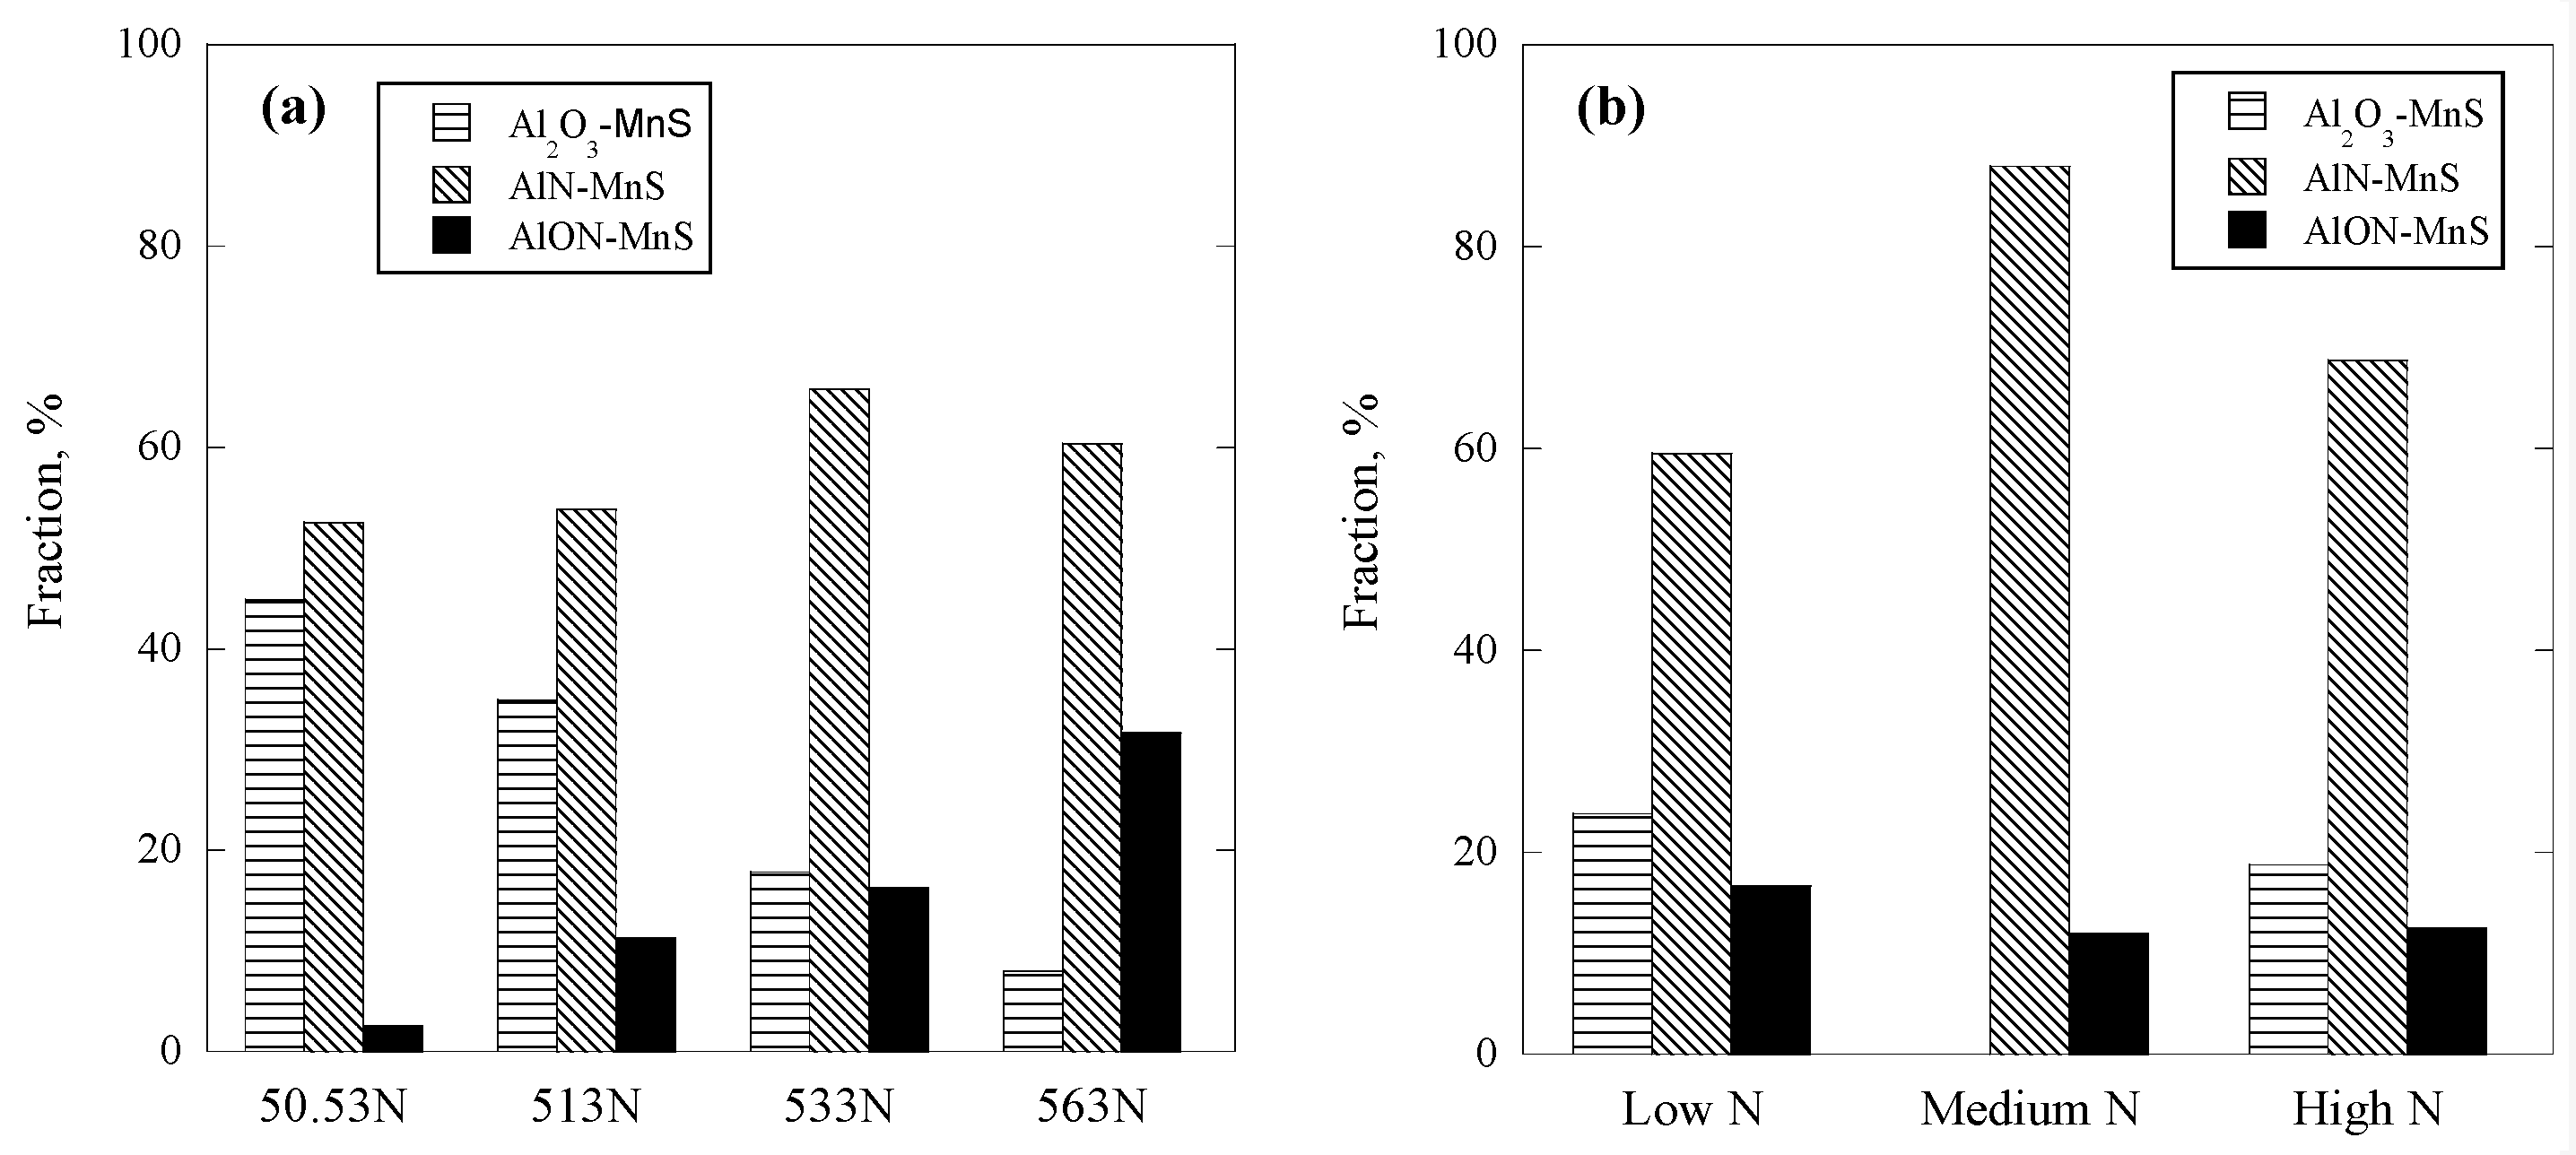
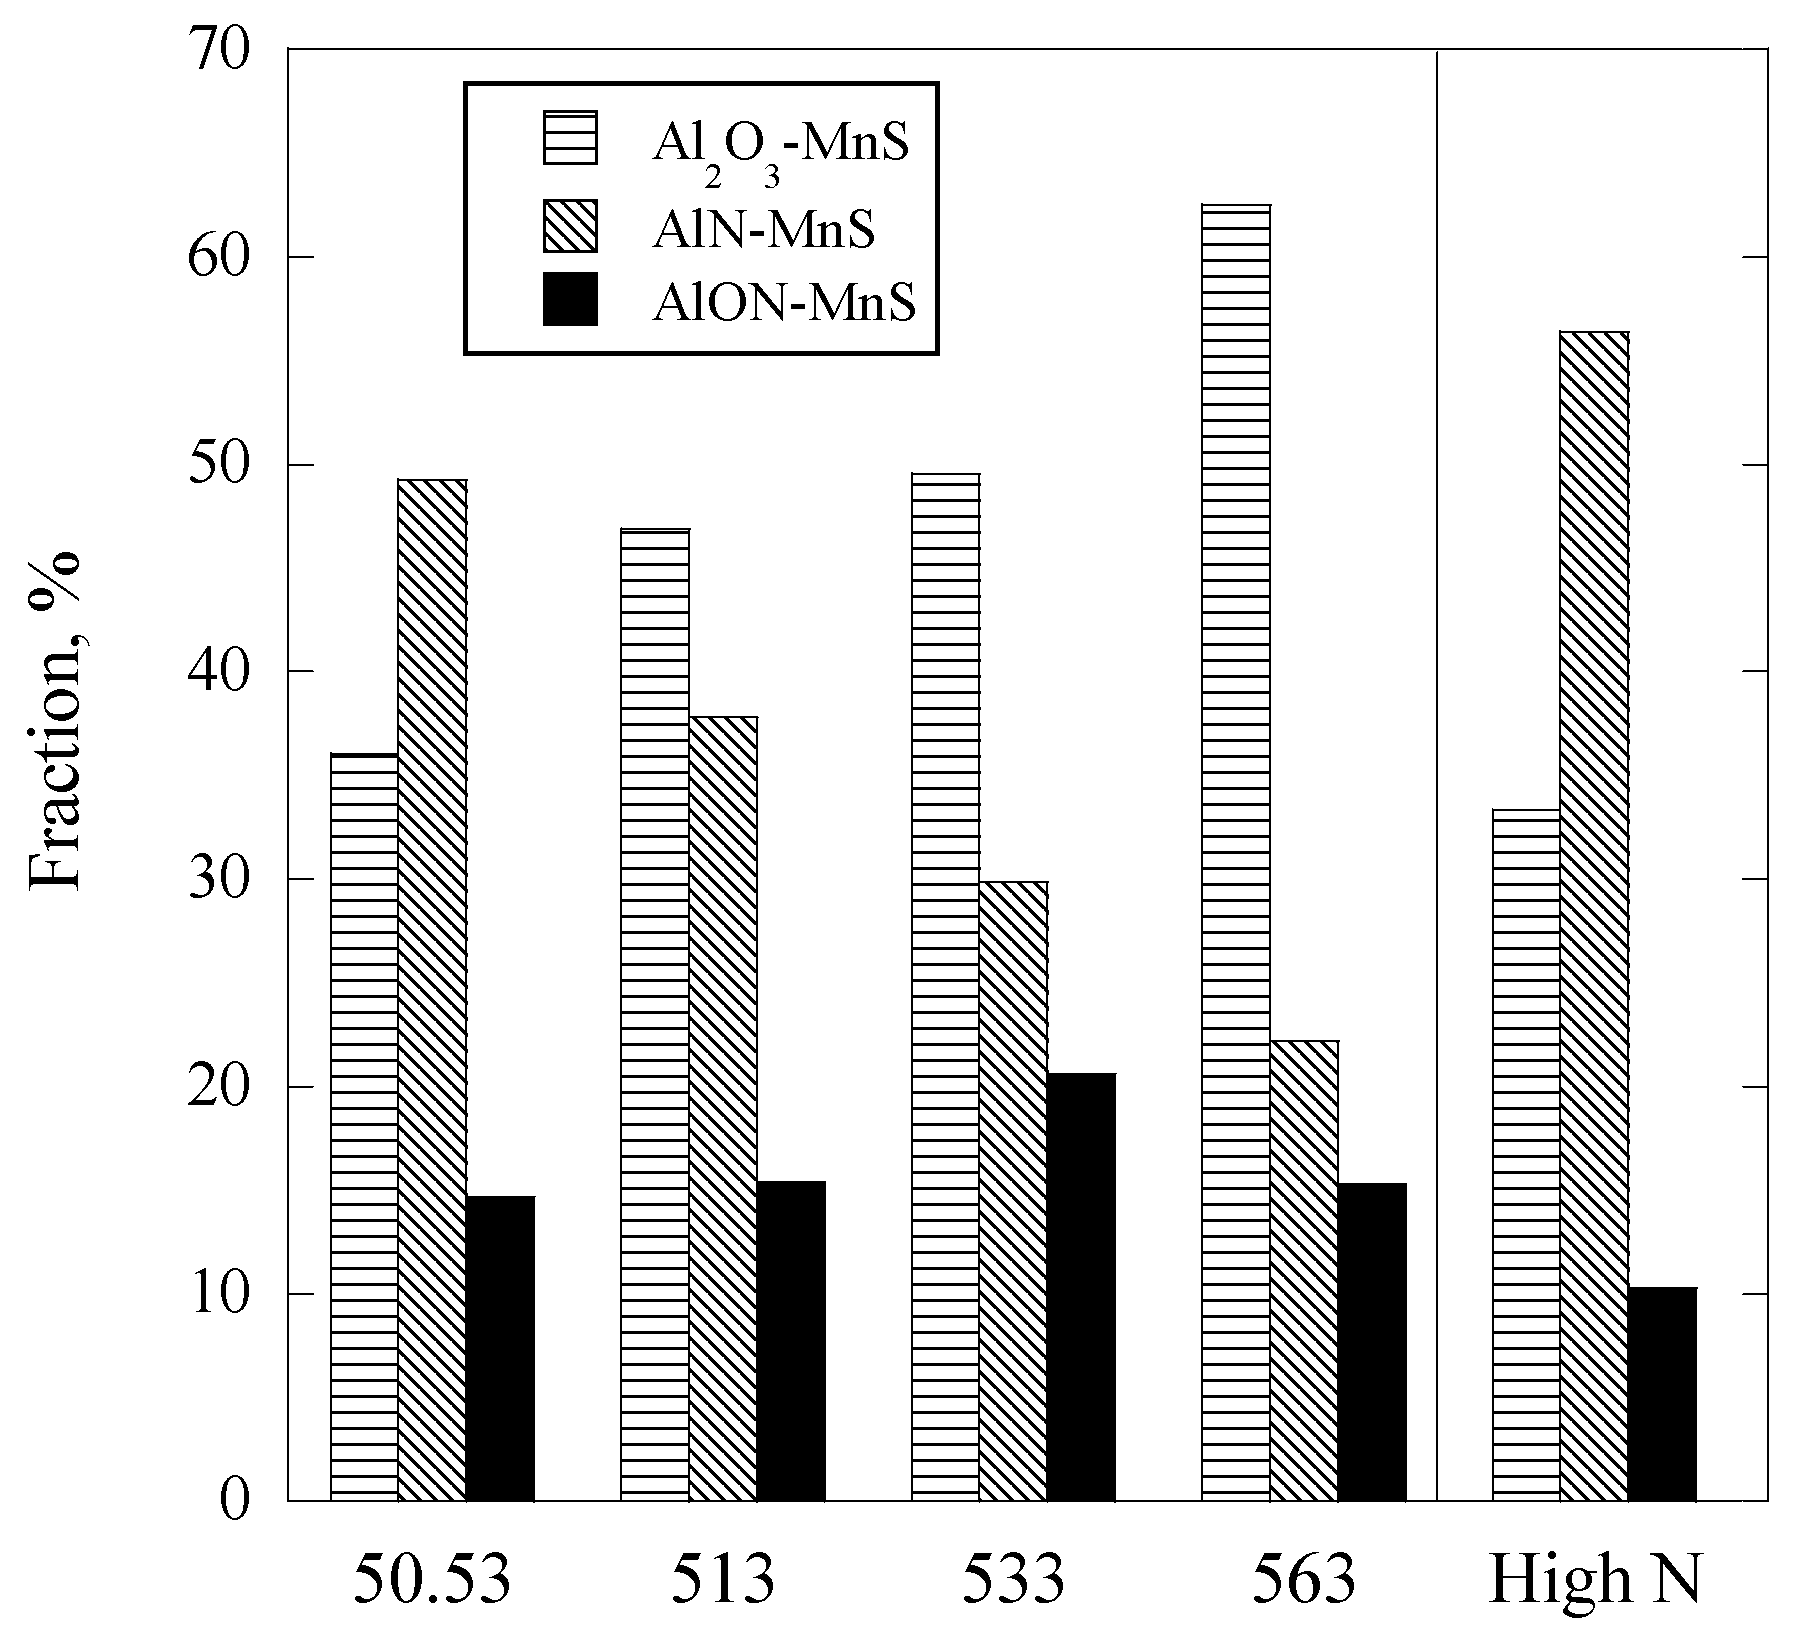
3.1. Characteristics of Complex MnS Inclusions

The inclusions are classified into four major classes, i.e., Al2O3, AlN, MnS, and Other. The Al2O3 inclusions are further classified into two subclasses, Al2O3(pure) and Al2O3-MnS. The AlN class consists of four subclasses, i.e., AlN(pure), AlN-MnS, AlON-MnS, and AlON. The ‘Other’ class contains complex oxide inclusions, which do not fall in the aforementioned classes. The details of the classification rules of inclusion were explained elsewhere [18].
SEM images, along with elemental mappings, of typical complex MnS inclusions are shown in Figure 1. As can be seen in Figure 1a, Al and O are present in the core, while Mn and S are distributed along the periphery in the Al2O3-MnS inclusion. In the case of AlN-MnS inclusion (Figure 1b), MnS is located at the top of the AlN particle. Whereas a small portion of MnS is located between Al2O3 and AlN phases in AlON-MnS inclusions (Figure 1c).
Detailed inclusion analyses of the current experiments are presented and discussed elsewhere [19,20]. Figure 2 presents the number per unit area (NA) of complex MnS inclusions observed in the air cooled samples of all experimental steels. As can be seen in Figure 2a, 50.53 steel contained ~2 mm−2 of complex MnS inclusions. Which slightly increased to ~2.7 mm−2 in 513 steel and then substantially increased to ~10 mm−2 in 533 steel. This value decreased to ~8 mm−2 with a further increase in Al content (563 steel). Figure 2b clearly indicates that an increase in the N content of steel resulted in a decrease in the amount of complex MnS inclusions from ~3.5 mm−2 to less than 1 mm−2.
The NA of complex MnS inclusions observed in the furnace cooled samples from all experiments is shown in Figure 3. It can be seen that all steels contained almost a similar amount of complex MnS inclusions (between 8 and 10 mm−2) despite the difference in Al and N content of steel samples. However, 513 and 533 steel samples have a relatively higher amount of complex MnS inclusions compared to those observed in other steels.
Figure 4 depicts the distribution of complex MnS inclusions among different classes of inclusions observed in air cooled samples. As seen in Figure 4a, the fraction of MnS associated with Al2O3 (as in Al2O3-MnS) is highest in 50.53 steel, i.e., ~45%. An increase in Al content decreases the fraction of Al2O3-MnS. The 563 steel contains only ~8% of Al2O3-MnS inclusions. Around 52% of complex MnS inclusions in 50.53 steel consist of AlN-MnS. This value increases to ~54% and ~68% as Al content increases to 1 and 3%, respectively. The fraction of AlON-MnS is lowest for 50.53 steel and is highest for 563 steel (31%), whereas that for 513 and 533 steels is 11% and 16%, respectively. In 533N-P steel, all samples with different N levels contain between ~60% and ~80% of AlN-MnS, see Figure 4b. The fraction of Al2O3-MnS and AlON-MnS varies from ~12% to ~22% without any clear trend. It can be inferred from Figure 4a that the contribution of Al2O3-MnS in complex MnS inclusions decreases with increasing Al content of steel, whereas that of AlN-MnS and AlON-MnS increases. However, it is debatable due to a low NA value of complex MnS inclusions in 50.53 and 513 steels. Figure 4b suggests that the composition of complex MnS is independent of the N content of the steel. Again it should be noted that the NA value of complex MnS inclusions in samples from 533N-P steel is small to confirm such a suggestion. Moreover, both Figure 4a,b indicate that in the air cooled samples, AlN-MnS inclusions make a higher portion of complex MnS inclusions as compared to that of Al2O3-MnS.
The composition of complex MnS inclusions observed in furnace cooled samples is presented in Figure 5. The results show that an increase in the Al content of steel leads to a decrease and an increase in the fraction of AlN-MnS and Al2O3-MnS inclusions, respectively. This tendency is opposite to that observed in the air cooled samples. The fraction of AlN-MnS inclusions decreases from ~50% to 22%, while that of Al2O3-MnS inclusions increases from ~36% to over 60%. Moreover, Al2O3-MnS inclusions have a higher fraction in complex MnS as opposed to AlN-MnS in the air cooled samples. The fraction of AlON-MnS does not vary much with Al content; however, it was generally higher than that in air cooled samples. The complex MnS inclusions in furnace cooled sample from 533N-P have a similar composition as that of its air cooled samples.

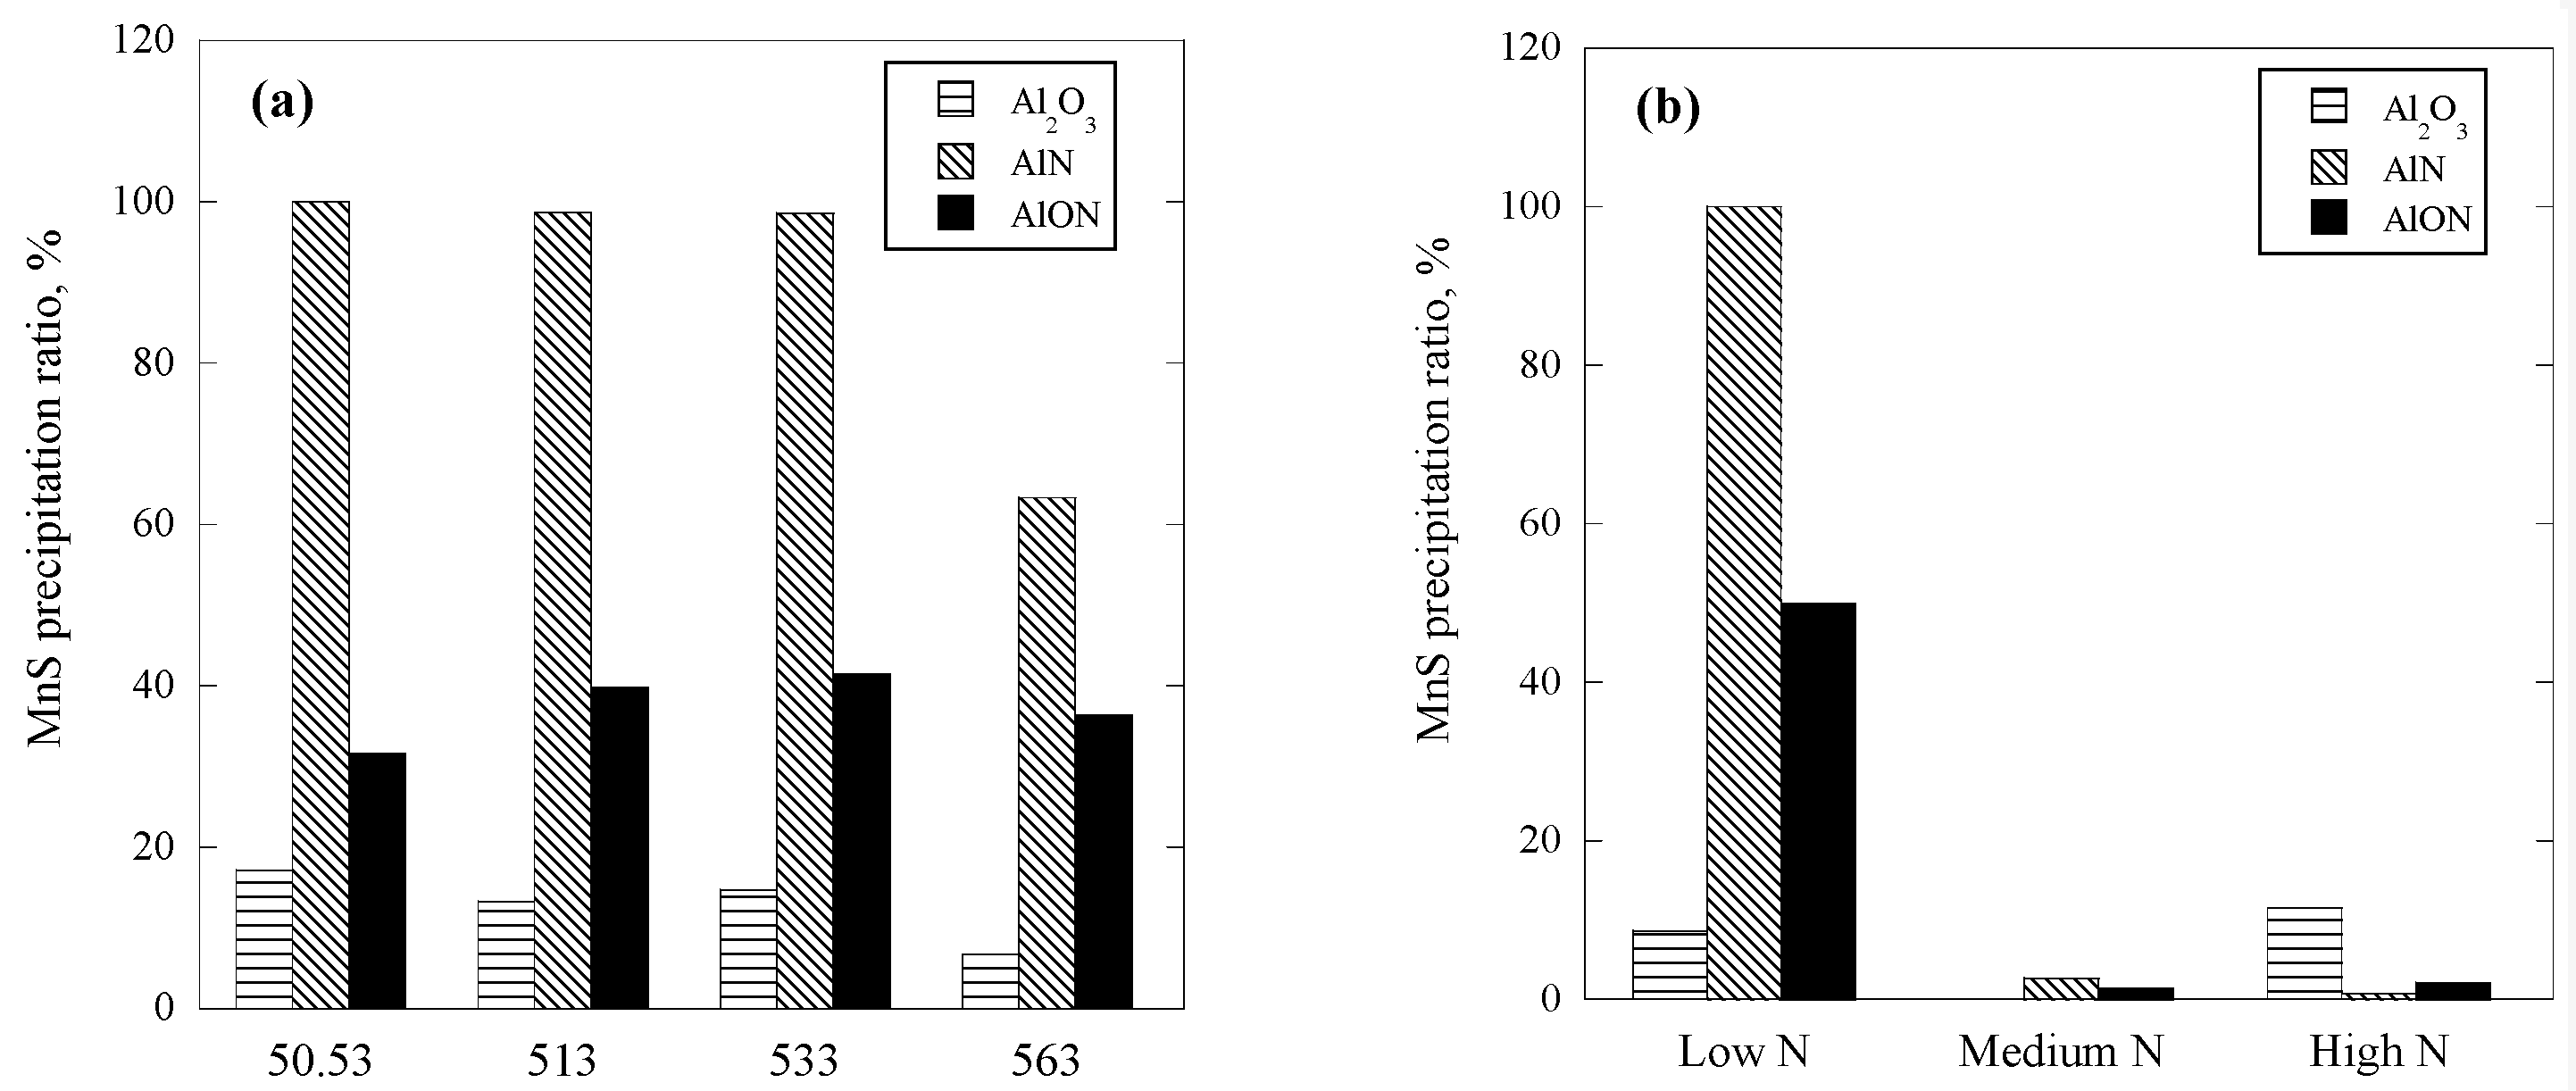
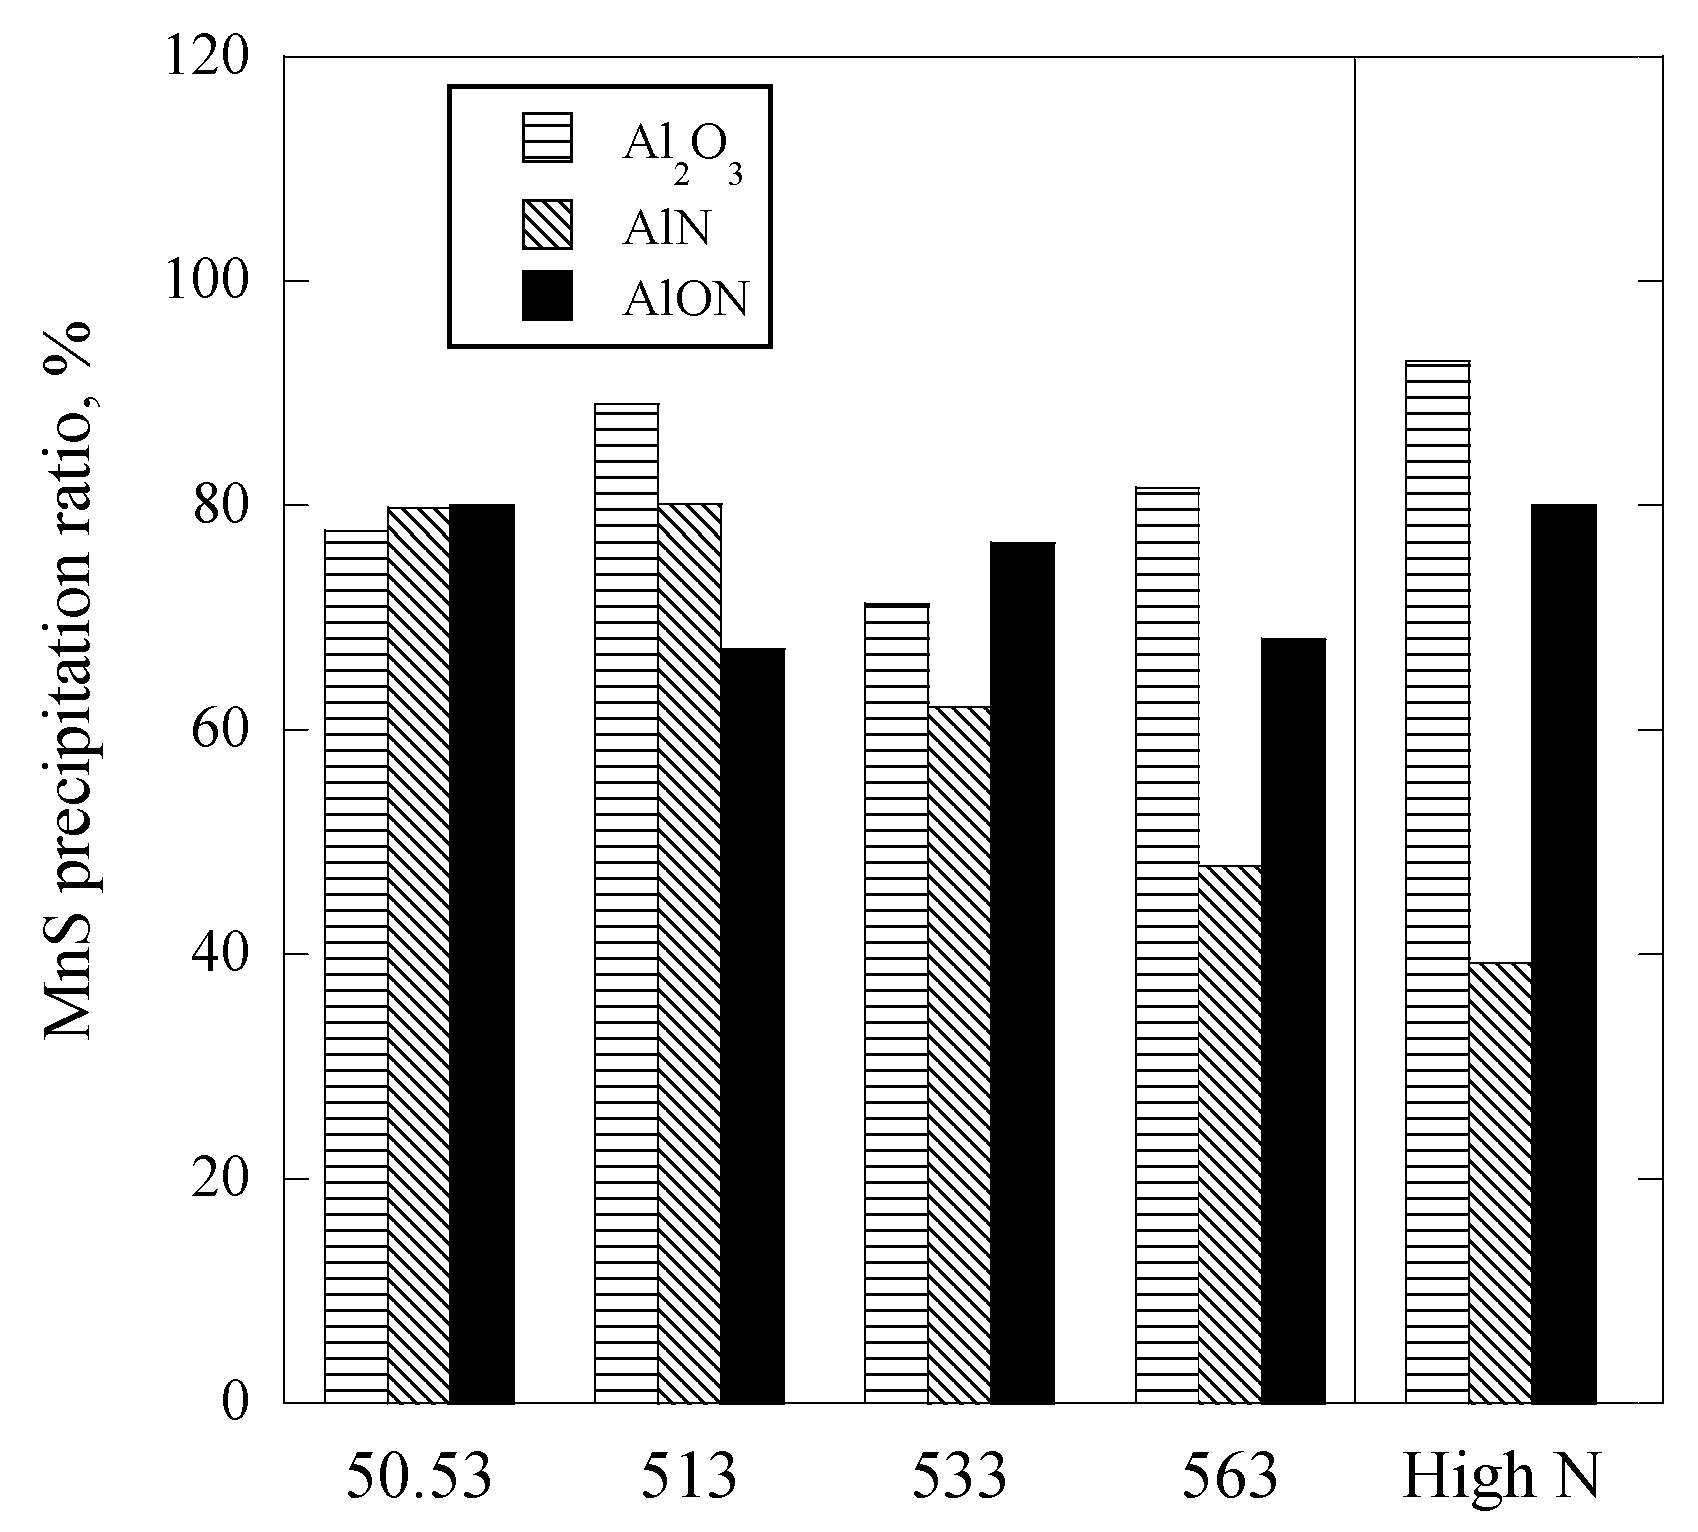
3.2. MnS Precipitation Ratio

The tendencies observed in Figure 3 and Figure 4 are further quantified by determining the ratio of MnS precipitated on different types of inclusions. MnS precipitation ratio on a specific type of inclusion is defined as the ratio of the number of MnS containing particles to all of the particles in that type of inclusions. For example, the MnS precipitation ratio (PRMnS) for AlN inclusions is calculated as follows:
PR MnS = n AlN MnS n AlN MnS + n AlN pure × 100 %
where, n AlN MnS and n AlN pure represent the number of AlN-MnS inclusions and the number of AlN(pure) inclusions, respectively. Similar equations can be written for the MnS precipitation ratio for Al2O3 and AlON inclusions. The calculated PRMnS for AlN, Al2O3, and AlON inclusions observed in air cooled samples is given in Figure 6. As demonstrated in Figure 6a, the PRMnS for Al2O3 inclusions is the least (<20%), and that of AlON is between 30% and 40%. The PRMnS for AlN inclusions is almost 100% for 50.53, 513, and 533 steels, and it is relatively less for 563 steel, i.e., ~63%. Figure 6b shows that the low N sample of 533N-P steel exhibits similar PRMnS values as observed for 533 steel, which also has a low N content. The PRMnS values for all three types of inclusions significantly decreased to less than 10%, with an increase in the N content of 533N-P steel samples. A high PRMnS value for a particular type of inclusions means that a higher fraction of those inclusions coexists with MnS. For instance, almost all the AlN type inclusions in a low N sample of 533N-P steel are AlN-MnS. Whereas, the very low PRMnS value for medium N and high N level samples indicates that almost all the AlN type inclusions in these samples are AlN(pure).
The calculated PRMnS values of the furnace cooled samples are shown in Figure 7. It is notable that in the furnace cooled samples, the PRMnS values for Al2O3 inclusions are around 80% for all the samples, which is significantly higher than that observed in air cooled samples. Moreover, those for AlON have increased more than two times. On the contrary, the PRMnS values for AlN have decreased (except 533N-P) compared to those observed in Figure 6. For 50.53 and 513, the value dropped from ~100% to ~80%. A decrease of ~37% and ~25% is observed in the PRMnS values of 533, and 563 steel as compared to their respective values in the air cooled samples. The furnace cooled sample of 533N-P is to be compared to its high N level air cooled sample because of their similar N content. The furnace cooled sample has a higher PRMnS value for AlN as compared to that in air cooled one (compare Figure 6b and Figure 7).
The higher PRMnS values for AlN in the air cooled samples and for Al2O3 in the furnace cooled samples support the inference deduced from Figure 4 and Figure 5 i.e., complex MnS inclusions in the air cooled samples contain a higher fraction of AlN-MnS, and Al2O3-MnS make a significant fraction of those in furnace cooled samples. However, the influence of Al content seen in Figure 4 is not reflected in Figure 6.

4. Discussion

The following three factors are to be considered for understanding the tendencies observed in Figure 4 through Figure 7.

4.1. Thermodynamics of Inclusions Formation

Thermodynamic calculations were carried out by using Factsage 7.3 (CRCT, Montreal, QC, Canada and GTT-Technologies, Aachen, Germany) to determine the stable phases in the current steel compositions for a temperature range between 1473 K and 1873 K. It was found that at 1873 K Al2O3 is the only stable phase for all steel compositions except for a high N sample of 533N-P steel. For a high N sample, both Al2O3 and AlN are stable at working temperature. In addition to phase stability, the liquidus temperature (Tliq), solidus temperature (Tsol), AlN formation temperature (TAlN), and MnS formation temperature (TMnS) were also determined. The obtained data is presented in Table 2. The TAlN values for 563 and medium N sample of 533N-P are higher than their respective Tliq values, indicating that for these two compositions, AlN starts to form before the solidification begins during cooling. Whereas, the TAlN values for the remaining four compositions suggest that AlN forms during the solidification of steel. This is because the driving force of AlN formation increases during solidification due to the enrichment of Al and N at the solidification front. The Scheil equation [11,13,21] was used to calculate the concentration of [%Al] and [%N] in the liquid phase at the solidifying front. The equations for [%Al] and [%N] are given below.
% A l = [   % A l ] 0 1 g s k A l 1
% N = [ %   N ] 0 k N + 1 k N 1 g s
where g s is the solid fraction, and [%Al]0 and [%N]0 are the initial weight percentages of solute Al and N in liquid steel, respectively. kAl (= 0.6) and kN (= 0.27) are the equilibrium partition ratios of solute Al and N, respectively [21,22]. The equilibrium constant for formation of AlN (KAlN = [%Al] × [%N]) can be calculated according to Equation (4) [23].
K A l N = 10 15850.93 T   + 7.0297
The relationship between the temperature at the solidifying front ( T ) and the solid fraction ( g s ) is shown in Equation (5) [11].
T = T m T m T l i q 1 g s T l i q T s o l T m T s o l
where T m , T s o l , and T l i q are the melting temperature of pure Fe (1811 K, 1538 °C), the solidus temperature of steel, and the liquidus temperature of steel, respectively.
Using Equations (2)–(5), a relationship between [%Al] × [%N] at solidification front and g s , and equilibrium value for AlN formation (KAlN) and g s can be obtained. An intersection of both functions gives the g s value at which AlN formation starts. The obtained results for the current experimental steels are given in Table 3. For calculation of g s values, N content is assumed to be 10 ppm. The results indicate the AlN starts to form at a g s of 0.85 for 50.053 steel. Moreover, AlN formation takes place at an early stage of solidification, i.e., at lower g s values in 513 and 533.

4.2. Heterogeneous Nucleation of Inclusions

Inclusions in steel can homogeneously nucleate in the melt or heterogeneously on the existing solid particles or matrix. Heterogeneous nucleation is more likely to take place as it requires a less nucleation energy. The morphology of complex MnS inclusions (Figure 1) observed in the current study suggests they are formed due to heterogeneous nucleation of MnS on other inclusions. The heterogeneous nucleation is influenced by several factors, among them, the lattice misfit or disregistry between the substrate and nucleated phase has a significant contribution [24,25]. The lattice misfit or disregistry determines the effectiveness of an inclusion to act as a nucleus for another. It is suggested that an inclusion can act as an effective nucleation site for a solid phase when the lattice misfit between the substrate inclusion and nucleated solid is less than 12% [24]. A higher value means less effectiveness as nucleant.
The lattice misfit can be calculated as follows [26]:
M i s f i t =   a n a s a s × 100 %
where a n and a s are the lattice parameters of nucleated solid and substrate, respectively.
Table 4 presents the lattice parameters used for misfit calculations. The calculated misfit between MnS and Al2O3 (substrate) is ~10% along a axis. Whereas, MnS nucleation on the c axis of AlN gives a misfit of ~5%. These values are in agreement with those reported by Ohta and Suito [27]. A lower mismatch value for AlN means that less interfacial energy is required for nucleation of MnS on AlN compared to that on Al2O3; hence, MnS would preferentially nucleate on AlN. This explains a significantly higher MnS precipitation ratio for AlN inclusions in the experimental steels.
Similar to Al2O3-MnS and AlN-MnS inclusions, AlON-MnS complex inclusions are formed by heterogeneous nucleation of MnS on AlON inclusions. Here it is important to mention that the AlON inclusions observed in the current study are not single AlON phase inclusions rather they consist of distinct Al2O3 and AlN phases (see Figure 1c). Moreover, it is reported that the AlON phase is stable only above 1923 K (1650 °C), and below this temperature, it dissociates into AlN+Al2O3 [30]. Based on the thermodynamic stability of AlON (single phase), Al2O3, and AlN phases, it can be implied that the observed AlON inclusions are a result of AlN nucleation on existing Al2O3 inclusions. The calculated lattice misfit between (a axis of) AlN and Al2O3 is about 35%. However, a 30° in-plane rotation of AlN with respect to Al2O3 reduces this misfit to ~12% [31,32]. A 12% misfit means that Al2O3 is not a very effective substrate for nucleation of AlN, but it can still occur particularly in the presence of high Al content of the steel. The effect of Al content on the formation of AlON is reflected in Figure 4b, which shows that the fraction of AlON-MnS in complex MnS inclusions increases with Al content of the steel. Hence, the formation of AlON-MnS inclusions takes place by duplex heterogeneous nucleation. First, AlN nucleates on Al2O3, then MnS heterogeneously nucleates on AlN (or Al2O3 but preferentially on AlN).

4.3. Inclusion Behavior at Solid/Liquid Interface

It is established in the preceding sections that for most of the investigated steel compositions, complex MnS inclusions are formed during the solidification of steel and by heterogeneous nucleation of MnS on already existing inclusions. Therefore, the behavior of nucleant inclusions at the solidification front is considered. During the solidification of liquid steel, inclusions are either engulfed or pushed by the solid/liquid interface. There are several factors that determine the inclusion behavior at solid/liquid interface, such as solidification velocity, interfacial energy between inclusion and liquid steel, the viscosity of steel, size of the particle, and thermal conductivity of inclusion and steel. Stefanescu et al. [33] derived a relationship describing the critical velocity, VCR, of solid/liquid interface to determine engulfment/pushing transition. A solidification velocity higher than VCR would result in the engulfment of inclusions of a specific size. The relationship is expressed as follows:
V C R = Δ γ o   . a o 2 3 . η . k * . R 1 2
where ao is the atomic distance (m), η is the viscosity of liquid steel (kg/ms), and R is the radius of particle (m). k * is the ratio of the thermal conductivities of the particle ( k P ) and liquid steel ( k L ), i.e.,   k * = k P k L . Δ γ o is given as follows:
Δ γ o = γ P S γ P γ L . c o s   ° θ P L
γ P S = γ P + γ S W A D  
where γ P S is the interfacial energy between particle and liquid steel (J/m2). γ P ,   γ L , and γ S are the surface energies of the particle, liquid steel, and solid steel, respectively (J/m2). θ P L is the contact angle and W A D is the work of adhesion.
In the current study, Equation (7) is adopted to determine the relationship between V C R and the size of inclusion for Al2O3 and AlN. The parameters used to determine the relationship are given in Table 5. The data used for calculating Δ γ o of AlN comes from the work of Y. Luo [34], where the AlN substrate was produced using Y2O3 as a binder. The a o value for both Al2O3 and AlN is taken as the atomic diameter of aluminum [33]. The obtained results are plotted in Figure 8. It is evident from the figure that there exists a difference in the behavior of Al2O3 and AlN inclusions at the solid/liquid interface. Figure 8 suggests that AlN inclusions are more likely to be engulfment by the solidification front as compared to Al2O3 inclusions at a certain solidification velocity. For instance, AlN inclusions with diameter > ~1 µm would be engulfed at a solidification velocity of 4 × 10⁻⁶ m/s, and only inclusions with diameter < 1 µm would be pushed. Whereas, Al2O3 inclusions with diameter up to ~3.5 µm can be pushed by the solidification front for the same solidification velocity.
The difference in the PRMnS values of different types of inclusions observed in the air cooled samples (Figure 6) is related to lattice misfit. The low effectiveness (high misfit) of Al2O3 for the nucleation site of MnS is the reason for the low PRMnS values for Al2O3, Figure 6. AlN inclusions have higher PRMnS values due to a low lattice misfit between AlN and MnS. Considering this and the stability of AlN in the medium N and high N containing samples of 533N-P, it can be argued that these samples should also have high PRMnS values for AlN. However, AlN inclusions have very low PRMnS values (<5%) in these samples (Figure 6b). This phenomenon suggests that only the AlN inclusions which are formed at the solidification front, or closer to the formation of MnS, participate in heterogeneous nucleation of MnS. This behavior is also reflected in the air cooled sample of 563 steel (Figure 6a), where the PRMnS value for AlN is relatively lower because the formation of AlN starts above Tliq (Table 2).
In all the furnace cooled samples (except for 533N-P), the PRMnS values for AlN decrease in comparison to those of air cooled samples. This can also be explained by considering the formation of AlN-MnS inclusions at the solidification front. However, due to the slow cooling rate, the AlN inclusions which form at the early stage of solidification are engulfed by the solidification front as AlN(pure) inclusions. Hence, lower PRMnS values for AlN are observed in furnace cooled samples. This reasoning also explains relatively lower PRMnS values for AlN in 533 (~60%) and 563(~40%) furnace cooled samples as compared to those of 50.53 and 533 (~80%), see Figure 7. A higher number of AlN(pure) inclusions would form in 533 and 563 due to their low g s values for AlN formation; hence, low PRMnS values for AlN in these steels. An even lower PRMnS value for furnace cooled sample 533N-P affirms this logic, as AlN(pure) inclusions start to form in liquid steel for this sample.
Moreover, Al2O3 inclusions have significantly higher (~80%) PRMnS values in furnace cooled samples as compared to less than 10%, as observed in air cooled samples. As shown in Figure 8, Al2O3 inclusions can be easily pushed (compared to AlN) to the liquid ahead of the solidification front, especially at low solidification velocities. Moreover, Al2O3 inclusions can also form during solidification. Therefore, a higher quantity of Al2O3 inclusions are present in solute enriched liquid; thereby, higher PRMnS values for Al2O3 inclusions. The end of solidification liquid enriched in Al2O3 and solute elements also means an increase in the formation of AlON inclusions and their increased PRMnS values (compare Figure 6 and Figure 7 for AlON).
The differences in the composition of complex MnS inclusions of air cooled and furnace cooled samples, as shown in Figure 4 and Figure 5, are also attributed to the lattice misfit of inclusions with MnS and their behavior at the solid/liquid interface.

5. Conclusions

In the present study, laboratory experiments were carried out to investigate the characteristics of complex MnS inclusions in AHSS and their formation behavior. The following observations were made.
The number of complex MnS inclusions increases with an increase in Al content of steel, and it decreases with an increase in N content.
Under air cooling condition, an increase in the Al content of steel results in an increase and a decrease in Al2O3-MnS and AlN-MnS inclusions, respectively. Whereas, N content does not have any specific relation to the composition of complex MnS inclusions.
Under furnace cooled conditions, the complex MnS inclusions become rich in Al2O3-MnS as Al content of steel increases; meanwhile, the portion of AlN-MnS decreases.
The effectiveness of inclusions for the precipitation of MnS is related to their lattice misfit with MnS, and its order is AlN > AlON > Al2O3.
The precipitation ratio of MnS for AlN is influenced by the stability of AlN in liquid steel, i.e., it decreases when AlN can form in liquid steel before solidification starts.
Slow cooling significantly increases the MnS precipitation for Al2O3 and AlON, and slightly decreases that for AlN. It is attributed to the difference in the pushing and engulfment behavior of Al2O3 and AlN.

Author Contributions

Conceptualization, M.N. and N.D.; methodology, M.N. and M.A.; software, M.N.; formal analysis, M.N. and M.A.; investigation, M.N.; writing—original draft preparation, M.N.; writing—review and editing, M.N., M.A., and N.D.; supervision, N.D.; project administration, N.D.; funding acquisition, N.D. All authors have read and agreed to the published version of the manuscript.

Funding

This research was funded by Natural Sciences and Engineering Research Council of Canada, Project Number 20002139

Acknowledgments

The authors would like to express gratitude to Stanley Sun and Li Sun at ArcelorMittal Dofasco for her valuable time and fruitful discussions. Further, we also want to thank the Canadian Centre for Electron Microscopy (CCEM) to provide access to the JEOL 6610 to conduct the scanning electron microscopy analysis.

Conflicts of Interest

The authors declare no conflict of interest. The funders had no role in the design of the study; in the collection, analyses, or interpretation of data; in the writing of the manuscript, or in the decision to publish the results.

References

  1. Penna, R.V.; Bartlett, L.N.; Constance, T. Understanding the Role of Inclusions on the Dynamic Fracture Toughness of High Strength Lightweight FeMnAl Steels. Int. J. Met. 2018, 13, 286–299. [Google Scholar] [CrossRef]
  2. Li, D.Z.; Wei, Y.H.; Xu, B.S.; Hou, L.F.; Han, P.D. Development in fundamental research on TWIP steel used in automobile industry. Ironmak. Steelmak. 2011, 38, 540–545. [Google Scholar] [CrossRef]
  3. Aydin, H.; Essadiqi, E.; Jung, I.-H.; Yue, S. Development of 3rd generation AHSS with medium Mn content alloying compositions. Mater. Sci. Eng. A 2013, 564, 501–508. [Google Scholar] [CrossRef]
  4. Steenken, B.; Rezende, J.L.L.; Senk, D. Hot ductility behaviour of high manganese steels with varying aluminium contents. Mater. Sci. Technol. 2016, 33, 567–573. [Google Scholar] [CrossRef]
  5. Yang, J.; Wang, Y.N.; Ruan, X.M.; Wang, R.Z.; Zhu, K.; Fan, Z.J.; Wang, Y.C.; Li, C.B.; Jiang, X.F. Effects of Manganese Content on Solidification Structures, Thermal Properties, and Phase Transformation Characteristics in Fe-Mn-Al-C SteelsMetall. Mater. Trans. B Process Metall. Mater. Process. Sci. 2015, 46, 1365–1375. [Google Scholar] [CrossRef]
  6. Liu, H.; Liu, J.; Wu, B.; Shen, Y.; He, Y.; Ding, H.; Su, X. Effect of Mn and Al contents on hot ductility of high alloy Fe-xMn-C-yAl austenite TWIP steels. Mater. Sci. Eng. A 2017, 708, 360–374. [Google Scholar] [CrossRef]
  7. Lucaci, M.; Lungu, M.; Vasile, E.; Marinescu, V.; Talpeanu, D.; Sbarcea, G.; Stancu, N.; Ivan, I.; Alexandru, I.; National Institute for Research and Development in Electrical Engineering ICPE-CA (INCDIE ICPE-CA); et al. Advanced High Strength Steel (AHSS) Alloys. J. Am. Romanian Acad. Arts Sci. 2017, 1, 46–50. [Google Scholar] [CrossRef]
  8. Hu, B.; Luo, H.; Yang, F.; Dong, H. Recent progress in medium-Mn steels made with new designing strategies, a review. J. Mater. Sci. Technol. 2017, 33, 1457–1464. [Google Scholar] [CrossRef]
  9. Park, J.H.; Kim, D.-J.; Min, D.J. Characterization of Nonmetallic Inclusions in High-Manganese and Aluminum-Alloyed Austenitic Steels. Met. Mater. Trans. A 2012, 43, 2316–2324. [Google Scholar] [CrossRef]
  10. Zhuang, C.; Liu, J.; Mi, Z.; Jiang, H.-T.; Tang, D.; Wang, G. Non-Metallic Inclusions in TWIP Steel. Steel Res. Int. 2014, 85, 1432–1439. [Google Scholar] [CrossRef]
  11. Liu, H.; Liu, J.; Michelic, S.; Wei, F.; Zhuang, C.; Han, Z.; Li, S. Characteristics of AlN inclusions in low carbon Fe–Mn–Si–Al TWIP steel produced by AOD-ESR method. Ironmak. Steelmak. 2016, 43, 171–179. [Google Scholar] [CrossRef]
  12. Alba, M.; Nabeel, M.; Dogan, N. Investigation of Inclusion Formation in Light-Weight Fe–Mn–Al Steels using Automated Scanning Electron Microscope Equipped with Energy-Dispersive X-Ray Spectroscopy. Steel Res. Int. 2019, 91. [Google Scholar] [CrossRef]
  13. Nabeel, M.; Alba, M.; Karasev, A.; Jönsson, P.G.; Dogan, N. Characterization of Inclusions in 3rd Generation Advanced High-Strength Steels. Met. Mater. Trans. A 2019, 50, 1674–1685. [Google Scholar] [CrossRef]
  14. Kong, L.; Deng, Z.; Zhu, M. Formation and Evolution of Non-metallic Inclusions in Medium Mn Steel during Secondary Refining Process. ISIJ Int. 2017, 57, 1537–1545. [Google Scholar] [CrossRef] [Green Version]
  15. Gigacher, G.; Krieger, W.; Scheller, P.R.; Thomser, C. Non-Metallic Inclusions in High-Manganese-Alloy Steels. Steel Res. Int. 2005, 76, 644–649. [Google Scholar] [CrossRef]
  16. Nabeel, M.; Alba, M.; Dogan, N. Formation behavior of complex MnS inclusions in AHSS. unpublished, manuscript in preparation.
  17. Ericsson, O.T.; Lionet, M.; Karasev, A.V.; Inoue, R.; Jönsson, P.G. Changes in inclusion characteristics during sampling of liquid steel. Ironmak. Steelmak. 2012, 39, 67–75. [Google Scholar] [CrossRef]
  18. Nabeel, M.; Alba, M.; Sun, S.; Karasev, A.; Jonsson, P. Characterization of Inclusions in High Mn Steel using Two-Dimensional and Three-Dimensional Methods. In Proceedings of the AISTech 2018, Philadelphia, PA, USA, 7–10 May 2018; pp. 1483–1491. [Google Scholar]
  19. Alba, M.; Nabeel, M.; Dogan, N. Effect of aluminium content on the formation of inclusions in Fe–5Mn–xAl steels. Ironmak. Steelmak. 2020, 1–8. [Google Scholar] [CrossRef]
  20. Alba, M.; Nabeel, M.; Dogan, N. Effect of Nitrogen Content on the Formation of Inclusions in Fe-5Mn-3Al Steels. Crystals 2020, 10, 836. [Google Scholar] [CrossRef]
  21. Paek, M.-K.; Jang, J.-M.; Jiang, M.; Pak, J.-J. Thermodynamics of AlN Formation in High Manganese-Aluminum Alloyed Liquid Steels. ISIJ Int. 2013, 53, 973–978. [Google Scholar] [CrossRef] [Green Version]
  22. Turkdogan, E.T. Fundamentals of Steelmaking; The Institute of Materials: London, UK, 1996. [Google Scholar]
  23. Paek, M.-K.; Jang, J.-M.; Kang, H.-J.; Pak, J.-J. Reassessment of AlN(s)=Al+N Equilibration in Liquid Iron. ISIJ Int. 2013, 53, 535–537. [Google Scholar] [CrossRef] [Green Version]
  24. Bramfitt, B.L. The effect of carbide and nitride additions on the heterogeneous nucleation behavior of liquid iron. Met. Mater. Trans. A 1970, 1, 1987–1995. [Google Scholar] [CrossRef]
  25. Turnbull, D.; Vonnegut, B. Nucleation Catalysis. Ind. Eng. Chem. 1952, 44, 1292–1298. [Google Scholar] [CrossRef]
  26. Wang, F.; Fan, Z. Characterization of AlN Inclusion Particles Formed in Commercial Purity Aluminum. Met. Mater. Trans. A 2019, 50, 2519–2526. [Google Scholar] [CrossRef] [Green Version]
  27. Ohta, H.; Suito, H. Precipitation and Dispersion Control of MnS by Deoxidation Products of ZrO2, Al2O3, MgO and MnO–SiO2 Particles in Fe–10mass%Ni Alloy. ISIJ Int. 2006, 46, 480–489. [Google Scholar] [CrossRef] [Green Version]
  28. Sun, G.; Tao, S. Duplex Heterogeneous Nucleation Behavior of Precipitates in C-Mn Steel Containing Sn. Met. Mater. Trans. A 2018, 49, 519–523. [Google Scholar] [CrossRef]
  29. Tuling, A.; Mintz, B. Crystallographic and morphological aspects of AlN precipitation in high Al, TRIP steels. Mater. Sci. Technol. 2015, 32, 568–575. [Google Scholar] [CrossRef]
  30. Willems, H.; Hendrix, M.; De With, G.; Metselaar, R. Thermodynamics of Alon II: Phase relations. J. Eur. Ceram. Soc. 1992, 10, 339–346. [Google Scholar] [CrossRef] [Green Version]
  31. Dovidenko, K.; Oktyabrsky, S.; Narayan, J.; Razeghi, M. Aluminum nitride films on different orientations of sapphire and silicon. J. Appl. Phys. 1996, 79, 2439–2445. [Google Scholar] [CrossRef]
  32. Sun, C.J.; Kung, P.; Saxler, A.; Ohsato, H.; Haritos, K.; Razeghi, M. A crystallographic model of (00·1) aluminum nitride epitaxial thin film growth on (00·1) sapphire substrate. J. Appl. Phys. 1994, 75, 3964–3967. [Google Scholar] [CrossRef]
  33. Stefanescu, D.M.; Catalina, A.V. Calculation of the Critical Velocity for the Pushing/Engulfment Transition of Nonmetallic Inclusions in Steel. ISIJ Int. 1998, 38, 503–505. [Google Scholar] [CrossRef] [Green Version]
  34. Luo, Y.; Li, M.; Scheller, P.R.; Sridhar, S.; Zhang, L. Interaction Between Liquid Steel and AlN Substrate Containing Al-Y-Oxides. Met. Mater. Trans. A 2019, 50, 2459–2470. [Google Scholar] [CrossRef]
  35. Ohta, H.; Suito, H. Effect of Sulfur and Oxygen on Engulfment and Pushing of Deoxidation Particles of ZrO2 and Al2O3 during Solidification of Fe–10mass%Ni Alloy. ISIJ Int. 2006, 46, 472–479. [Google Scholar] [CrossRef] [Green Version]
  36. Shibata, H.; Yin, H.; Yoshinaga, S.; Emi, T.; Suzuki, M. In-situ Observation of Engulfment and Pushing of Nonmetallic Inclusions in Steel Melt by Advancing Melt/Solid Interface. ISIJ Int. 1998, 38, 149–156. [Google Scholar] [CrossRef] [Green Version]
  37. Mu, W.; Dogan, N.; Coley, K.S. Agglomeration of Non-metallic Inclusions at the Steel/Ar Interface: Model Application. Met. Mater. Trans. A 2017, 48, 2092–2103. [Google Scholar] [CrossRef]
  38. Keene, B.J. Slag Atlas, 2nd ed.; Verein Deutscher Eisenhüttenleute, Ed.; Verlag Stahleisen GmbH: Düsseldorf, Germany, 1995; p. 526. [Google Scholar]
  39. Slack, G.A.; Tanzilli, R.; Pohl, R.; Vandersande, J.W. The intrinsic thermal conductivity of AlN. J. Phys. Chem. Solids 1987, 48, 641–647. [Google Scholar] [CrossRef]
Figure 1. Typical examples of complex MnS inclusions, (a) Al2O3-MnS, (b) AlN-MnS, and (c) AlON-MnS.
Crystals 10 01054 g001
Figure 2. The number of complex MnS inclusions in air cooled samples (a) for varied Al content and (b) for varied N content of experimental steels.
Crystals 10 01054 g002
Figure 3. The number of complex MnS inclusions in furnace cooled samples of experimental steels.
Crystals 10 01054 g003
Figure 4. The composition of complex MnS inclusions observed in air cooled samples (a) varied Al content and (b) varied N content of experimental steels.
Crystals 10 01054 g004
Figure 5. The composition of complex MnS inclusions observed in furnace cooled samples of experimental steels.
Crystals 10 01054 g005
Figure 6. Comparison of MnS precipitation ratio of different types of inclusions in the air cooled samples (a) varied Al content and (b) varied N content of steel.
Crystals 10 01054 g006
Figure 7. Comparison of MnS precipitation ratio of different types of inclusions in the furnace cooled samples of experimental steels.
Crystals 10 01054 g007
Figure 8. The calculated correlation between critical velocity and size of inclusions for pushing/engulfment transition of Al2O3 and AlN inclusions.
Crystals 10 01054 g008
Table 1. The composition of experimental steels (wt %).
SteelMnAlSiCS
(ppm)
N
(ppm)
O
(ppm)
50.534.80.43.20.121.6<10<10
5134.80.93.20.126.0<10<10
5334.92.83.20.123.4<10<10
5635.25.73.20.129.5<10<10
533N-PLow N5.02.63.80.128<10<10
Medium N33<10
High N54<10
Table 2. Thermodynamic data for all the experimental steels.
SteelTsol (K)Tliq (K)TAlN (K)TMnS (K)
50.531647.31739.51585.61528.9
51316291739.51643.31499.6
5331619.41735.51696.71464.5
5631605.91722.11723.61466.7
533N-PLow N16111726.31679.11472.8
Medium N16111726.31865.41473.9
High N16111726.31879.51473.9
Table 3. The calculated solid fraction values for the formation of AlN.
50.53513533563533N-P
Low NMedium NHigh N
0.850.690.22-0.11--
Table 4. The lattice parameters used for misfit calculations [28,29].
InclusionLattice Parameters (Å)
abc
Al2O34.754.7512.99
AlN3.113.114.99
MnS5.245.245.24
Table 5. Parameters used for the calculation of critical velocity.
Al2O3ReferenceAlNReference
η (kg/ms)4 × 10−6[35]4 × 10⁻⁶[35]
γ P (J/m2)0.75[36]1.53-
γ L (J/m2)1.6[37]1.6[37]
γ S (J/m2)2.206[33]2.206[33]
γ P S (J/m2)2.56-3.49-
γ P L (J/m2)1.88-2.54[34]
θ P L 135[33]129[34]
W A D (J/m2)0.39[38]0.24[34]
Δ γ o 0.68-0.953-
k P (W/mK)5.5[33,36]24[39]
k L (W/mK)45[33,35]45[33,35]
a o (m)2.5 × 10⁻¹⁰[33]2.5 × 10⁻¹⁰[33]
The values without references are calculated using other data given in Table 5.
Publisher’s Note: MDPI stays neutral with regard to jurisdictional claims in published maps and institutional affiliations.

