Microwave-Employed Sol–Gel Synthesis of Scheelite-Type Microcrystalline AgGd(MoO4)2:Yb3+/Ho3+ Upconversion Yellow Phosphors and Their Spectroscopic Properties

 , , and
Abstract
1. Introduction
2. Experimental Procedure
3. Results and Discussion
4. Conclusions
Supplementary Materials
Author Contributions
Funding
Conflicts of Interest
References
- Wang, M.; Abbineni, G.; Clevenger, A.; Xu, S. Upconversion nanoparticles: Synthesis, surface modification and biological applications. Nanomed. Nanotech. Biol. Med. 2011, 7, 710–729. [Google Scholar] [CrossRef] [PubMed]
- Lin, M.; Zhao, Y.; Wang, S.; Liu, M.; Duan, Z.; Chen, Y.; Li, F.; Xu, F.; Lu, T.J. Recent advances in synthesis and surface modification of lanthanide-doped upconversion nanoparticles for biomedical applications. Biotechnol. Adv. 2012, 30, 1551–1561. [Google Scholar] [CrossRef] [PubMed]
- DaCosta, M.V.; Doughan, S.; Han, Y.; Krull, U.J. Lanthanide upconversion nanoparticles and applications in bioassays and bioimaging: A review. Anal. Chim. Acta 2014, 832, 1–33. [Google Scholar] [CrossRef] [PubMed]
- Zhou, J.; Liu, Q.; Feng, W.; Sun, Y.; Li, F. Upconversion luminescent materials: Advances and applications. Chem. Rev. 2015, 115, 395–465. [Google Scholar] [CrossRef]
- Atuchin, V.V.; Chimitova, O.D.; Gavrilova, T.A.; Molokeev, M.S.; Kim, S.J.; Surovtsev, N.V.; Bazarov, B.G. Synthesis, structural and vibrational properties of microcrystalline RbNd(MoO4)2. J. Cryst. Growth 2011, 318, 683–686. [Google Scholar] [CrossRef]
- Morozov, V.A.; Bertha, A.; Meert, K.W.; Van Rompaey, S.; Batuk, D.; Martinez, G.T.; Van Aert, S.; Smet, P.F.; Raskina, M.V.; Poelman, D.; et al. Incommesurate modulation and luminescence in the CaGd2(1−x)Eu2x(MoO4)4(1−y)(WO4)4y (0 ≤ x ≤ 1, 0 ≤ y ≤ 1) red phosphors. Chem. Mater. 2013, 25, 4387–4395. [Google Scholar] [CrossRef]
- Lim, C.S. Upconversion photoluminescence properties of SrY2(MoO4)4:Er3+/Yb3+ phosphors synthesized by a cyclic microwave-modified sol-gel method. Inf. Phys. Technol. 2014, 67, 371–376. [Google Scholar] [CrossRef]
- Shi, P.; Xia, Z.; Molokeev, M.S.; Atuchin, V.V. Crystal chemistry and luminescence properties of red-emittig CsGd1−xEux(MoO4)2 solid-solution phosphors. Dalton Trans. 2014, 43, 9669–9676. [Google Scholar] [CrossRef]
- Atuchin, V.V.; Aleksandrovsky, A.S.; Chimitova, O.D.; Gavrilova, T.A.; Krylov, A.S.; Molokeev, M.S.; Oreshonkov, A.S.; Bazarov, B.G.; Bazarova, J.G. Synthesis and spectroscopic properties of monoclinic α-Eu2(MoO4)2. J. Phys. Chem. C 2014, 118, 15404–15411. [Google Scholar] [CrossRef]
- Lim, C.S.; Aleksandrovsky, A.; Molokeev, M.; Oreshonkov, A.; Atuchin, V. The modulated structure and frequency upconversion properties of CaLa2(MoO4)4:Ho3+/Yb3+ phosphors prepared by microwave synthesis. Phys. Chem. Chem. Phys. 2015, 17, 19278–19287. [Google Scholar] [CrossRef] [PubMed]
- Cheng, F.; Xia, Z.; Jing, X.; Wang, Z. Li/Ag ratio dependent structure and upconversion photoluminescence of LixAg1−xYb0.99(MoO4)2:0.01Er3+ phosphors. Phys. Chem. Chem. Phys. 2015, 17, 3689–3696. [Google Scholar] [CrossRef]
- Lim, C.S. Highly modulated structure and upconversion photoluminescence properties of PbGd2(MoO4)4:Er3+/Yb3+ phosphors. Mater. Res. Bull. 2016, 75, 211–216. [Google Scholar] [CrossRef]
- Yakovlev, V.G.; Mikhailin, V.V.; Romanenko, A.Y.; Basovich, O.M.; Khaikina, E.G. Spectral-luminescent properties of AgLa1−xEux(MoO4)2 solid solutions. Mosc. Univ. Phys. Bull. 2009, 64, 519–522. [Google Scholar] [CrossRef]
- Benoît, G.; Véronique, J.; Arnaud, A.; Alain, G. Luminescence properties of tungstates and molybdates phosphors: Illustration on ALn(MO4)2 compounds (A = alikaline cation, Ln = lanthanides, M = W, Mo). Solid State Sci. 2011, 13, 460–467. [Google Scholar] [CrossRef]
- Li, T.; Guo, C.; Wu, Y.; Li, L.; Jeong, J.H. Green upconversion luminescence in Yb3+/Er3+ co-doped ALn(MoO4)2 (A = Li, Na and K.; Ln = La, Gd and Y). J. Alloys Compd. 2012, 540, 107–112. [Google Scholar] [CrossRef]
- Hou, L.; Cui, S.; Fu, Z.; Wu, Z.; Fu, X.; Jeong, J.H. Facile template free synthesis of KLa(MoO4)2: Eu3+,Tb3+ microspheres and their multicolor tunable luminescence. Dalton Trans. 2014, 43, 5382–5392. [Google Scholar] [CrossRef] [PubMed]
- Wang, Q.F.; Liu, Y.; Wang, Y.; Wang, W.; Wan, Y.; Wang, G.G.; Lu, Z.G. Considerable photoluminescence enhancement of LiEu(MoO4)2 red phosphors via Bi and/or Si doping for white LEDs. J. Alloys Compd. 2015, 625, 355–361. [Google Scholar] [CrossRef]
- Li, T.; Guo, C.; Zhou, S.; Duan, C.; Yin, M. Highly sensitive optical thermometry of Yb3+-Er3+codopedAgLa(MoO4)2 green upconversion phosphor. J. Am. Ceram. Soc. 2015, 98, 2812–2816. [Google Scholar] [CrossRef]
- Li, X.; Lin, Z.; Zhang, L.; Wang, G. Growth, thermal and spectral properties of Nd3+-doped NaGd(MoO4)2 crystal. J. Cryst. Growth 2006, 290, 670–673. [Google Scholar] [CrossRef]
- Zhou, W.W.; Wei, B.; Zhao, W.; Wang, G.F.; Bao, X.; Chen, Y.H.; Wang, F.W.; Du, J.-M.; Yu, H.-J. Intense yellow emission in Dy3+-doped LiGd(MoO4)2 crystal for visible lasers. Opt. Mater. 2011, 34, 56–60. [Google Scholar] [CrossRef]
- Yu, Y.; Zhang, L.; Huang, Y.; Lin, Z.; Wang, G. Growth, crystal structure, spectral properties and laser performance of Yb3+:NaLu(MoO4)2 crystal. Laser Phys. 2013, 23, 105807. [Google Scholar] [CrossRef]
- Lim, C.S.; Aleksandrovsky, A.S.; Molokeev, M.S.; Oreshonkov, A.S.; Atuchin, V.V. Microwave synthesis and spectroscopic properties of ternary scheelite-type molybdate phosphors NaSrLa(MoO4)2:Er3+,Yb3+. J. Alloys Compd. 2017, 713, 156–163. [Google Scholar] [CrossRef]
- Subbotin, K.A.; Titov, A.I.; Lis, D.A.; Sani, E.; Smirnov, V.A.; Alimov, O.K.; Zharikov, E.V.; Shcherbakov, I.A. Donor centers involved into the quantum cutting in ytterbium-doped scheelite-like crystals. Phys. Stat. Sol. A 2020, 217, 1900659. [Google Scholar] [CrossRef]
- Lim, C.S.; Aleksandrovsky, A.S.; Atuchin, V.V.; Molokeev, M.S.; Oreshonkov, A.S. Microwave so-gel synthesis, microstructural and spectroscopic properties of scheelite-type ternary molybdate upconversion phosphor NaPbLa(MoO4)2:Er3+,Yb3+. J. Alloys Compd. 2020, 826, 152095. [Google Scholar] [CrossRef]
- Kroutko, V.; Belik, A.; Lysanova, G.; Komova, M. ICDD Grant-In-Aid (2001), PDF Number: 53–42; Institute of General and Inorganic Chemistry RAS: Moscow, Russia, 2001. [Google Scholar]
- Wang, W.; Liu, N.; Du, Y.; Wang, Y.; Li, L.; Jiao, H. Up-conversion luminescence properties of Yb3+/Er3+ co-doped AgGd(W,Mo)2O8 phosphors. J. Alloys Compd. 2013, 577, 426–430. [Google Scholar] [CrossRef]
- Song, J.; Du, Y.; Xu, L.; Wei, H.; He, D.; Jiao, H. Synthesis of red-emitting AgGd0.9Eu0.1(MoO4)2 phosphors by precipitation at room temperature. J. Am. Ceram. Soc. 2014, 97, 1442–1449. [Google Scholar] [CrossRef]
- Auzel, F. Upconversion and anti-Stokes processes with f and d ions in solids. Chem. Rev. 2004, 104, 139–173. [Google Scholar] [CrossRef] [PubMed]
- Rybakov, K.I.; Olevsky, E.A.; Krikun, E.V. Microwave sintering: Fundamentals and modeling. J. Am. Ceram. Soc. 2013, 96, 1003–1020. [Google Scholar] [CrossRef]
- Kitchen, H.J.; Vallance, S.R.; Kennedy, J.L.; Tapia-Ruiz, N.; Carassiti, L.; Harrison, A.; Whittaker, A.G.; Drysdale, T.D.; Kingman, S.W.; Gregory, D.H. Modern microwave methods in solid-state inorganic materials chemistry: From fundamentals to manufacturing. Chem. Rev. 2014, 114, 1170–1206. [Google Scholar] [CrossRef]
- Lim, C.S. Cyclic MAM synthesis and upconversion photoluminescence properties of CaMoO4:Er3+/Yb3+ particles. Mater. Res. Bull. 2012, 47, 4220–4225. [Google Scholar] [CrossRef]
- Lim, C.S. Synthesis of SrMoO4:Er3+/Yb3+ particles by a cyclic MAM method and their upconversion photoluminescence properties. Mater. Res. Bull. 2013, 48, 3805–3810. [Google Scholar] [CrossRef]
- Lim, C.S.; Aleksandrovsky, A.; Molokeev, M.; Oreshonkov, A.; Atuchin, V. (Microwave sol-gel synthesis and upconversion photoluminescence properties of CaGd2(WO4)4:Er3+/Yb3+ phosphors with incommensurately modulated structure. J. Solid State Chem. 2015, 228, 160–166. [Google Scholar] [CrossRef]
- Lim, C.S.; Atuchin, V.V.; Aleksandrovsky, A.S.; Denisenko, Y.G.; Molokeev, M.S.; Oreshonkov, A.S. Fabrication of microcrystalline NaPbLa(WO4)3:Yb3+/Ho3+ phosphors and their upconversion photoluminescent characteristics. Korean J. Mater. Res. 2019, 29, 741–746. [Google Scholar] [CrossRef]
- Bruker AXS. TOPAS V4: General Profile and Structure Analysis Software for Powder Diffraction Data.—User’s Manual; Bruker AXS: Karlsruhe, Germany, 2008. [Google Scholar]
- Cheng, F.; Xia, Z.; Molokeev, M.S.; Jing, X. Effects of composition modulation on the luminescence properties of Eu3+ doped Li1−xAgxLu(MoO4)2 solid-solution phosphors. Dalton Trans. 2015, 44, 18078–18089. [Google Scholar] [CrossRef]
- McIlvried, M. ICDD Grant-In-Aid; Penn State University: University Park, PA, USA, 1973; pp. 25–828. [Google Scholar]
- Klevtsov, P.V.; Kozeeva, L.P. Synthesis of binary lithium molybdates containing rare earth elements and Y, Izv. Akad. Nauk SSSR. Neorg. Mater. 1969, 5, 1842–1843. (In Russian) [Google Scholar]
- Kolitsch, U. The crystal structures of phenacite-type Li2(MoO4), and scheelite-type LiY(MoO4)2 and LiNd(MoO4)2. Z. Kristallog 2001, 216, 449–454. [Google Scholar] [CrossRef]
- Savel’eva, M.V.; Shakhno, I.V.; Plyuschev, V.E.; Kotlyar, A.A. Investigation of interaction of molybdates sodium with molybdates of dysprosium, holmium, erbium. Izv. VUZ. Zvetnaya Metall. 1969, 2, 85–89. [Google Scholar]
- Mokhosoev, M.V.; Kockot, I.F.; Kononenko, I.S. Study of double molybdates of lanthanum and alkali metal with molybdates of alkali metals in melting. Russ. J. Inorg. Chem. (Engl. Transl.) 1970, 5, 271–274. [Google Scholar]
- Egorova, A.N.; Majer, A.A.; Nevskij, N.N.; Provotvorov, M.V. The crystal structure of LiCe(MoO4)2. Izv. Akad. Nauk Sssr Neorg. Mater. 1982, 18, 2036–2038. [Google Scholar]
- Perera, S.S.; Rabuffetti, F.A. NIR-to-NIR and NIR-to-blue light upconversion in stoichiometric NaYb(MO4)2 (M = Mo, W). Cryst. Eng. Comm. 2016, 18, 5818–5825. [Google Scholar] [CrossRef]
- Zhao, D.; Li, F.; Cheng, W.; Zhang, H. Scheelite-type NaEr(MoO4)2. Acta Cryst. 2010, 66, i36. [Google Scholar] [CrossRef]
- Stedman, N.J.; Cheetham, A.K.; Battle, P.D. Crystal structures of two sodium yttrium molybdates: NaY(MoO4)2 and Na5Y(MoO4)4. J. Mater. Chem. 1994, 4, 707–711. [Google Scholar] [CrossRef]
- Cortese, A.J.; Abeysinghe, D.; Smith, M.D.; zur Loye, H.C. Single crystal growth and characterization of NaxLn1−xMoO4, Ln=La, Ce, Pr, Nd, Sm, and Eu (x = 0.397–0.499). J. Solid State Chem. 2016, 240, 76–81. [Google Scholar] [CrossRef]
- Schleid, T.; Hartenbach, I. Scheelite-type sodium neodymium (III) ortho-oxidomolybdate (VI), NaNd[MoO4]2. Acta Cryst. E 2011, 67, i71. [Google Scholar] [CrossRef]
- Teller, R.G. Refinement of some Na0.5−xM’0.5+x/3□2x/3MoO4, M = Bi, Ce, La, scheelite structures with powder neutron and X-ray diffraction data. Acta Cryst. C 1992, 48, 2101–2104. [Google Scholar] [CrossRef]
- Stevens, S.B.; Morrison, C.A.; Allik, T.H.; Rheingold, A.L.; Haggerty, B.S. NaLa(MoO4)2 as a laser host material. Phys. Rev. B 1991, 43, 7386–7394. [Google Scholar] [CrossRef]
- Wanklyn, B.M.; Wondre, F.R. Flux growth of crystals of RKMo2O8, R2MoO6 and R6MoO12 in the systems R2O3-K2O-MoO3. J. Cryst. Growth 1978, 43, 93–100. [Google Scholar] [CrossRef]
- Klevtsov, P.V.; Kozeeva, L.P.; Pavlyuk, A.A. Polymorphism and crystallization of potassium-rare earth molybdates, KLn(MoO4)2 (Ln = La, Ce, Pr, Nd). Kristallografiya 1975, 20, 1216–1220. [Google Scholar]
- Kroutko, V.; Lysanova, G.; Komova, M. ICDD Grant-In-Aid 2003; PDF Number: 54-1222; PDF Number 54-1223; PDF Number: 54-1220; Institute of General and Inorganic Chemistry, RAS: Moscow, Russia, 2003. [Google Scholar]
- Kroutko, V.; Lysanova, G.; Komova, M. ICDD Grant-In-Aid 2002; PDF Number: 54-901; Institute of General and Inorganic Chemistry, RAS: Moscow, Russia, 2002. [Google Scholar]
- Shi, F.; Meng, J.; Ren, Y. Preparation structure and physical properties of new silver lanthanide molybdenum oxides [AgLnMo2O8 (Ln = La-Nd and Sm)]. Mater. Res. Bull. 1995, 30, 1401–1405. [Google Scholar] [CrossRef]
- Bushuev, N.N.; Trunov, V.K.; Gizhinsky, A.R. X-ray diffraction study of rare earth molybdates with the structure of KSm(MoO4)2. Russ. J. Inorg. Chem. 1973, 18, 2865–2866. (In Russian) [Google Scholar]
- Lim, C.S.; Atuchin, V.V.; Aleksandrovsky, A.S.; Molokeev, M.S.; Oreshonkov, A.S. Incommensurately modulated structure and spectroscopic properties of CaGd2(MoO4)4:Ho3+/Yb3+ phosphors for up-conversion applications. J. Alloys Compd. 2017, 695, 737–746. [Google Scholar] [CrossRef]
- Lim, C.S.; Aleksandrovsky, A.S.; Molokeev, M.S.; Oreshonkov, A.S.; Ikonnikov, D.A.; Atuchin, V.V. Triple molybdatescheelite-type unconversion phosphor NaCaLa(MoO4)3:Er3+/Yb3+: Structural and spectroscopic properties. Dalton Trans. 2016, 45, 15541–15551. [Google Scholar] [CrossRef] [PubMed]
- Kroumova, E.; Aroyo, M.I.; Perez-Mato, J.M.; Kirov, A.; Capillas, C.; Ivantchev, S.; Wondratschek, H. Bilbao crystallographic server: Useful databases and tools for phase-transition studies. Phase Transit. 2003, 76, 155–170. [Google Scholar] [CrossRef]


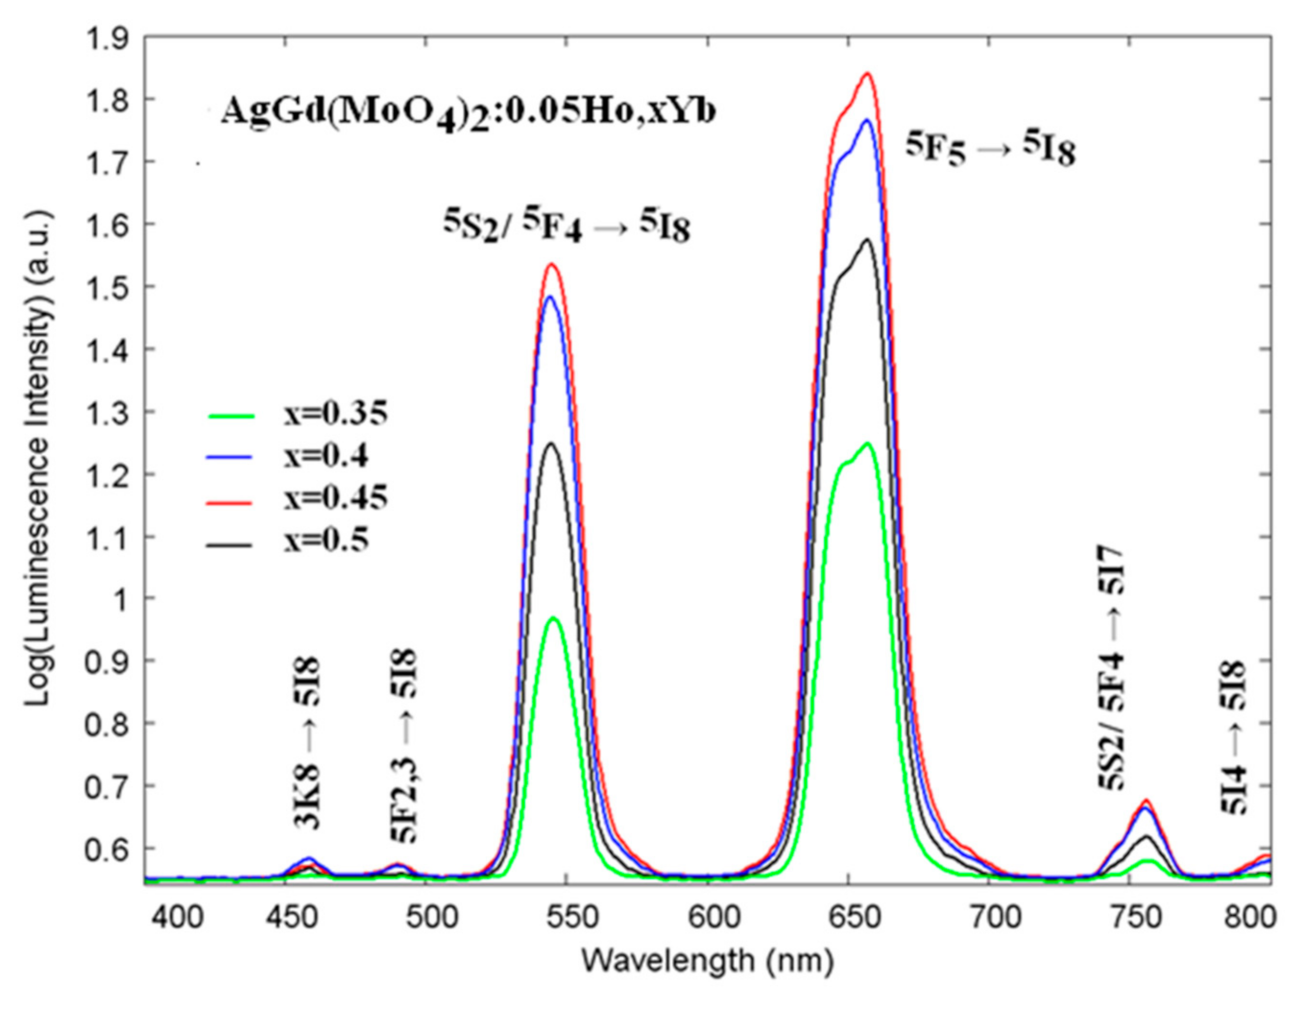
| Compound | AgGd(MoO4)2 | AgGd0.6Ho0.05 Yb0.35(MoO4)2 | AgGd0.55Ho0.05 Yb0.4(MoO4)2 | AgGd0.5Ho0.05 Yb0.45(MoO4)2 | AgGd0.45Ho0.05 Yb0.5(MoO4)2 |
|---|---|---|---|---|---|
| x | 0 | 0.05 | 0.05 | 0.05 | 0.05 |
| y | 0 | 0.35 | 0.4 | 0.45 | 0.5 |
| Sp.Gr. | I41/a | I41/a | I41/a | I41/a | I41/a |
| a, Å | 5.24782 (11) | 5.22237 (8) | 5.21802 (13) | 5.21598 (9) | 5.21239 (8) |
| c, Å | 11.5107 (3) | 11.4581 (2) | 11.4498 (3) | 11.4455 (2) | 11,4394 (3) |
| V, Å3 | 317.002 (17) | 312.497 (11) | 311.753 (18) | 311.392 (12) | 310,798 (12) |
| Z | 4 | 4 | 4 | 4 | 4 |
| 2θ-interval, º | 5–90 | 5–90 | 5–90 | 5–90 | 5–90 |
| Rwp, % | 19.23 | 16.50 | 21.86 | 16.64 | 16.06 |
| Rp, % | 11.91 | 9.71 | 15.08 | 10.55 | 9.61 |
| Rexp, % | 16.76 | 14.91 | 17.00 | 14.33 | 13.87 |
| RB, % | 3.14 | 1.93 | 8.65 | 2.50 | 2.31 |
| χ2 | 1.15 | 1.11 | 1.29 | 1.16 | 1.16 |
| x | y | z | Biso | Occ. | |
|---|---|---|---|---|---|
| AgGd(MoO4)2 | |||||
| Ag | 0 | 0.25 | 0.625 | 0.6 (3) | 0.5 |
| Gd | 0 | 0.25 | 0.625 | 0.6 (3) | 0.5 |
| Mo | 0 | 0.25 | 0.125 | 0.5 (3) | 1 |
| O | 0.242 (3) | 0.1068 (17) | 0.0408 (8) | 0.8 (4) | 1 |
| AgGd0.6Ho0.05Yb0.35(MoO4)2 | |||||
| Ag | 0 | 0.25 | 0.625 | 0.3 (3) | 0.5 |
| Gd | 0 | 0.25 | 0.625 | 0.3 (3) | 0.3 |
| Ho | 0 | 0.25 | 0.625 | 0.3 (3) | 0.025 |
| Yb | 0 | 0.25 | 0.625 | 0.3 (3) | 0.175 |
| Mo | 0 | 0.25 | 0.125 | 0.5 (3) | 1 |
| O | 0.237 (2) | 0.1015 (15) | 0.0394 (7) | 0.8 (4) | 1 |
| AgGd0.55Ho0.05Yb0.4(MoO4)2 | |||||
| Ag | 0 | 0.25 | 0.625 | 0.2 (3) | 0.5 |
| Gd | 0 | 0.25 | 0.625 | 0.2 (3) | 0.275 |
| Ho | 0 | 0.25 | 0.625 | 0.2 (3) | 0.025 |
| Yb | 0 | 0.25 | 0.625 | 0.2 (3) | 0.2 |
| Mo | 0 | 0.25 | 0.125 | 0.5 (3) | 1 |
| O | 0.240 (3) | 0.1043 (19) | 0.0412 (9) | 0.5 (4) | 1 |
| AgGd0.5Ho0.05Yb0.45(MoO4)2 | |||||
| Ag | 0 | 0.25 | 0.625 | 0.5 (3) | 0.5 |
| Gd | 0 | 0.25 | 0.625 | 0.5 (3) | 0.25 |
| Ho | 0 | 0.25 | 0.625 | 0.5 (3) | 0.025 |
| Yb | 0 | 0.25 | 0.625 | 0.5 (3) | 0.225 |
| Mo | 0 | 0.25 | 0.125 | 0.8 (2) | 1 |
| O | 0.238 (3) | 0.1010 (15) | 0.0393 (7) | 1.1 (4) | 1 |
| AgGd0.45Ho0.05Yb0.5(MoO4)2 | |||||
| Ag | 0 | 0.25 | 0.625 | 0.5 (3) | 0.5 |
| Gd | 0 | 0.25 | 0.625 | 0.5 (3) | 0.225 |
| Ho | 0 | 0.25 | 0.625 | 0.5 (3) | 0.025 |
| Yb | 0 | 0.25 | 0.625 | 0.5 (3) | 0.25 |
| Mo | 0 | 0.25 | 0.125 | 0.6 (3) | 1 |
| O | 0.239 (2) | 0.1041 (14) | 0.0393 (6) | 0.6 (4) | 1 |
| AgGd(MoO4)2 | |||
|---|---|---|---|
| (Ag/Gd)—Oi | 2.458 (12) | Mo—O | 1.765 (13) |
| (Ag/Gd)—Oii | 2.506 (12) | ||
| AgGd0.6Ho0.05Yb0.35(MoO4)2 | |||
| (Ag/Gd/Ho/Yb)—Oi | 2.494 (9) | Mo—O | 1.759 (9) |
| (Ag/Gd/Ho/Yb)—Oii | 2.457 (9) | ||
| AgGd0.55Ho0.05Yb0.4(MoO4)2 | |||
| (Ag/Gd/Ho/Yb)—Oi | 2.486 (13) | Mo—O | 1.751 (13) |
| (Ag/Gd/Ho/Yb)—Oii | 2.458 (12) | ||
| AgGd0.5Ho0.05Yb0.45(MoO4)2 | |||
| (Ag/Gd/Ho/Yb)—Oi | 2.486 (13) | Mo—O | 1.763 (12) |
| (Ag/Gd/Ho/Yb)—Oii | 2.451 (11) | ||
| AgGd0.45Ho0.05Yb0.5(MoO4)2 | |||
| (Ag/Gd/Ho/Yb)—Oi | 2.494 (9) | Mo—O | 1.758 (9) |
| (Ag/Gd/Ho/Yb)—Oii | 2.442 (8) | ||
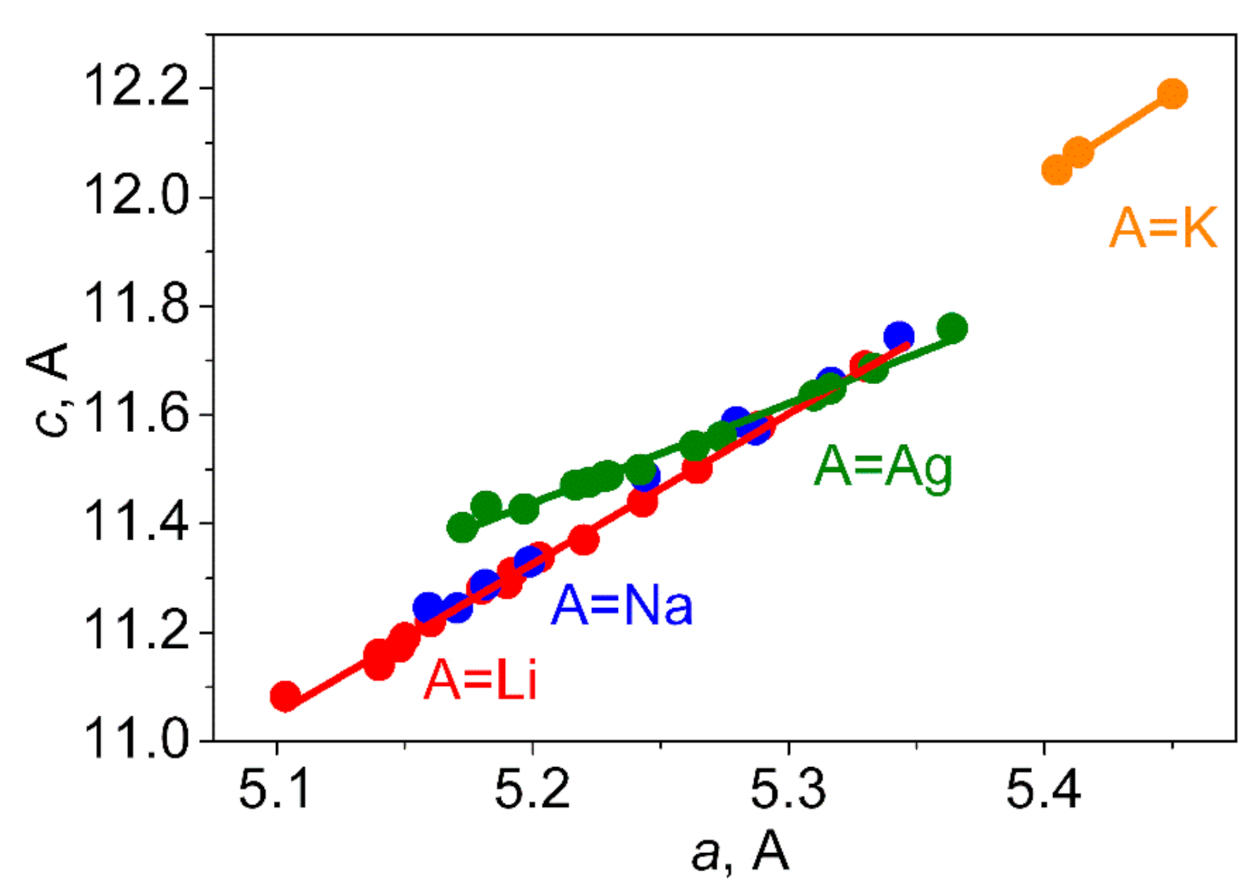
| A | B | a, Å | c, Å | V, Å3 | References |
|---|---|---|---|---|---|
| Li | Lu | 5.10332 | 11.0829 | 288.6417 | [36] |
| Li | Yb | 5.14 | 11.14 | 294.31 | [38] |
| Li | Tm | 5.14 | 11.16 | 294.84 | [38] |
| Li | Y | 5.148 | 11.173 | 296.106 | [39] |
| Li | Er | 5.15 | 11.19 | 296.79 | [38] |
| Li | Ho | 5.16 | 11.22 | 298.74 | [38] |
| Li | Dy | 5.18 | 11.28 | 302.67 | [38] |
| Li | Tb | 5.19 | 11.29 | 304.11 | [38] |
| Li | Gd | 5.192 | 11.31 | 304.88 | [40] |
| Li | Eu | 5.202625 | 11.33824 | 306.896 | [36] |
| Li | Sm | 5.22 | 11.37 | 309.81 | [40] |
| Li | Nd | 5.243 | 11.44 | 314.47 | [39] |
| Li | Pr | 5.2643 | 11.5011 | 318.728 | [41] |
| Li | Ce | 5.289 | 11.58 | 323.93 | [42] |
| Li | La | 5.33 | 11.69 | 332.10 | [38] |
| Na | Lu | 5.1593 | 11.246 | 299.350 | [21] |
| Na | Yb | 5.170642 | 11.2454 | 300.652 | [43] |
| Na | Er | 5.1816 | 11.288 | 303.07 | [44] |
| Na | Y | 5.1989 | 11.3299 | 306.231 | [45] |
| Na | Gd | 5.244 | 11.487 | 315.887 | [37] |
| Na | Eu | 5.2797 | 11.5869 | 322.988 | [46] |
| Na | Nd | 5.2871 | 11.5729 | 323.502 | [47] |
| Na | Ce | 5.3167 | 11.66 | 329.597 | [48] |
| Na | La | 5.3433 | 11.7432 | 335.278 | [49] |
| K | Pr | 5.405 | 12.05 | 352.03 | [50] |
| K | Ce | 5.4134 | 12.0821 | 354.065 | [51] |
| K | La | 5.45 | 12.19 | 362.07 | [49] |
| Ag | Lu | 5.172556 | 11.39257 | 304.812 | [36] |
| Ag | Yb | 5.1819 | 11.4317 | 306.965 | [52] |
| Ag | Tm | 5.1966 | 11.4271 | 308.585 | [52] |
| Ag | Ho | 5.2168 | 11.471 | 312.183 | [52] |
| Ag | Gd0.9Eu0.1 | 5.222 | 11.476 | 312.94 | [27] |
| Ag | Gd | 5.2282 | 11.4869 | 313.984 | [25] |
| Ag | Dy | 5.2296 | 11.4883 | 314.190 | [53] |
| Ag | Tb | 5.242 | 11.4995 | 315.990 | [52] |
| Ag | Eu | 5.26334 | 11.54333 | 319.782 | [36] |
| Ag | Sm | 5.2739 | 11.56 | 321.53 | [54] |
| Ag | Nd | 5.3099 | 11.6352 | 328.055 | [54] |
| Ag | Pr | 5.3164 | 11.648 | 329.220 | [54] |
| Ag | Ce | 5.3333 | 11.686 | 332.398 | [54] |
| Ag | La | 5.364 | 11.7588 | 338.330 | [54] |
| Free Ion Td | Site S4 | Factor Group C4h |
| ν1, (A1) | A | Ag + Bu |
| ν2, (A1) | A+B | Ag + Bu + Au + Bg |
| ν3, ν4 (T2) | B+E | Au + Bg + Eg + Eu |
| Free ion Td | Site S4 | Factor Group S4 |
| ν1, (A1) | A | A |
| ν2, (A1) | A + B | A + B |
| ν3, ν4 (T2) | B + E | B + E |
Publisher’s Note: MDPI stays neutral with regard to jurisdictional claims in published maps and institutional affiliations. |
© 2020 by the authors. Licensee MDPI, Basel, Switzerland. This article is an open access article distributed under the terms and conditions of the Creative Commons Attribution (CC BY) license (http://creativecommons.org/licenses/by/4.0/).
Share and Cite
Sung Lim, C.; Aleksandrovsky, A.; Atuchin, V.; Molokeev, M.; Oreshonkov, A. Microwave-Employed Sol–Gel Synthesis of Scheelite-Type Microcrystalline AgGd(MoO4)2:Yb3+/Ho3+ Upconversion Yellow Phosphors and Their Spectroscopic Properties. Crystals 2020, 10, 1000. https://doi.org/10.3390/cryst10111000
Sung Lim C, Aleksandrovsky A, Atuchin V, Molokeev M, Oreshonkov A. Microwave-Employed Sol–Gel Synthesis of Scheelite-Type Microcrystalline AgGd(MoO4)2:Yb3+/Ho3+ Upconversion Yellow Phosphors and Their Spectroscopic Properties. Crystals. 2020; 10(11):1000. https://doi.org/10.3390/cryst10111000
Chicago/Turabian StyleSung Lim, Chang, Aleksandr Aleksandrovsky, Victor Atuchin, Maxim Molokeev, and Aleksandr Oreshonkov. 2020. "Microwave-Employed Sol–Gel Synthesis of Scheelite-Type Microcrystalline AgGd(MoO4)2:Yb3+/Ho3+ Upconversion Yellow Phosphors and Their Spectroscopic Properties" Crystals 10, no. 11: 1000. https://doi.org/10.3390/cryst10111000
APA StyleSung Lim, C., Aleksandrovsky, A., Atuchin, V., Molokeev, M., & Oreshonkov, A. (2020). Microwave-Employed Sol–Gel Synthesis of Scheelite-Type Microcrystalline AgGd(MoO4)2:Yb3+/Ho3+ Upconversion Yellow Phosphors and Their Spectroscopic Properties. Crystals, 10(11), 1000. https://doi.org/10.3390/cryst10111000