Abstract
Tuning the electrical properties of materials by controlling their doping content has been utilized for decades in semiconducting oxides. Here, an atomistic view is successfully employed to obtain local information on the charge distribution and point defects in Cd-doped SnO2. We present a study that uses the time-differential perturbed gamma–gamma angular correlations (TDPAC) method in samples prepared by using a sol–gel approach. The hyperfine field parameters are presented as functions of the annealing temperature in pellet samples to show the evolution of incorporating Cd dopants into the crystal lattice. Additionally, the system was characterized with X-ray fluorescence, electron dispersive spectroscopy, and scanning electron microscopy after the probe nuclei 111In(111Cd) decayed. The TDPAC results reveal that the probe ions were incorporated into two different local environments of the SnO2 lattice at temperatures up to 973 K for cation substitutional sites.
1. Introduction
Stannic oxides crystalize in a rutile structure with a tetragonal lattice of space group P42/mnm. As these are semiconductor oxides, their bandgap is approximately Eg ~ 3.6eV Compared with other oxides, these have a higher transparency over the visible range and a higher electrical conductivity. Furthermore, stannic oxides present a good chemical stability with high melting and boiling points with low production costs. These can be applied as gas sensors, humidity sensors, and transparent electrodes for solar cells, varistors, optoelectronic devices, capacitors, flat-panel displays, high capacity anodes in lithium-ion batteries, and many other electronic device applications [1,2,3].
In this system, defects and small concentrations of impurity dopants affect the SnO2 conductivity over several orders of magnitude, which is particularly sensitive to the presence of oxygen and interstitial Sn vacancies [1]. For example, the addition of iridium to SnO2 improve the electrochemical properties of this material result in good electrodes for electrocatalysis [4,5,6].
The replacement of Sn4+ by a metal with a smaller valence state can induce the formation of oxygen vacancies, thus improving the sensor efficiency of SnO2. In this sense, Cd2+ doping in stannic oxide decreases its resistivity and enhances its molecular sensing performance, particularly for ethanol and H2 [7]. Sensing H2S is enhanced by more than 20 times compared with pure SnO2 [8]. It is clear that metal ion doping’s effectiveness and associated manufacturing processes in SnO2 are very complex and necessitate an atomistic view. Therefore, we have applied the time-differential perturbed angular correlations (TDPAC) method with gamma rays to better understand the influence of Cd as a dopant in the proposed system.
The influence of the implantation process for Co-doped SnO2 thin films was studied by using the TDPAC technique by presenting indirect evidence that In and Co diffuse to different depths during the annealing process [9]. The possibility of achieving electrical doping via Cd/In ion implantation in SnO2 thin films was investigated by using TDPAC in non-pre-doped samples and ab initio simulations [10].
Experiments that were carried out with TDPAC for SnO2 began in the late eighties. Desimoni et al. (1987) studied the incorporation of In from an 111InCl3 solution while forming SnO2 from the oxidation of Sn metal during annealing treatments [11]. They reported two different local environments. The first was at the substitutional site for 111In in the sample that was subject to an intense defect distribution centered at ωQ = 35.6 (1.8) Mrad/s with η = 0.40. The second was assigned to a minor component characterized by ωQ =17.2 (0.6) Mrad/s with η = 0.77 and was interpreted as small In2O3 precipitates. Renteria et al. (1991) performed TDPAC experiments on SnO2 thin films by using an 111In/Cd probe and identified the two Sn 2+ and 4+ oxidation states for different SnO and SnO2 phases [12]. The nuclear quadrupole interactions with vQ1 = 117(1) MHz and η = 0.18(2) were assigned to In/Cd at defect-free lattice sites of SnO2, which agreed with previous results obtained by Wolf et al. (1986) in powder samples [13]. Later, Ramos et al. (2010) [14] and (2013) [15] reported two local environments for 111In probe atoms in thin films and nano-structured powder SnO2 samples, as characterized by the hyperfine parameters νQ1 = 115 MHz and η ∼ 0.1 that were assigned to 111In probe atoms at substitutional Sn sites and νQ2 = 146 MHz and 0, 4 ≤ η ≤ 1, as assigned to defects and a disordered SnO2 phase. Munoz et al. (2008) performed TDPAC measurements with SnO pellets after 111In diffusion and observed a single major fraction for Cd in a neutral charge state [16]. On the other hand, the other fraction was also assigned to the cation-site, but this was done so in a charge state of q = +1. More recently, a study was published that combined the dynamic and static quadrupole interactions, and this was called an on–off model [17]. The measurements were complemented with ab-initio calculations.
This work uses the γ–γ TDPAC method to measure the hyperfine parameters in SnO2 samples that are doped with 1.4% Cd by using a sol–gel approach, which complements previous systematic investigations of structural defects from an atomic perspective [18]. It is acknowledged that these TDPAC measurements have not been previously conducted.
2. TDPAC Methodology
This section briefly describes the TDPAC methodology; further details can be found in references [19,20]. The TDPAC technique is based on the correlation between the nuclear spin of the excited level of the probe nuclei and the emission direction of gamma radiation that is modulated by the hyperfine interactions with extra nuclear magnetic field and/or electric field gradient (EFG) from the electronic neighborhood. The electric hyperfine interaction can be written in terms of the major component of the electric field gradient (Vzz) and the asymmetry parameter η = (Vxx − Vyy)/Vzz, which describes the asymmetry of the electric field gradient (EFG) tensor. From the TDPAC measurements, it is possible to obtain the perturbation function that takes into account the fractional site population fi of probe nuclei and its respective perturbation factor which describes the hyperfine interaction. A22 is the anisotropy of the γ–γ cascade of the probe nuclei that was used in the measurements. The electric quadrupole interaction perturbation factor, for polycrystalline samples while considering the nuclear spin 5/2 and , is given as shown in Equation (1).
Furthermore, the major component of the EFG tensor Vzz can be obtained by the observable spin dependent quadrupole frequency , expressed as:
with Q being the nuclear quadrupole moment. The EFG is primarily determined by the electrons involved in the bonding with the nearest neighbors. For 5/2 nuclear spins, the transition frequencies are given by . The coefficients and (including S0) can be numerical calculated for a known . The broadness of frequency distribution is parametrized with , and, for the quadrupole electric interaction, Lorentz broadening is assumed.
3. Experimental Methods
The Cd-doped SnO2 powder samples were prepared by using a sol–gel process. The detailed preparation procedure and the TDPAC results of the nanostructured SnO2 powder without doping can be found in our previous work [14]. We emphasize that the addition of 111In and Cd was performed before the gel formation with a 1.4% Cd content. The thermal treatment under a nitrogen atmosphere was performed for 10 h prior to the TDPAC measurements. The system was further characterized at the Laboratório de Caracterização Tecnológica (LCT), University of Sao Paulo, Brazil, after the probe nuclei 111In(111Cd) decayed by using X-ray diffraction (Philips Xpert and Malvern Panalytical Ltd., Kassel, Germany), electron dispersive spectroscopy (EDS) (FEI (Quanta 650FEG), Hillsboro, OR, USA), and scanning electron microscopy (SEM) (FEI (Quanta 650FEG), Hillsboro, OR, USA), for the secondary electrons (SE) mode.
4. Experimental Results
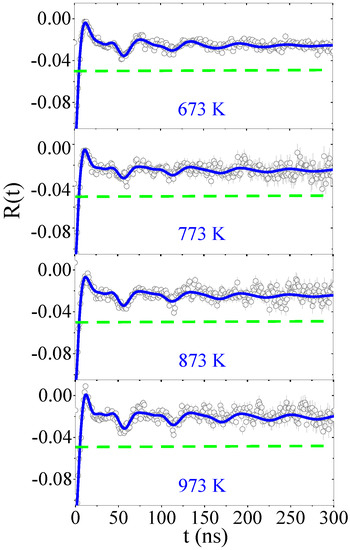
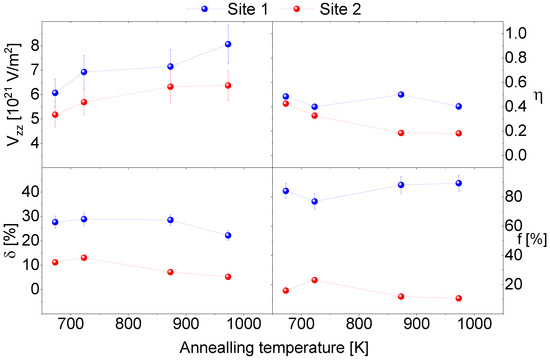
Figure 1 shows the 111In(111Cd) TDPAC R(t) spectra for the 1.4% Cd-doped SnO2 powder samples; these measurements were carried out at room temperature (RT). The measurements were performed as a function of annealing temperature from 295 to 973 K in vacuum. The R(t) spectra attenuated much more than observed in the spectra that were obtained from the thin film and the undoped powder sample [14,15]. Figure 2 shows the temperature dependence of the corresponding measured hyperfine parameters.

Figure 1.
Time-differential perturbed gamma–gamma angular correlations (TDPAC) spectra measured at room temperature (RT) as a function of the annealing temperature for SnO2 powder samples. The continuous blue curves are the fit of theoretical model based on Equation (1) to experimental data represented by the open circles with error bars. The green dashed horizontal lines are guides to the eye for R(t)= −0.05.

Figure 2.
A graphic representation of the corresponding temperature dependence of the hyperfine parameters: the major component of the electric field gradient (EFG) (Vzz), the asymmetry parameter (η), the frequency distribution (δ), and the population of probe nuclei site fraction (f). Dotted lines are a guide for the eyes.
The fits followed a two fractions model with probes that interacted given the two main EFG1 and EFG2 distributions. The primary distribution, EFG1, was extremely damped and accounted for f1 > 80% of the 111In/Cd probes. The EFG1 and EFG2 increased with annealing temperature. The η1 was higher than η2. The decrease in the EFG distributions indicates that In progressively experienced a more regular local environment at higher annealing temperatures. Variations in the EFG parameters showed an irreversible annealing temperature dependence that suggests this process was due to a cumulative annealing effect. The temperature dependence of the parameters further confirms that the observed R(t) damping was primarily due to the random distribution of the 1.4% Cd atoms in the SnO2 provided by each 111In/Cd atom sitting at Sn substitutional sites. These experienced slightly different charge distribution environments, even if stable Cd atoms were several unit cells away from the radioactive species.
The EFG2 was observed to be nearly undamped after annealing at 873 and 973 K, which presented the minority fraction and was consistently assigned to lattice sites of an undoped SnO2 lattice. We believe that the low fraction of EFG2 occurred due to inhomogeneities of the non-radioactive Cd distribution in the sample.
A further indication of a continued diffusion of stable Cd was the decreases in the η, δ1 and δ2 parameters with the corresponding increase of f1. This reveals that stable Cd was more uniformly distributed and into zones where it was not previously seen, such as a more regular local environment.
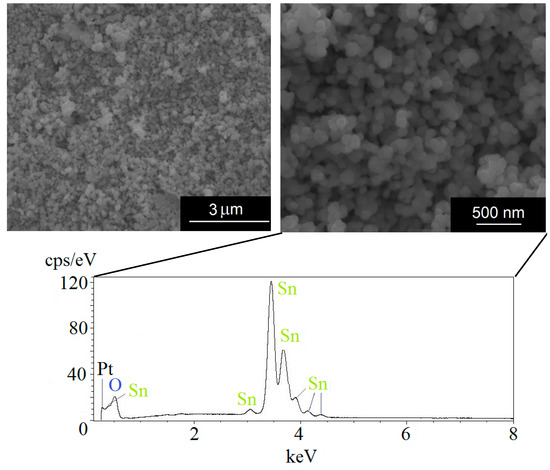
Figure 3 (top; left and right) shows micrographs for the secondary electrons (SE) mode of the powder samples under a high vacuum at two magnifications (scale bars in the figure) taken at a 10 kV accelerating voltage. The bottom figure is an EDS spectrum with no indication that Cd exists in the analyzed region. A Pt cover was used to increase the conductivity for the SEM imaging. The 1.4% Cd doping was only detected by using the X-ray fluorescence technique. A spectrometer (Axios Advanced from PANalytical) was used, as it can identify chemical elements from beryllium to uranium with a 10 ppm detection limit.

Figure 3.
(Above) SEM micrographs showing the homogeneity of particles regarding shape and size. (Below) electron dispersive spectroscopy (EDS) analysis spectrum of the 500 nm region for the SnO2 sample doped with 1.4% Cd.
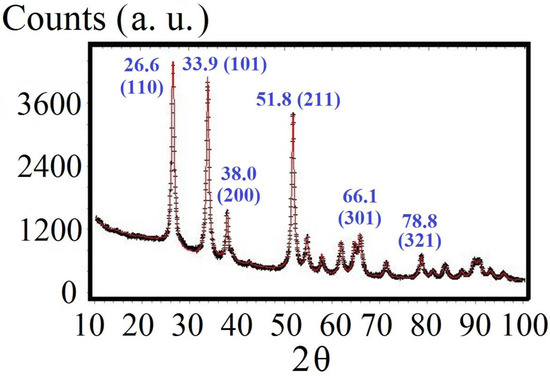
Figure 4 shows the XRD patterns that suggest the SnO2 followed a characteristic rutile crystalline structure without other detectable phases. The nanoparticle sizes were obtained from the Debye–Scherrer equation as 26 nm for the Cd-doped samples. Table 1 shows the obtained lattice parameters, which are close to those obtained as reported by Bolzan et al. (1997) [21]. The slight difference in the lattice parameters was an effect of the Cd doping that shifted the distance between the crystallographic planes. The expansion observed in the Cd-doped SnO2 can be ascribed to the replacement of Sn atoms by Cd due to the larger ionic radius of Cd2+ than that of Sn4+, as reported by Ahmad et al. [22].

Figure 4.
XRD Spectrum of the SnO2 samples (doped with 1.4% of Cd) that were produced by using the sol–gel method. The index of the most intense peaks are given.

Table 1.
Lattice parameters obtained from the XRD technique for pure SnO2 samples [21] or doped with Cd by using the sol–gel method.
The TDPAC technique with 111In(111Cd) or other atomic probes provides increasingly useful and important information of local environments in condensed matter systems [23]. Additional experiments with 111mCd can be performed to better understand the influence of electron capture nuclear transmutation for the 111In probe of the examined samples. The measurements could be subjected to the electron conversion process, which is part of the 111mCd probe decay. This probe can be implanted at ISOLDE-CERN [19] within their solid-state physics program [24]. Moreover, it is possible to perform simultaneous 111In and 111mCd implantations [25].
5. Conclusions
It is clear from the TDPAC experiments that the atomistic behavior of Cd dopants strongly depends on the sample doping process. The Cd content, crystal lattice structure, and sample morphology were confirmed by using conventional characterization techniques. Based on the thermal treatments, one local environment was assigned to the Cd atoms at substitutional Sn sites, which were nearly free of point defects in their local neighborhoods. Segregation was not observed for the Cd-doped powder samples with an apparent increase in the stability of the incorporated Cd as a function of annealing temperature. The selected thermal treatment could play the role of decreasing the oxygen vacancies and reducing the mobility of Cd atoms. This enables the possibility of achieving electrical doping via the sol–gel method.
Author Contributions
The measurements and data analysis were performed by J.S. supervised by A.W.C. The manuscript was written by J.S. with contributions of T.T.D. and A.W.C. All authors have read and agreed to the published version of the manuscript.
Funding
This research was funded from the Federal Ministry of Education and Research (BMBF) through grant 05K16PGA and from the DAAD/CNPq through grant 290102/2011-1. AWC kindly thanks the support of Fundação de Amparo à Pesquisa do Estado de São Paulo (FAPESP) by the grant 2018/18657-0 and Conselho Nacional de Desenvolvimento Científico e Tecnológico (CNPq) for the support through grant 304627/2017-8.
Conflicts of Interest
The authors declare no conflict of interest.
References
- Kiliç, Ç.; Zunger, A. Origins of coexistence of conductivity and transparency in SnO2. Phys. Rev. Lett. 2002, 88, 095501. [Google Scholar] [CrossRef] [PubMed]
- Wang, L.; Li, J.; Wang, Y.; Yu, K.; Tang, X.; Zhang, Y.; Wang, S.; Wei, C. Construction of 1D SnO2-coated ZnO nanowire heterojunction for their improved n-butylamine sensing performances. Nat. Sci. Rep. 2016, 6, 35079. [Google Scholar] [CrossRef] [PubMed]
- Liu, M.; Liu, Y.; Zhang, Y.; Li, Y.; Zhang, P.; Yan, Y.; Liu, T. Octahedral tin dioxide nanocrystals anchored on vertically aligned carbon aerogels as high capacity anode materials for lithium-ion batteries. Nat. Sci. Rep. 2016, 6, 31496. [Google Scholar] [CrossRef] [PubMed]
- Marshall, A.; Børresen, B.; Hagenm, G.; Tsypkin, M.; Tunold, R. Preparation and characterisation of nanocrystalline IrxSn1−xO2 electrocatalytic powders. Mater. Chem. Phys. 2005, 94, 226–232. [Google Scholar] [CrossRef]
- Ribeiro, J.; Alves, P.D.P.; de Andrade, A.R. Effect of the preparation methodology on some physical and electrochemical properties of Ti/IrxSn(1−x)O2 materials. J. Mater. Sci. 2007, 42, 9293–9299. [Google Scholar] [CrossRef]
- Ardizzone, S.; Bianchi, C.L.; Borgese, L.; Cappelletti, G.; Locatelli, C.; Minguzzi, A.; Rondinini, S.; Vertova, A.; Ricci, P.C.; Cannas, C.; et al. Physico-chemical characterization of IrO2–SnO2 sol-gel nanopowders for electrochemical applications. J. Appl. Electrochem. 2009, 39, 2093–2105. [Google Scholar] [CrossRef]
- Tianshu, Z.; Hing, P.; Li, Y.; Jiancheng, Z. Selective detection of ethanol vapor and hydrogen using Cd-doped SnO2-based sensors. Sens. Actuators B Chem. 1999, 60, 208–215. [Google Scholar] [CrossRef]
- Sun, P.; Zhou, X.; Wang, C.; Wang, B.; Xu, X.; Lu, G. One-step synthesis and gas sensing properties of hierarchical Cd-doped SnO2 nanostructures. Sens. Actuators B Chem. 2014, 190, 32–39. [Google Scholar] [CrossRef]
- Schell, J.; Lupascu, D.C.; Carbonari, A.W.; Mansano, R.D.; Dang, T.T.; Vianden, R. Implantation of cobalt in SnO2 thin films studied by TDPAC. AIP Adv. 2017, 7, 055304. [Google Scholar] [CrossRef]
- Schell, J.; Lupascu, D.C.; Carbonari, A.W.; Mansano, R.D.; Freitas, R.S.; Goncalves, J.N.; Dang, T.T.; ISOLDE Collaboration; Vianden, R. Cd and In-doping in thin film SnO2. J. Appl. Phys. 2017, 121, 195303. [Google Scholar] [CrossRef]
- Desimoni, J.; Bibiloni, A.G.; Mendoza-Zélis, L.A.; Damonte, L.C.; Sanchez, F.H.; Lopez-Garcia, A. Tdpac studies in the semiconductors SnO2 and Cu2O. Hyperfine Interact. 1987, 34, 271–275. [Google Scholar] [CrossRef]
- Renteria, M.; Bibiloni, A.G.; Moreno, M.S.; Desimoni, J.; Mercader, R.C.; Bartos, A.; Uhrmacher, M.; Lieb, K.P. Hyperfine interactions of 111In-implanted tin oxide thin films. J. Phys. Condens. Matter 1991, 9, 3625. [Google Scholar]
- Wolf, H.; Deubler, S.; Forkel, D.; Foettinger, H.; Iwatschenko-Borho, M.; Meyer, M.; Rem, M.; Witthuhn, W. Acceptors and Donors in the Wide-Gap Semiconductors ZnO and SnO2. Mater. Sci. Forum 1986, 10, 863–868. [Google Scholar] [CrossRef]
- Ramos, J.M.; Carbonari, A.W.; Costa, M.S.; Saxena, R.N. Electric quadrupole interactions in nano-structured SnO2 as measured with PAC spectroscopy. Hyperfine Interact. 2010, 197, 239–243. [Google Scholar] [CrossRef]
- Ramos, J.M.; Martucci, T.; Carbonari, A.W.; Costa, M.S.; Saxena, R.N.; Vianden, R. Electric field gradient in nanostructured SnO2 studied by means of PAC spectroscopy using 111 Cd or 181 Ta as probe nuclei. Hyperfine Interact. 2013, 221, 129–136. [Google Scholar] [CrossRef]
- Munoz, E.L.; Carbonari, A.W.; Errico, L.A.; Bibiloni, A.G.; Petrilli, H.; Renteria, M. TDPAC study of Cd-doped SnO. Hyperfine Interact. 2007, 178, 37. [Google Scholar] [CrossRef]
- Darriba, G.N.; Muñoz, E.L.; Carbonari, A.W.; Rentería, M. Experimental TDPAC and Theoretical DFT Study of Structural, Electronic, and Hyperfine Properties in (111In→) 111Cd-Doped SnO2 Semiconductor: Ab Initio Modeling of the Electron-Capture-Decay After-Effects Phenomenon. J. Phys. Chem. C 2018, 122, 17423–17436. [Google Scholar] [CrossRef]
- Schell, J.; Schell, J. Investigação de parâmetros hiperfinos dos óxidos semicondutores SnO2 e TiO2 puros e dopados com metais de transição 3d pela espectroscopia de correlação angular gama-gama perturbada. Available online: https://teses.usp.br/teses/disponiveis/85/85131/tde-24032015-135507/en.php (accessed on 19 February 2015).
- Schatz, G.; Weidinger, A. Nuclear Condensed Matter Physics: Nuclear Methods and Applications; Wiley: Chichester, UK, 1996. [Google Scholar]
- Abragam, A.; Pound, R.V. Influence of electric and magnetic fields on angular correlations. Phys. Rev. 1953, 92, 943. [Google Scholar] [CrossRef]
- Bolzan, A.A.; Fong, C.; Kennedy, B.J.; Howard, C.J. Structural studies of rutile-type metal dioxides. Acta Crystallogr. B 1997, 53, 373–380. [Google Scholar] [CrossRef]
- Ahmad, N.; Khan, S.; Ansari, M.M.N. Microstructural, optical and electrical transport properties of Cd-doped SnO2 nanoparticles. Mater. Res. Express 2018, 5, 035045. [Google Scholar] [CrossRef]
- Catherall, R.; Andreazza, W.; Breitenfeldt, M.; Dorsival, A.; Focker, G.J.; Gharsa, T.P.; Giles, T.; Grenard, J.-L.; Locci, F.; Martins, P.; et al. The ISOLDE facility. J. Phys. G 2017, 44, 094002. [Google Scholar] [CrossRef]
- Johnston, K.; Schell, J.; Correia, J.G.; Deicher, M.; Gunnlaugsson, H.P.; Fenta, A.S.; David-Bosne, E.; Costa, A.R.G.; Lupascu, D.C. The solid state physics programme at ISOLDE: Recent developments and perspectives. J. Phys. G Nucl. Part. Phys. 2017, 44, 104001. [Google Scholar] [CrossRef]
- Schell, J.; Lupascu, D.C.; Correia, J.G.M.; Carbonari, A.W.; Deicher, M.; Barbosa, M.B.; Mansano, R.D.; Johnston, K.; Ribeiro, I.S., Jr.; ISOLDE Collaboration. In and Cd as defect traps in titanium dioxide. Hyperfine Interact. 2017, 238, 2. [Google Scholar] [CrossRef]
© 2020 by the authors. Licensee MDPI, Basel, Switzerland. This article is an open access article distributed under the terms and conditions of the Creative Commons Attribution (CC BY) license (http://creativecommons.org/licenses/by/4.0/).