Article

Kinetic Study Based on the Carbide Mechanism of a Co-Pt/γ-Al2O3 Fischer–Tropsch Catalyst Tested in a Laboratory-Scale Tubular Reactor

1
Politecnico di Torino, Dipartimento di Energia, Corso Duca degli Abruzzi 24, 10129 Torino, Italy
2
VTT Technical Research Centre of Finland Ltd, PL 1000, 02044 VTT, Finland
*
Author to whom correspondence should be addressed.
Catalysts 2019, 9(9), 717; https://doi.org/10.3390/catal9090717
Submission received: 15 July 2019 / Revised: 13 August 2019 / Accepted: 21 August 2019 / Published: 26 August 2019

Abstract

:
A Co-Pt/γ-Al2O3 catalyst was manufactured and tested for Fischer–Tropsch applications. Catalyst kinetic experiments were performed using a tubular fixed-bed reactor system. The operative conditions were varied between 478 and 503 K, 15 and 30 bar, H2/CO molar ratio 1.06 and 2.11 at a carbon monoxide conversion level of about 10%. Several kinetic models were derived, and a carbide mechanism model was chosen, taking into account an increasing value of termination energy for α-olefins with increasing carbon numbers. In order to assess catalyst suitability for the determination of reaction kinetics and comparability to similar Fischer–Tropsch Synthesis (FTS) applications, the catalyst was characterized with gas sorption analysis, temperature-programmed reduction (TPR), and X-ray diffraction (XRD) techniques. The kinetic model developed is capable of describing the intrinsic behavior of the catalyst correctly. It accounts for the main deviations from the typical Anderson-Schulz-Flory distribution for Fischer–Tropsch products, with calculated activation energies and adsorption enthalpies in line with values available from the literature. The model suitably predicts the formation rates of methane and ethylene, as well as of the other α-olefins. Furthermore, it properly estimates high molecular weight n-paraffin formation up to carbon number C80.

1. Introduction

The need for reducing the impact of industrial activities on the environment has led to the deployment of several technologies capable of favoring a fast transition towards a circular and fossil-free economy [1]. Among them, the Fischer–Tropsch Synthesis (FTS) can contribute to the transition away from fossil resources. The FTS is an exothermal reaction that converts CO and H2 into intermediates suitable for synthetic fuels and chemicals by means of a solid catalyst. The reaction yields a wide range of hydrocarbons of carbon number C1–C100 (i.e., paraffins, olefins, alcohols, and isomer compounds) [2,3]. These hydrocarbons can be further refined to transportation fuels such as gasoline, diesel, and jet fuels, or to more valuable chemicals, e.g., raw materials for additives used in paints, coatings, or sealants [4,5]. Regardless of the final application, it is beneficial to maximize heavy hydrocarbon production, as heavy hydrocarbons could be used as such or hydrocracked into specific lighter fractions. Moreover, the FTS can be part of Power-to-Liquid or Biomass-to-Liquid pathways. Conventional fossil-based syngas sources, such as natural gas or coal, are substituted with hydrogen produced with renewable electricity by water electrolysis, while the carbon source originates from biomass, CO2 air capture, or, more likely, industrial flue gases [6,7,8]. Hence, captured carbon dioxide is reduced to CO and fed to the FTS unit contributing to the mitigation of greenhouse gas emissions [9,10].
There is a dependency between product distribution and the selected catalyst. Several metals are active in FT reaction, such as nickel (Ni), ruthenium (Ru), cobalt (Co), and iron (Fe). Shafer et al. [11] recently tested different types of catalysts in a continuously stirred tank reactor, showing how each metal-based catalyst results in dissimilar product selectivity. They found out that Co and Ru catalysts were more selective towards n-paraffins and α-olefins, while the Fe catalyst would be responsible for the synthesis of a higher amount of branched isomers. Similar to cobalt, Ru tends to have high activity under FTS conditions and good selectivity towards high molecular weight waxes. Disadvantages are the high price and scarcity which make Ru unfavourable for industrial applications. Nickel is an inexpensive catalyst compared to Co and Ru. However, it has the tendency to promote undesired methanation easily [12]. Fe-based catalysts are employed for the synthesis of lighter FTS products [3], while Co-based catalysts have proven to be the most effective in promoting longer chain hydrocarbons [13]. Furthermore, Co exhibits lower activity towards the water-gas-shift reaction compared to Fe catalysts. Such a reaction counteracts the benefits of the FTS in terms of CO conversion to useful products [14,15].
Activity tests and kinetic modeling can provide useful information about catalyst performance in terms of activation energies and product selectivity [16,17]. Different methodologies have been applied to perform kinetic studies on FTS and are described in the open literature. Power law expressions are widely used to describe the consumption of the syngas reactants [18,19,20]. Two recent studies by Moazami et al. [21] and Ostadi et al. [22] provide a summary of this typology of rate equations. Selectivity models can instead provide a higher amount of information. Specifically, they focus on the description of the FTS reactant consumption and cluster the products into two to five groups of carbon numbers [22]. For instance, Moazami et al. [23] derived a selectivity model for a Co/SiO2 catalyst, studied in terms of CO conversion and selectivity towards carbon dioxide, methane, C2, C3, C4, and C5+. Finally, mechanistic models can provide a thoughtful set of information about the catalyst, ranging from reactants consumption rates to product selectivity, and can unveil evidence about the prevailing reaction mechanism evolving over the catalytic surface. Thus, numerous mechanistic models have been proposed to describe the FTS product formation [17,21,24,25,26,27,28]. Such kinetic models differ from each other depending on the chain initiation, the termination steps, and the hydrocarbon building units (i.e., CO insertion [17], carbide [27], enolic [29], and alkenyl [30] mechanisms). The carbide mechanism, also known as the CH2 insertion mechanism, is one of the most widely used formulations. This mechanism was first proposed by Fischer and Tropsch [31], and it postulates the dissociation of CO and H2 onto the catalyst surface, and later, the hydrogenation to the group CHx, the building block responsible for the chain growth [25].
Alongside the studies on reaction mechanisms, much research effort has also been spent on finding an effective description of the deviations from the Anderson-Schulz-Flory (ASF) distribution (i.e., higher methane selectivity than expected, lower ethylene selectivity, increasing chain growth probability, and decreasing olefin-to-paraffin ratio with increasing carbon number). The most commonly accepted explanations are the different activation energies for CH4 and C2H4 from the other paraffins and olefins [32], the accumulation of heavy compounds in the reactor system [33], and the presence of secondary reactions after termination steps [34]. This last group typically involves olefinic compounds, and the suggested mechanisms comprise of either α-olefin re-adsorption and their latter hydrogenation, or chain-length dependent α-olefins desorption [35,36,37]. In a recent kinetic study, Sonal et al. [38] investigated the performance of a bimetallic Fe-Co catalyst tested in a continuous fixed bed reactor. The authors derived alkyl and alkenyl mechanistic models up to carbon number C20 based on both of the two major α-olefins secondary reactions. They concluded that the chain-length dependent α-olefin desorption theory proposed by Botes et al. [36] proved to be the most reliable approach in describing the non-ASF FTS behavior, being able to correctly predict the exponential dependency of olefins formation at increasing carbon numbers. Todic el al. proficiently applied the same methodology in describing a Co-Re/Al2O3 catalyst tested in a stirred tank slurry reactor in the presence of a CO-insertion model [17] and a carbide mechanistic model [39], up to compounds of carbon number C15. Finally, to the best of our knowledge, only a few authors described the outcomes of their kinetic models at high carbon number values, among which Visconti et al. [16,40], who provided a mechanistic kinetic model up to carbon number C49, and Kwack et al. [41] up to carbon number C40.
In order to create a model for FT synthesis, which could be used to optimize catalyst behavior and select optimal process conditions, this work presents a study of an in-house fabricated cobalt-based catalyst. We derived an effective carbide mechanism kinetic model capable of describing the intrinsic behavior of the catalyst based on the chain-length α-olefin desorption theory. We tested different operating FT conditions and included high molecular weight waxes in our model, with a description of the hydrocarbons formation rates up to carbon number C80.

2. Results

2.1. Catalyst Characterization

Different catalyst characterization methods were used to verify manufactured catalyst suitability for kinetic model experiments. The characterization results are summarized in Table 1 for physisorption, chemisorption, and X-ray diffraction (XRD) methods. From the prepared Co-Pt catalyst, the characterization results presented in Table 1 correspond to ones found from the literature [42,43,44,45]. These values are in the same range of the results provided by Karaca et al. [43], and Nabaho et al. [44] for similar platinum promoted cobalt catalysts. Moreover, several studies describe the effect of cobalt particle size on catalyst activity and selectivity for C5+ and CH4, where a 10–50 nm particle size was found to be optimal for low CH4 formation and increased C5+ selectivity [42,45,46,47]. The performed H2-chemisorption technique confirmed cobalt metallic dimensions (dCo0) for the tested catalyst to be within the range of relevant literature.
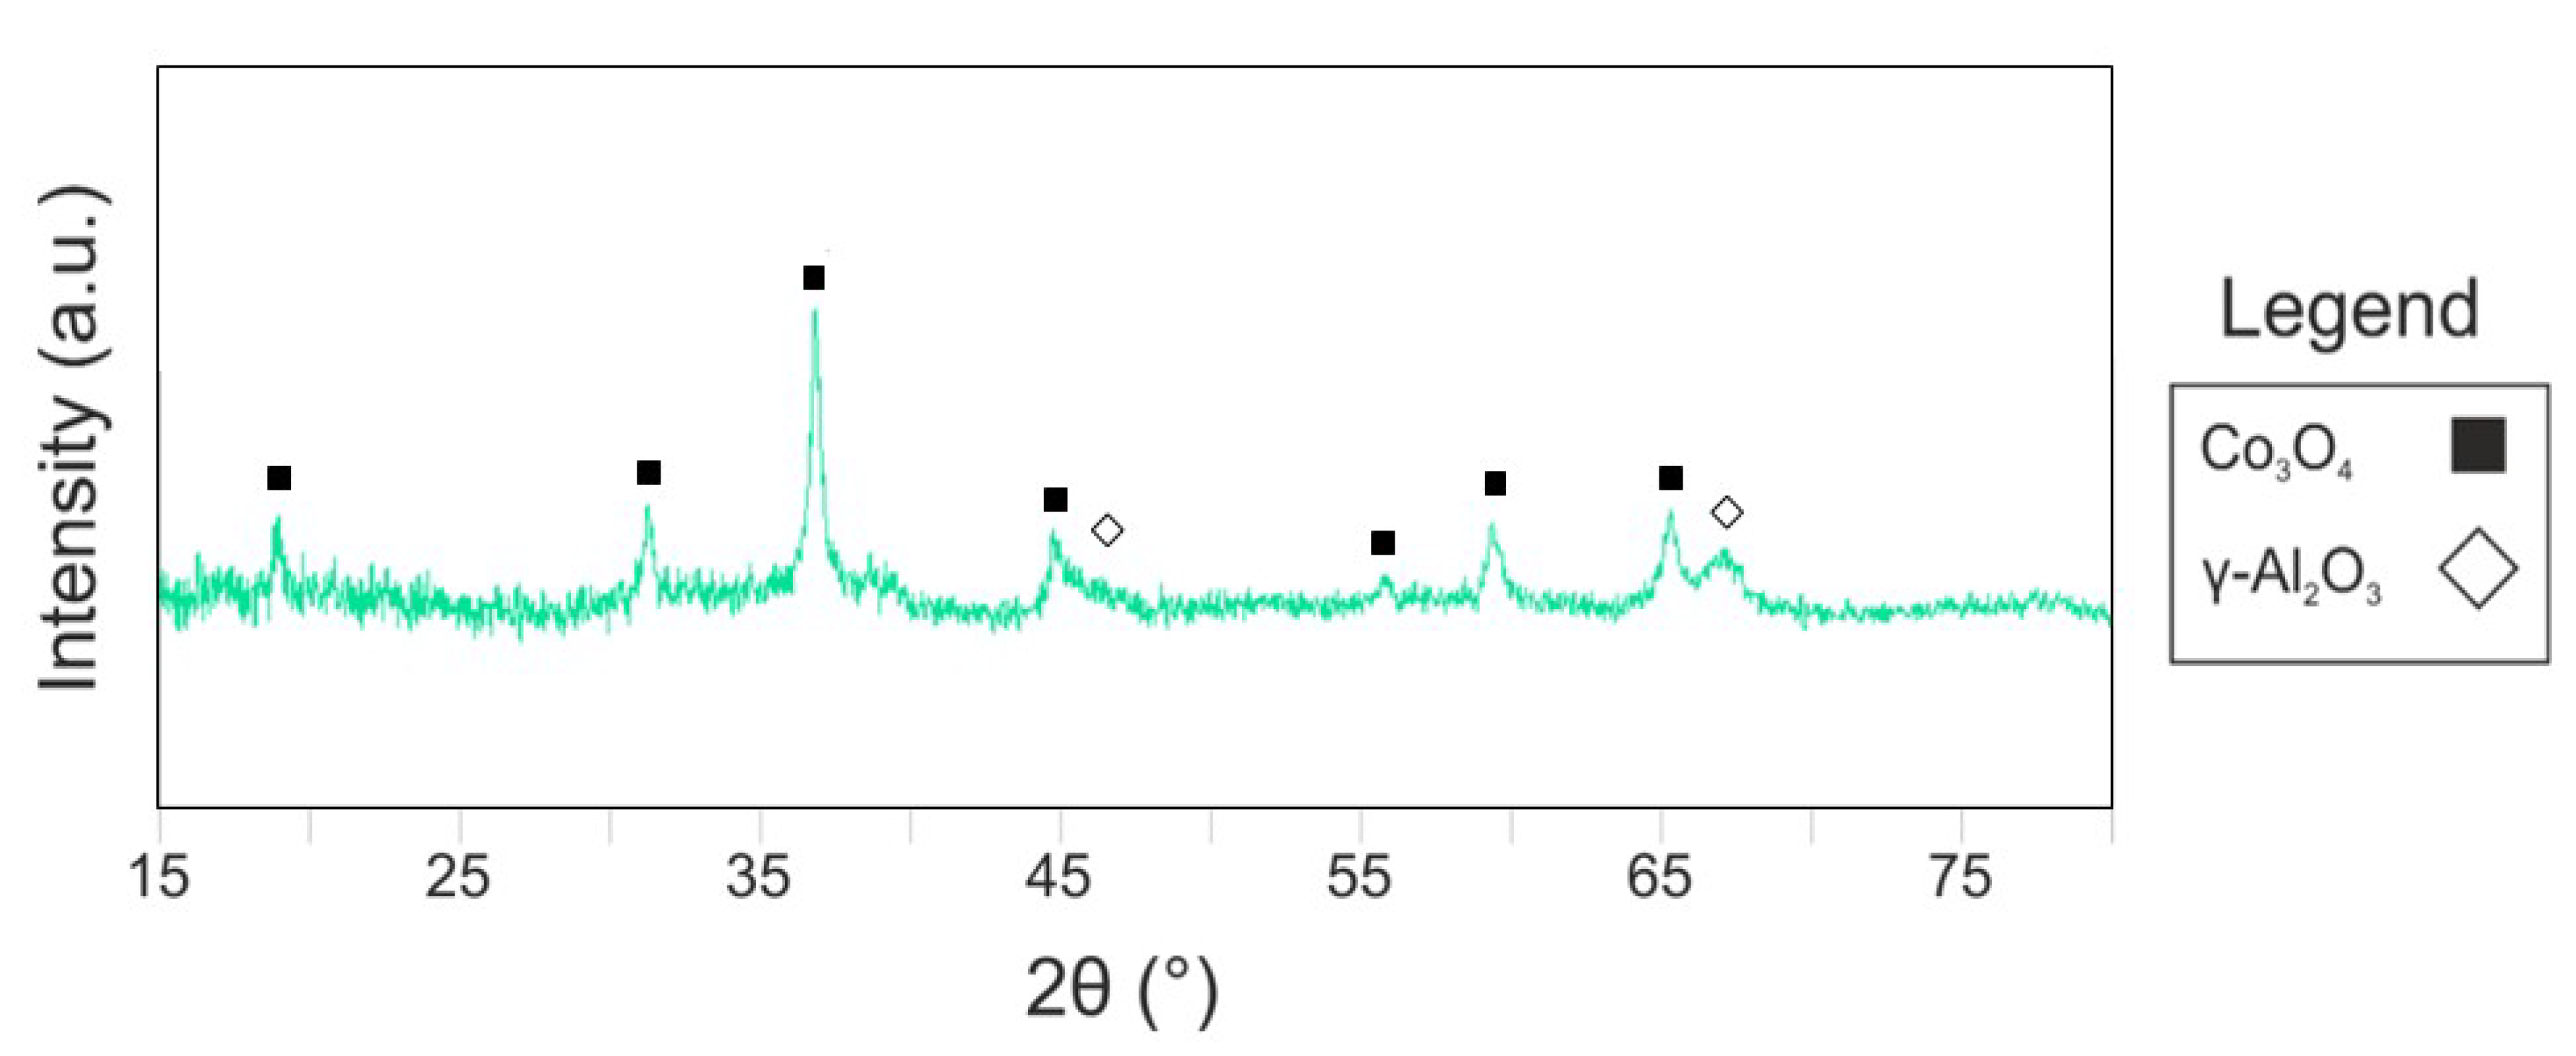
Figure 1 presents the Temperature-programmed reduction (TPR) result profile, while Figure 2 shows the XRD pattern for the selected catalyst. From the TPR, it is possible to recognize the typical Co catalyst reduction profile, with its main peaks at around 290°C and 440°C. According to Rønning et al. [47], the first peak relates to Co3O4 to CoO transition, and the second peak corresponds to CoO to Co metallic transition. H2-chemisorption and XRD measurements revealed Co0 (16.6 nm) and Co3O4 (17.5 nm) particle size correspondence to values found from the literature [42,47,48]. The H2-chemisorption was performed on the reduced catalyst and XRD on the non-reduced catalyst. Catalyst characterization results show that the in-house fabricated catalyst is comparable to similar FTS applications and is suitable for kinetic model reaction experiments.
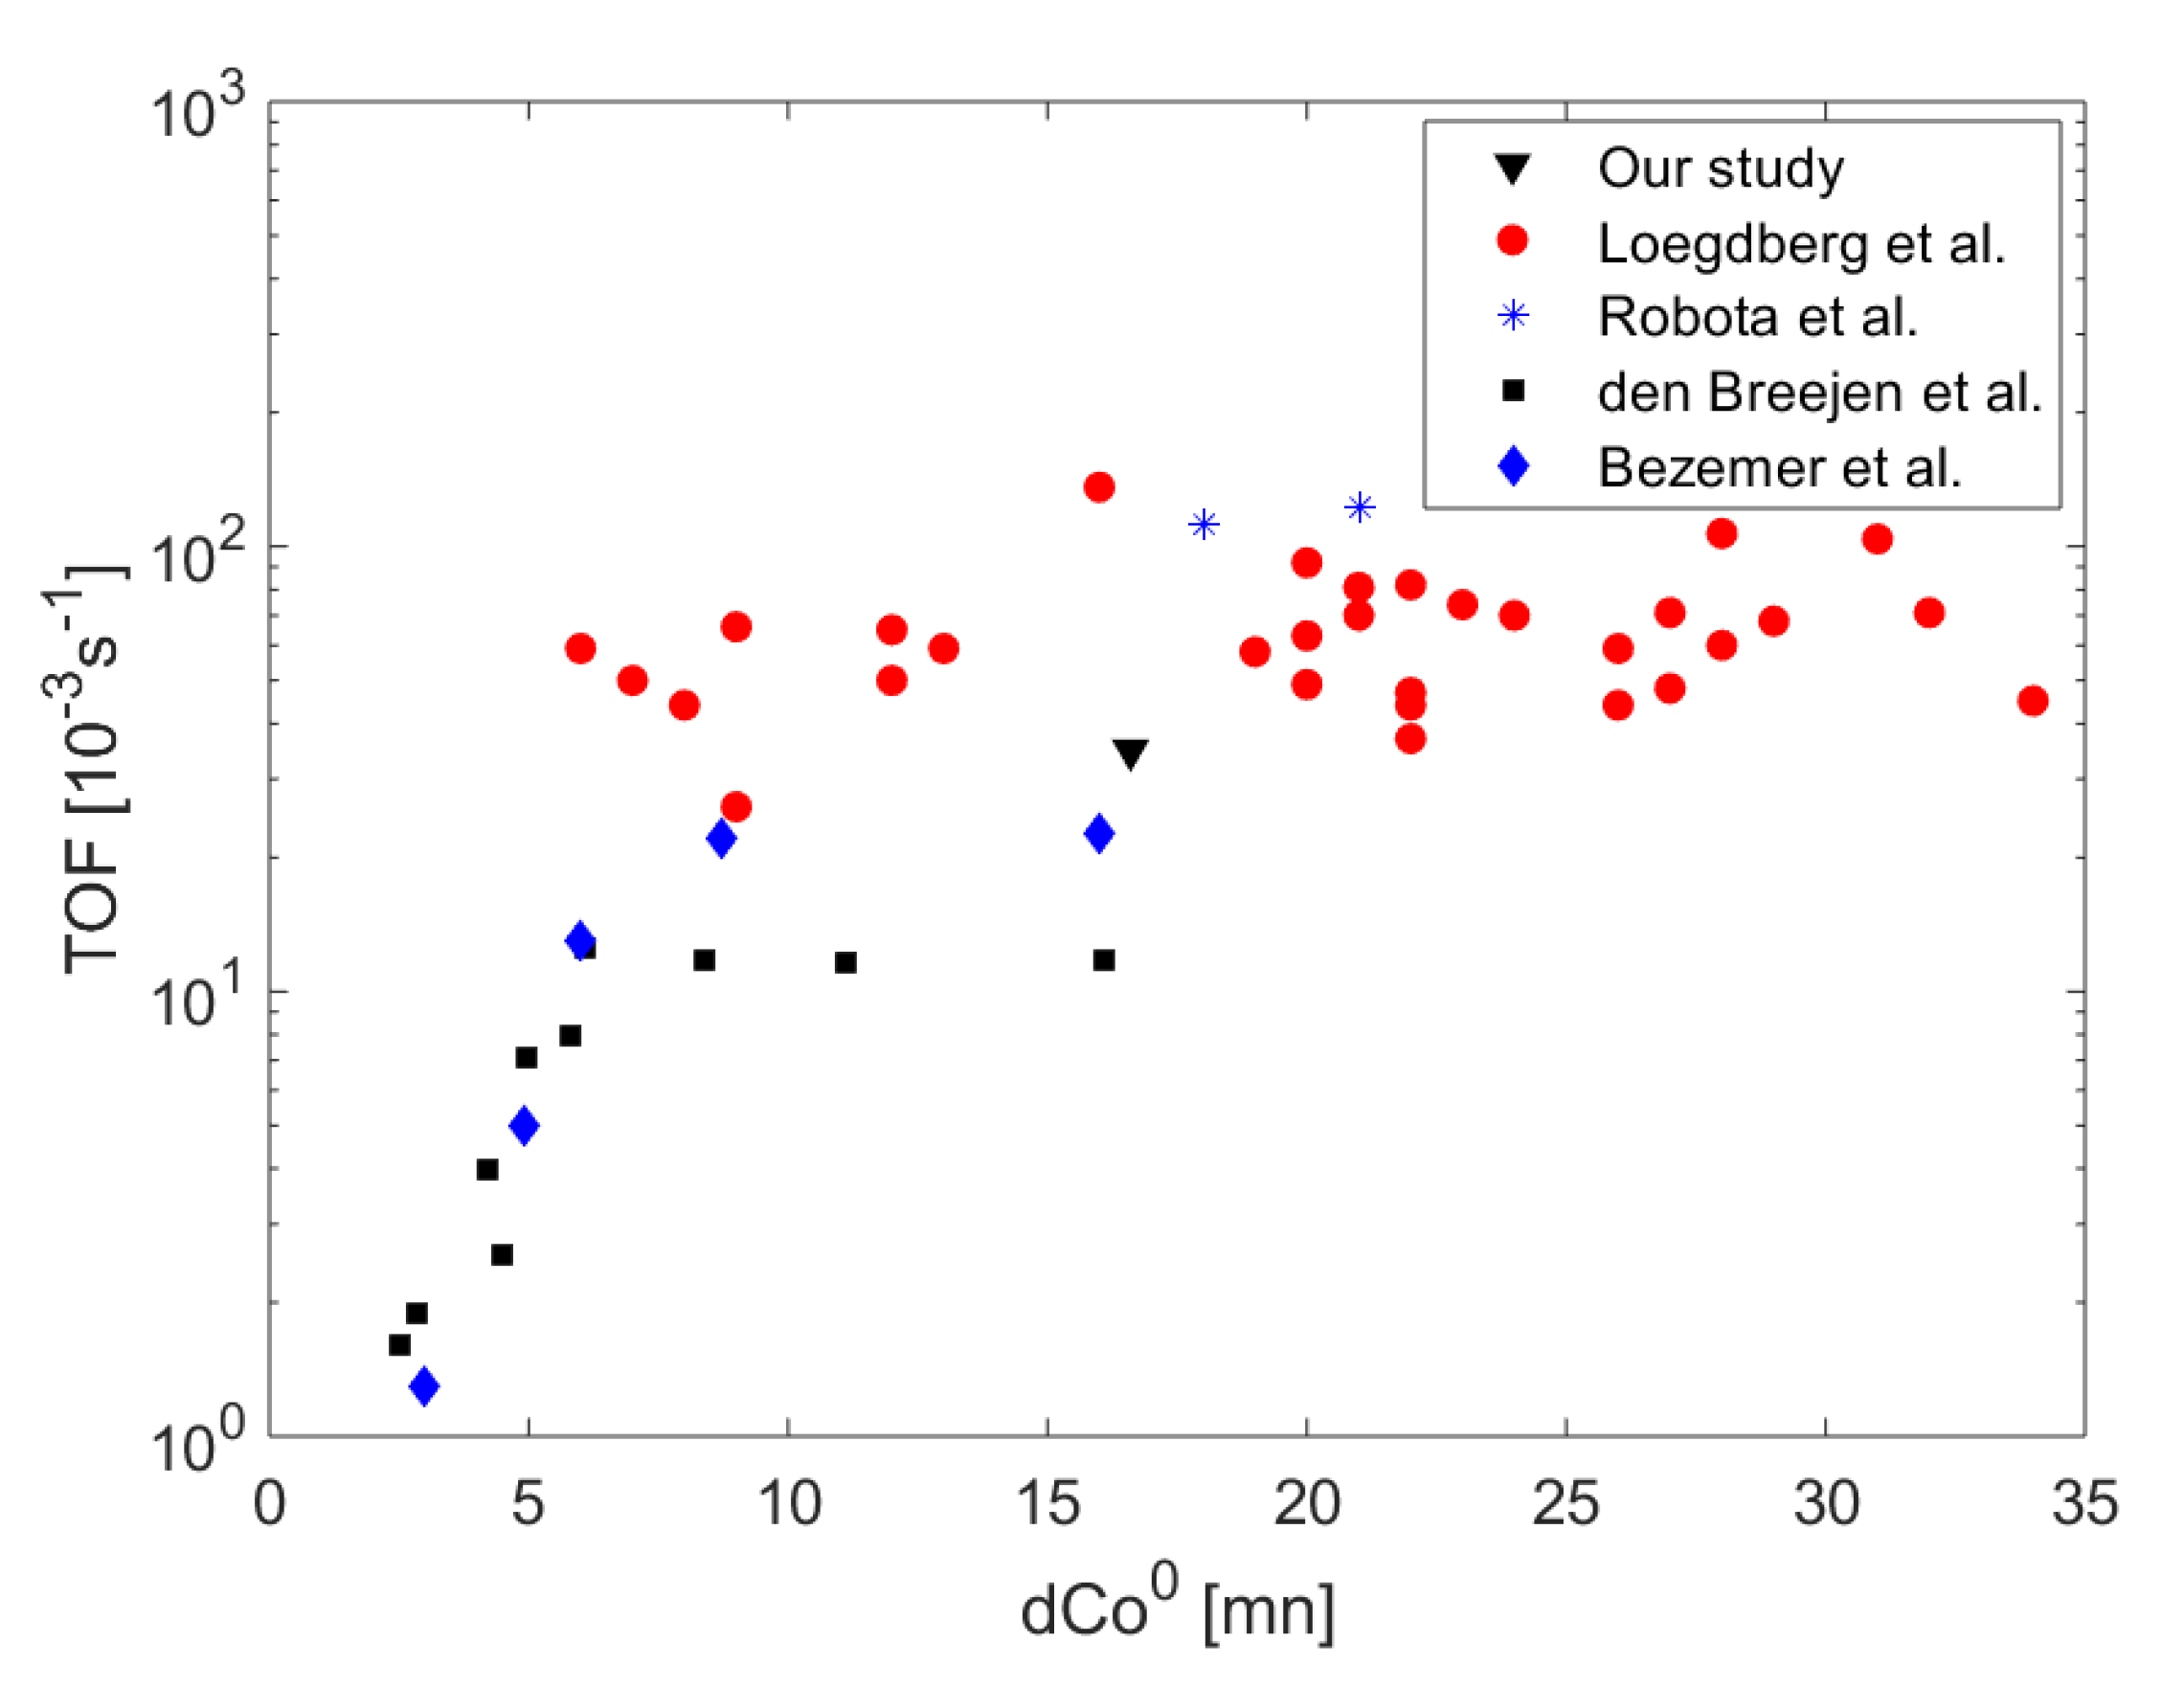
Moreover, the intrinsic catalytic activity—based on dispersion H2 chemisorption, i.e., the turnover frequency (TOF)—has been calculated and confronted with data reported in other open literature studies. At test conditions of 483 K, 30 bar, and an H2/CO molar ratio of 2.04 at the inlet of the reactor, the turnover frequency (TOF) results in 33.6∙10−3. s−1. This value is in line with literature findings and lays in the plateau of reported results for Co-catalyst. As reported, the TOF of Co-based catalysts can be found approximately constant for a dCo0 above 6–10 nm at typically employed FTS conditions (Figure 3) [49,50]. This provides one other element of encouraging suitability for the catalyst employed in our study.

2.2. FT Mechanism

The selected kinetic model corresponds to the mechanistic model number FT-02 (Supporting material section A. The reaction path of this specific model is provided in Table 2. This model assumes dissociative hydrogen chemisorption onto the catalyst surface, followed by a slow CO adsorption on an H* catalyst active site to H*CO. The latter intermediate species is then subjected to a series of subsequent hydrogenation steps needed to generate CnH2n−1* and the chain growth precursor CnH2n*, and to release water. Afterward, the chain growth monomer interacts with adsorbed hydrogen in the form of H*, producing a lengthening of the hydrocarbon chain. Lastly, the intermediate CnH2n+1 undergoes a hydrogenation step to paraffins, CnH2n+2, or a desorption step to olefins, CnH2n.
The outcomes of a non-linear regression on the experimental data are listed in Table 3. The model provides both activation energies, Ei, and adsorption enthalpies, −ΔHa,i, higher than zero. Details about the results and model selection are provided in Discussion Section 3.1.

2.3. FT Products Distributions

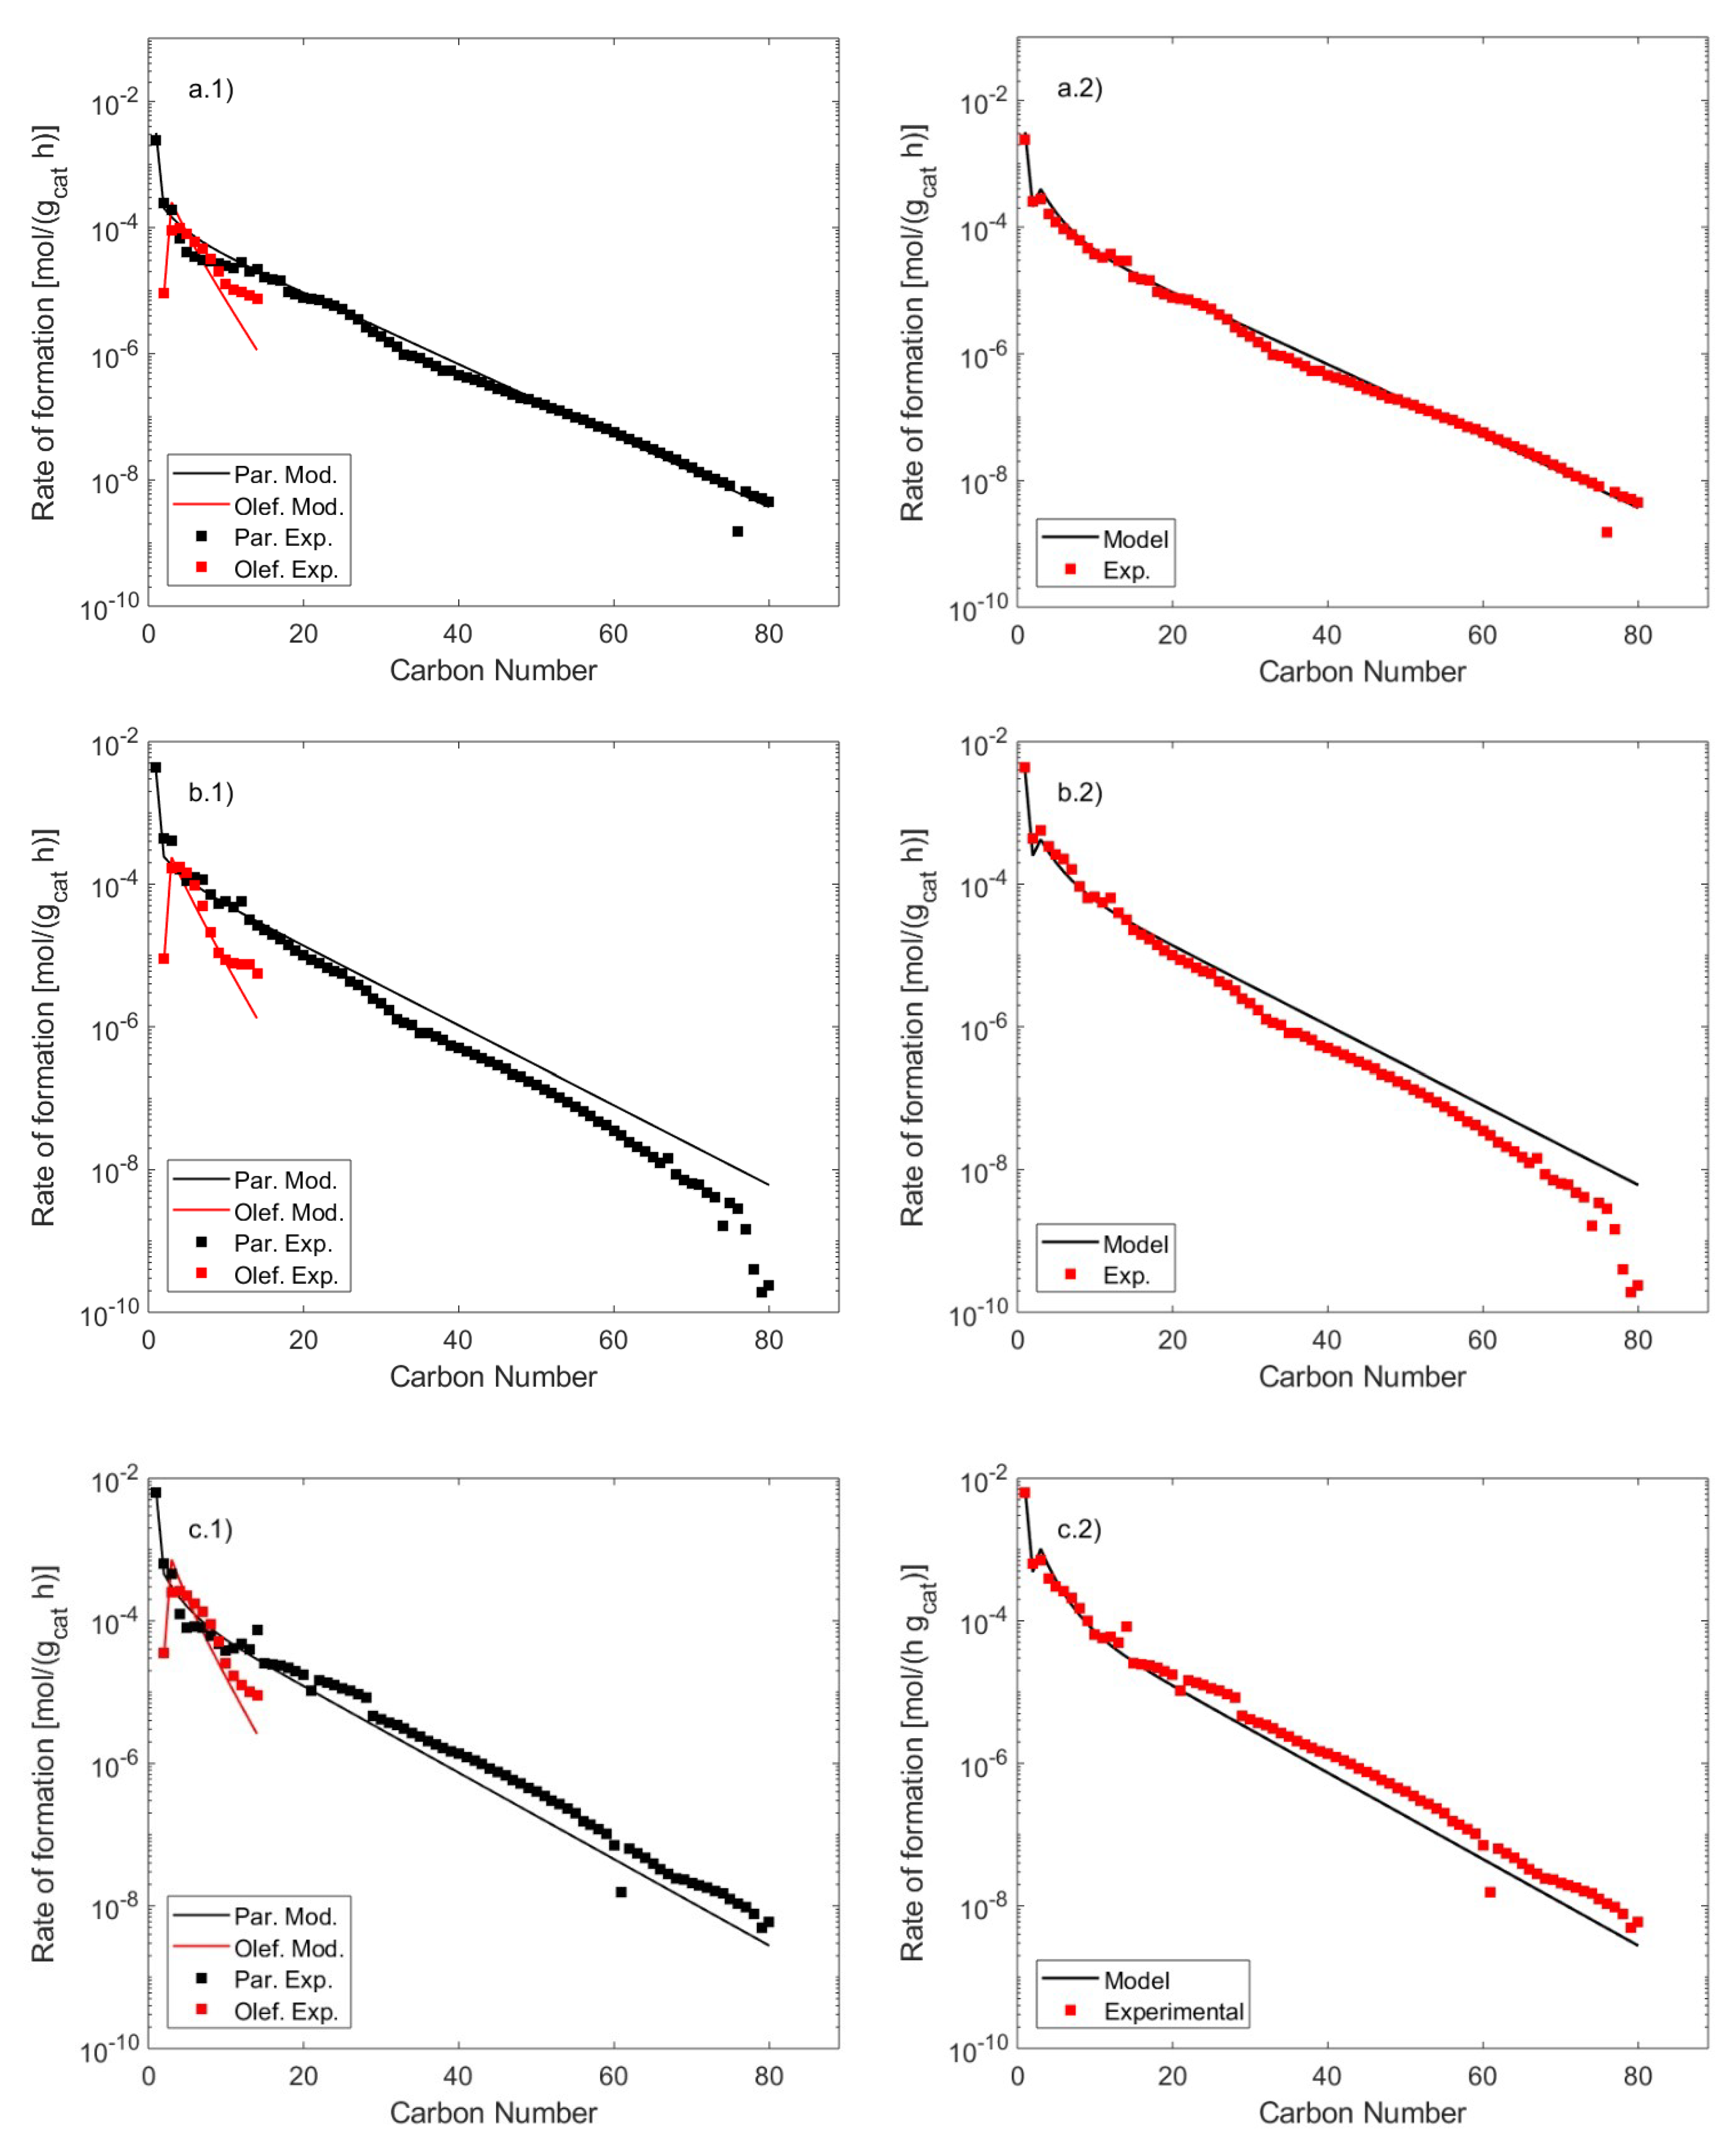
The results of the hydrocarbon distribution and reactant consumption rates are presented in Figure 4 and Figure 5, with a direct comparison of the experimental and kinetic model outcomes. Figure 4 displays the FTS distributions at different operating conditions, for both n-paraffins and α-olefins. It is possible to note that the model can deliver reasonably good fits with the variation of the most influencing operative parameters. It can estimate the formation of most of the two major FTS products accounted. Moreover, it can also predict the formation rates of n-paraffins at considerably high carbon numbers (up to C80). Finally, the model properly accounts for major deviations from the ASF distribution. This corresponds to a higher methane selectivity and a lower ethylene selectivity than expected and a decreasing olefin-to-paraffin ratio with increasing carbon number, resulting in a bend of the distribution of the products at carbon numbers C15–20.
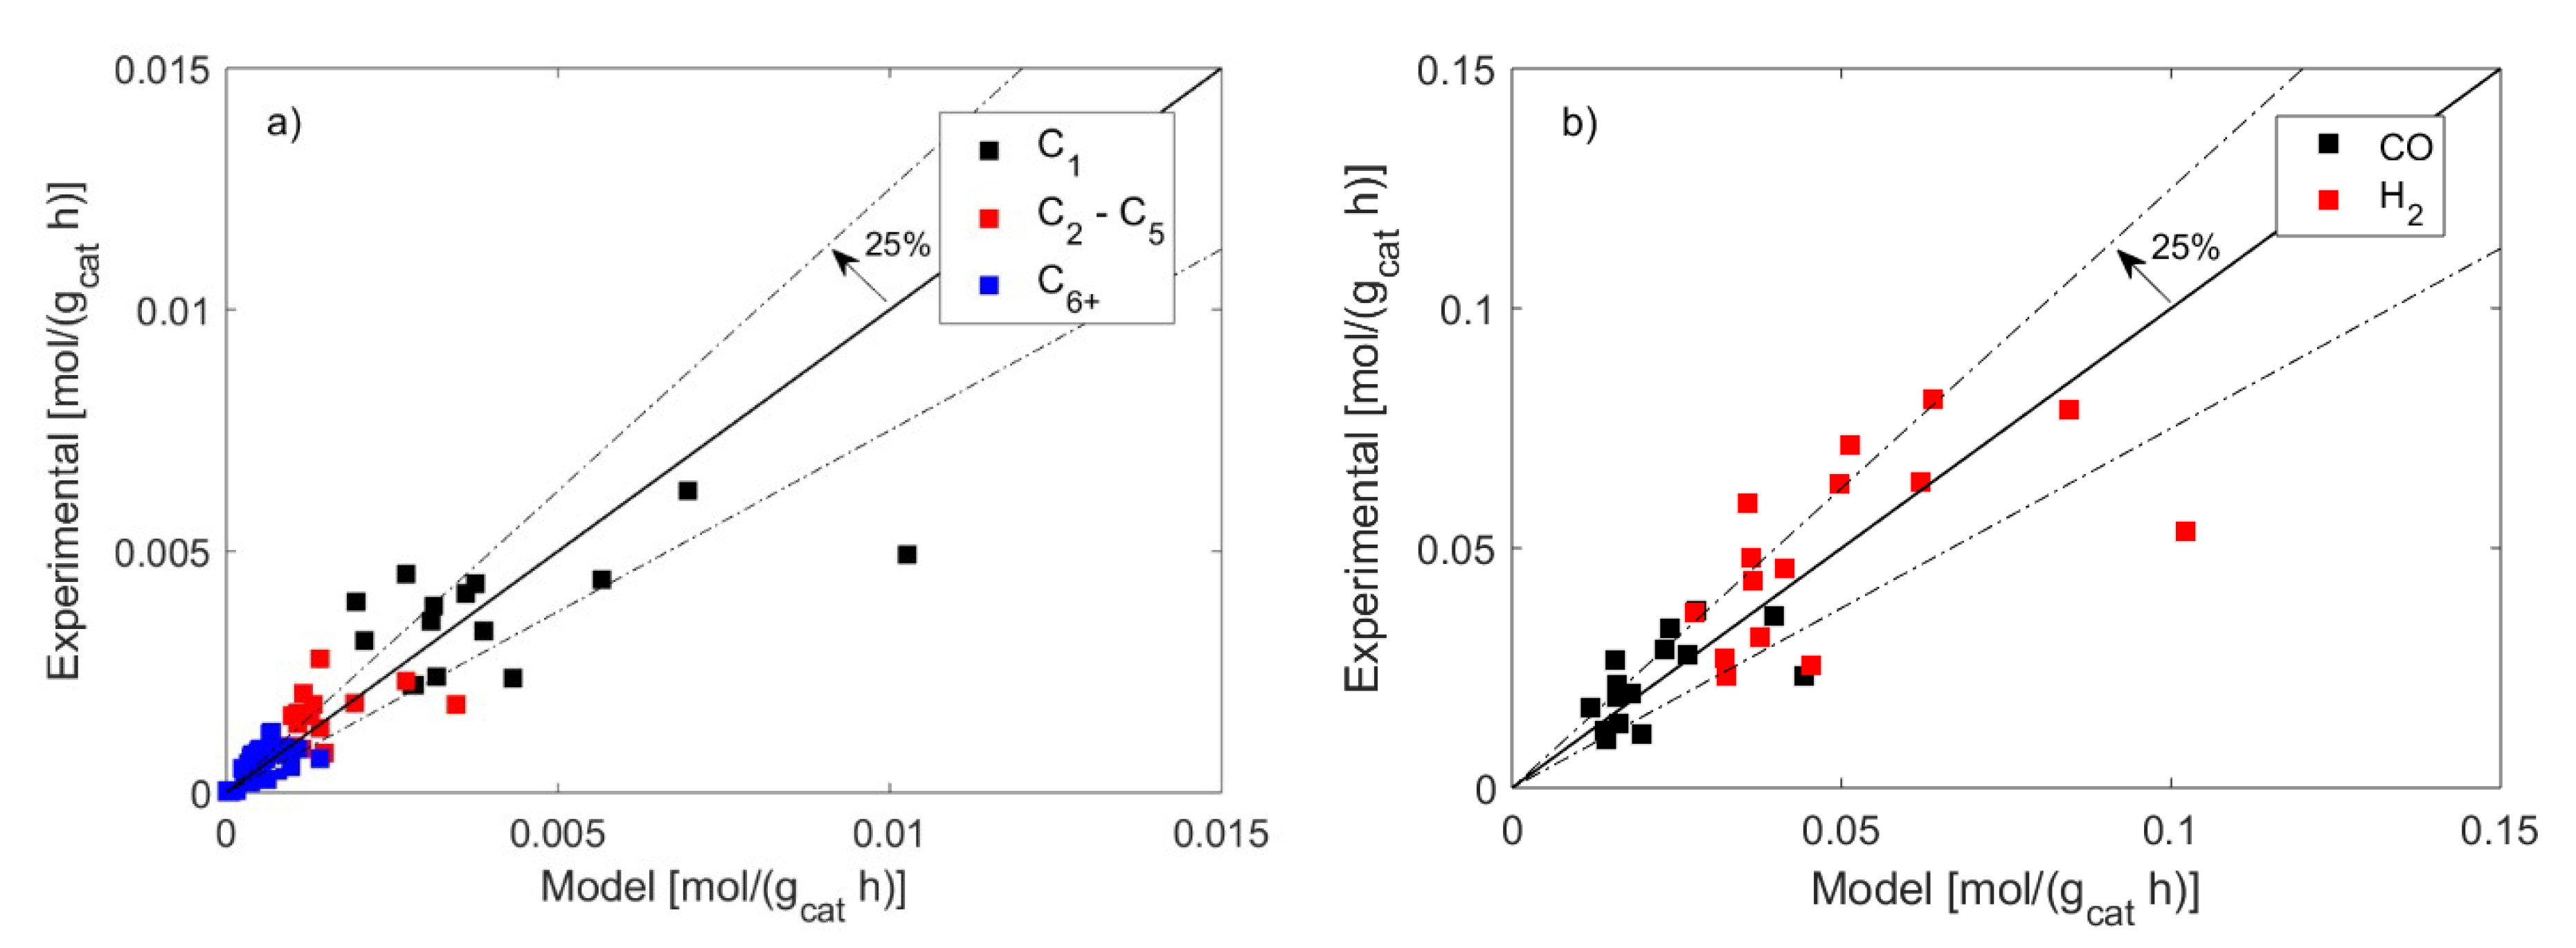
Figure 5 shows the parity plots of the model against the experimental results on both reactants consumption and product generation. The dispersed deviation lies in a range of error around ±25% in the case of H2 and CO reactants consumption, and between ±25% and ±30% for the formation rates of paraffins and olefins. These percentages of error could be associated to the constraint made on the analysed carbon species, as suggested also by both Sonal et al. [38] and Todic et al. [39] (i.e., only n-paraffins and α-olefins have been considered in the data regression routine, while other minor compounds have been left out due to the small concentration found in the outlet flow). Nevertheless, the error range evaluated in this work is suitably acceptable and comes to an agreement with many mechanistic kinetic studies with error bands oscillating from ±15% to ±30% [21,24,38,39,55]. Finally, the rates of consumption of syngas (namely, carbon monoxide, and hydrogen) can be evaluated from the stoichiometry of the reaction, i.e., the sum of calculated rates of formation of each of the selected hydrocarbons [17,39]. This determines a 0th order dependency over the partial pressure of CO and a positive dependency around the unity with respect to H2. Such results are consistent with literature findings, where reported values of reaction orders with respect to CO and H2 under FTS conditions are in the range of around (−1) to (+0.65) and (0.5) to (2) [53,56].

3. Discussion

3.1. FT Kinetic Model

An activation energy ECO of 82.4 kJ/mol was obtained for the initial step of CO dissociation (activation energy of the FTS process) in the kinetic parameter estimation. This results in the range of 80 to 120 kJ/mol reported by many kinetic and SSITKA studies (Steady State Isotopic Transient Kinetic Analysis) on cobalt-based catalysts for FTS reaction [24,54,57,58,59]. Keyser et al. found a similar value of 79.9 kJ/mol [59], Nikparsaa et al. estimated an activation energy of 88.4 kJ/mol [60], Todic et al. of 100.4 kJ/mol [39]. The adsorption heat of hydrogen of −5.97 kJ/mol was found to be in the lower range of literature findings [24,53], being close to the value reported by Bhatelia et al. of −2.14 kJ/mol for their cobalt catalyst [24]. Energy termination barriers of n-paraffins and α-olefins (93.7 kJ/mol and 95.2 kJ/mol, respectively) are in good agreement with the kinetic results reported by other authors [17,21]. In addition, methane and ethylene activation energies differ from the other paraffins and olefins, as assumed in the kinetic model formulation. EMeth is lower than EPar as well as EEth is higher than other olefins. This outcome describes the FT distribution, which is depicted in Figure 4 and mentioned earlier. Methane activation energy, EMeth, is of 89.9 kJ/mol—very close to outcomes obtained by Bhatelia et al. [24] 82.4 kJ/mol, Todic et al. [39] 63.0 kJ/mol, and Ghouri et al. [61] 83.6. The activation energy for ethylene, EEth, corresponds to 112.8 kJ/mol, in the middle of the reported value of 125.3 of Moazami et al. [21] and 103.2 of Todic et al. [17]. The energy barrier for the step of olefin desorption (ΔE) is 1.25 kJ/mol, in accordance with analogous studies applying the chain-length dependent α-olefin desorption theory [17,38,39]. By application of Equation (1), this outcome determines a rise in the α-olefin termination step barrier from 95.3 kJ/mol at carbon number C2 to 113.9 kJ/mol at carbon number C15. This behavior confirms the description of Cheng et al. [62] that attributes a higher activation energy value for α-olefins desorption at increasing carbon numbers. This is most likely due to a higher value of Van der Waal’s attractive forces of α-olefins on the catalyst surface at high carbon numbers [63]. Additionally, at a 95% confidence level, the Ftest has a value of 133.6, higher than its critical value of 1.86. Similarly, the lowest absolute value obtained from the ttest (corresponding to 3.2) is higher than the critical value of 1.64. Both the Ftest and the ttest allow the examination of the statistically meaningful fit and the statistical difference from zero of every kinetic parameter, respectively [64].
As mentioned, the selected kinetic model assumes hydrogenation of CO and latter CHx formation, the predominant monomer responsible for the build-up of hydrocarbons. This finds agreement with literature studies provided by Ojeda et al. [57], and more recently by Chen et al. [65], where they experimentally demonstrated the role of H-assisted routes to obtain CO dissociation for latter chain-growth. Also, Rytter et al. [66] suggested that a pool of CHx is responsible for the generation of the FT hydrocarbons. Furthermore, our kinetic model results in the dissociation of HCOH to CHx and OH, an FTS reaction step that can also be found in the work of Visconti et al. [16]. As a matter of fact, this is one of the main potential reaction pathways to generate CHx, and SSITKA studies show that other probable reaction chains can occur over the catalyst surface [65,67].
The final selected model shows the lowest value for the MARR (Mean Absolute Relative Residual) among the competing mechanisms, with a percentage of 41.2%, just slightly higher than most reported values (in the range 20–30%). The other models did not provide satisfactory experimental data fit. The reason for this higher MARR value could be linked to the experimental data scattering found in the FTS distributions. In a recent study on a Co/Al2O3 catalyst, Ghouri et al. [61] estimated a MARR value of 48.4%. They attributed this behavior to their small amount of experimental observations. Kruit et al. [68] suggested that distribution deviations could be potentially related to slight temperature gradients at the catalyst bed or particle levels. Yang et al. [69] postulated that the process of separation and condensation of heavy hydrocarbons could enwrap water in the wax matrix, determining a small overestimation of this fraction. In addition to these observations, especially with heavy FT product analysis (C80+), sample preparation methods, and analysis equipment could provide misleading interpretations and affect the MARR final value. When the experimental data were found to be highly scattered, data points had been excluded from the proposed data fitting routine (e.g., Figure 2b at carbon number range C73−C80, Figure 2a at carbon number C76, or Figure 3c at carbon number C60). Sample solvent could also have an effect on high molecular weight wax analysis. When FT products are dissolved into a solvent, light hydrocarbon constituents have a tendency to dissolve faster and thus saturate solvent prior to heavy component dissolution. It is logical to assume that these matters are likely to be interconnected to the complex nature of the FTS reaction, and further investigations beyond the scope of this study are suggested.
The kinetic model is also capable of providing information about the growth probability values of the FTS products and surface coverage values. Depending on the reaction conditions, the calculated surface coverage of hydrogen ranged between 3% and 10%, while one of all the species containing CO varies between 15% and 55%. These results are supported by literature findings, for which hydrogen and carbon monoxide surface coverage estimates are reported lower than 5–10% and between 20% and 65%, respectively [24,65]. Moreover, the model evaluates growth probability values between 0.8 and 0.93, depending on process conditions. Specifically, the growth probability of the hydrocarbons gradually increases up to an asymptotic condition that is reached in the neighborhood of the carbon number C20–25, after which the probability growth remains constant. This behavior, which is in accordance with Todic et al. [17] assessments, can be related to the decreasing influence of the α-olefins term in the expression of the growth probability for high molecular weight hydrocarbons (Equation (10)) due to a higher interaction with the catalyst surface. Finally, the evolution of the growth probability explains the change in the positive bend of the FTS distribution.

4. Materials and Methods

4.1. Catalyst Preparation and Characterization

The catalyst was prepared on γ-Al2O3 support (Puralox SCCa 5/150) with 21.4 % wt cobalt and 0.2 % wt Pt loading. The preparation method consisted of one-step incipient wetness impregnation of an aqueous solution of cobalt nitrate (Co(NO3)2 6H2O) and platinum nitrate (Pt(NO3)2). The prepared catalyst was dried (353 K) and calcined in a rotavapor with a flow of air at 523 K (ramp 2 K/min, GHSV 1000 ml/gcat/h). In order to remove particle sizes below 50 µm, the catalyst batch was sieved after calcination. The particle size used in the experiments was 50–150 µm.
After preparation, the catalyst was characterized by H2-chemisorption, TPR, XRD, and physisorption methods. A Micromeritics 3Flex 3500 was used for H2-chemisorption, TPR, and physisorption measurements. Physisorption used Brunauer-Emmet-Teller (BET) isotherm to determine surface area, and Barret-Joyner-Halenda (BJH) isotherm for pore volume and average pore diameter. A catalyst sample (~100 mg) was outgassed before physisorption analysis at 473 K for 12 h. With H2-chemisorption, a catalyst sample (~100 mg) was reduced under hydrogen flow (1 bar, 50 ml/min) at 623 K for 16 h (ramp 2 K/min). After reduction, the catalyst bed was evacuated (0.01 bar H2 pressure), the temperature decreased to 303 K, and adsorption measurements started to obtain isotherm data between 0.001 and 0.03 bar. In TPR measurements, a catalyst sample (~100 mg) was cleaned under He flow at 473 K for 2 h. The catalyst bed temperature was decreased to 303 K, and reduction was started with ramp rate 10 K/min to 1223 K in a constant flow of 10% H2/Ar (50 ml/min). An XRD diffractometer PANalytical X’Pert PRO MPD Alfa-1 instrument with CuKα1 radiation was used to examine a range of 2θ for a catalyst sample from 15° to 80° with step size 0.026° (collection time 1.25 sec). Analysis run time was 60 min and X-ray source operating at 40kV/40mA. Support characterization before catalyst preparation indicated values for the surface area (140 m2 g-1), the pore volume (0.46 cm3 g−1), and the pore diameter (13.2 nm). Scherrer’s equation [70] was used to determine the average Co3O4 crystallite thickness with cobalt oxide peak (311) at 2θ = 36.9°.

4.2. Catalyst Testing

The experiments were conducted in a tubular fixed-bed micro-reactor (PID-Micromeritics Microactivity Effi).
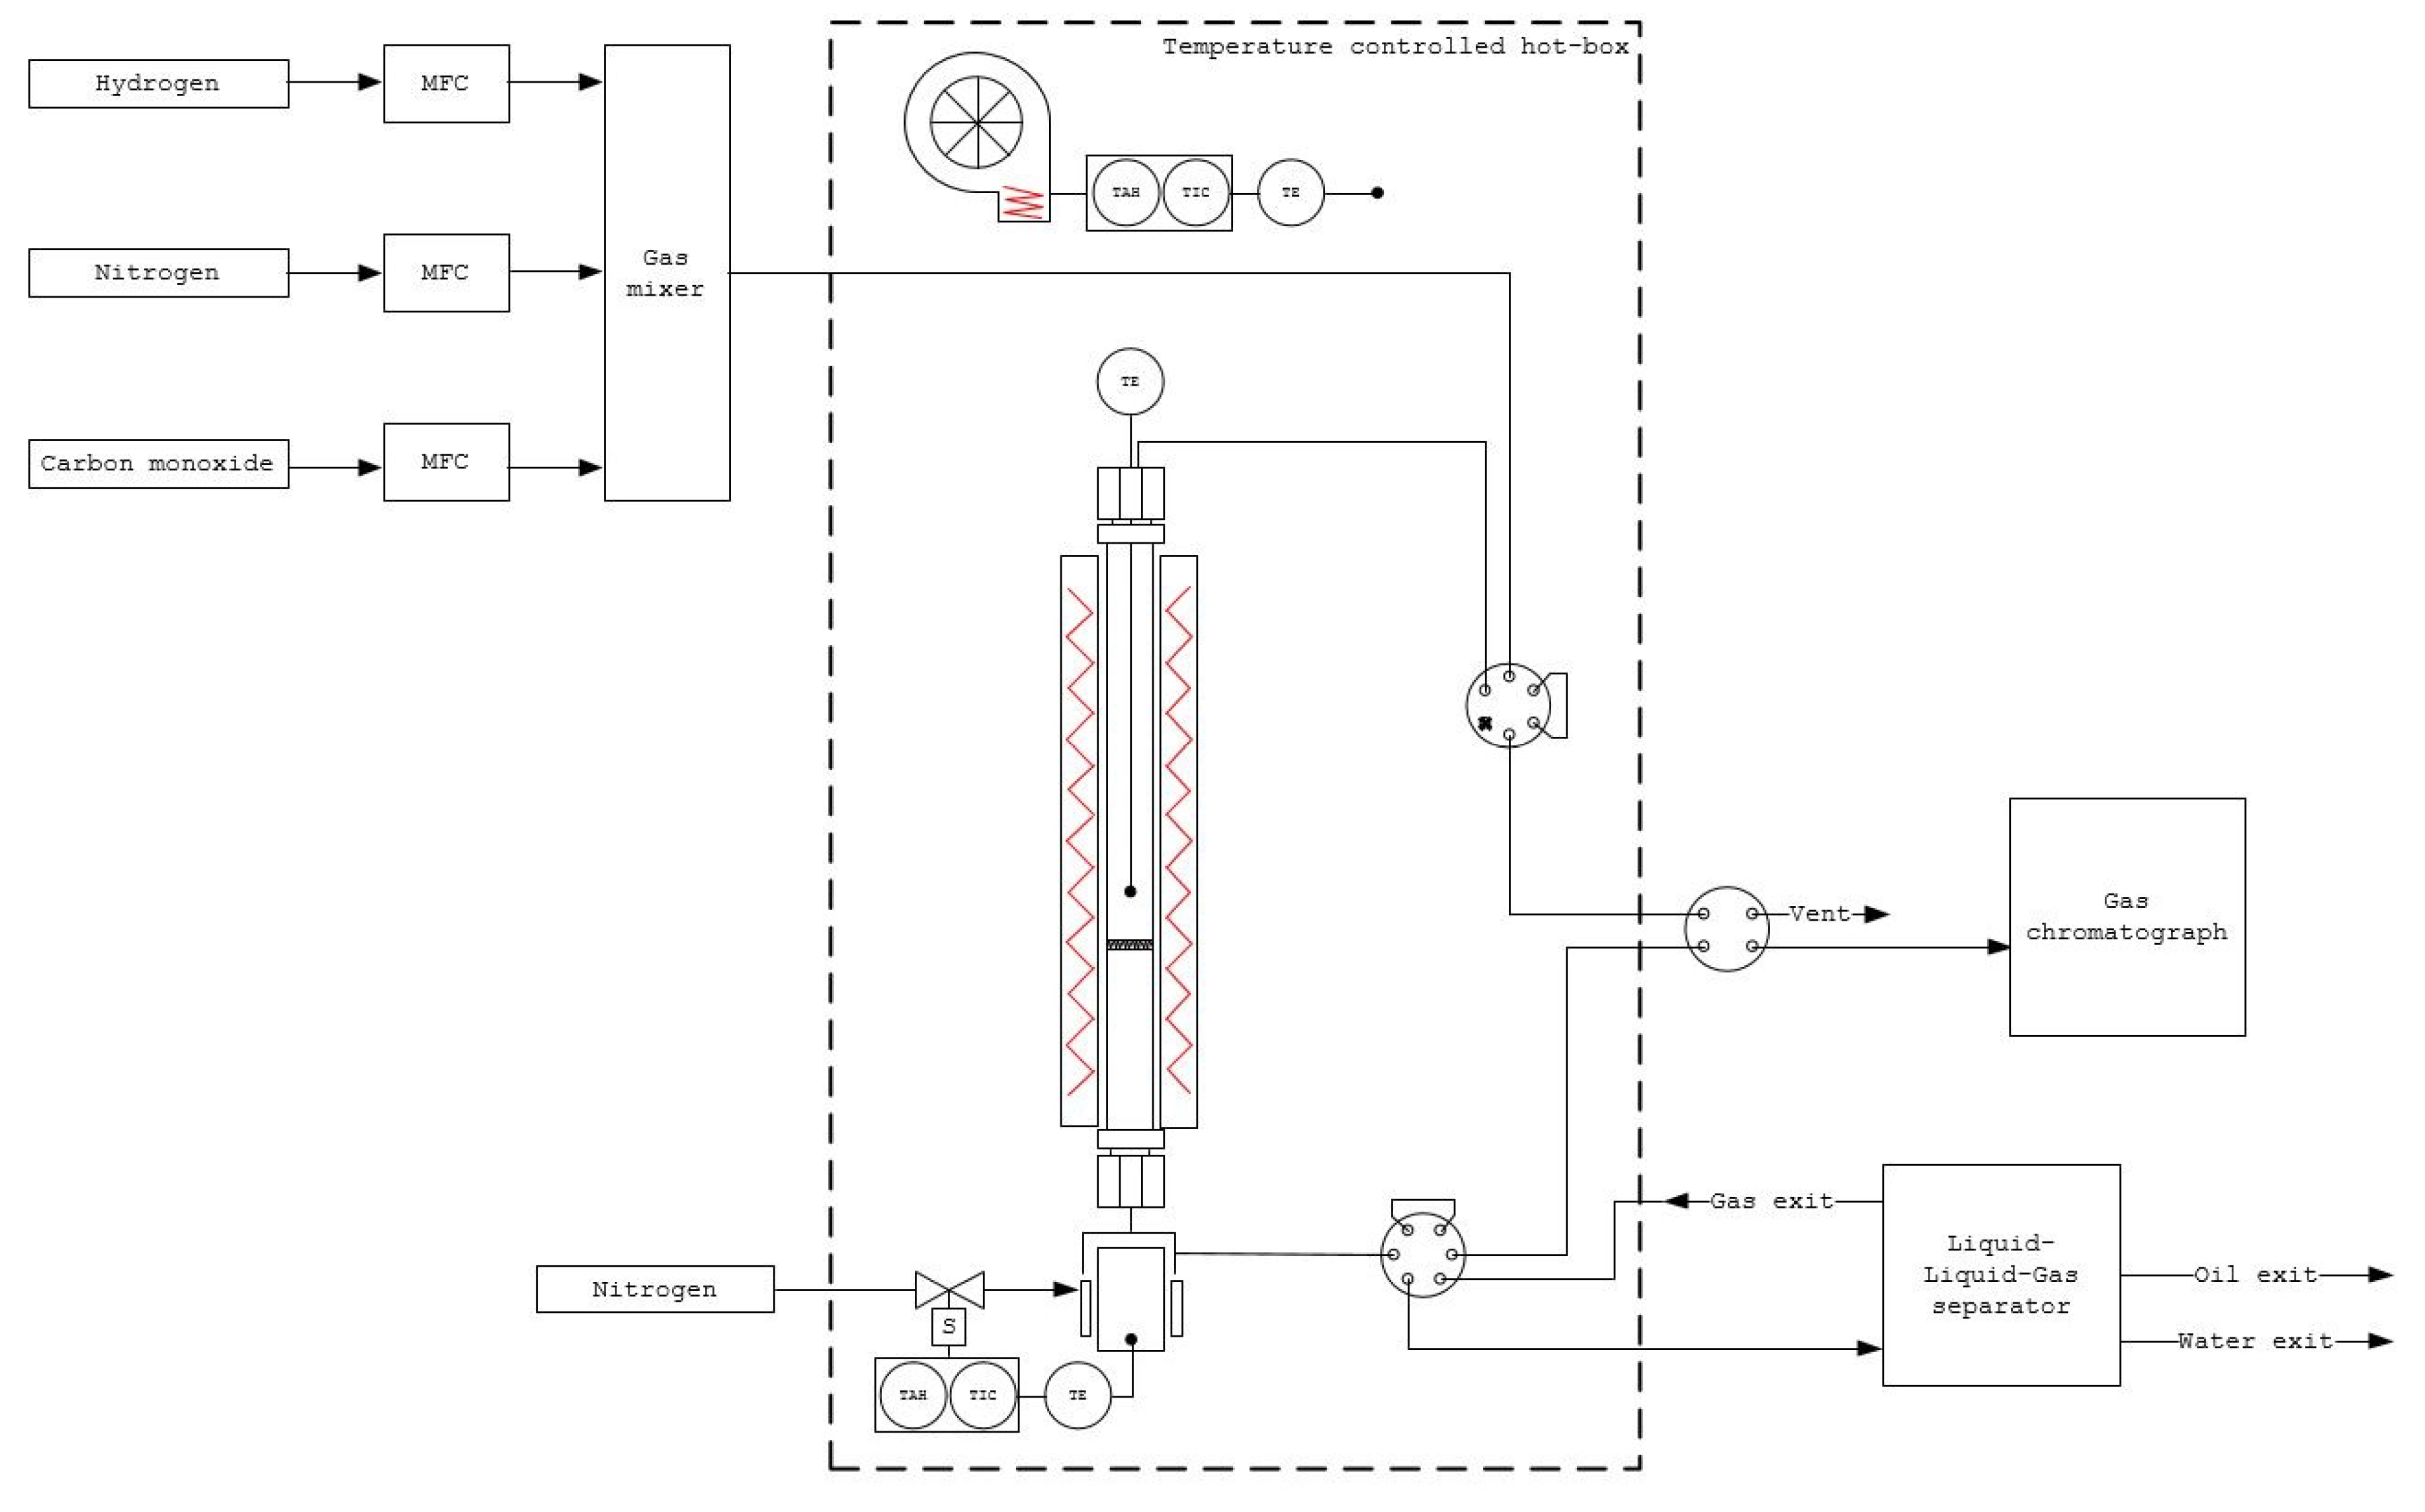
Figure 6 presents a scheme of the reactor system. The equipment consisted of a reactor tube and an electrically heated furnace, a wax trap (hot trap) and a liquid-liquid-gas separation unit (cold trap). The reactor tube was of the type Hastelloy C (9.1 mm i.d., and a total length of 304.8 mm), with a K-type thermoelement inserted into the catalyst bed, and a porous plate where the catalyst was deposited (pore size 20 μm). The reactor and the wax trap were located in a temperature-controlled hotbox. The hotbox ensured isothermal conditions (373 K) for both the reactor and the wax trap. The wax trap was connected to the reactor outlet, and it was covered by an aluminum housing. The aluminum housing contained both a compressed air inlet tube and a K-type thermocouple for the trap temperature control. The wax trap temperature was set to 363 K to ensure product collection and to avoid any undesired wax fraction run away from the trap through the downstream line. After the collection of high molecular weight waxes into the wax trap, the remaining products continued to a liquid-liquid-gas separator (LLGS). The LLGS was cooled down to a temperature of 280 K by a Peltier element. At this temperature and reaction pressure applied in the separator (10 to 30 bar), both water and oil products were condensed and separated from each other inside the LLGS. The water was collected in a tank, and the oil products were sent to a sampling line for further analysis. The remaining gas fraction composed of light hydrocarbon continued from the LLGS to a gas chromatograph for on-line gas analysis. Calibrated mass flow controllers (Bronkhorst Ltd, El-flow Select F-211CV) adjusted the gas feed to the reactor. The feeding line was equipped with a check valve was to prevent backflow.
The packed bed consisted of 1 g of catalyst (particle size 50–150 µm), evenly diluted with 1 g of inert SiC (50–150 µm). The dilution allowed reaching a homogeneous bed temperature and distributing the heat generation due to exothermal hydrogenation. A layer of quartz wool was placed above and below the catalyst, onto the porous plate.
The catalyst reduction was done with a steady flow of pure hydrogen (50 mlN/min) for 16 h, at a reactor temperature of 773 K and atmospheric pressure. The reduction temperature was reached at a stepwise rate of 1 K/min from room temperature. After reduction, nitrogen flow was started to the reactor, and the temperature was cooled down to 493 K (both nitrogen and hydrogen at 50 mlN/min). After the temperature reached 493 K, both hydrogen and nitrogen flows were set to values applied for the test runs. The reactor was set to the desired pressure and temperature. Carbon monoxide was then slowly increased to its final flow value. Operating conditions used in the kinetic tests are summarized in Table 4. With a careful carbon monoxide addition, it was possible to avoid temperature runaway, which could lead to catalyst sintering. Despite the slow reaction start-up, the catalyst usually exhibited initial activity phase. Such an initial activity decreased over time, reaching a steady-state condition. Once the activity of the catalyst was stably indicated by a steady level of CO conversion, useful products were continuously collected for approximately 45 hours. The experimental matrix was built to ensure that the most commonly applied operating conditions at industrial levels for Co-based FT reactors were covered [71]. The temperature was kept in a range of 478–503 K, the pressure was set between 15 and 30 bar, and the H2/CO molar ratio varied from 1.06 to 2.11. The CO conversion level was kept at the low value of 10 ± 2.5%, by adjusting the weighted hourly space velocity (WHSV) in the range between 167 to 720 mlN/min/gcat. Low CO conversion allows ensuring differential conditions inside the reactor and reduces the selectivity towards methane, which is an undesired product when targeting the synthesis of long-chain hydrocarbons [14,72].
Product analysis was carried out using a Shimadzu GC-2014 on-line gas chromatograph. The sample line was heated to 393 K to prevent condensation. CO, H2, CH4, CO2, and N2 (internal standard) were analyzed with a TCD-detector and two packed columns; a Porapak-Q (1 mm i.d., × 1.8 m) precolumn and a Carboxen-1000 (1 mm i.d., × 2.5 m) analytical column. A 10-port valve was used to inject a sample and facilitate the backflush of heavy hydrocarbons from the precolumn. Hydrocarbons from C1 to C14 and C1–C9 n-alcohols were analyzed using a DB-1 capillary column (i.d., 0.25 mm × 60 m × 1 µm) and an FID-detector. The analysis time was ~30 min. Response factors were determined using calibration samples. In addition to online gaseous product analysis, an offline analysis was performed for the collected oil and wax products by using a Shimadzu GC-2014 GC-system. Hydrocarbons with a carbon number from C6 to C35 and C1–C9 n-alcohols were analyzed with an Rxi-5HT capillary column (i.d., 0.32 mm x 30 m × 0.10 µm df) and an FID-detector. High molecular weight wax analysis was performed differently as a high-temperature technique (723 K) was required. A Hewlett Packard 5890 Series II with on-column sample inlet was used for this purpose. Hydrocarbons with a carbon number ranging C10 to C80 were analyzed with a CP-SimDist UltiMetal capillary column (i.d., 0.53 mm × 10 m × 0.17 µm df, 1 m retention gap) and an FID-detector.

4.3. Kinetic Model Development

In the present work, 11 mechanistic models were derived from a series of carbide mechanisms available in the literature [32,39,73]. Moreover, the chain-length dependency α-olefins desorption theory is applied to each of the models. This theory considers that the strength of olefin adsorption on the catalyst surface increases with increasing carbon number. Hence, by application of the Evans–Polanyi relations [74], the activation energy of olefin desorption is composed of a chain-length independent term (E0olef) and a chain-length dependent term (ΔEolef) to account for increasing desorption energy for every monomeric group CH2. Following the Arrhenius equation, the rate constants for olefins at every carbon number n can be obtained:
E olef n   =   E olef o + n   Δ E
k olef n   =   A olef   e E olef n RT   =   A olef   e   E olef o +   Δ E RT   =   k olef 0   e n   c  
k olef 0   =   A olef   e E olef 0 RT
c   =   Δ E RT  
Each model was derived considering n-paraffins, α-olefins, water, and unreacted H2 and CO in the products stream. Elementary steps of n-paraffins and α-olefins formation are rate-determining steps (RDS), while all the other steps were assumed to be at quasi-equilibrium. Methane and ethylene were considered with different rates of generation with respect to other paraffins and olefins, to account for the non-AFS distribution of the FTS products. Lastly, only the synthesis of Fischer–Tropsch products is assumed to evolve, and no water–gas shift reaction was accounted for to take place on the Co-based catalyst surface.
Every model was developed with a Langmuir-Hinshelwood-Hougen-Watson (LHHW) type reaction rate expression, with a dependency on the reactants partial pressures. In some reaction schemes, Eley–Rideal-type steps were also included, with one of the reacting molecules adsorbed and the other one in the gas phase. Hereby, we present the theoretical reaction steps and the hydrocarbons rates formulation of the mechanism of Table 2 (i.e., the final selected mechanism providing the most satisfactory experimental data fitting). The derivation of each of the kinetic models is provided in the Supporting material section A.
The formation rates of the different FT products and probability growths depending on the surface species were expressed as follows:
R CH 4   =   k Meth P H 2 [ CH 3 ]  
R C 2 H 4   =   k Eth   e 2 c [ C 2 H 5 ]  
R C n H 2 n + 2   =   k Par P H 2 [ C n H 2 n + 1 ]   for   paraffins   at   n 2
R C n H 2 n   =   k Ol   e nc   [ C n H 2 n + 1 ]   for   olefins   at   n 3
α 1   =   k 1 P CO k CO P CO + k Meth P H 2   =   [ CH 3 ] [ H ]
α 2   =   k CO P CO k CO P CO + k Par P H 2   +   k Eth e c   2   =   [ C 2 H 5 ] [ CH 3 ]
α n   =   k CO P CO k CO P CO + k Par P H 2 + k Ol   e cn   =   [ C n H 2 n + 1 ] [ C n 1 H 2 n 1 ]   n 3
The fraction of vacant sites ϴvac was evaluated from the balance equation of the different surface coverage values depending on the reaction scheme of Table 2:
1 = ϴ vac + ϴ H + ϴ H CO + ϴ CH 3 + ϴ C 2 OH 3 + ϴ CH + ϴ C 2 H 3 + ϴ OH + ϴ C 2 H 5 + ϴ CH 2 + ϴ C 2 H 4 + ϴ 3 N [ C n H 2 N + 1 ] + ϴ 3 N [ C n H 2 N 1 ] + ϴ 3 N [ C n H 2 N ] + ϴ 3 N [ C n OH 2 N 1 ]
ϴ vac   =   1 / { 1 + ( K H P H 2 ) ( 1 + α 1 + α 1 α 2 + j =   3 n c n   =   3 j α n ) + ( α 1 + α 1 α 2 + j   =   3 n c n   =   3 j α n ) [ 1 K 3 + 1 ( K H P H 2 )   K 2 K 3 + P H 2 O ( K H P H 2 ) 1.5   K 1 K 2 K 3 K 4 ] + 1 K 4 P H 2 O ( K H P H 2 ) }
The final generation rates applied in the parameter estimation for each product were given by substituting the probability growths (9)–(11) and the sites balance expression (13) into the Equations (5)–(8):
R CH 4   =   k Meth α 1 ( K H P H 2 )   P H 2 ϴ vac  
R C 2 H 4   =   k Eth   e 2 c α 1 α 2   ( K H P H 2 )   ϴ vac  
R C n H 2 n + 2   =   k Par α 1 α 2 n   =   3 n α n ( K H P H 2 )   P H 2 ϴ vac   for   paraffins   at   n 2
R C n H 2 n   =   k Ol   e nc   α 1 α 2 n   =   3 n α n ( K H P H 2 )   ϴ vac   for   olefins   at   n 3
αN is the probability growth for each carbon number n, ki, and Ki are the rate and equilibrium constants evaluated by the model; PH2, PCO, and PH2O are the partial pressures of hydrogen, carbon monoxide, and generated water, respectively. Rate and equilibrium constants were formulated according to Arrhenius and Van’t Hoff expressions:
k i   =   A i e E a , i RT
K i   =   A i e Δ H i RT
where Ea,i are the activation energies, ΔHi are the reaction and adsorption enthalpies, and Ai are the pre-exponential factors.

4.4. Reactor Model

The reactor was modeled as a pseudo-homogeneous plug flow reactor (PFR) described by the following ordinary differential equation (ODE) combined with the proper initial condition:
d n ˙ i dW cat = j = 1 n react α i , j   R i , j ( i = 1 ,   2 ,   3 ,   ,   N C )
W cat = 0 ,   n ˙ i i = n ˙ i , i n W cat   =   W exit   n ˙ i = n ˙ i , e x i t
Furthermore, the partial pressure of each reactant and product considered at the outlet of the reactor and the value of CO conversion were expressed as follows:
P i = n i   P tot i = 1 N C n i
χ C O = n ˙ C O Inlet n ˙ C O O u t l e t n ˙ C O Inlet
In Equation (20), αi,j and Ri,j are the stoichiometric coefficient and the reaction rate of formation of the ith component in reaction jth, respectively. n ˙ i is the molar flow rate of the ith component, Wcat is the weight of the catalyst, and NC represents the total number of components. In Equation (21), Ptot is the total pressure inside the reactor. The stoichiometry of the FT reactions is presented in Table 5.
Each model was developed, accounting for n-paraffins and α-olefins. Other minor FT compounds were not considered, given their lower concentration in the product stream. Heavy waxes were considered during the development of the models, to suitably describe the distribution of the products at high carbon numbers. Only hydrocarbons with carbon number higher than C48+ were excluded in the modeling process due to their marginally lower peaks detected by the GC and the constant distribution trend at higher carbon values. In detail, for each of the investigated runs, 48 paraffins and 14 olefin experimental rates were used to extrapolate the kinetic information of the catalyst. The unreacted CO and H2 and the produced water were also considered at the outlet stream of the reactor. Lastly, heat and mass transfer limitations have been neglected. For mass transport limitations, Thiele modulus and Mears’ criterion for intraparticle and interphase diffusions have been checked [75,76,77], respectively. For the energy transport limitations, the Weisz-Prater’s and Mears’ criteria are applied for the evaluation of possible internal temperature gradients and to check the presence of any interphase heat transport limitation, respectively [78,79] (Appendix A).

4.5. Data Regression

For each of the tested mechanistic models, constant kinetic parameters were estimated by application of a non-linear least-squares minimization algorithm, which seeks to minimize the following objective function (OF):
OF = i   =   1 n search j = 1 n e ( R i , j exp R i , j mod R i , j exp ) 2
nsearch is the total number of observations (n-paraffins and α-olefins), nexp is the total number of experimental sets, and Rexp and Rmod the rates of formation of hydrocarbons for the experimental and model outcome, respectively. Due to the non-linearity of the objective function and the possibility of having multiple local minima, the kinetic data regression is obtained via the first step of global optimization. The global optimization outcome is then used in a second step as an initial guess for local optimization. Finally, to select the most suitable kinetic expression, the competing models were screened based on the lowest value of the mean absolute relative residual (MARR).
MARR   =   i   =   1 n s e a r c h j   =   1 n e x p | R i , j e x p R i , j m o d | R i , j e x p × 1 n s e a r c h   n e x p × 100   %
The global optimization has been performed via the application of the genetic algorithm, which is followed by the Levenberg-Marquardt method implementation for local optimization. Both routines have been performed on the software tool MATLAB®.

5. Conclusions

A kinetic study for Fischer–Tropsch synthesis (FTS) over an in-house fabricated Pt-promoted cobalt catalyst was performed. Characterization techniques were used to confirm that the manufactured catalyst had targeted physical and chemical properties. The catalyst was tested under the most commonly applied FTS reaction conditions, focusing on the production of long-chain hydrocarbons.
Several mechanistic models based on a carbide mechanism coupled with a chain-length α-olefins desorption approach were derived. The selection of the model was made based on model screening by computational data regression, and the model was selected by comparing the mean absolute relative residuals. The final selected kinetic model was capable of properly describing the typical non-AFS deviations, accounting for a higher methane selectivity, low ethylene selectivity, and increasing activation energy for α-olefin desorption. Moreover, this kinetic model provided a satisfactory experimental data also fit for very high hydrocarbon carbon numbers (C80).
In forthcoming activities, the authors will work on developing an improved kinetic model capable of estimating the catalyst behavior under harsher conditions. Accordingly, water and CO2 will directly be fed to the catalyst in order to study its response in the presence of a more industrial-like syngas. Ultimately, the target of our research is to formulate a comprehensive model to be suitable for the scale-up and optimization for industrial application and processes aiming at targeting long-chain hydrocarbons. The present investigation represents an important first step to reach this goal.

Supplementary Materials

The following are available online at https://www.mdpi.com/2073-4344/9/9/717/s1, Section A: derivation of the kinetic model mechanistic steps. Section B: catalyst testing, Figure B1: Products distribution data reproducibility: (a) 483K, 20bar, H2/CO 2.09, XCO R1: 12.31%, XCO R2: 11.96%; (b) 493K, 20bar, H2/CO 1.06, XCO R1: 9.34%, XCO R2: 9.2%.

Author Contributions

Methodology, formal analysis, and investigation, M.M., N.H., and E.G.; project administration and supervision, A.L., J.L., and M.R.; all the authors contributed to the discussion of the experimental results and the commenting and editing of the manuscript.

Funding

This project has received funding from the European Union’s Horizon 2020 research and innovation programme under grant agreement No 768543 (ICO2CHEM project – From industrial CO2 streams to added value Fischer–Tropsch chemicals).

Acknowledgments

The authors want to acknowledge Patrik Eskelinen for the technical support.

Conflicts of Interest

The authors declare no conflict of interest.

Appendix A

Mass and heat transport phenomena have been investigated to ensure the kinetic regime in the development of the kinetic model. All the properties of the gas mixture have been retrieved taking into account the composition of the stream at the inlet of the reactor. Our calculations show that the given criteria are satisfied for every experimental point, and no heat and mass transfer limitations have been found.
  • Intraparticle mass transfer limitations—Thiele modulus [75,80,81]:
      =   Lc   ρ c   R F T D e , c o   C c o < 1
  • Interphase mass transfer limitations—Mears’ criterion [76]:
    R FT   ρ c   r c   n k m   C CO   < 0.15
  • Intraparticle heat transfer limitations—Weisz-Prater criterion [78,79]:
    E a RT ( Δ H FT 0 ) R FT   ρ c   L c 2 λ c   T < 0.05
  • Interphase heat transfer limitations—Mears’ criterion [78,79]:
    E a RT ( Δ H FT 0 ) R FT   ρ c   L c h l   T < 0.05
The additional catalyst information employed in the present study are summarized in Table A1.
Table A1. Additional catalyst parameters used in the simulation.
Catalyst ParameterValue
Packed bulk density [g/l]820
Tortuosity [−]2
Thermal conductivity [W/(m K)]1.02
Median particle size [m]7.50 × 10⁻⁸
Characteristic length [m]1.25 × 10⁻⁸

References

  1. Rafiee, A.; Rajab Khalilpour, K.; Milani, D.; Panahi, M. Trends in CO2 conversion and utilization: A review from process systems perspective. J. Environ. Chem. Eng. 2018, 6, 5771–5794. [Google Scholar] [CrossRef]
  2. Van der Laan, G.P.; Beenackers, A.A.C.M. Kinetics and Selectivity of the Fischer-Tropsch Synthesis: A Literature Review. Catal. Rev. 1999, 4940, 255–318. [Google Scholar] [CrossRef]
  3. Dry, M.E. The Fischer—Tropsch process: 1950–2000. Catal. Today 2002, 71, 227–241. [Google Scholar] [CrossRef]
  4. Klerk, A. De Can Fischer-Tropsch Syncrude Be Refined to On-Specification Diesel Fuel? Energy Fuel 2009, 75, 4593–4604. [Google Scholar] [CrossRef]
  5. Kim, H.H.; Mazumder, M.; Lee, M.-S.; Lee, S.-J. Effect of blending time on viscosity of rubberized binders with wax additives. Int. J. Pavement Res. Technol. 2018, 11, 655–665. [Google Scholar] [CrossRef]
  6. Wood, D.A.; Nwaoha, C.; Towler, B.F. Gas-to-liquids (GTL): A review of an industry offering several routes for monetizing natural gas. J. Nat. Gas Sci. Eng. 2012, 9, 196–208. [Google Scholar] [CrossRef]
  7. Chiodini, A.; Bua, L.; Carnelli, L.; Zwart, R.; Vreugdenhil, B.; Vocciante, M. Enhancements in Biomass-to-Liquid processes: Gasification aiming at high hydrogen/carbon monoxide ratios for direct Fischer-Tropsch synthesis applications. Biomass and Bioenergy 2017, 106, 104–114. [Google Scholar] [CrossRef]
  8. Hillestad, M.; Ostadi, M.; Alamo Serrano, G.d.; Rytter, E.; Austbø, B.; Pharoah, J.G.; Burheim, O.S. Improving carbon efficiency and profitability of the biomass to liquid process with hydrogen from renewable power. Fuel 2018, 234, 1431–1451. [Google Scholar] [CrossRef]
  9. Rafiee, A.; Panahi, M.; Khalilpour, K.R. CO2 utilization through integration of post-combustion carbon capture process with Fischer-Tropsch gas-to-liquid (GTL) processes. J. CO2 Util. 2017, 18, 98–106. [Google Scholar] [CrossRef]
  10. Vázquez, F.V.; Koponen, J.; Ruuskanen, V.; Bajamundi, C.; Kosonen, A.; Simell, P.; Ahola, J.; Frilund, C.; Elfving, J.; Reinikainen, M.; et al. Power-to-X technology using renewable electricity and carbon dioxide from ambient air: SOLETAIR proof-of-concept and improved process concept. J. CO2 Util. 2018, 28, 235–246. [Google Scholar] [CrossRef]
  11. Shafer, W.; Gnanamani, M.; Graham, U.; Yang, J.; Masuku, C.; Jacobs, G.; Davis, B.; Shafer, W.D.; Gnanamani, M.K.; Graham, U.M.; et al. Fischer–Tropsch: Product Selectivity–The Fingerprint of Synthetic Fuels. Catalysts 2019, 9, 259. [Google Scholar] [CrossRef]
  12. Mahmoudi, H.; Mahmoudi, M.; Doustdar, O.; Jahangiri, H.; Tsolakis, A.; Gu, S.; Lech Wyszynski, M. A review of Fischer Tropsch synthesis process, mechanism, surface chemistry and catalyst formulation. Biofuels Eng. 2017, 2, 11–31. [Google Scholar] [CrossRef]
  13. Shimizu, T.; Ushiki, I.; Ota, M.; Sato, Y.; Koizumi, N.; Inomata, H. Preparation of mesoporous silica supported cobalt catalysts using supercritical fluids for Fischer–Tropsch synthesis. Chem. Eng. Res. Des. 2015, 95, 64–68. [Google Scholar] [CrossRef]
  14. Tucker, C.L.; van Steen, E. Activity and selectivity of a cobalt-based Fischer-Tropsch catalyst operating at high conversion for once-through biomass-to-liquid operation. Catal. Today 2018. [Google Scholar] [CrossRef]
  15. Botes, F.G.; Niemantsverdriet, J.W.; Loosdrecht, J. Van De A comparison of cobalt and iron based slurry phase Fischer – Tropsch synthesis. Catal. Today 2013, 215, 112–120. [Google Scholar] [CrossRef]
  16. Visconti, C.G.; Tronconi, E.; Lietto, L.; Forzatti, P.; Rossini, E.; Zennaro, R. Detailed Kinetics of the Fischer – Tropsch Synthesis on Cobalt Catalysts Based on H-Assisted CO Activation. Top Catal 2011, 786–800. [Google Scholar] [CrossRef]
  17. Todic, B.; Ma, W.; Jacobs, G.; Davis, B.H.; Bukur, D.B. CO-insertion mechanism based kinetic model of the Fischer-Tropsch synthesis reaction over Re-promoted Co catalyst. Catal. Today 2014, 228, 32–39. [Google Scholar] [CrossRef]
  18. Yates, I.C.; Satterfield, C.N. Intrinsic Kinetics of the Fischer-Tropsch Synthesis on a Cobalt Catalyst. Energy Fuels 1991, 5, 168–173. [Google Scholar] [CrossRef]
  19. Ma, W.; Jacobs, G.; Sparks, D.E.; Spicer, R.L.; Davis, B.H.; Klettlinger, J.L.S.; Yen, C.H. Fischer – Tropsch synthesis: Kinetics and water effect study over 25 % Co/Al2O3 catalysts. Catal. Today 2014, 228, 158–166. [Google Scholar] [CrossRef]
  20. Piermartini, P.; Boeltken, T.; Selinsek, M.; Pfeifer, P. Influence of channel geometry on Fischer-Tropsch synthesis in microstructured reactors. Chem. Eng. J. 2017, 313, 328–335. [Google Scholar] [CrossRef]
  21. Moazami, N.; Wyszynski, M.L.; Rahbar, K.; Tsolakis, A.; Mahmoudi, H. A comprehensive study of kinetics mechanism of Fischer-Tropsch synthesis over cobalt-based catalyst. Chem. Eng. Sci. 2017, 171, 32–60. [Google Scholar] [CrossRef] [Green Version]
  22. Ostadi, M.; Rytter, E.; Hillestad, M. Evaluation of kinetic models for Fischer–Tropsch cobalt catalysts in a plug flow reactor. Chem. Eng. Res. Des. 2016, 114, 236–246. [Google Scholar] [CrossRef]
  23. Moazami, N.; Wyszynski, M.L.; Mahmoudi, H.; Tsolakis, A.; Zou, Z.; Panahifar, P.; Rahbar, K. Modelling of a fixed bed reactor for Fischer–Tropsch synthesis of simulated N2-rich syngas over Co/SiO2: Hydrocarbon production. Fuel 2015, 154, 140–151. [Google Scholar] [CrossRef]
  24. Bhatelia, T.; Li, E.; Sun, Y.; Hazewinkel, P.; Burke, N.; Sage, V. Chain length dependent olefin re-adsorption model for Fischer-Tropsch synthesis over Co-Al2O3 catalyst. Fuel Process. Technol. 2014, 125, 277–289. [Google Scholar] [CrossRef]
  25. Van Dijk, H.A.J. The Fischer-Tropsch Synthesis: A Mechanistic Study Using Transient Isotopic Tracing. Ph.D. Thesis, Eindhoven University of Technology, Eindhoven, The Nederland, 2001. [Google Scholar]
  26. Kondamudi, K.; Pant, K.K.; Upadhyayula, S. Synergistic Effect of Fe−Co Bimetallic Catalyst on FTS and WGS Activity in the Fischer−Tropsch Process: A Kinetic Study. Ind. Eng. Chem. Res. 2017, 56, 4659–4671. [Google Scholar]
  27. Davis, B.H. Fischer-Tropsch synthesis: Current mechanism and futuristic needs. Fuel Process. Technol. 2001, 71, 157–166. [Google Scholar] [CrossRef]
  28. Fajín, J.; Cordeiro, M.; Gomes, J.; Fajín, J.L.C.; Cordeiro, M.N.D.S.; Gomes, J.R.B. Fischer-Tropsch Synthesis on Multicomponent Catalysts: What Can We Learn from Computer Simulations? Catalysts 2015, 5, 3–17. [Google Scholar] [CrossRef] [Green Version]
  29. Wojciechowski, B.W. The Kinetics of the Fischer- Tropsch Synthesis. Catal. Re. Sci. Eng. 1988, 629–702. [Google Scholar] [CrossRef]
  30. Turner, M.L.; Long, H.C.; Shenton, A.; Byers, P.K.; Maitlis, P.M. The Alkenyl Mechanism for Fischer-Tropsch Surface Methylene Polymerisation; the Reactions of Vinylic Probes with CO/H2 over Rhodium Catalyst. Chem. - A Eur. J. 1995, 1, 549–556. [Google Scholar] [CrossRef]
  31. Fischer, F.; Tropsch, H. The Synthesis of Petroleum at Atmospheric Pressures from Gasification Products of Coal. Brennstoff-Chemie 1926, 7, 97–104. [Google Scholar]
  32. Lox, E.S.; Froment, G.F. Kinetics of the Fischer-Tropsch Reaction on a Precipitated Promoted Iron Catalyst. 2. Kinetic Modeling. Ind. Eng. Chem. Res. 1993, 71–82. [Google Scholar] [CrossRef]
  33. Shi, B.; Davis, B.H. Fischer–Tropsch synthesis: accounting for chain-length related phenomena. Appl. Catal. A Gen. 2004, 277, 61–69. [Google Scholar] [CrossRef]
  34. Schulz, H.; Claeys, M. Kinetic modelling of Fischer–Tropsch product distributions. Appl. Catal. A Gen. 1999, 186, 91–107. [Google Scholar] [CrossRef]
  35. Iglesia, E.; Reyes, S.C.; Madon, R.J. Transport-Enhanced a-Olefin Readsorption Pathways in Ru-Catalyzed Hydrocarbon Synthesis. J. Catal. 1991, 6, 238–256. [Google Scholar] [CrossRef]
  36. Botes, F.G. Proposal of a New Product Characterization Model for the Iron-Based Low-Temperature Fischer−Tropsch Synthesis. Energy Fuels 2007, 21, 1379–1389. [Google Scholar] [CrossRef]
  37. Schulz, H.; Claeys, M. Reactions of α-olefins of different chain length added during Fischer–Tropsch synthesis on a cobalt catalyst in a slurry reactor. Appl. Catal. A Gen. 1999, 186, 71–90. [Google Scholar] [CrossRef]
  38. Pant, K.K.; Upadhyayula, S. Detailed kinetics of Fischer Tropsch synthesis over Fe-Co bimetallic catalyst considering chain length dependent olefin desorption. Fuel 2019, 236, 1263–1272. [Google Scholar] [CrossRef]
  39. Todic, B.; Bhatelia, T.; Froment, G.F.; Ma, W.; Jacobs, G.; Davis, B.H.; Bukur, D.B. Kinetic Model of Fischer−Tropsch Synthesis in a Slurry Reactor on Co−Re/Al2O3 Catalyst. Ind. Eng. Chem. Res. 2013, 52, 669–679. [Google Scholar] [CrossRef]
  40. Visconti, C.G.; Tronconi, E.; Lietti, L.; Zennaro, R.; Forzatti, P. Development of a complete kinetic model for the Fischer – Tropsch synthesis over Co/Al2O3 catalysts. Chem. Eng. Sci. 2007, 62, 5338–5343. [Google Scholar] [CrossRef]
  41. Kwack, S.-H.; Park, M.-J.; Bae, J.W.; Ha, K.-S.; Jun, K.-W. Development of a kinetic model of the Fischer – Tropsch synthesis reaction with a cobalt-based catalyst. React. Kinet. Mech. Catal. 2011, 483–502. [Google Scholar] [CrossRef]
  42. Gavrilović, L.; Save, J.; Blekkan, E.A. The Effect of Potassium on Cobalt-Based Fischer–Tropsch Catalysts with Different Cobalt Particle Sizes. Catalysts 2019, 9, 351. [Google Scholar]
  43. Karaca, H.; Safonova, O.V.; Chambrey, S.; Fongarland, P.; Roussel, P.; Griboval-Constant, A.; Lacroix, M.; Khodakov, A.Y. Structure and catalytic performance of Pt-promoted alumina-supported cobalt catalysts under realistic conditions of Fischer-Tropsch synthesis. J. Catal. 2011, 277, 14–26. [Google Scholar] [CrossRef]
  44. Nabaho, D.; Niemantsverdriet, J.W.; Claeys, M.; van Steen, E. Hydrogen spillover in the Fischer–Tropsch synthesis: An analysis of gold as a promoter for cobalt–alumina catalysts. Catal. Today 2016, 275, 27–34. [Google Scholar] [CrossRef]
  45. Bezemer, G.L.; Bitter, J.H.; Kuipers, H.P.C.E.; Oosterbeek, H.; Holewijn, J.E.; Xu, X.; Kapteijn, F.; Van Diilen, A.J.; De Jong, K.P. Cobalt particle size effects in the Fischer-Tropsch reaction studied with carbon nanofiber supported catalysts. J. Am. Chem. Soc. 2006, 128, 3956–3964. [Google Scholar] [CrossRef] [PubMed]
  46. Fischer, N.; Clapham, B.; Feltes, T.; Claeys, M. Cobalt-Based Fischer-Tropsch Activity and Selectivity as a Function of Crystallite Size and Water Partial Pressure. ACS Catal. 2015, 5, 113–121. [Google Scholar] [CrossRef]
  47. Rønning, M.; Tsakoumis, N.E.; Voronov, A.; Johnsen, R.E.; Norby, P.; Van Beek, W.; Borg, Ø.; Rytter, E.; Holmen, A. Combined XRD and XANES studies of a Re-promoted Co/γ-Al2O3 catalyst at Fischer-Tropsch synthesis conditions. Catal. Today 2010, 155, 289–295. [Google Scholar] [CrossRef]
  48. Rytter, E.; Borg, Ø.; Tsakoumis, N.E.; Holmen, A. Water as key to activity and selectivity in Co Fischer-Tropsch synthesis: Γ-alumina based structure-performance relationships. J. Catal. 2018, 365, 334–343. [Google Scholar] [CrossRef]
  49. Fratalocchi, L.; Giorgio, C.; Lietti, L.; Fischer, N.; Claeys, M. A promising preparation method for highly active cobalt based Fischer- Tropsch catalysts supported on stabilized Al2O3. Appl. Catal. A Gen. 2018, 556, 92–103. [Google Scholar] [CrossRef]
  50. Den Breejen, J.P.; Radstake, P.B.; Bezemer, G.L.; Bitter, J.H.; Fr{\o}seth, V.; Holmen, A.; De Jong, K.P. On the Origin of the Cobalt Particle Size Effects in. J. Am. Chem. Soc. 2009, 131, 7197–7203. [Google Scholar] [CrossRef]
  51. Lögdberg, S.; Lualdi, M.; Järås, S.; Walmsley, J.C.; Blekkan, E.A.; Rytter, E.; Holmen, A. On the selectivity of cobalt-based Fischer–Tropsch catalysts: Evidence for a common precursor for methane and long-chain hydrocarbons. J. Catal. 2010, 274, 84–98. [Google Scholar] [CrossRef]
  52. Robota, H.J.; Richard, L.A.; Deshmukh, S.; Leviness, S.; Leonarduzzi, D.; Roberts, D. High Activity and Selective Fischer-Tropsch Catalysts for Use in a Microchannel Reactor. Catal. Surv. Asia 2014, 18, 177–182. [Google Scholar] [CrossRef]
  53. Ojeda, M.; Nabar, R.; Nilekar, A.U.; Ishikawa, A.; Mavrikakis, M.; Iglesia, E. CO activation pathways and the mechanism of Fischer–Tropsch synthesis. J. Catal. 2010, 272, 287–297. [Google Scholar] [CrossRef]
  54. Storsæter, S.; Chen, D.; Holmen, A. Microkinetic modelling of the formation of C 1 and C 2 products in the Fischer – Tropsch synthesis over cobalt catalysts. Surf. Sci. 2006, 600f, 2051–2063. [Google Scholar] [CrossRef]
  55. Mansouri, M.; Atashi, H.; Mirzaei, A.A.; Jangi, R. Kinetics of the Fischer-Tropsch synthesis on silica-supported cobalt-cerium catalyst. Int. J. Ind. Chem. 2013, 4, 1–10. [Google Scholar] [CrossRef]
  56. Nikbakht, N.; Mirzaei, A.A.; Atashi, H. Kinetic modeling of the Fischer-Tropsch reaction over a zeolite supported Fe-Co-Ce catalyst prepared using impregnation procedure. Fuel 2018, 229, 209–216. [Google Scholar] [CrossRef]
  57. Mirzaei, A.A.; Shirzadi, B.; Atashi, H.; Mansouri, M. Modeling and operating conditions optimization of Fischer-Tropsch synthesis in a fixed-bed reactor. J. Ind. Eng. Chem. 2012, 18, 1515–1521. [Google Scholar] [CrossRef]
  58. Almeida, L.C.; Sanz, O.; Merino, D.; Arzamendi, G.; Gandía, L.M.; Montes, M. Kinetic analysis and microstructured reactors modeling for the Fischer – Tropsch synthesis over a Co – Re/Al2O3 catalyst. Catal. Today 2013, 215, 103–111. [Google Scholar] [CrossRef]
  59. Keyser, M.J.; Everson, R.C.; Espinoza, R.L. Fischer-Tropsch Kinetic Studies with Cobalt-Manganese Oxide Catalysts. Ind. Eng. Chem. Res. 2000, 39, 48–54. [Google Scholar] [CrossRef]
  60. Nikparsaa, P.; Mirzaeia, A.A.; Atashib, H. Effect of reaction conditions and Kinetic study on the Fischer-Tropsch synthesis over fused Co-Ni/Al2O3 catalyst. J. Fuel Chem. Technol. 2014, 42, 710–718. [Google Scholar] [CrossRef]
  61. Ghouri, M.M.; Afzal, S.; Hussain, R.; Blank, J.; Bukur, D.B.; Elbashir, N.O. Multi-scale modeling of fixed-bed Fischer Tropsch reactor. Comput. Chem. Eng. 2016, 91, 38–48. [Google Scholar] [CrossRef]
  62. Cheng, J.; Hu, P.; Ellis, P.; French, S.; Kelly, G.; Lok, C.M. A DFT study of the chain growth probability in Fischer–Tropsch synthesis. J. Catal. 2008, 257, 221–228. [Google Scholar] [CrossRef]
  63. Goda, A.M.; Neurock, M.; Barteau, M.A.; Chen, J.G. Effect of hydrocarbon chain length and cyclization on the adsorption strength of unsaturated hydrocarbons on Pt/3d bimetallic surfaces. Surf. Sci. 2008, 602, 2513–2523. [Google Scholar] [CrossRef]
  64. Froment, G.F.; Bischoff, K.B.; De Wilde, J. Chemical Reactor Analysis and Design; John Wiley & Sons, Inc.: Hoboken, NJ, USA, 2010; Volume 91. [Google Scholar]
  65. Chen, W.; Filot, I.A.W.; Pestman, R.; Hensen, E.J.M. Mechanism of Cobalt-Catalyzed CO Hydrogenation: 2. Fischer− Tropsch Synthesis. ACS Catal. 2017, 7, 8061–8071. [Google Scholar] [CrossRef] [PubMed]
  66. Rytter, E.; Tsakoumis, N.E.; Holmen, A. On the selectivity to higher hydrocarbons in Co-based Fischer-Tropsch synthesis. Catal. Today 2016, 261, 3–16. [Google Scholar] [CrossRef]
  67. Kasun, G.T.; Gunasooriya, K.; Van Bavel, A.P.; Kuipers, H.P.C.E.; Saeys, M. Key Role of Surface Hydroxyl Groups in C−O Activation during Fischer−Tropsch Synthesis. ACS Catal. 2016, 6, 3660–3664. [Google Scholar]
  68. Kruit, K.D.; Vervloet, D.; Kapteijn, F.; Van Ommen, J.R. Selectivity of the Fischer-Tropsch process: Deviations from single alpha product distribution explained by gradients in process conditions. Catal. Sci. Technol. 2013, 3, 2210–2213. [Google Scholar] [CrossRef]
  69. Yang, R.; Zhou, L.; Gao, J.; Hao, X.; Wu, B.; Yang, Y.; Li, Y. Effects of experimental operations on the Fischer-Tropsch product distribution. Catal. Today 2017, 298, 77–88. [Google Scholar] [CrossRef]
  70. Scherrer, P. Bestimmung der Grosse und der inneren Struktur von Kolloidterilchen mittels Rontgestrahlen. Nachrichten von der Gesellschaft der Wissenschaften zu Göttingen, Math. Klasse 1918, 98–100. [Google Scholar]
  71. Boyer, C.; Gazarian, J.; Lecocq, V.; Maury, S.; Forret, A.; Schweitzer, J.M.; Souchon, V. Development of the Fischer-Tropsch Process: From the Reaction Concept to the Process Book. Oil Gas Sci. Technol. – Rev. d’IFP Energies Nouv. 2016, 71, 44. [Google Scholar] [CrossRef] [Green Version]
  72. Botes, F.G.; van Dyk, B.; Mcgregor, C. The Development of a Macro Kinetic Model for a Commercial Co/Pt/Al2O3 Fischer-Tropsch Catalyst. Ind. Eng. Chem. Res. 2009, 2, 10439–10447. [Google Scholar] [CrossRef]
  73. Yang, J.; Liu, Y.; Chang, J.; Wang, Y.-N.; Bai, L.; Xu, Y.-Y.; Xiang, H.-W.; Li, Y.-W.; Zhong, B. Detailed Kinetics of Fischer−Tropsch Synthesis on an Industrial Fe−Mn Catalyst. Ind. Eng. Chem. Res. 2003, 42, 5066–5090. [Google Scholar] [CrossRef]
  74. Evans, M.G.; Polanyi, M. Inertia and Driving Force of Chemical Reactions. Trans. Faraday Soc. 1937, 34, 11–24. [Google Scholar] [CrossRef]
  75. Sánchez-López, J.R.G.; Hernández-Ramírez, A.; Martínez-Hernández, A. Modeling of transport phenomena in fixed-bed reactors for the Fischer-Tropsch reaction: a brief literature review. Rev Chem Eng 2017, 33, 109–142. [Google Scholar] [CrossRef]
  76. Mears, D.E. Tests for Transport Limitations in Experimental Catalytic Reactors. Ind. Eng. Chem. Process Des. Dev. 1970, 10, 541–547. [Google Scholar] [CrossRef]
  77. Vik, C.B.; Solsvik, J.; Hillestad, M.; Jakobsen, H.A. Interfacial mass transfer limitations of the Fischer-Tropsch synthesis operated in a slurry bubble column reactor at industrial conditions. Chem. Eng. Sci. 2018, 192, 1138–1156. [Google Scholar] [CrossRef]
  78. Vervloet, D.; Kapteijn, F.; Nijenhuis, J.; Ruud Van Ommen, J. Fischer–Tropsch reaction–diffusion in a cobalt catalyst particle: aspects of activity and selectivity for a variable chain growth probability. Catal. Sci. Technol. 2012, 2, 1221–1233. [Google Scholar] [CrossRef]
  79. Fratalocchi, L.; Visconti, C.G.; Groppi, G.; Lietti, L.; Tronconi, E. Intensifying heat transfer in Fischer-Tropsch tubular reactors through the adoption of conductive packed foams. Chem. Eng. J. 2018, 349, 829–837. [Google Scholar] [CrossRef]
  80. Mandić, M.; Todić, B.; Živanić, L.; Nikačević, N.; Bukur, D.B. Effects of Catalyst Activity, Particle Size and Shape, and Process Conditions on Catalyst Effectiveness and Methane Selectivity for Fischer-Tropsch Reaction: A Modeling Study. Ind. Eng. Chem. Res. 2017, 56, 2733–2745. [Google Scholar] [CrossRef]
  81. Zohdi-Fasaei, H.; Atashi, H.; Farshchi Tabrizi, F.; Mirzaei, A.A. Effects of mass transfer on Fischer-Tropsch kinetics over mesoporous silica-supported CoeMneCe nano catalysts in a fixed-bed reactor. J. Nat. Gas Sci. Eng. 2016, 32, 262–272. [Google Scholar] [CrossRef]
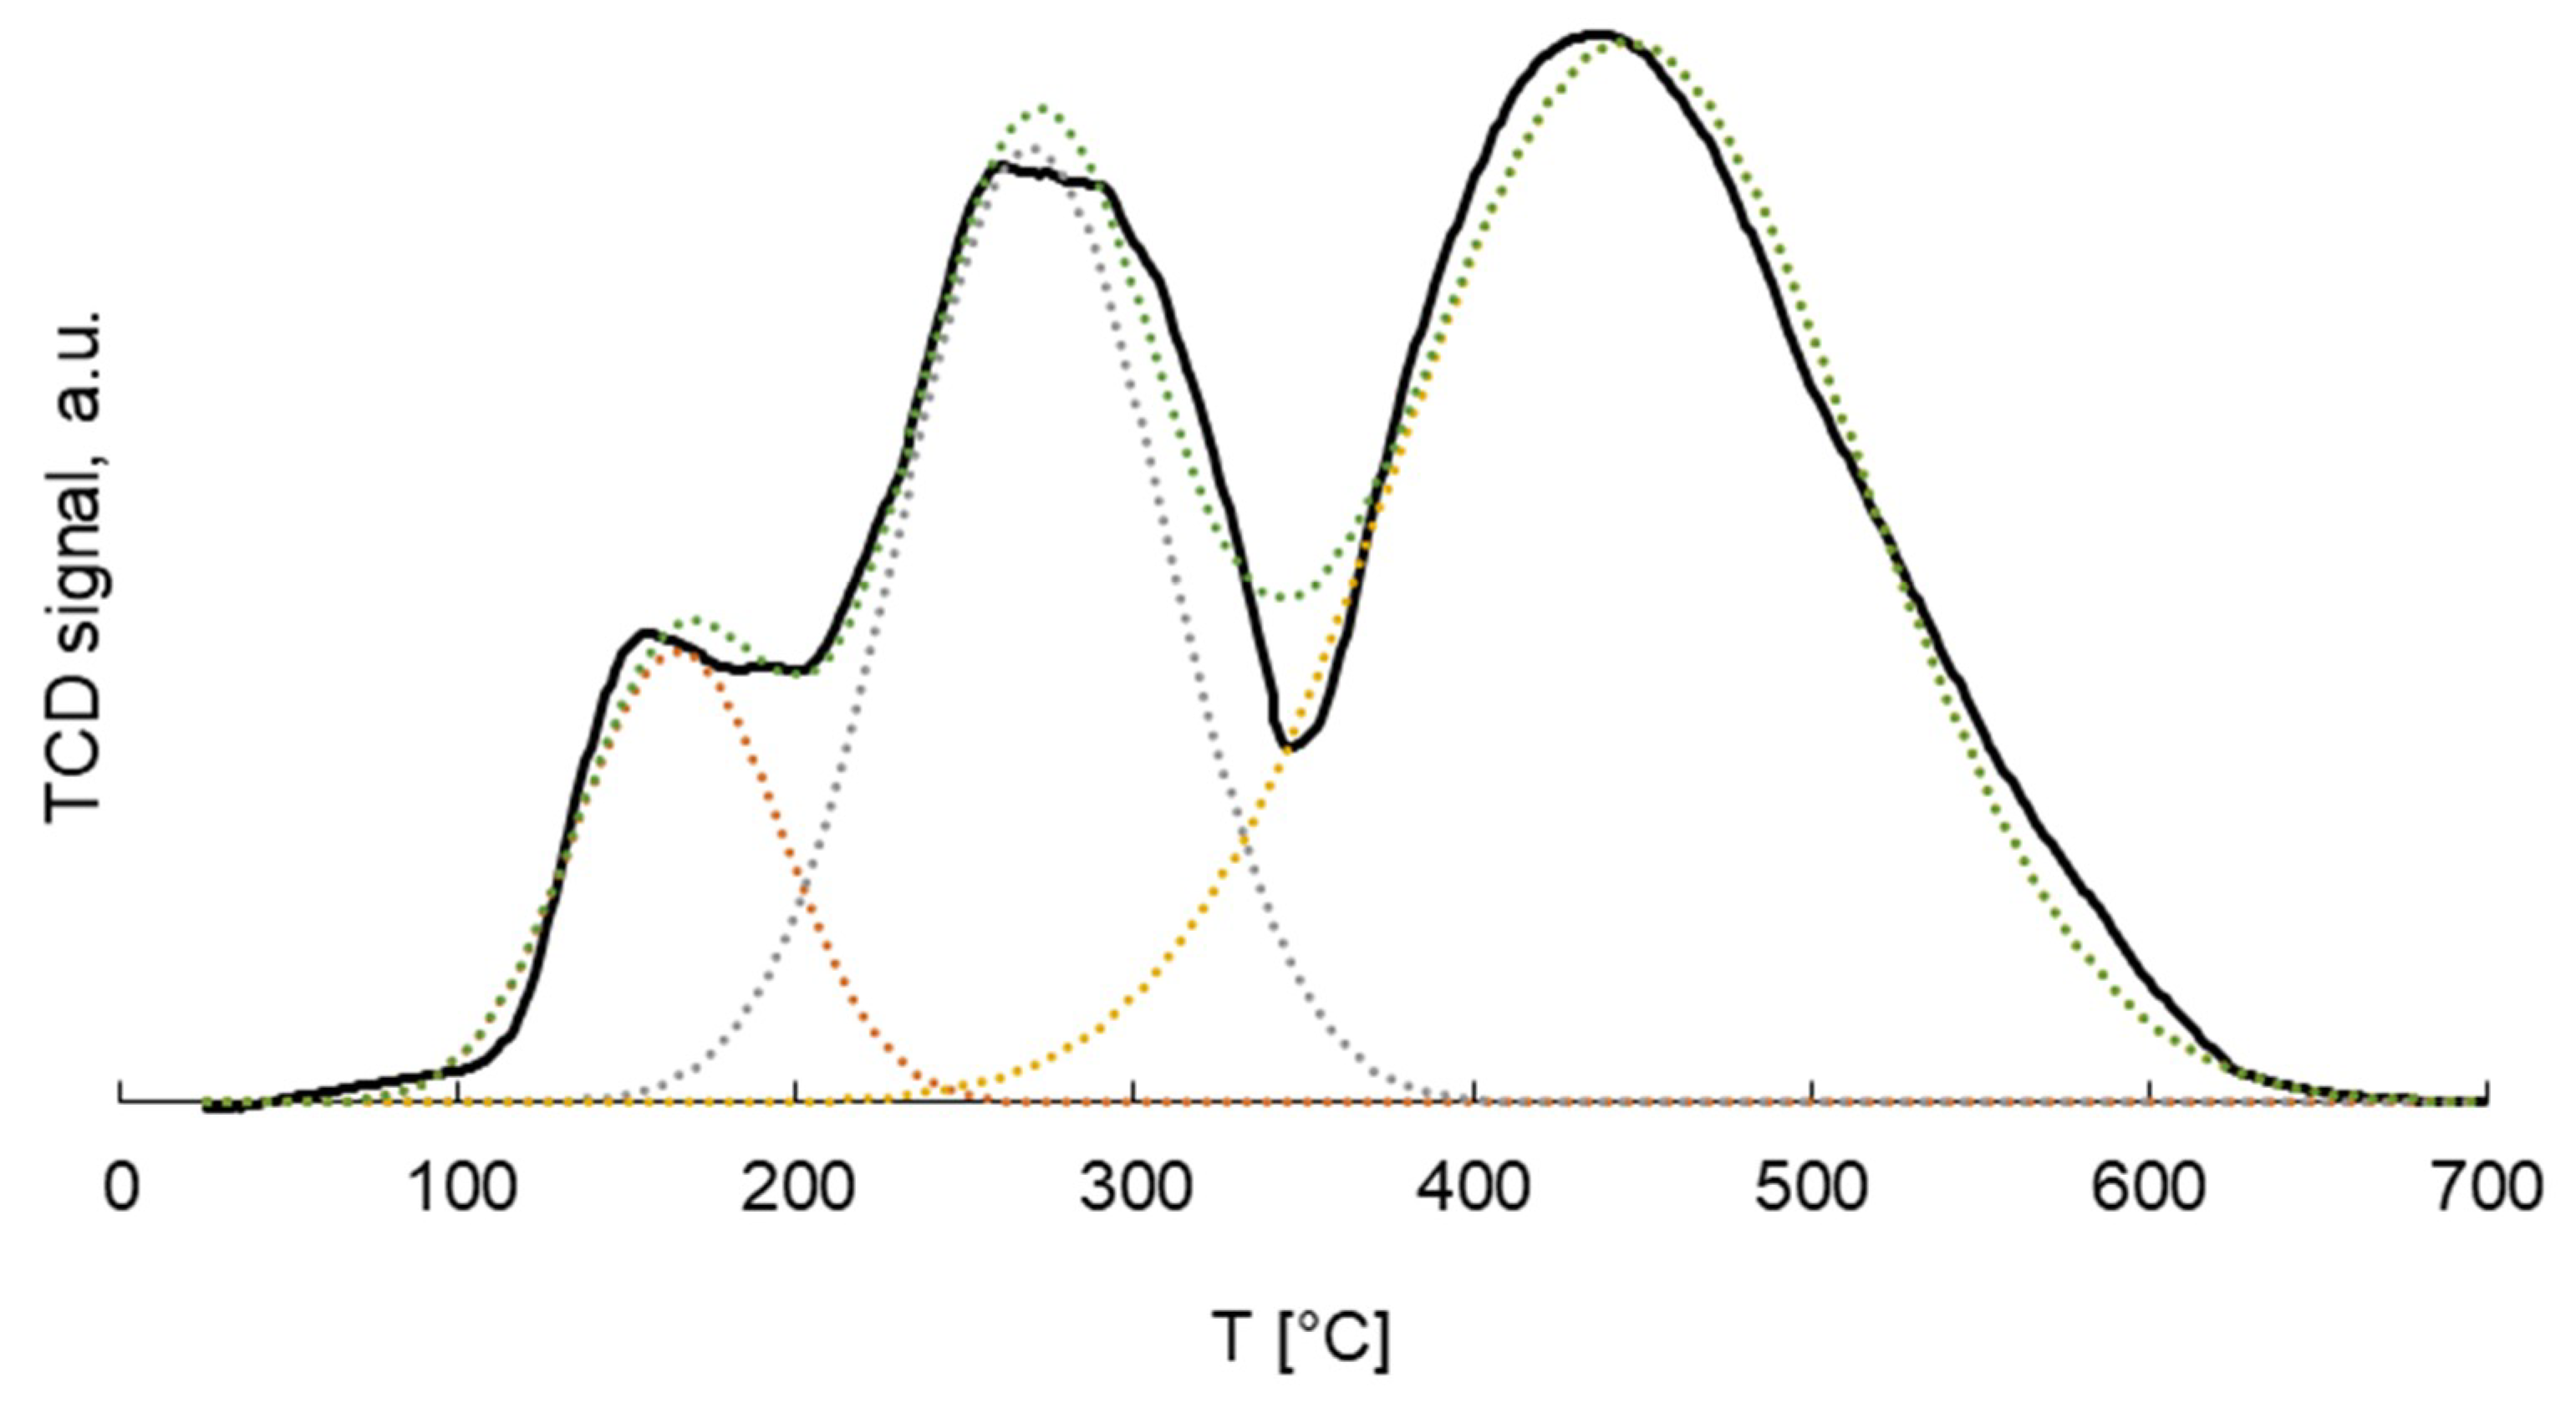
Figure 1. Temperature-programmed reduction (TPR) results for the studied Co-Pt/γ-Al2O3 catalyst.
Catalysts 09 00717 g001
Figure 2. XRD diffractogram for Co-Pt/γ-Al2O3 non-reduced catalyst.
Catalysts 09 00717 g002
Figure 3. TOF measure (black triangle) comparison against literature reported data: red dots from Loegdber et al. [51], blue stars from Robota et al. [52], black squares from den Breejen et al. [50], blue diamonds from Bezemer et al. [45].
Catalysts 09 00717 g003
Figure 4. Experimental and calculated FTS distribution comparison for paraffins and olefins (left column) and total distribution (right column): (a) T = 482 K, p = 20 bar, H2/CO = 2.08; (b) T = 488 K, p = 30 bar, H2/CO = 2.04; (c) T = 503 K, p = 15 bar, H2/CO = 2.
Catalysts 09 00717 g004
Figure 5. Experimental and calculated rates comparison: (a) products formation rates; (b) CO and H2 consumption rates.
Catalysts 09 00717 g005
Figure 6. PID-Micromeritics tubular reactor equipment.
Catalysts 09 00717 g006
Table 1. Catalyst characterization summary results.
Catalyst21%Co 0.2%Pt/γ-Al2O3
Dispersion (%) a8.2
BET surface area (m2/g) b53.5
Average pore diameter (nm)11.7
Pore volume (cm3/g)0.15
d(Co0) c (nm)16.6
d(Co3O4) d (nm)17.5
a reduced catalyst; b non-reduced catalyst; c H2-chemisorption result; d X-ray diffraction (XRD) result.
Table 2. Mechanistic kinetic steps.
ReactionReaction StepConstant Parameter
0H2 + 2* ↔ 2H*KH
1 rdsCO + H* ↔ H*COkCO
CO + CnH2n+1* ↔ Cn+1OH2n+1*
2H*CO + H* ↔ CH* + OH*K1
Cn+1OH2n+1* + H* ↔ CnH2n−1* + OH*
3CnH2n−1* + H* ↔ CnH2n* + *K2
4CnH2n* + H* ↔ CnH2n+1* + *K3
5OH* + H* ↔ H2O + 2*K4
6 rdsCH3* + H2 → CH4 + H*kMeth
CnH2n+1* + H2 → CnH2n+2 + H*kPar
7 rdsC2H5* → C2H4 + H*kEth
CnH2n+1* → CnH2n + H*kOl
*: catalyst surface species/vacancy.
Table 3. Kinetic parameters obtained from the non-linear regression routine by application of the genetic algorithm for global optimum search and Levenberg–Marquardt algorithm for local optimum search. Fvalue (20,909,0.05) = 133.7 > Fcr. = 1.86; tcr. (0.05,21) = 1.64.
ParameterUnittvalueParameterUnittvalueLit. Range
AH1.83 × 10−2MPa−188.8ΔHH−5.97kJ/mol133.8−2.1/−25 [24,39,53]
ACO9.11 × 107mol·(h gcat MPa) −1139.3ECO82.39kJ/mol756.480/120 [17,24,54]
APar1.02 × 108mol·(h gcat MPa) −158.7EPar93.65kJ/mol767.960/100 [24,39]
AMeth5.57 × 108mol·(h gcat MPa) 194.1EMeth89.97kJ/mol138.960/100 [24,39]
AOl6.27 × 108mol·(h gcat) 1739.6EOl95.24kJ/mol565.490/130 [24,32]
AEth8.63 × 108mol·(h gcat) 13.2EEth112.82kJ/mol112.790/130 [24,32]
ΔE1.249kJ/mol(CHx)32.71.1/2.15 [17,38]
A11.84 × 102-36.1ΔH127.98kJ/mol249.3-
A27.77 × 102-71.9ΔH237.00kJ/mol323.1-
A39.02 × 103-35.3ΔH39.60kJ/mol82.5-
A414.3MPa105.7ΔH413.39kJ/mol194.3-
Table 4. Experimental conditions applied in the kinetic tests.
Temp.Pres.H2CON2H2/COXCOWHSV
[K][bar,a][mol %][mol %][mol %][mol %][mol %][mlN/(min gcat)]
4783054%26%20%2.086.87188.9
4881563%30%7%2.108.33285.7
4983040%36%24%1.118.50475.0
5031550%25%25%2.008.60720.0
4882560%30%10%2.008.76400.0
4882545%36%19%1.258.88322.2
4932033%31%36%1.069.53606.1
4932565%31%4%2.109.53146.2
4982558%28%14%2.0710.05682.8
4822050%24%26%2.0810.22370.0
4883051%25%24%2.0410.67205.8
4832560%30%10%2.0010.98166.7
4833051%25%24%2.0411.35196.1
4832046%22%32%2.0912.03304.4
4882159%28%13%2.1112.42177.9
Table 5. Stoichiometric coefficients of the involved reactions.
ReactionParaffins Formation (n ≥ 1)Olefin Formation (n ≥ 2)
CO−n−n
H2−(2n+1)−(2n)
CnH2n+210
CnH2n01
H2Onn