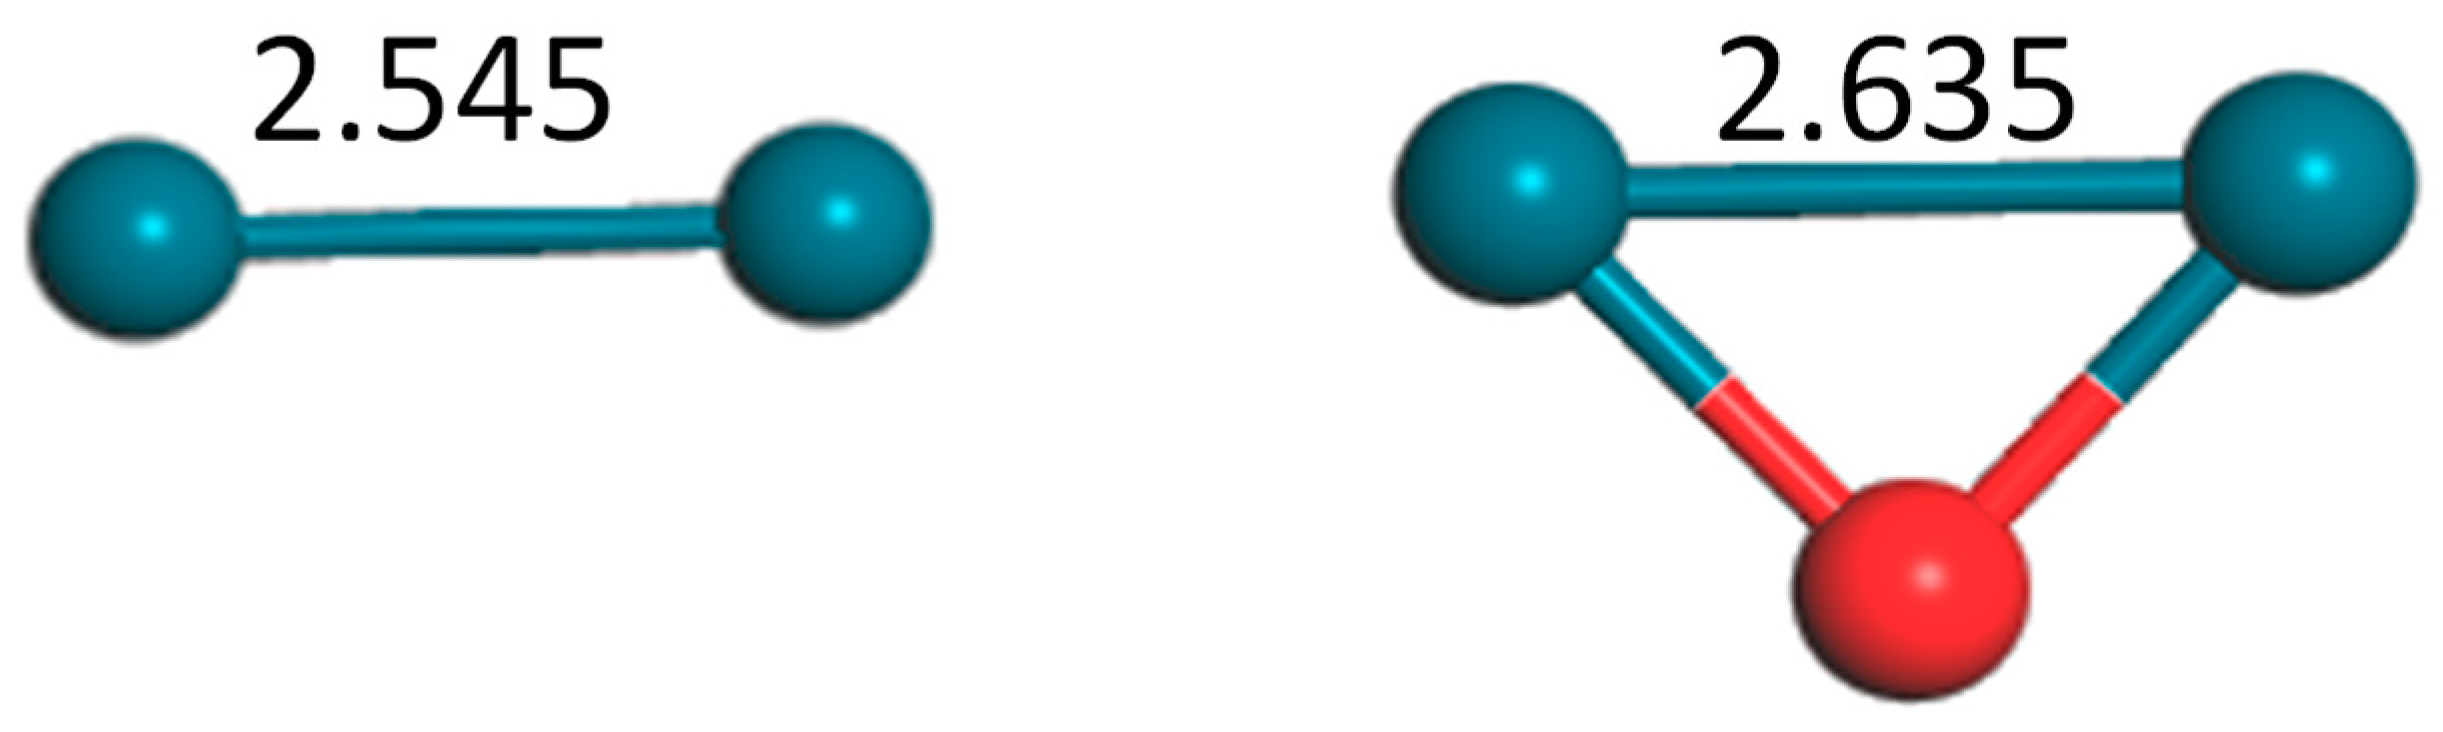
Figure 1.
Structures of dimer Pd2 and trimer Pd2O (bond unit, Å; turquoise: Pd, red: O).
Figure 1.
Structures of dimer Pd2 and trimer Pd2O (bond unit, Å; turquoise: Pd, red: O).
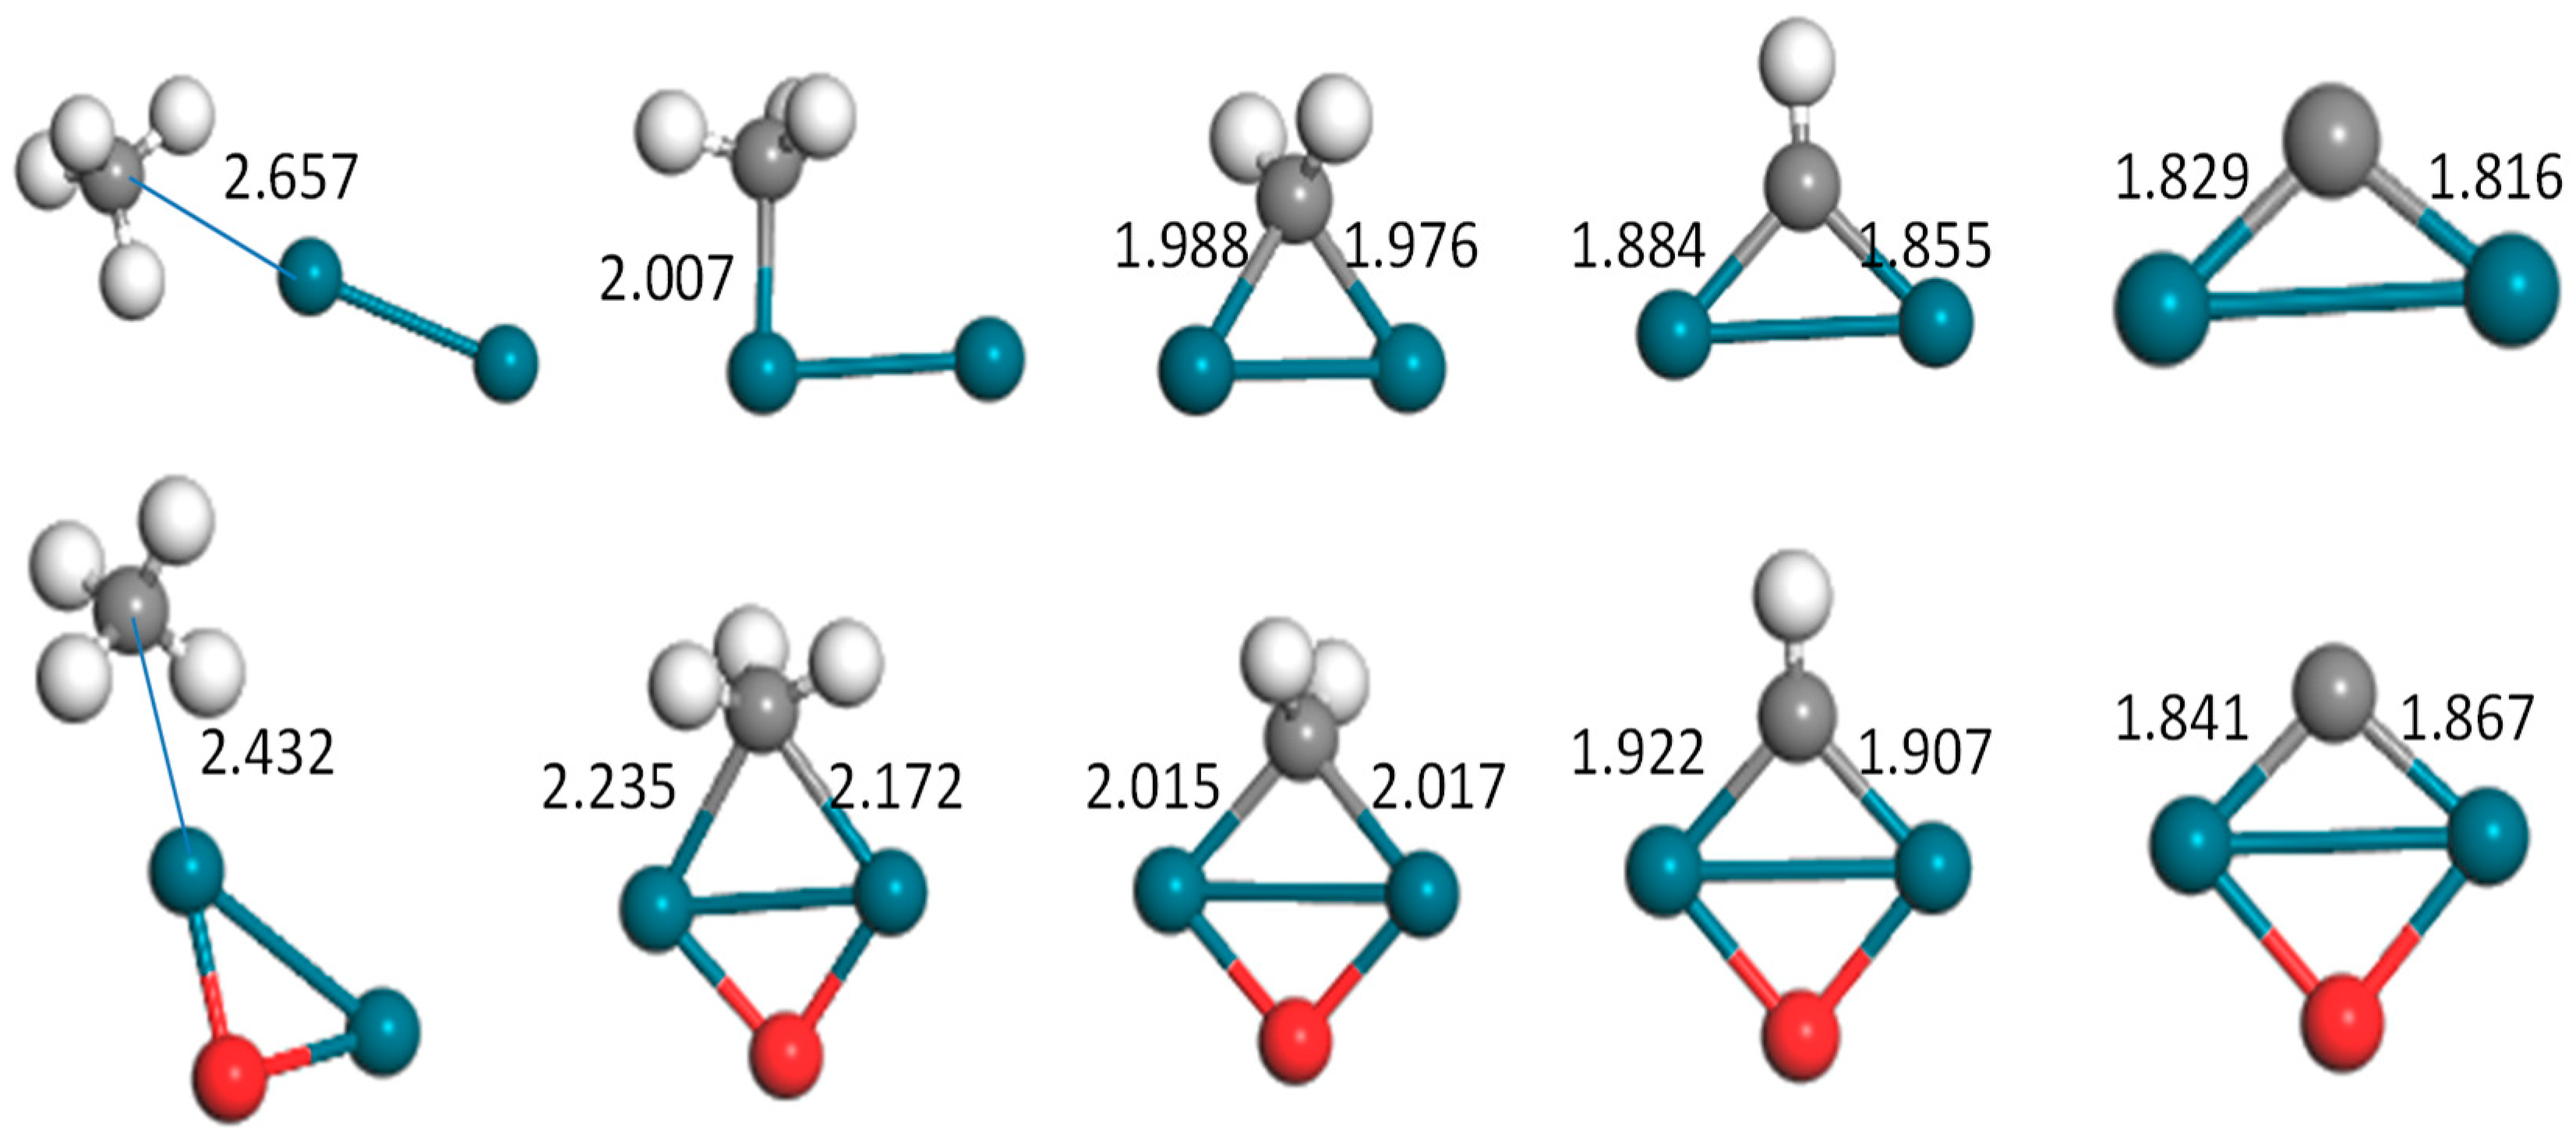
Figure 2.
Optimized configurations of the CHx–Pd2(o) (x = 0–4) system (bond unit, Å; turquoise: Pd, gray: C, white: H, red: O).
Figure 2.
Optimized configurations of the CHx–Pd2(o) (x = 0–4) system (bond unit, Å; turquoise: Pd, gray: C, white: H, red: O).
Figure 3.
Partial density of states (PDOS) of CHx (x =1–4) before and after being catalyzed by Pd2 and Pd2O. (a–d) CH4, CH3, CH2, and CH, respectively, before and after being catalyzed by Pd2 and Pd2O. Black, red, and blue lines, free CHx and CHx–Pd2(O), respectively. The blue dashed vertical lines indicate the Fermi levels.
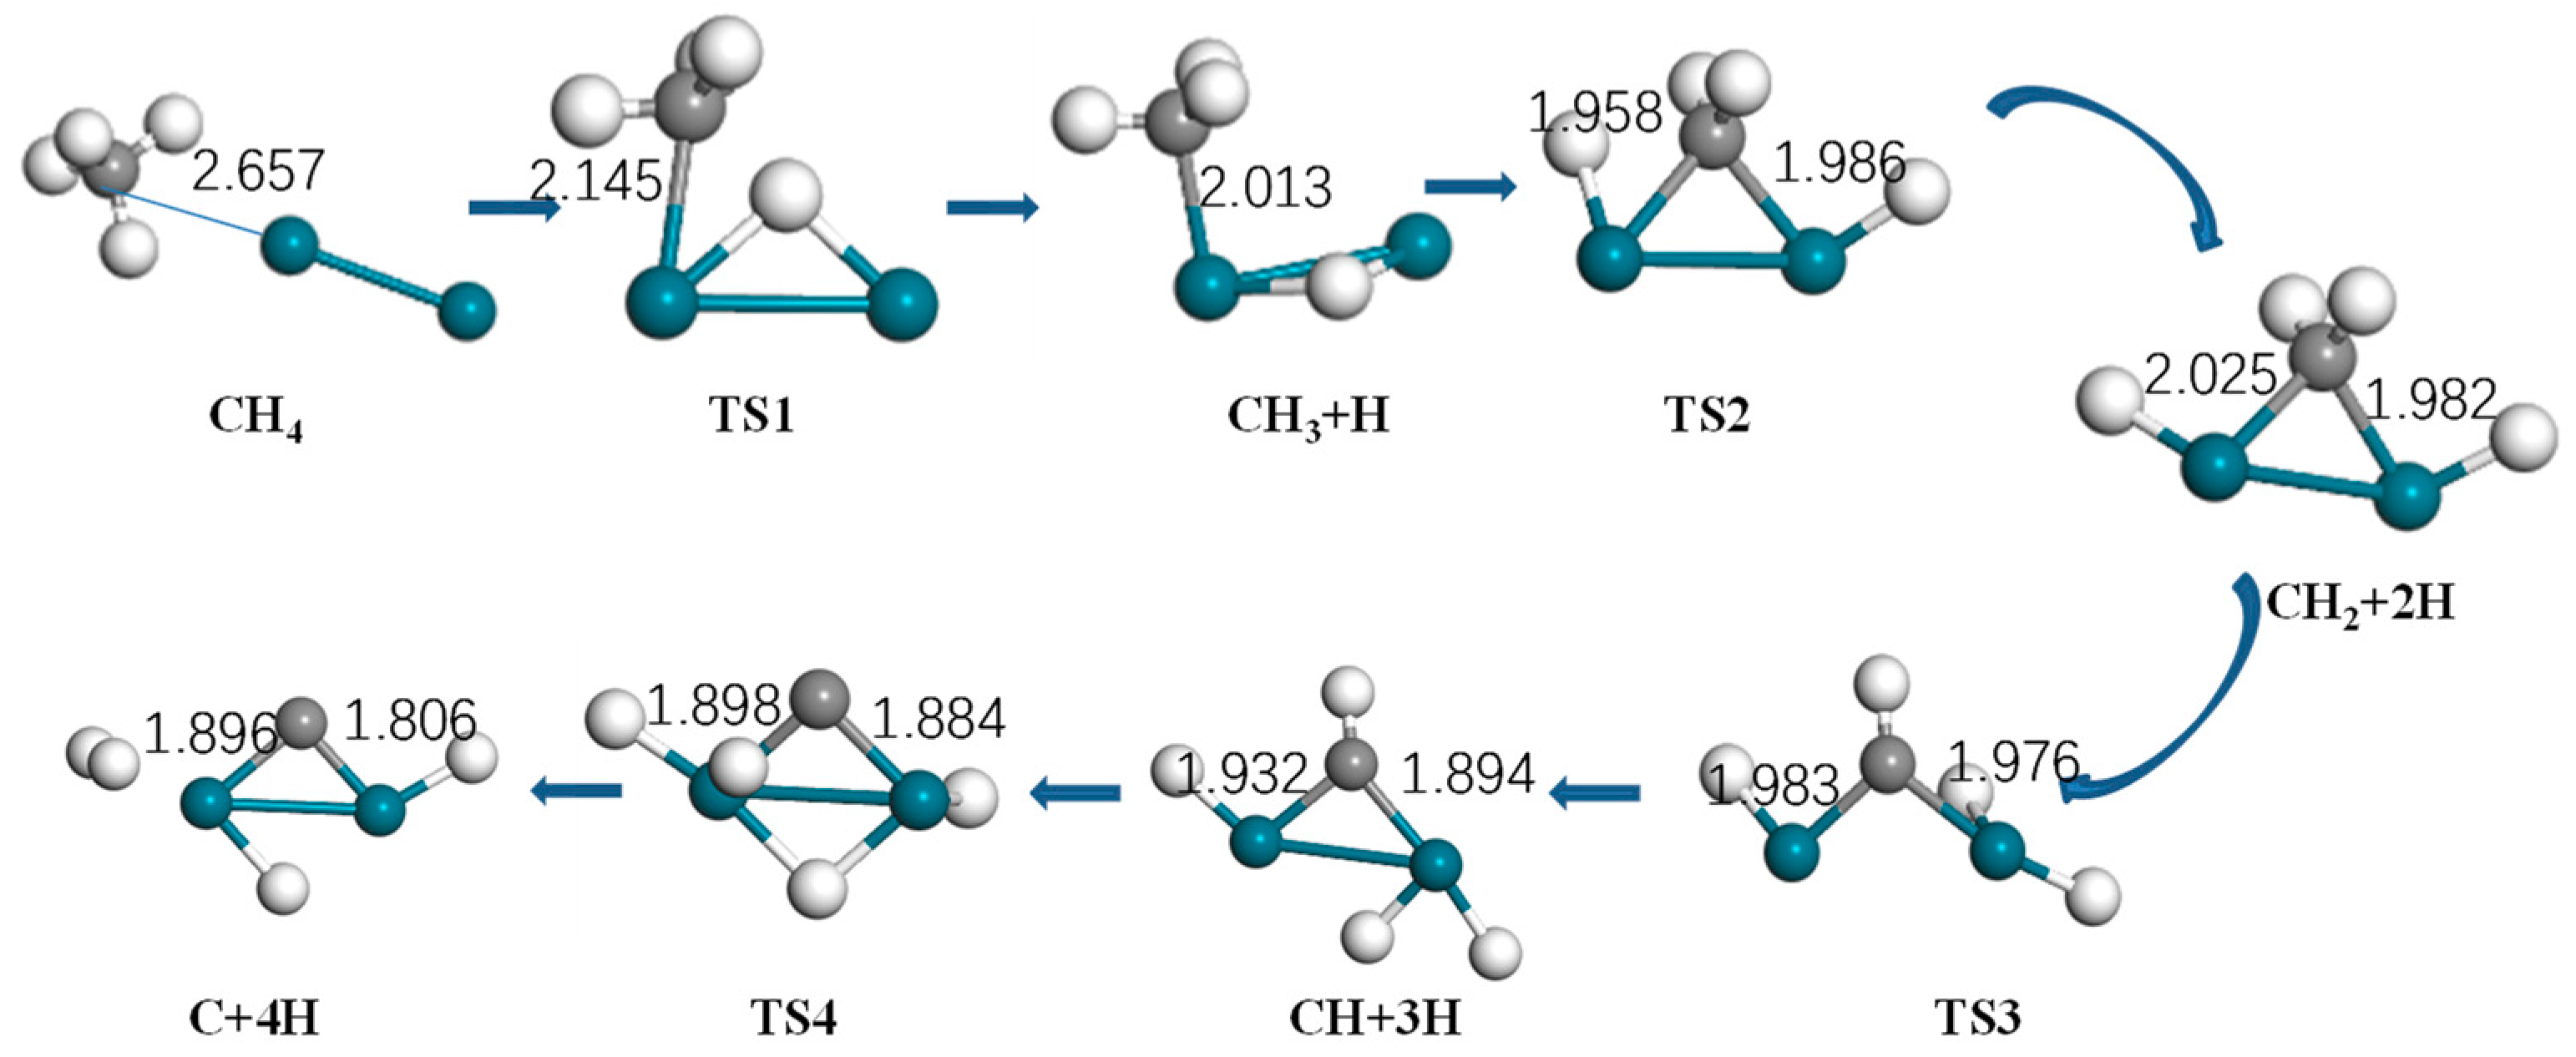
Figure 4.
Optimized structure of reactants, intermediates, products, and the transition state of methane activation by Pd2 (turquoise: Pd, gray: C, white: H).
Figure 4.
Optimized structure of reactants, intermediates, products, and the transition state of methane activation by Pd2 (turquoise: Pd, gray: C, white: H).
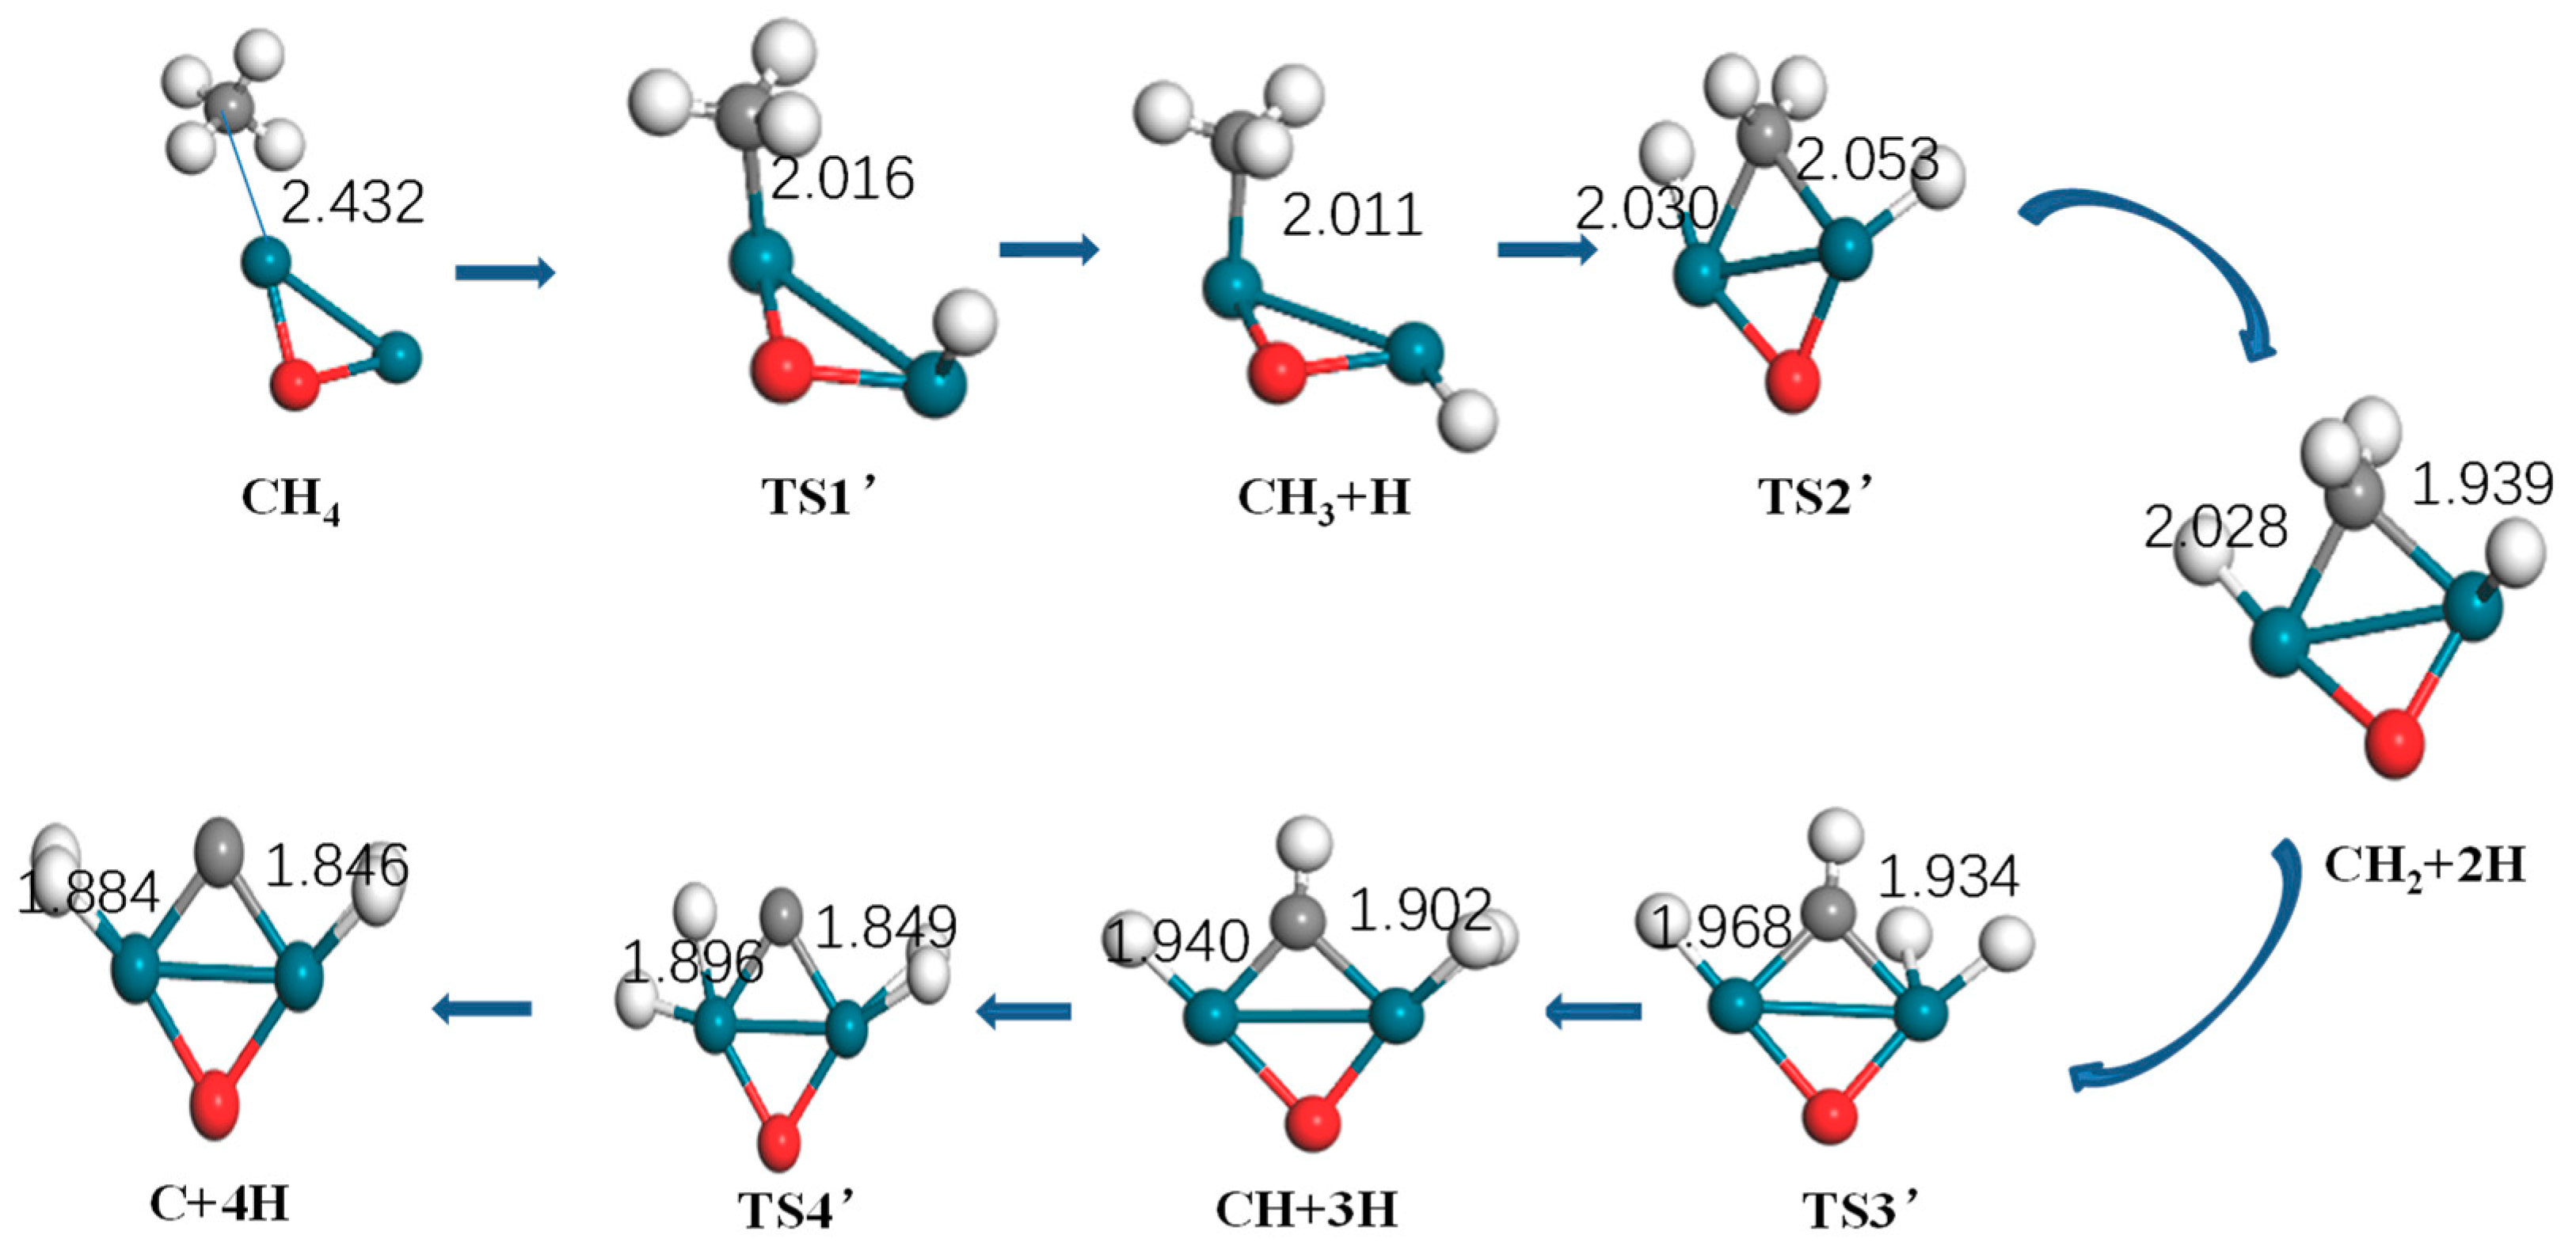
Figure 5.
Optimized structure of reactants, intermediates, products, and the transition state of methane activation by Pd2O (turquoise: Pd, gray: C, white: H).
Figure 5.
Optimized structure of reactants, intermediates, products, and the transition state of methane activation by Pd2O (turquoise: Pd, gray: C, white: H).
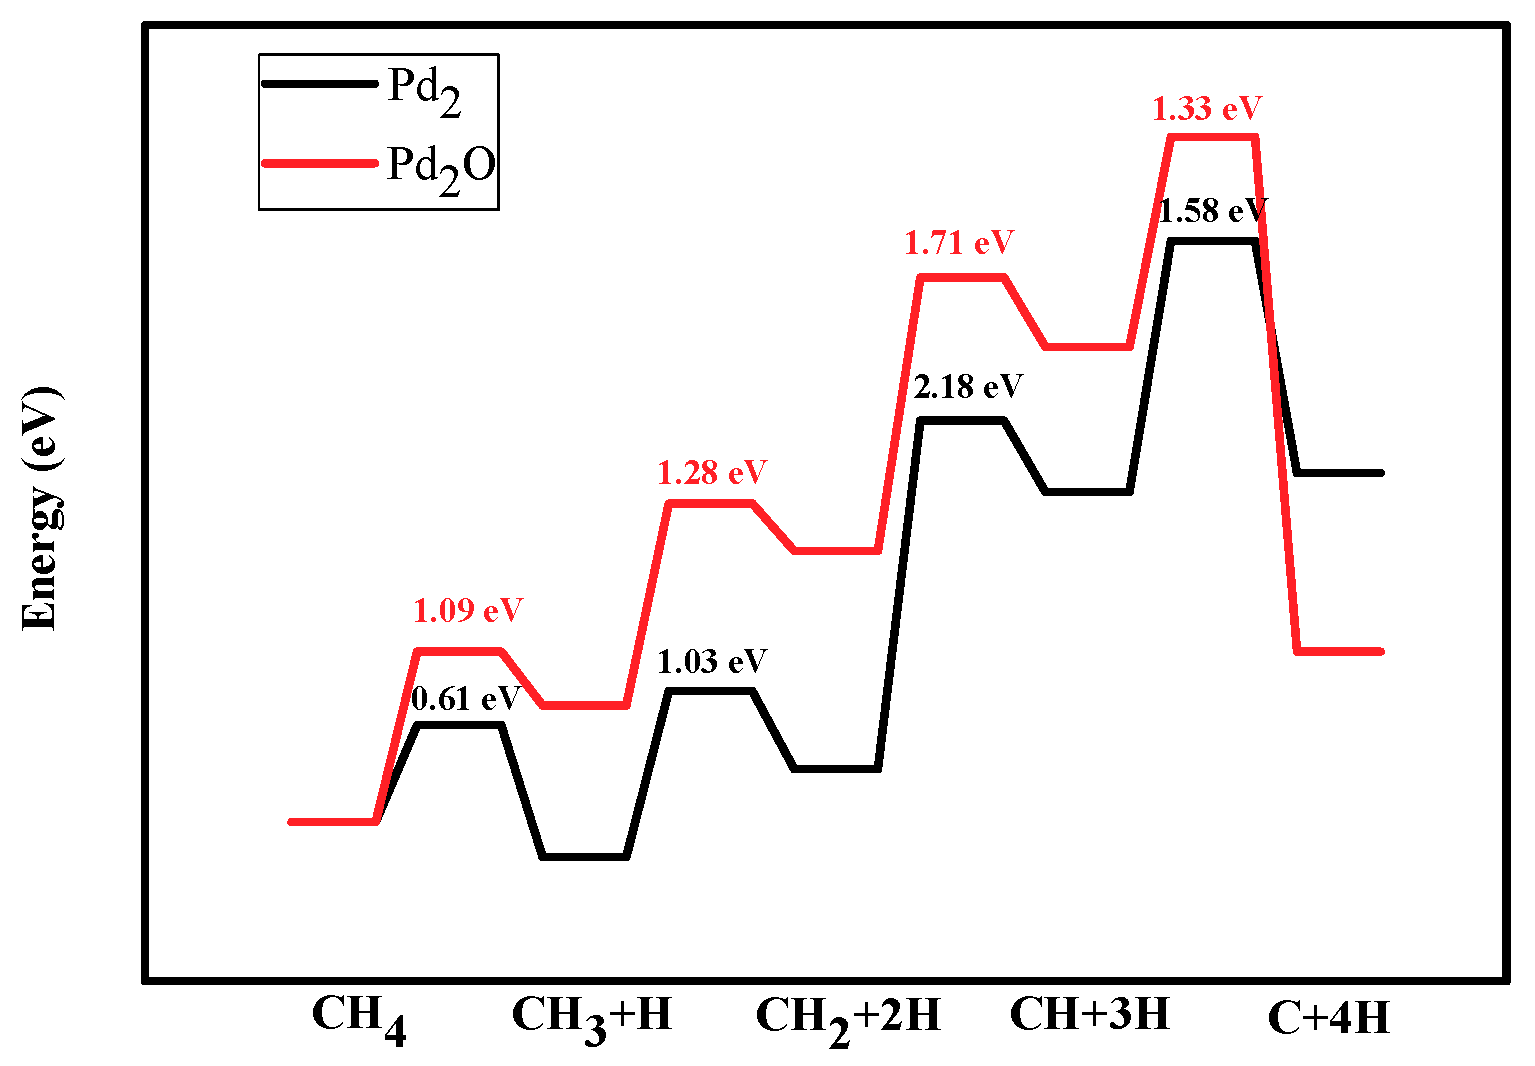
Figure 6.
Energy profiles of dehydrogenation from CH4 to C: CH4→CH3 +H→CH2 + 2H→CH + 3H→C + 4H on Pd2 and Pd2O. Black line and red line represent the dissociation of CHx on Pd2 and Pd2O.
Figure 6.
Energy profiles of dehydrogenation from CH4 to C: CH4→CH3 +H→CH2 + 2H→CH + 3H→C + 4H on Pd2 and Pd2O. Black line and red line represent the dissociation of CHx on Pd2 and Pd2O.
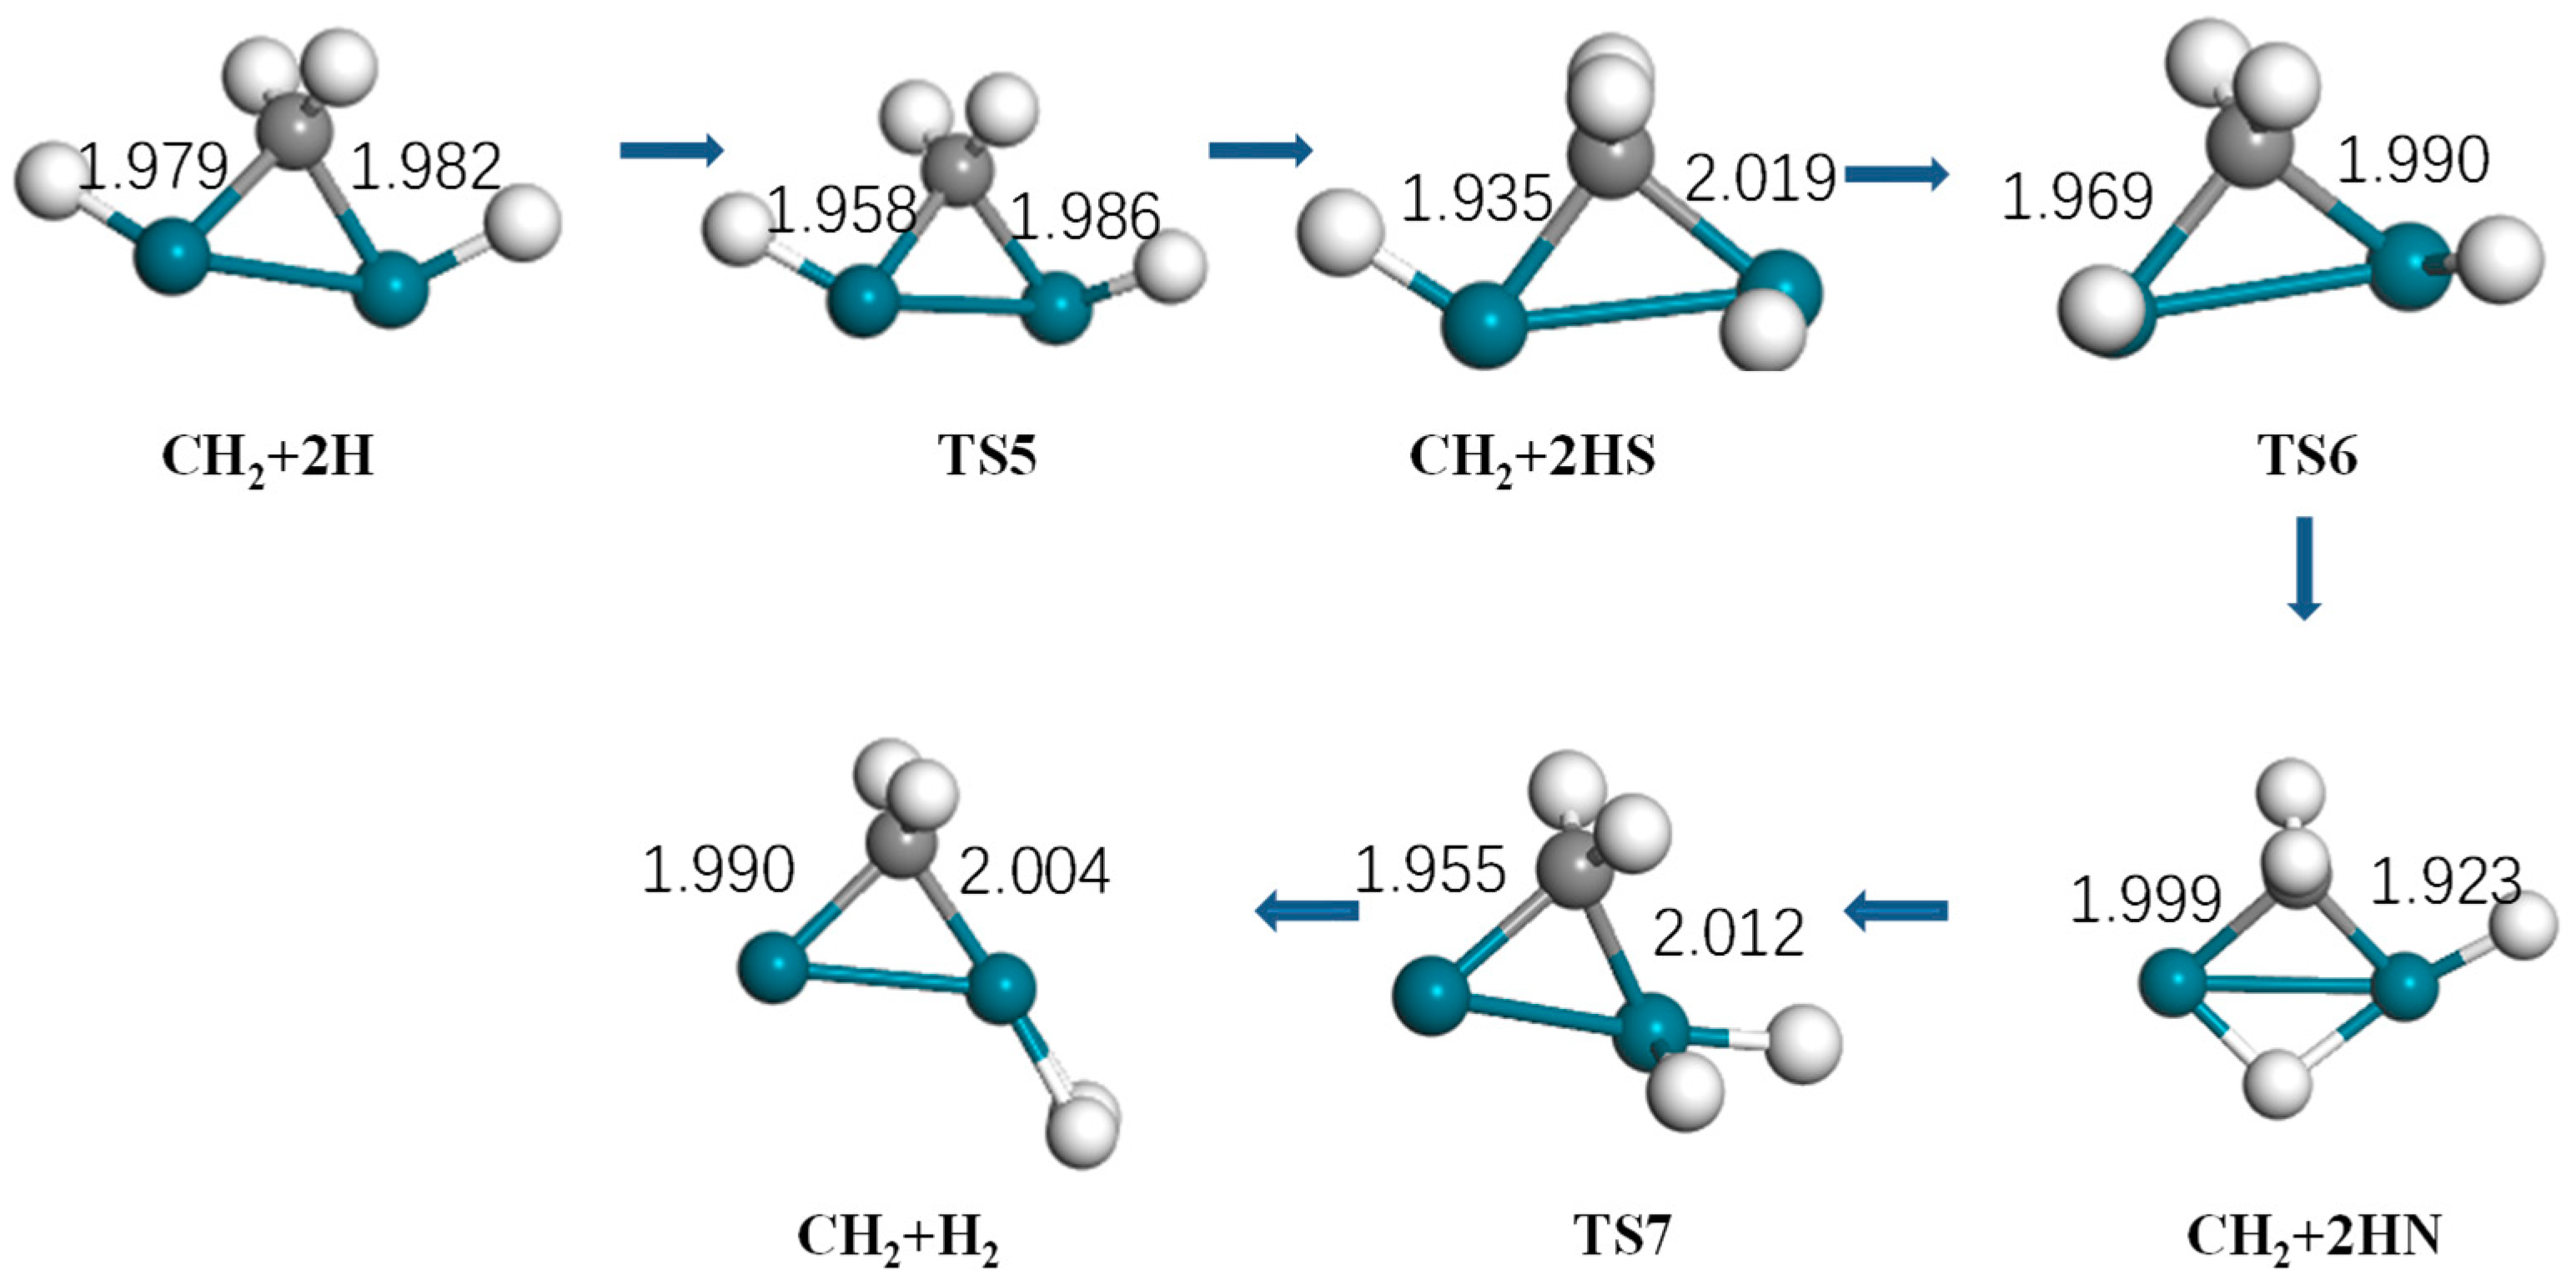
Figure 7.
Optimized structure of reactants, intermediates, products, and the transition state of hydrogen generation by Pd2 (turquoise: Pd, gray: C, white: H).
Figure 7.
Optimized structure of reactants, intermediates, products, and the transition state of hydrogen generation by Pd2 (turquoise: Pd, gray: C, white: H).
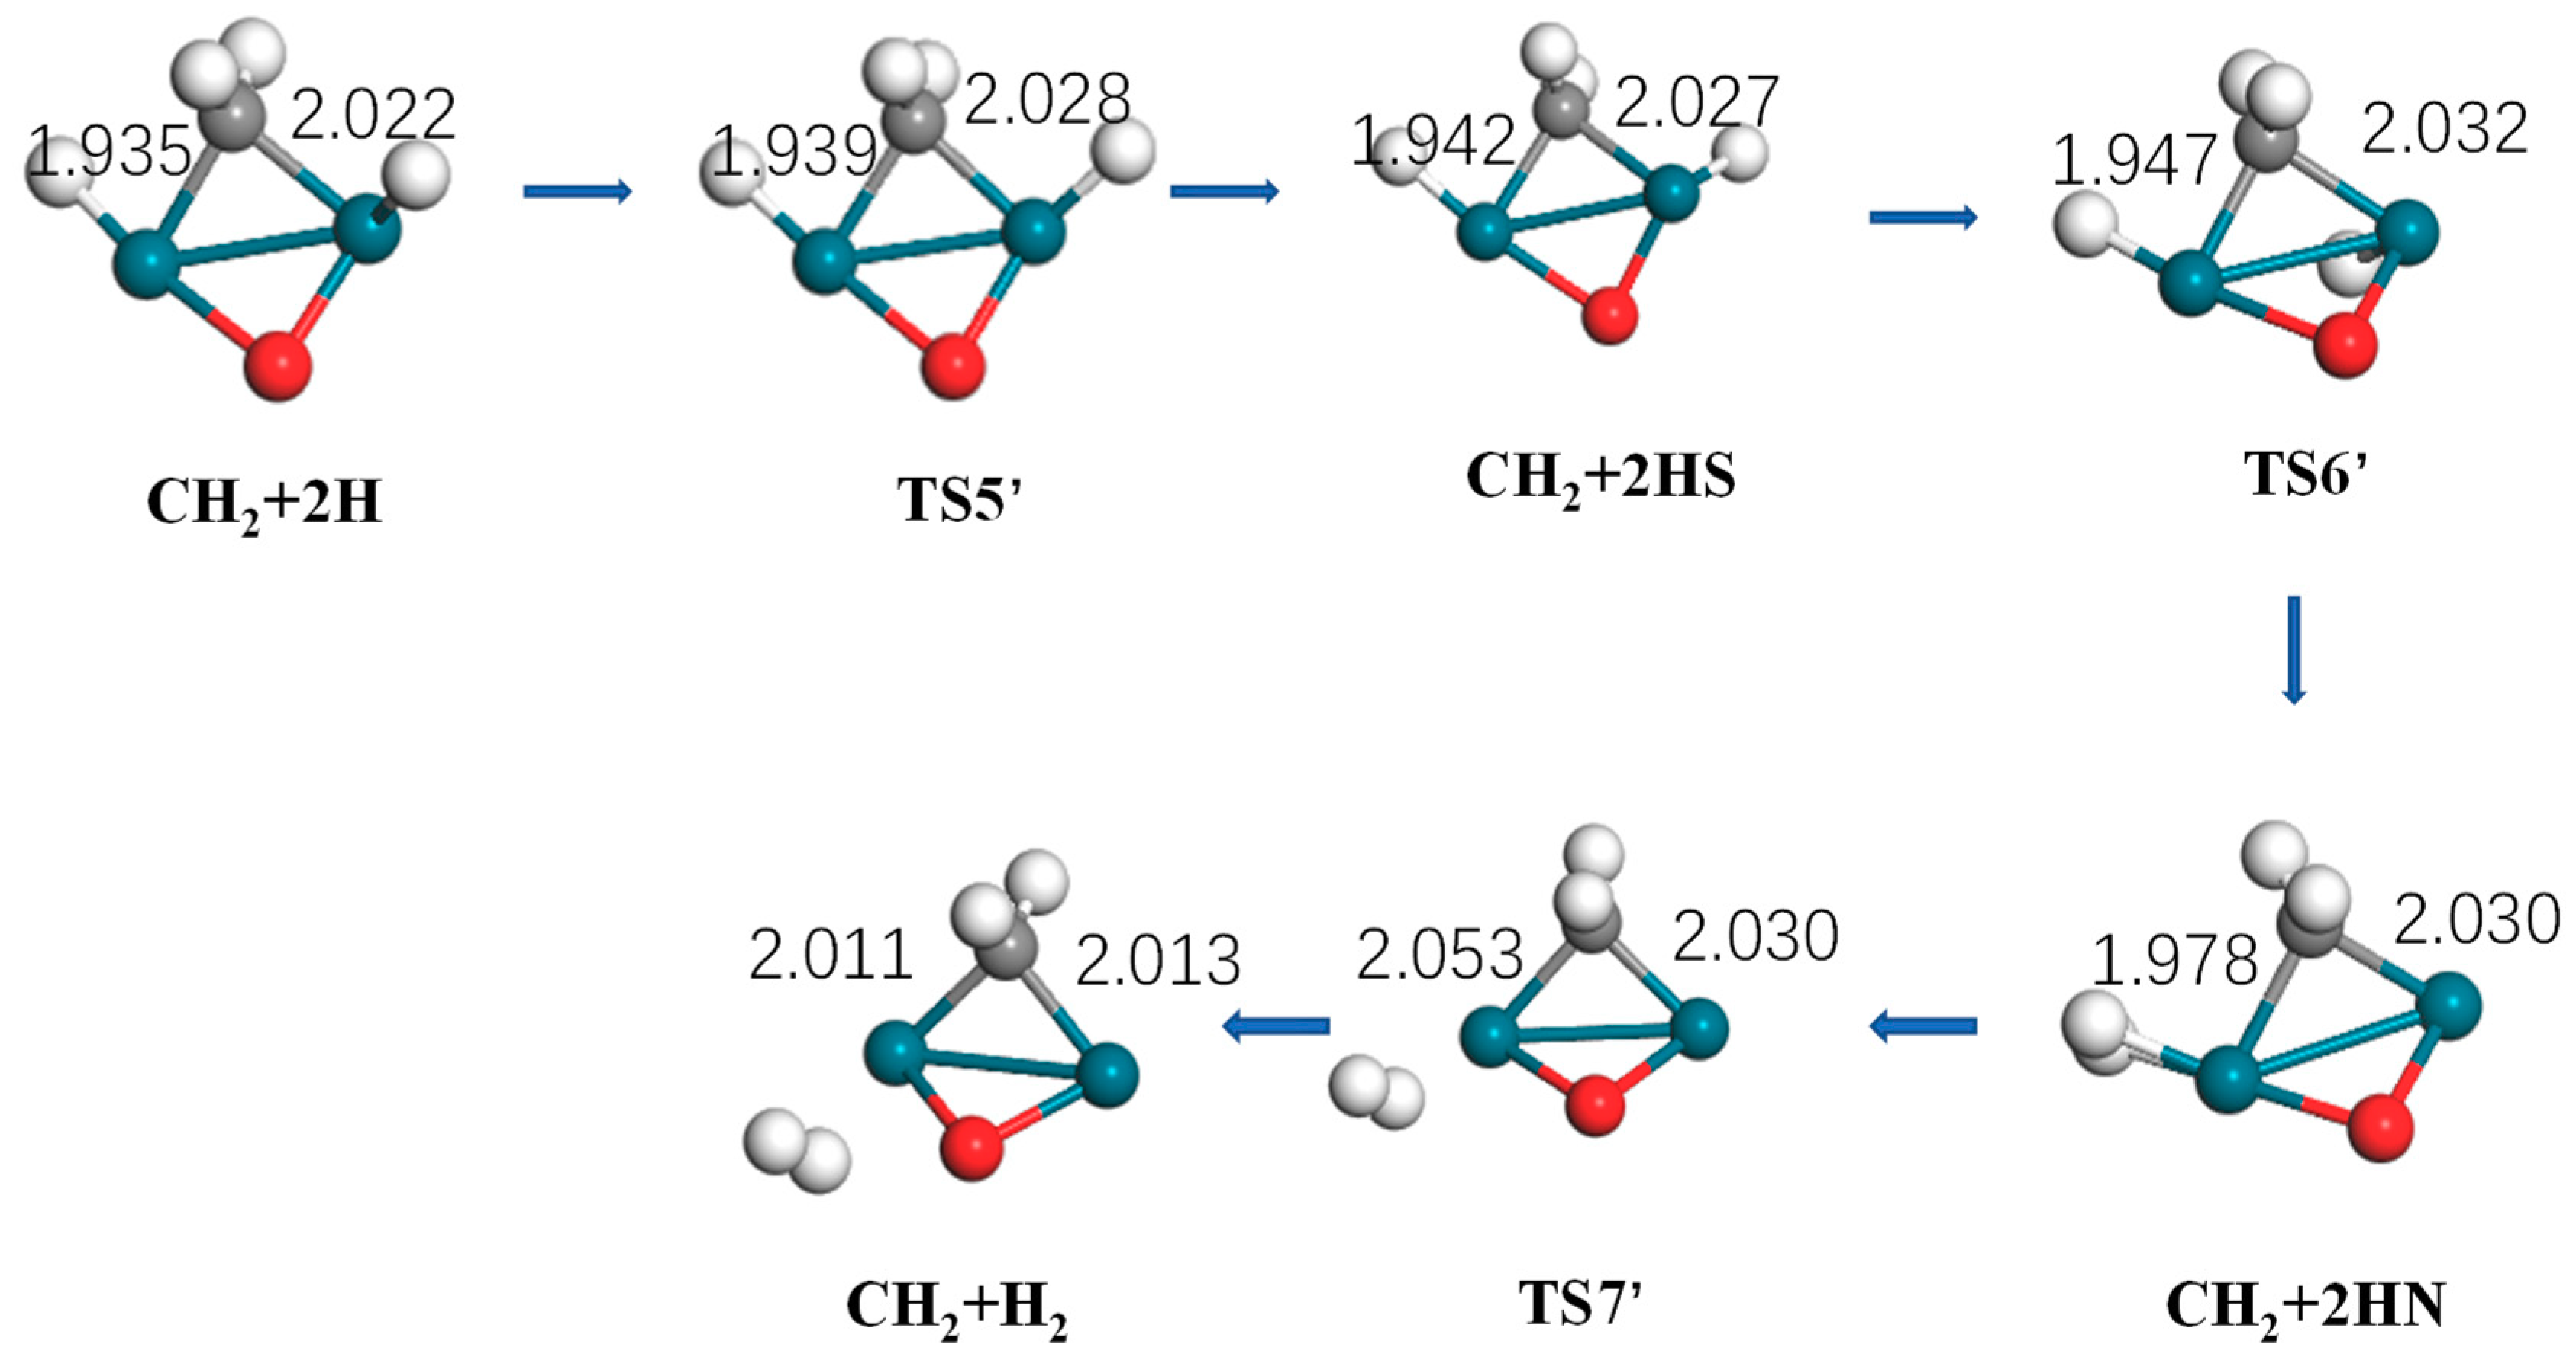
Figure 8.
Optimized structure of reactants, intermediates, products, and the transition state of hydrogen generation by Pd2O (turquoise: Pd, gray: C, white: H).
Figure 8.
Optimized structure of reactants, intermediates, products, and the transition state of hydrogen generation by Pd2O (turquoise: Pd, gray: C, white: H).
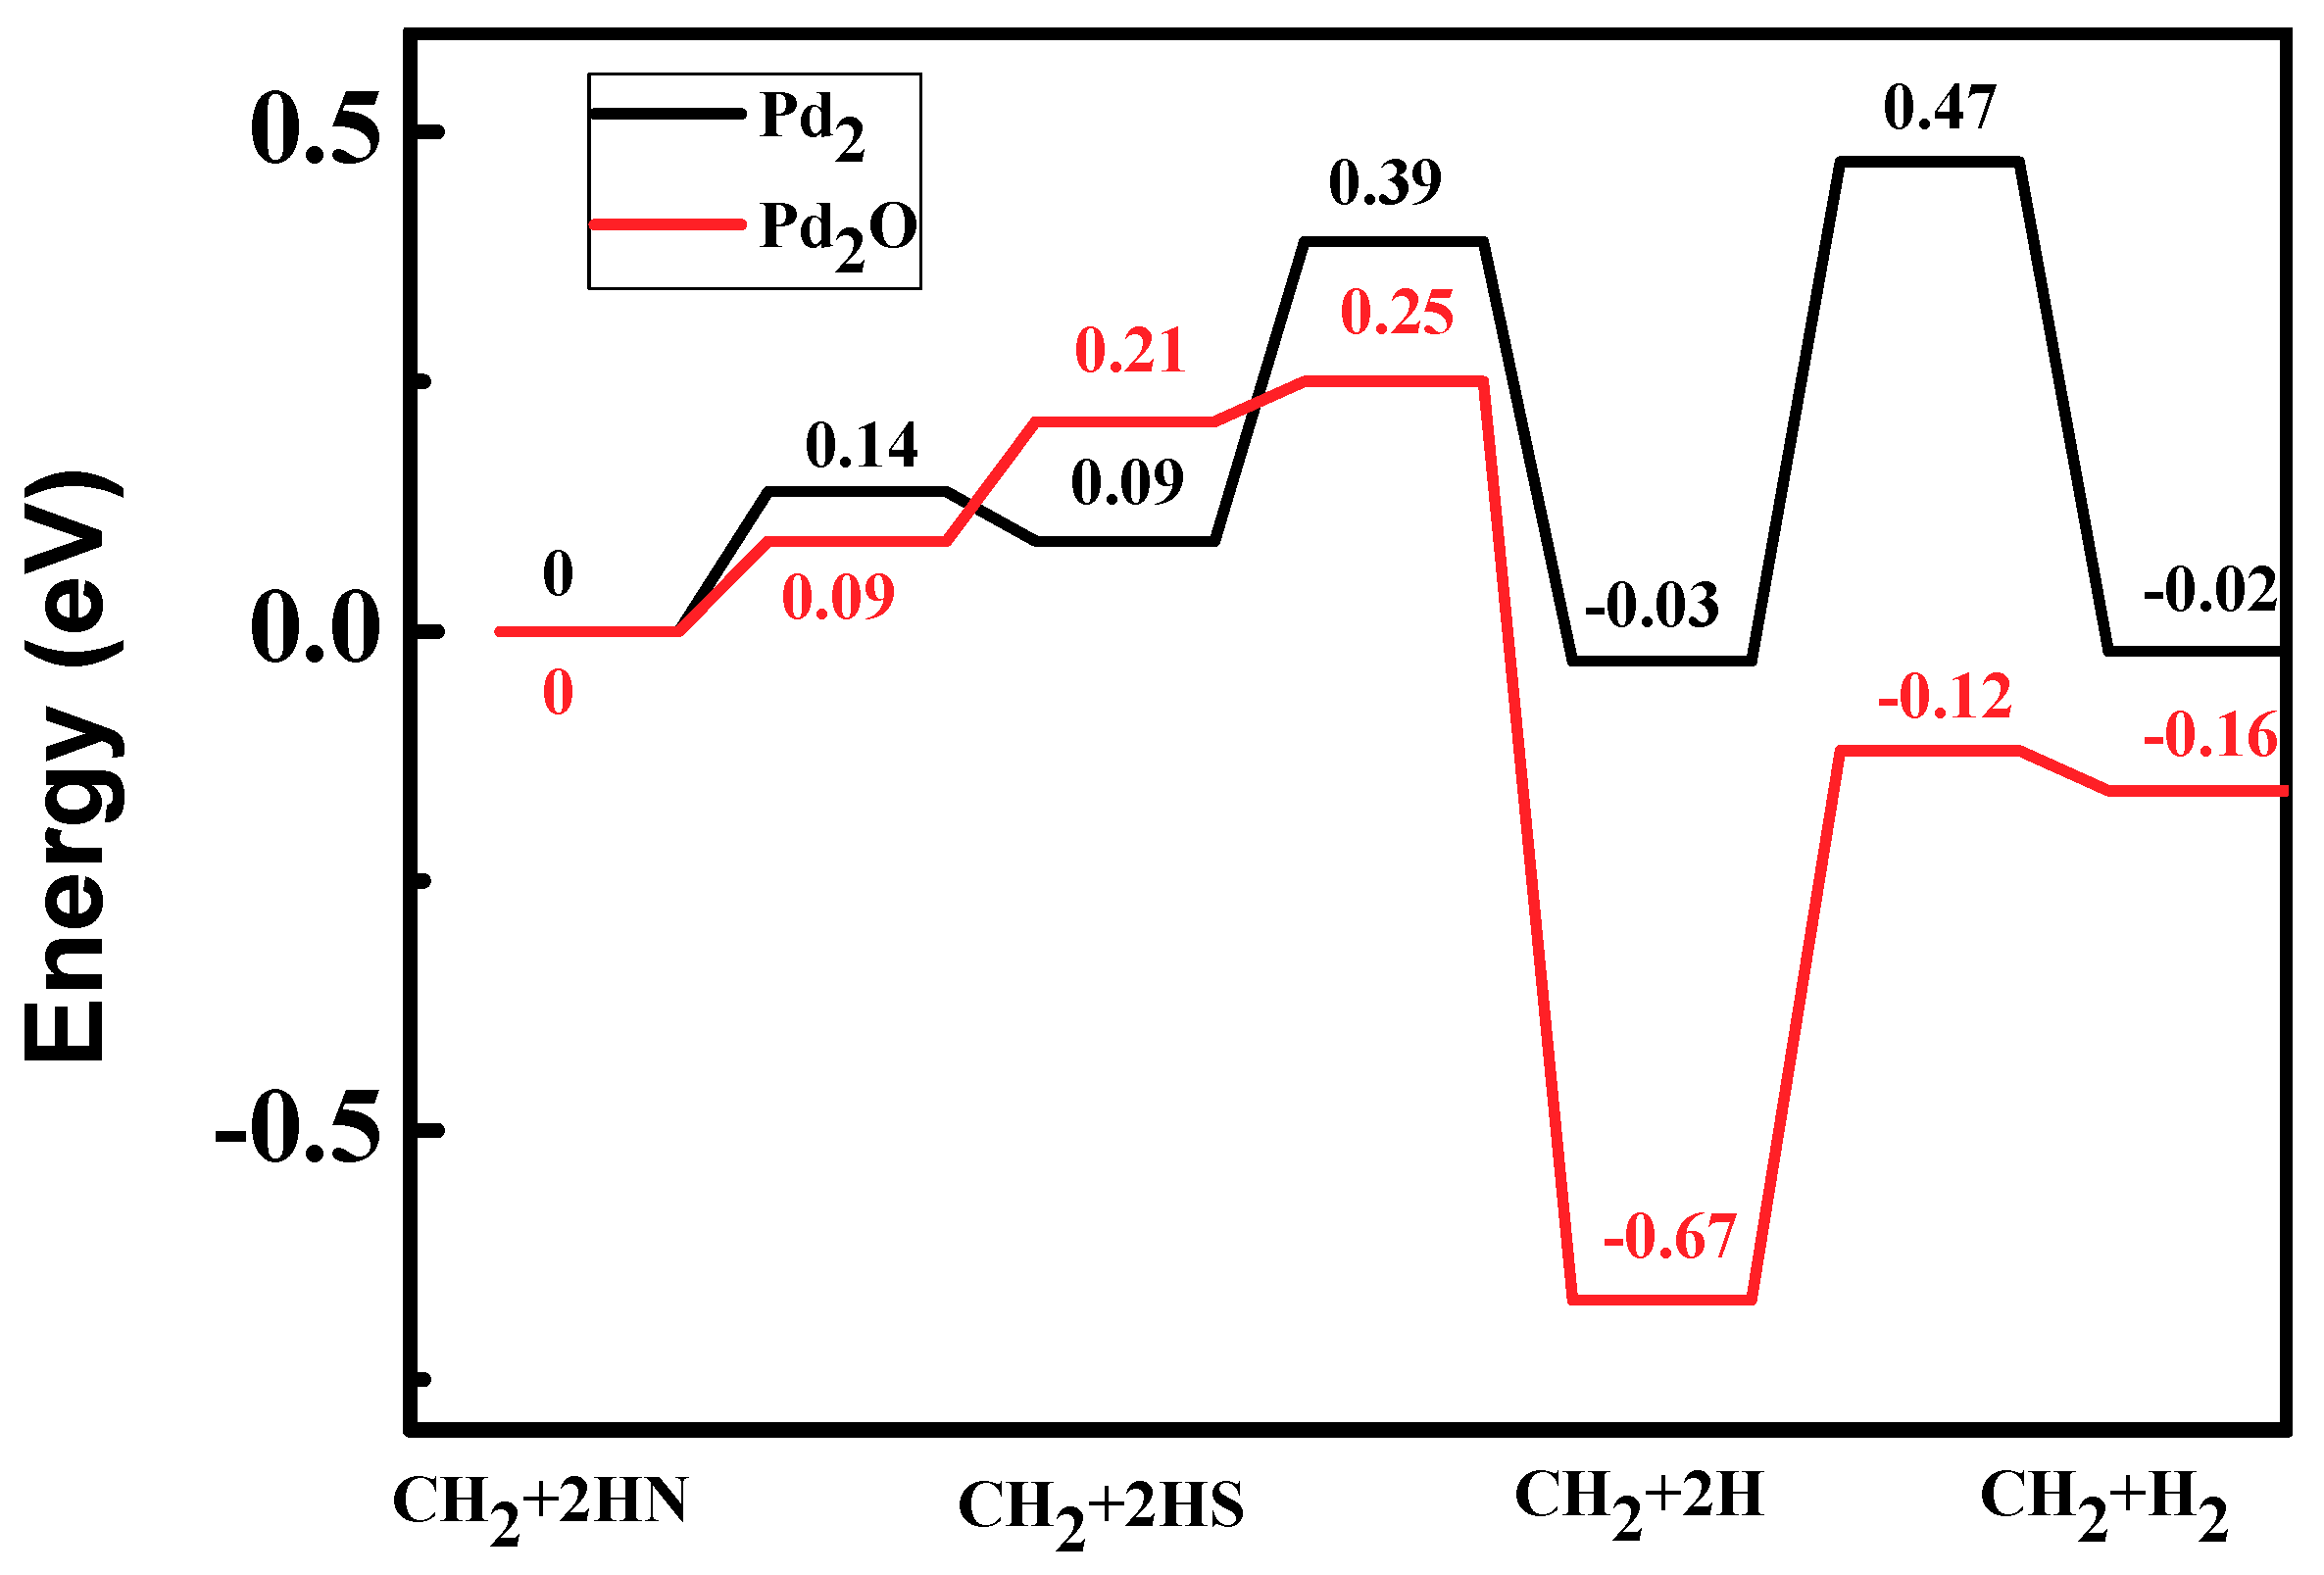
Figure 9.
Energy profiles of hydrogen generation: CH2 + 2H→CH2 + H2 on Pd2 and Pd2O.
Figure 9.
Energy profiles of hydrogen generation: CH2 + 2H→CH2 + H2 on Pd2 and Pd2O.
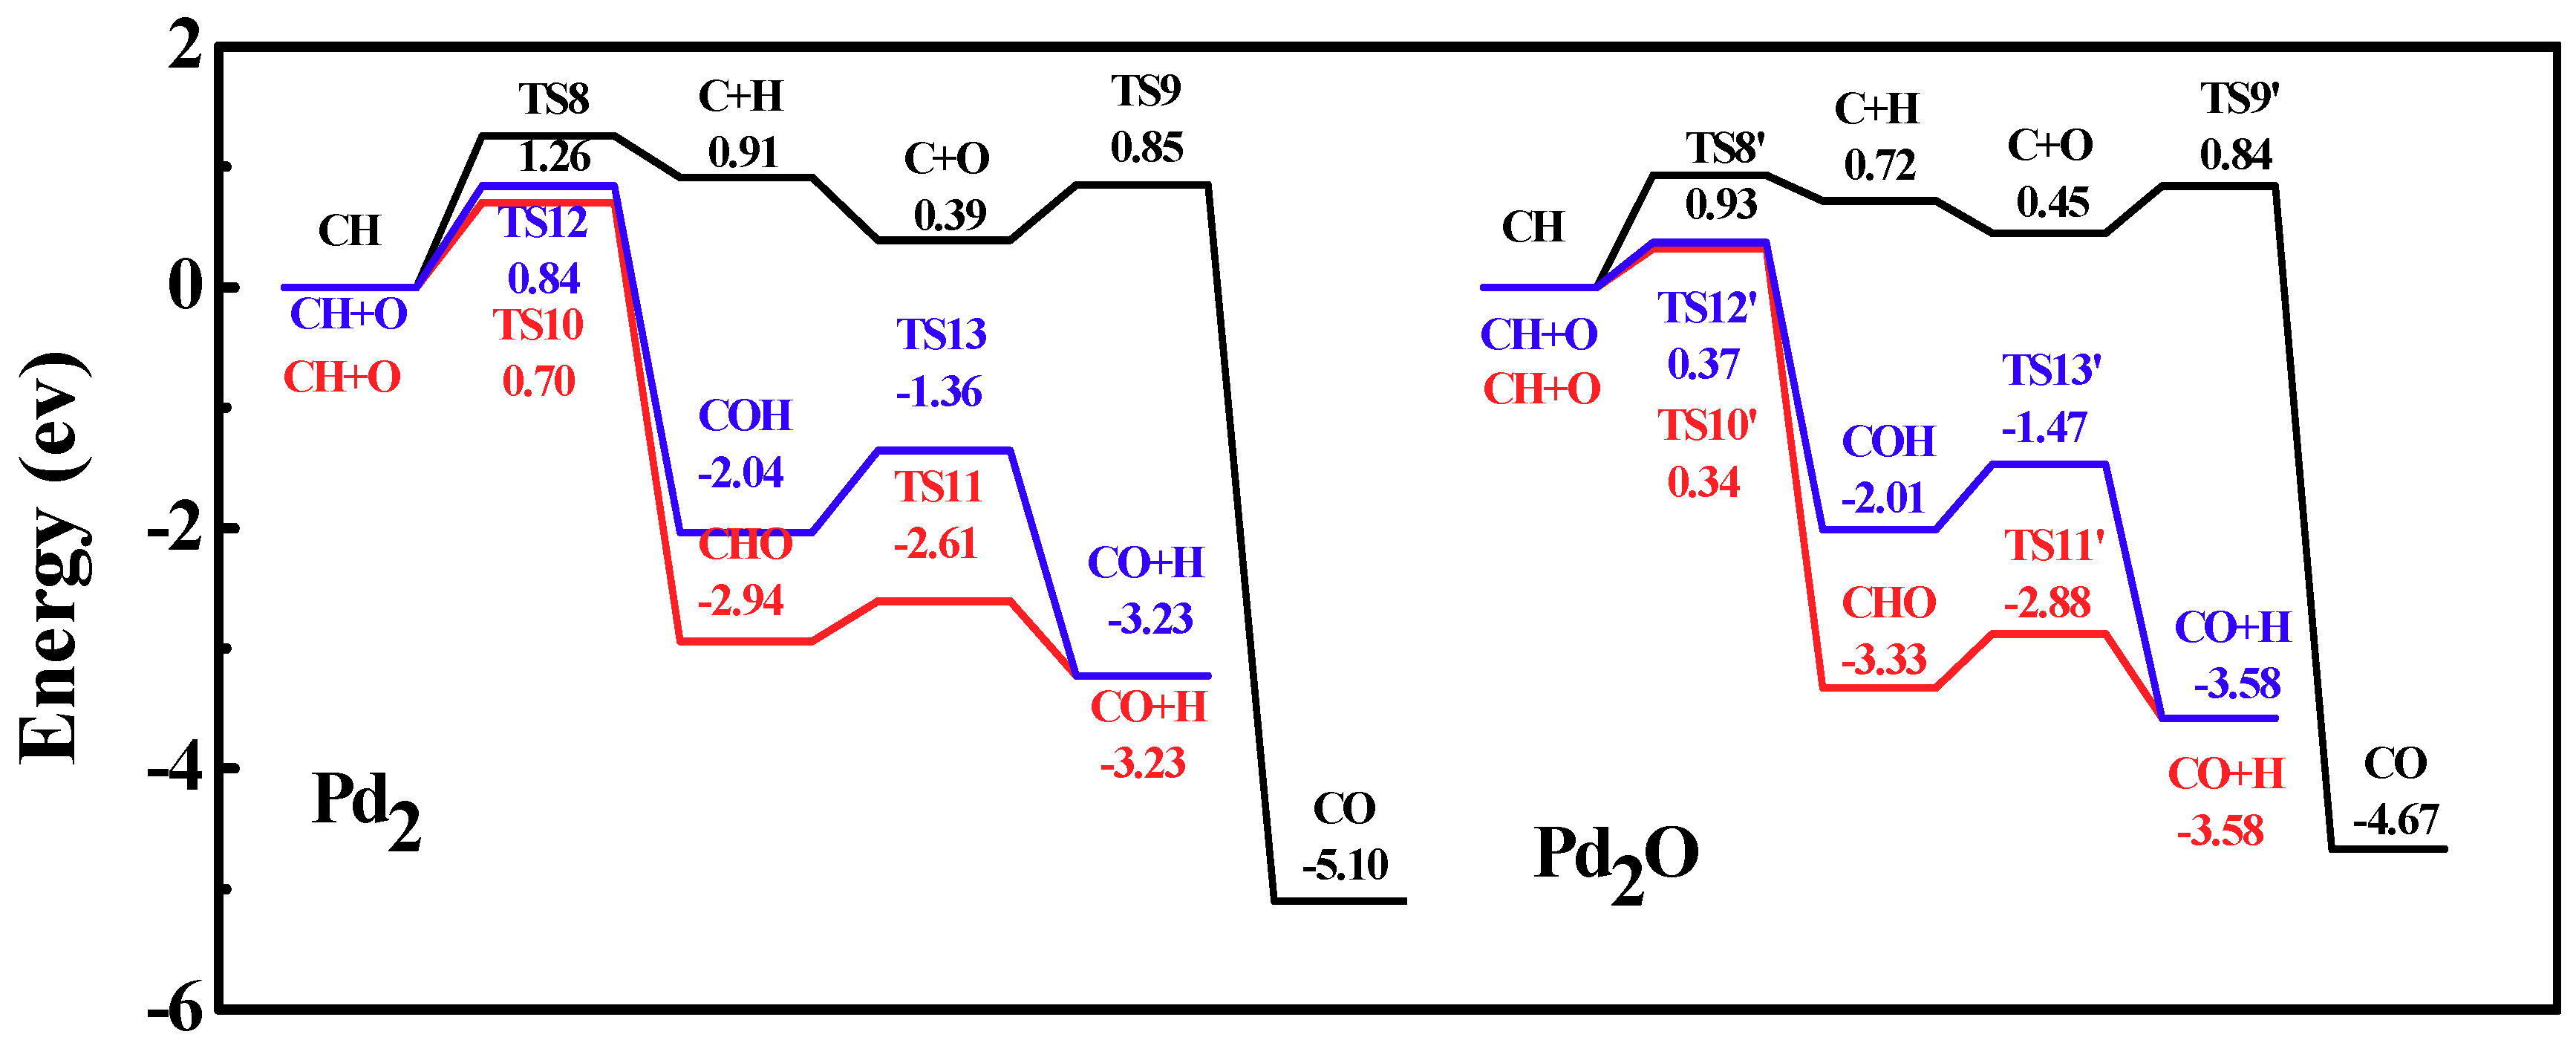
Figure 10.
Energy profiles of carbon monoxide formation on Pd2 and Pd2O. Left curve, three reaction paths on Pd2; right curve, three reaction paths on Pd2O.
Figure 10.
Energy profiles of carbon monoxide formation on Pd2 and Pd2O. Left curve, three reaction paths on Pd2; right curve, three reaction paths on Pd2O.
Table 1.
Binding energies of CHx (x = 0–4) adsorbates on dimer Pd2 and trimer Pd2O.
Table 1.
Binding energies of CHx (x = 0–4) adsorbates on dimer Pd2 and trimer Pd2O.
| System | Coordination Energy Pd2 (eV) Pd2O (eV) |
|---|
| CH4–Pd2(o) | −0.32 | −0.87 |
| CH3–Pd2(o) | −2.63 | −2.42 |
| CH2–Pd2(o) | −4.90 | −4.08 |
| CH–Pd2(o) | −5.70 | −4.66 |
| C–Pd2(o) | −6.01 | −5.30 |
Table 2.
The activation energy (Ea), difference enthalpy between the transition state and the initial state (ΔH≠), difference entropies between the transition state and the initial state (ΔS≠), pre-exponential factor (A), rate constant (κ) for methane activation on Pd2.
Table 2.
The activation energy (Ea), difference enthalpy between the transition state and the initial state (ΔH≠), difference entropies between the transition state and the initial state (ΔS≠), pre-exponential factor (A), rate constant (κ) for methane activation on Pd2.
| Pd2 | Ea (eV) | ΔH≠ (eV) | ΔS≠ (eV) | A (S−1) | κ (S−1) |
|---|
| CH4→CH3 + H | 1.17 | 1.1 | −0.21 | 1.62 × 10¹² | 4.36 × 10⁵ |
| CH3 + H→CH2 + 2H | 1.97 | 1.9 | −0.18 | 2.10 × 10¹² | 9.84 × 100 |
| CH2 + 2H→CH + 3H | 4.18 | 4.1 | −0.17 | 7.44 × 10¹² | 7.27 × 10⁻¹³ |
| CH + 3H→C + 4H | 3.01 | 2.93 | −0.15 | 7.04 × 10¹³ | 9.30 × 10⁻⁶ |
Table 3.
The activation energy (Ea), difference enthalpy between the transition state and the initial state (ΔH≠), difference entropies between the transition state and the initial state (ΔS≠), pre-exponential factor (A), rate constant (κ) for methane activation on Pd2O.
Table 3.
The activation energy (Ea), difference enthalpy between the transition state and the initial state (ΔH≠), difference entropies between the transition state and the initial state (ΔS≠), pre-exponential factor (A), rate constant (κ) for methane activation on Pd2O.
| Pd2O | Ea (eV) | ΔH≠ (eV) | ΔS≠ (eV) | A (S–1) | κ (S−1) |
|---|
| CH4→CH3 + H | 1.92 | 1.85 | −0.32 | 4.07 × 10¹¹ | 3.75 × 100 |
| CH3 + H→CH2 + 2H | 1.94 | 1.87 | −0.42 | 1.11 × 10¹¹ | 7.75 × 10⁻¹ |
| CH2 + 2H→CH + 3H | 3.47 | 3.4 | −0.07 | 2.31 × 10¹² | 4.03 × 10⁻⁸ |
| CH + 3H→C + 4H | 3.13 | 3.06 | 0.11 | 3.04 × 10¹² | 3.74 × 10⁻⁵ |
Table 4.
The activation energy (Ea), difference enthalpy between the transition state and the initial state (ΔH≠), difference entropies between the transition state and the initial state (ΔS≠), pre-exponential factor (A), rate constant (κ) for methane activation on Pd2.
Table 4.
The activation energy (Ea), difference enthalpy between the transition state and the initial state (ΔH≠), difference entropies between the transition state and the initial state (ΔS≠), pre-exponential factor (A), rate constant (κ) for methane activation on Pd2.
| Pd2 | Ea (eV) | ΔH≠ (eV) | ΔS≠ (eV) | A (S–1) | κ (S−1) |
|---|
| CH2 + 2H→CH2 + 2HS | 0.03 | −0.04 | −0.21 | 1.43 × 10¹² | 2.44 × 10¹² |
| CH2 + 2HS→CH2 + 2HN | 0.68 | 0.61 | −0.06 | 9.11 × 10¹² | 2.20 × 10⁹ |
| CH2 + 2HN→CH2 +H2 | 1.11 | 1.04 | −0.07 | 8.16 × 10¹² | 5.27 × 10⁶ |
Table 5.
The activation energy (Ea), difference enthalpy between the transition state and the initial state (ΔH≠), difference entropies between the transition state and the initial state (ΔS≠), pre-exponential factor (A), rate constant (κ) for methane activation on Pd2O.
Table 5.
The activation energy (Ea), difference enthalpy between the transition state and the initial state (ΔH≠), difference entropies between the transition state and the initial state (ΔS≠), pre-exponential factor (A), rate constant (κ) for methane activation on Pd2O.
| Pd2O | Ea (eV) | ΔH≠ (eV) | ΔS≠ (eV) | A (S–1) | κ (S–1) |
|---|
| CH2 + 2H→CH2 + 2HS | 0.23 | 0.15 | −0.06 | 9.38 × 10¹² | 1.13 × 10¹² |
| CH2 + 2HS→CH2 + 2HN | 0.48 | 0.09 | 0.09 | 5.21 × 10¹³ | 1.80 × 10¹¹ |
| CH2 + 2HN→CH2 +H2 | 1.08 | −0.08 | −0.08 | 6.57 × 10¹² | 5.77 × 10⁶ |
Table 6.
The activation energy (Ea), difference enthalpy between the transition state and the initial state (ΔH≠), difference entropies between the transition state and the initial state (ΔS≠), pre-exponential factor (A), rate constant (κ) for methane activation on Pd2.
Table 6.
The activation energy (Ea), difference enthalpy between the transition state and the initial state (ΔH≠), difference entropies between the transition state and the initial state (ΔS≠), pre-exponential factor (A), rate constant (κ) for methane activation on Pd2.
| Pd2 | Ea(V) | ΔH≠ (eV) | ΔS≠ (eV) | A (S−1) | κ (S−1) |
|---|
| CH→C + H | 2.75 | 2.68 | 0.01 | 1.97 × 10⁻³ | 1.95 × 10¹³ |
| C + O→CO | 1.5 | 1.42 | −0.19 | 5.82×10³ | 1.81 × 10¹² |
| CH + O→CHO | 1.6 | 1.53 | 0.03 | 1.87 × 10⁴ | 2.61 × 10¹³ |
| CHO→CO + H | 0.53 | 0.45 | −0.18 | 4.25 × 10⁴ | 2.15 × 10¹² |
| CH + O→COH | 1.64 | 1.56 | −0.11 | 2.19 × 10³ | 4.81 × 10¹² |
| COH→CO + H | 1.73 | 1.65 | 0.05 | 4.42 × 10³ | 3.31 × 10¹³ |
Table 7.
The activation energy (Ea), difference enthalpy between the transition state and the initial state (ΔH≠), difference entropies between the transition state and the initial state (ΔS≠), pre-exponential factor (A), rate constant (κ) for methane activation on Pd2O.
Table 7.
The activation energy (Ea), difference enthalpy between the transition state and the initial state (ΔH≠), difference entropies between the transition state and the initial state (ΔS≠), pre-exponential factor (A), rate constant (κ) for methane activation on Pd2O.
| Pd2O | Ea (eV) | ΔH≠ (eV) | ΔS≠ (eV) | A (S–1) | κ (S–1) |
|---|
| CH→C + H | 1.93 | 1.85 | −0.07 | 6.09 × 101 | 7.59 × 10¹² |
| C + O→CO | 1.23 | 1.16 | −0.31 | 4.69 × 10⁴ | 3.98 × 10¹¹ |
| CH + O→CHO | 0.58 | 0.51 | −0.11 | 4.28 × 10⁹ | 4.83 × 10¹² |
| CHO→CO + H | 1.19 | 1.12 | 0.03 | 5.84 × 10⁶ | 2.68 × 10¹³ |
| CH + O→COH | 0.62 | 0.54 | −0.15 | 1.75 × 10⁹ | 3.07 × 10¹² |
| COH→CO + H | 1.16 | 1.08 | −0.10 | 1.80 × 10⁶ | 5.32 × 10¹³ |


