Article

Enhanced Electrocatalytic Behaviour of Poy(aniline-co-2-hydroxyaniline) Coated Electrodes for Hydrogen Peroxide Electrooxidation

1
Institute of Chemical Sciences, University of Peshawar, Peshawar 25120, Pakistan
2
National Centre of Excellence in Physical Chemistry, University of Peshawar, Peshawar 25120, Pakistan
3
TU Braunschweig Institute of Energy and Process Systems Engineering, Franz-Liszt-Straße 35, 38106 Braunschweig, Germany
*
Author to whom correspondence should be addressed.
Catalysts 2019, 9(8), 631; https://doi.org/10.3390/catal9080631
Submission received: 25 June 2019 / Revised: 12 July 2019 / Accepted: 20 July 2019 / Published: 24 July 2019
(This article belongs to the Special Issue Women in Catalysis)

Abstract

:
Polymer-coated electrodes are widely used for the detection and oxidation of hydrogen peroxide (H2O2). Conducting polyaniline (PANI), poly (2-hydroxyanilne) (PHA), and their copolymer poly(aniline-co-2-hydroxyaniline) (PACHA) were electrochemically synthesized on a gold substrate for H2O2 detection and analysis. Cyclic voltammetry (CV), square wave voltammetry (SWV), and differential pulse voltammetry (DPV) techniques were used for electroanalysis. Both PACHA and PANI greatly reduced the gold overpotential for H2O2 oxidation with enhanced current densities. The PACHA- and PANI-coated electrodes showed oxidative peaks at 0.30 and 0.50 V, respectively, in the presence of 1.4 × 10⁻⁶ M H2O2, while PHA-coated electrodes exhibited no response. The fabricated electrodes displayed a linear response towards H2O2 in range of 2 × 10⁻⁷ to 1.4 × 10⁻⁶ M, with very low detection limits (LODs) of 1 × 10⁻⁷ M (for PACHA) and 1.15 × 10⁻⁷ M (for PANI) evaluated from CV data. In case of SWV and DPV, the LODs were found to be 1.78 × 10⁻⁷ M (for PACHA) and 1 × 10⁻⁷ M (for PANI), respectively. The materials exhibit high sensitivity of 650 A/Mcm2 and show good stability. The PACHA-coated electrode shows better capacitance (1.84 × 10⁻³ F) than PHA- (2.52 × 10⁻⁴ F) and PANI-coated (1.17 × 10⁻³ F) electrodes.

1. Introduction

Hydrogen peroxide (H2O2) has been of great value in biological systems and commercial applications, i.e., for bleaching, sterilizing, oxidizing, and for natural organic matter removal from water [1]. Though H2O2 is of great help, its excessive production and use can be hazardous, as it causes environmental pollution [2]. H2O2 produced in mitochondria by oxidases, and is the main cause of various disorders like myocardial infarction, neurodegeneration, and Alzheimer’s disease [3,4]. A high level of H2O2 is also toxic to cells, because it can disrupt its morphology and function [5,6]. Thus, detection and determination of H2O2 plays a vital role in many disciplines, like biochemistry, clinical, environmental chemistry, and pharmaceutical analysis.
In the recent few decades, many techniques, such as chromatography, fluorometry, spectrophotometry, and titrimetry, have been applied for the detection of H2O2. However, electrochemical techniques have gained more attention because of their high sensitivity, low cost, robust response, and easy operation. Many trials have shown that the reduction and oxidation of H2O2 occurring at solid electrodes displays the large overpotential and slow electrode dynamics, which has an adverse effect on detection performance, and also results in noisiness from other electroactive species in the practical determination of H2O2. Consequently, enzyme-involved biosensors have been used for the analysis of H2O2. Although the enzyme-modified electrodes show low detection limits, they have certain drawbacks like poor stability, a high cost of enzymes, and immobilization complexity. Fortunately, the emergence of coating electrodes with polymers opens a new doorway for H2O2 sensing, due to their greater stability and other properties, such as reducing overpotential, preventing electrode/electrode fouling, and interfering when the reagent solution is at a high concentration [7,8]. Polymers latch onto electrode surfaces, either by fixing the membranes (desired polymer membrane) that are available commercially or by electro-polymerization [9]. The latter method can be more useful than other methods because of its simplicity and the reproducibility of the construction process in a single step.
An electrode of the desired properties can be made by choosing an appropriate monomer and adequate experimental conditions. Thus, the thickness of the polymer membrane and other physical properties can be regulated by varying experimental conditions during the process of electro-polymerization. Electrodes modified with conducting polymers and nitrogen-doped graphene have been used for the oxidation of H2O2 [10], catechol [11], and ascorbic acid [12].
Conducting polymers are widely used for electrode surface coating, in order to enhance the bare electrode sensing properties. They have a large scope of applications in the realm of fuel cells [13], super capacitors [14], sensors [15], and electrocatalysis [16]. The most-used polymers are polyaniline (PANI), polypyrrole, polythiophene, and their derivatives. Due to its susceptibility and being easy to synthesize, PANI has attracted more attention. Some features of PANI can be upgraded via doping [17], interfacial polymerization, copolymerization, and the formation of bi-layer structures [18]. In addition, 2-hydroxyaniline, a derivative of aniline, contains hydroxyl and amino groups in its structural unit, and can be polymerized. The hydroxyl and amino groups in poly (2-hydroxyaniline) (PHA) can be oxidized and reduced electrochemically, and have been utilized in the fabrication of sensors [19].
A copolymer of aniline and 2-hydroxyaniline, poly (aniline-co-2-hydroxyaniline) (PACHA), with improved electrochemical properties both in neutral and basic media compared to its respective homopolymers, has been reported by our and other groups in the last decade [20,21]. Previous studies have shown that the anodic current response of PACHA is 1.3 times greater than PHA [22]. Furthermore, the electrochemical impedance spectroscopy revealed that the capacitance and conductivity of PACHA-coated electrodes increase by increasing the upper potential. The PACHA-modified electrode exhibits superior performance to PANI in the methanol oxidation reaction in direct methanol fuel cells (DMFCs). It is considered a good auxiliary material for the catalytic layer in DMFCs [22]. The copolymer is also used for the sensing of arsenate, uricase, and ascorbic acid [23]. It has been tested for probing radical scavengers of catechin and pyrogallol [24,25]. The fibers of PACHA were effectively used for the electro-oxidation of catechol in Na2SO4 solution [26].
In this work, we have tried to apply PACHA-coated electrode for the detection of H2O2 at a very minute level, by taking advantage of the redox behaviour of PACHA and comparing its electrocatalytic and capacitance properties with its homopolymers, as well as with previously reported data. The PACHA coating greatly reduces gold overpotential for H2O2 oxidation, even 200 mV lower than a PANI coating, with enhanced anodic current density. The PACHA-modified electrode displayed a linear response towards H2O2 in the range of 2 × 10⁻⁷ to 1.4 × 10⁻⁶ M, with a very low detection limit (LOD) of 1 × 10⁻⁷ M, and exhibited high sensitivity and good stability.

2. Results and Discussion

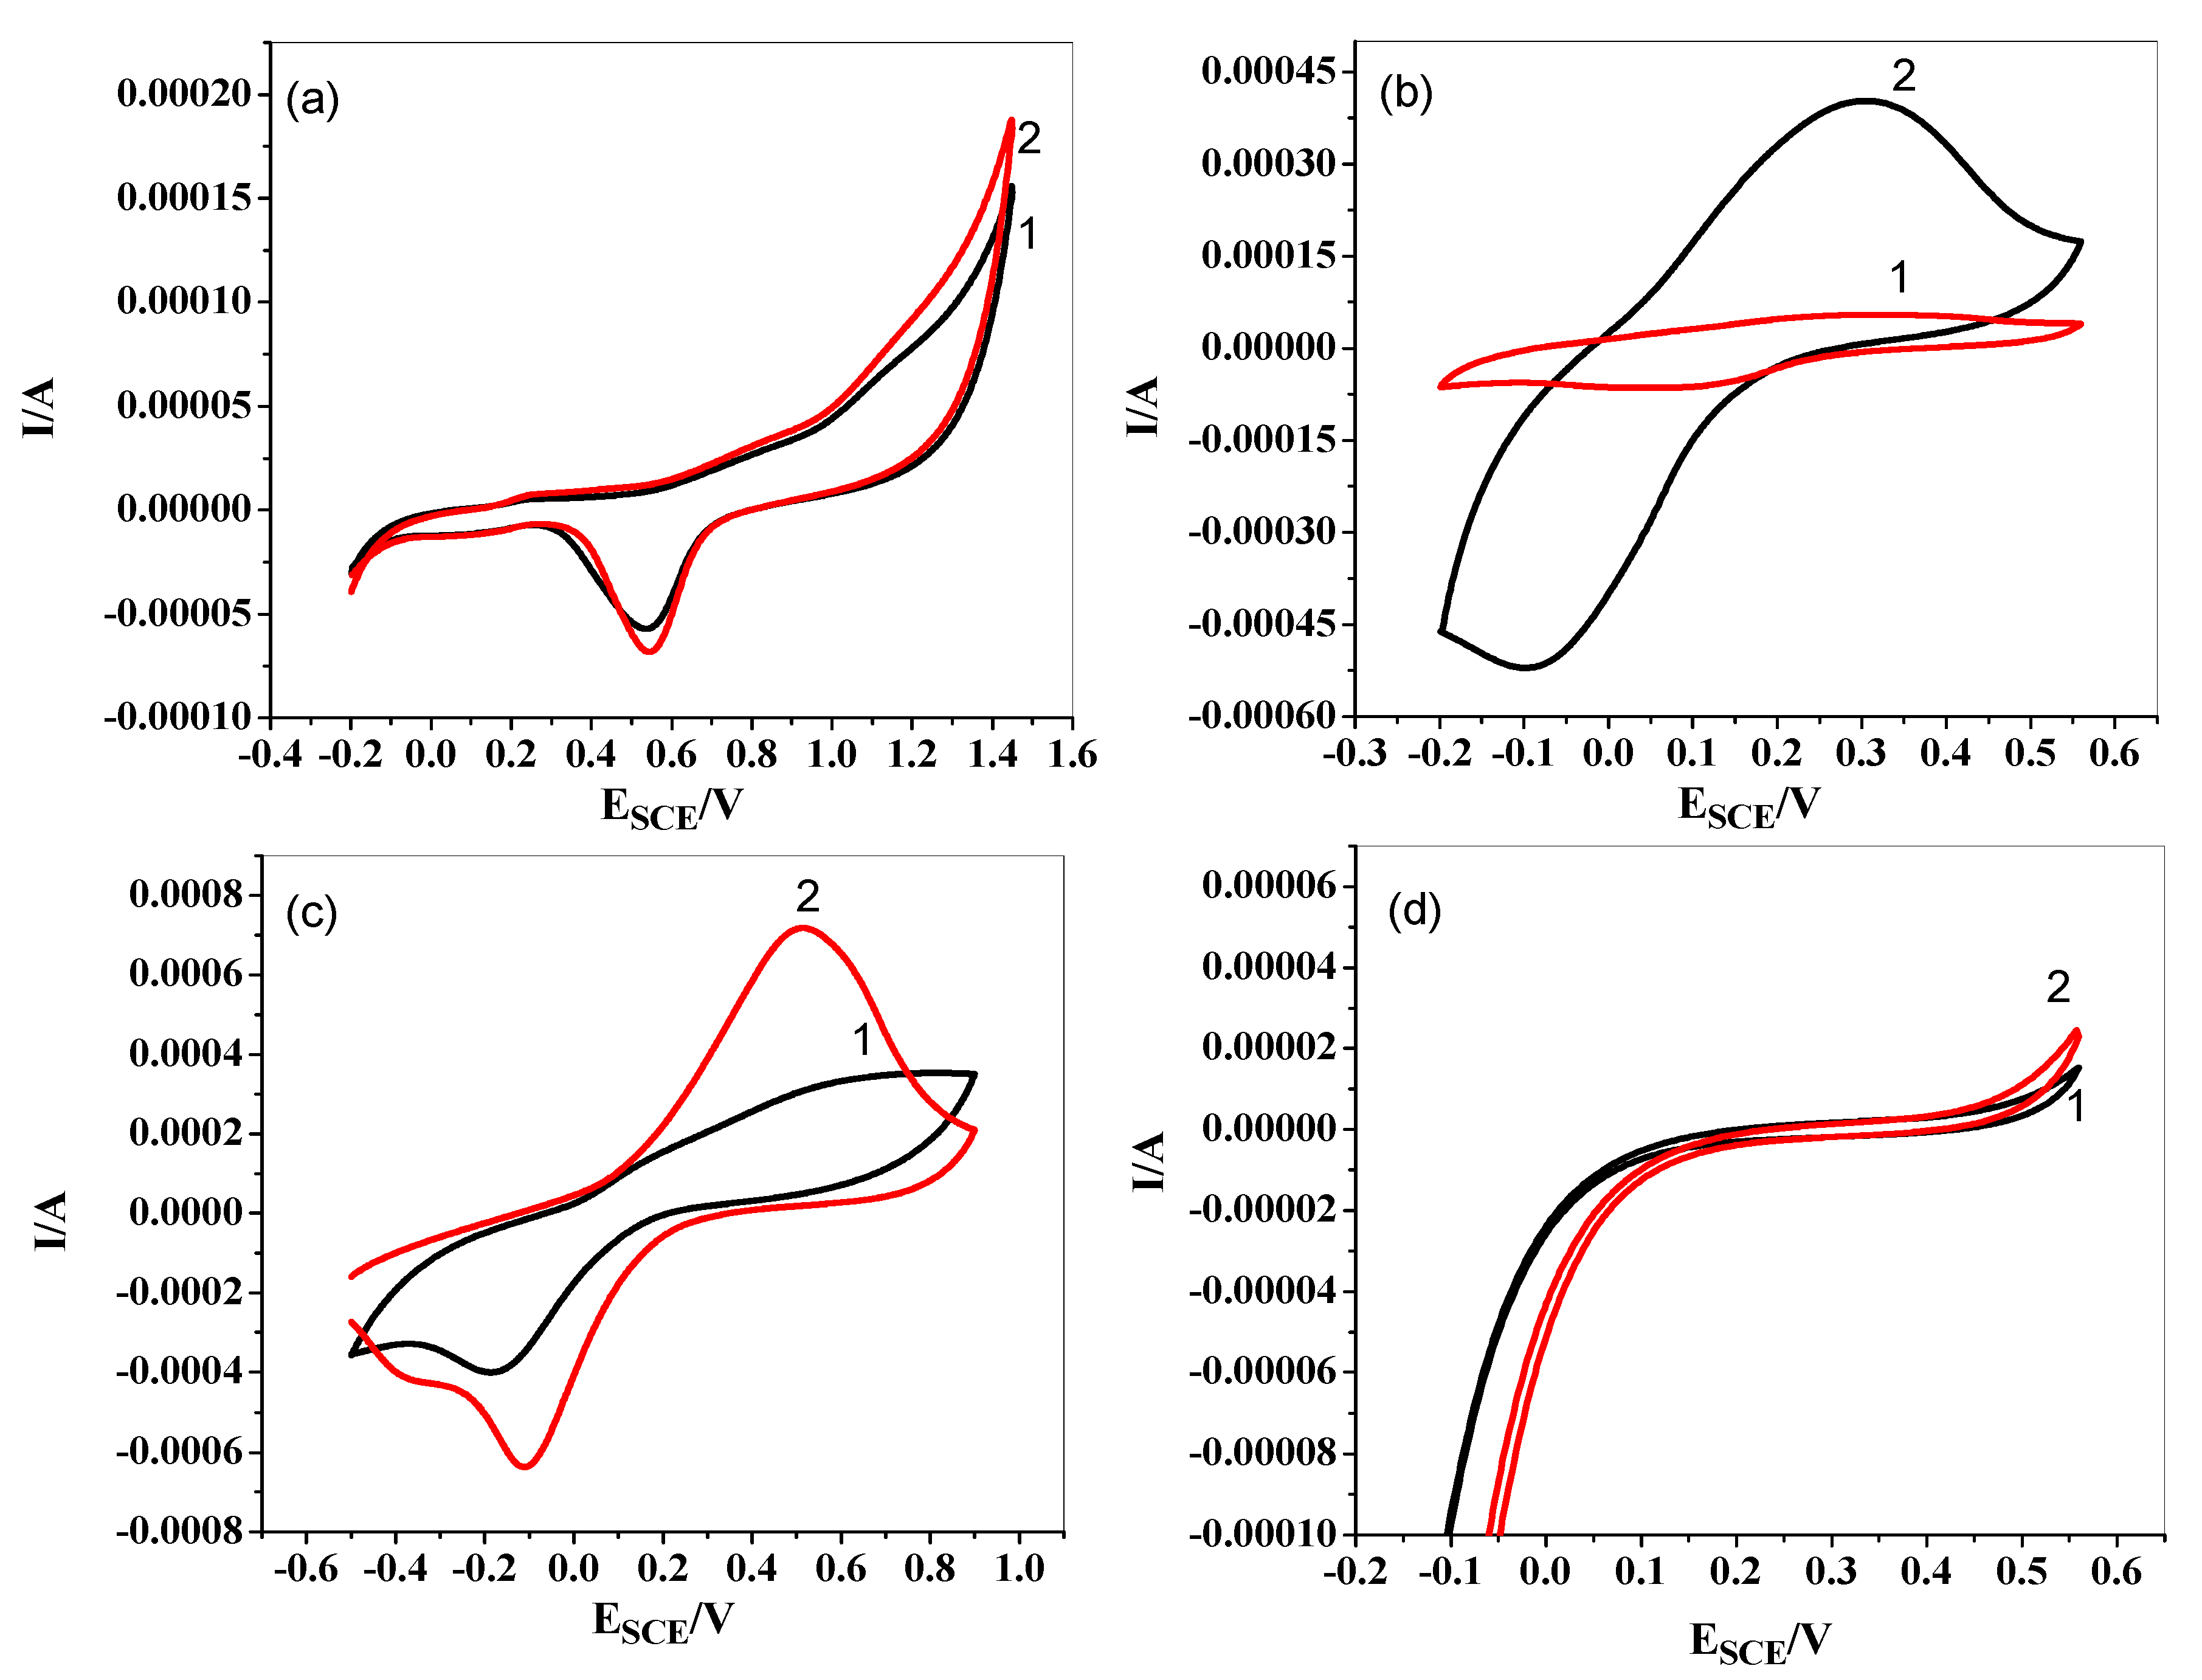
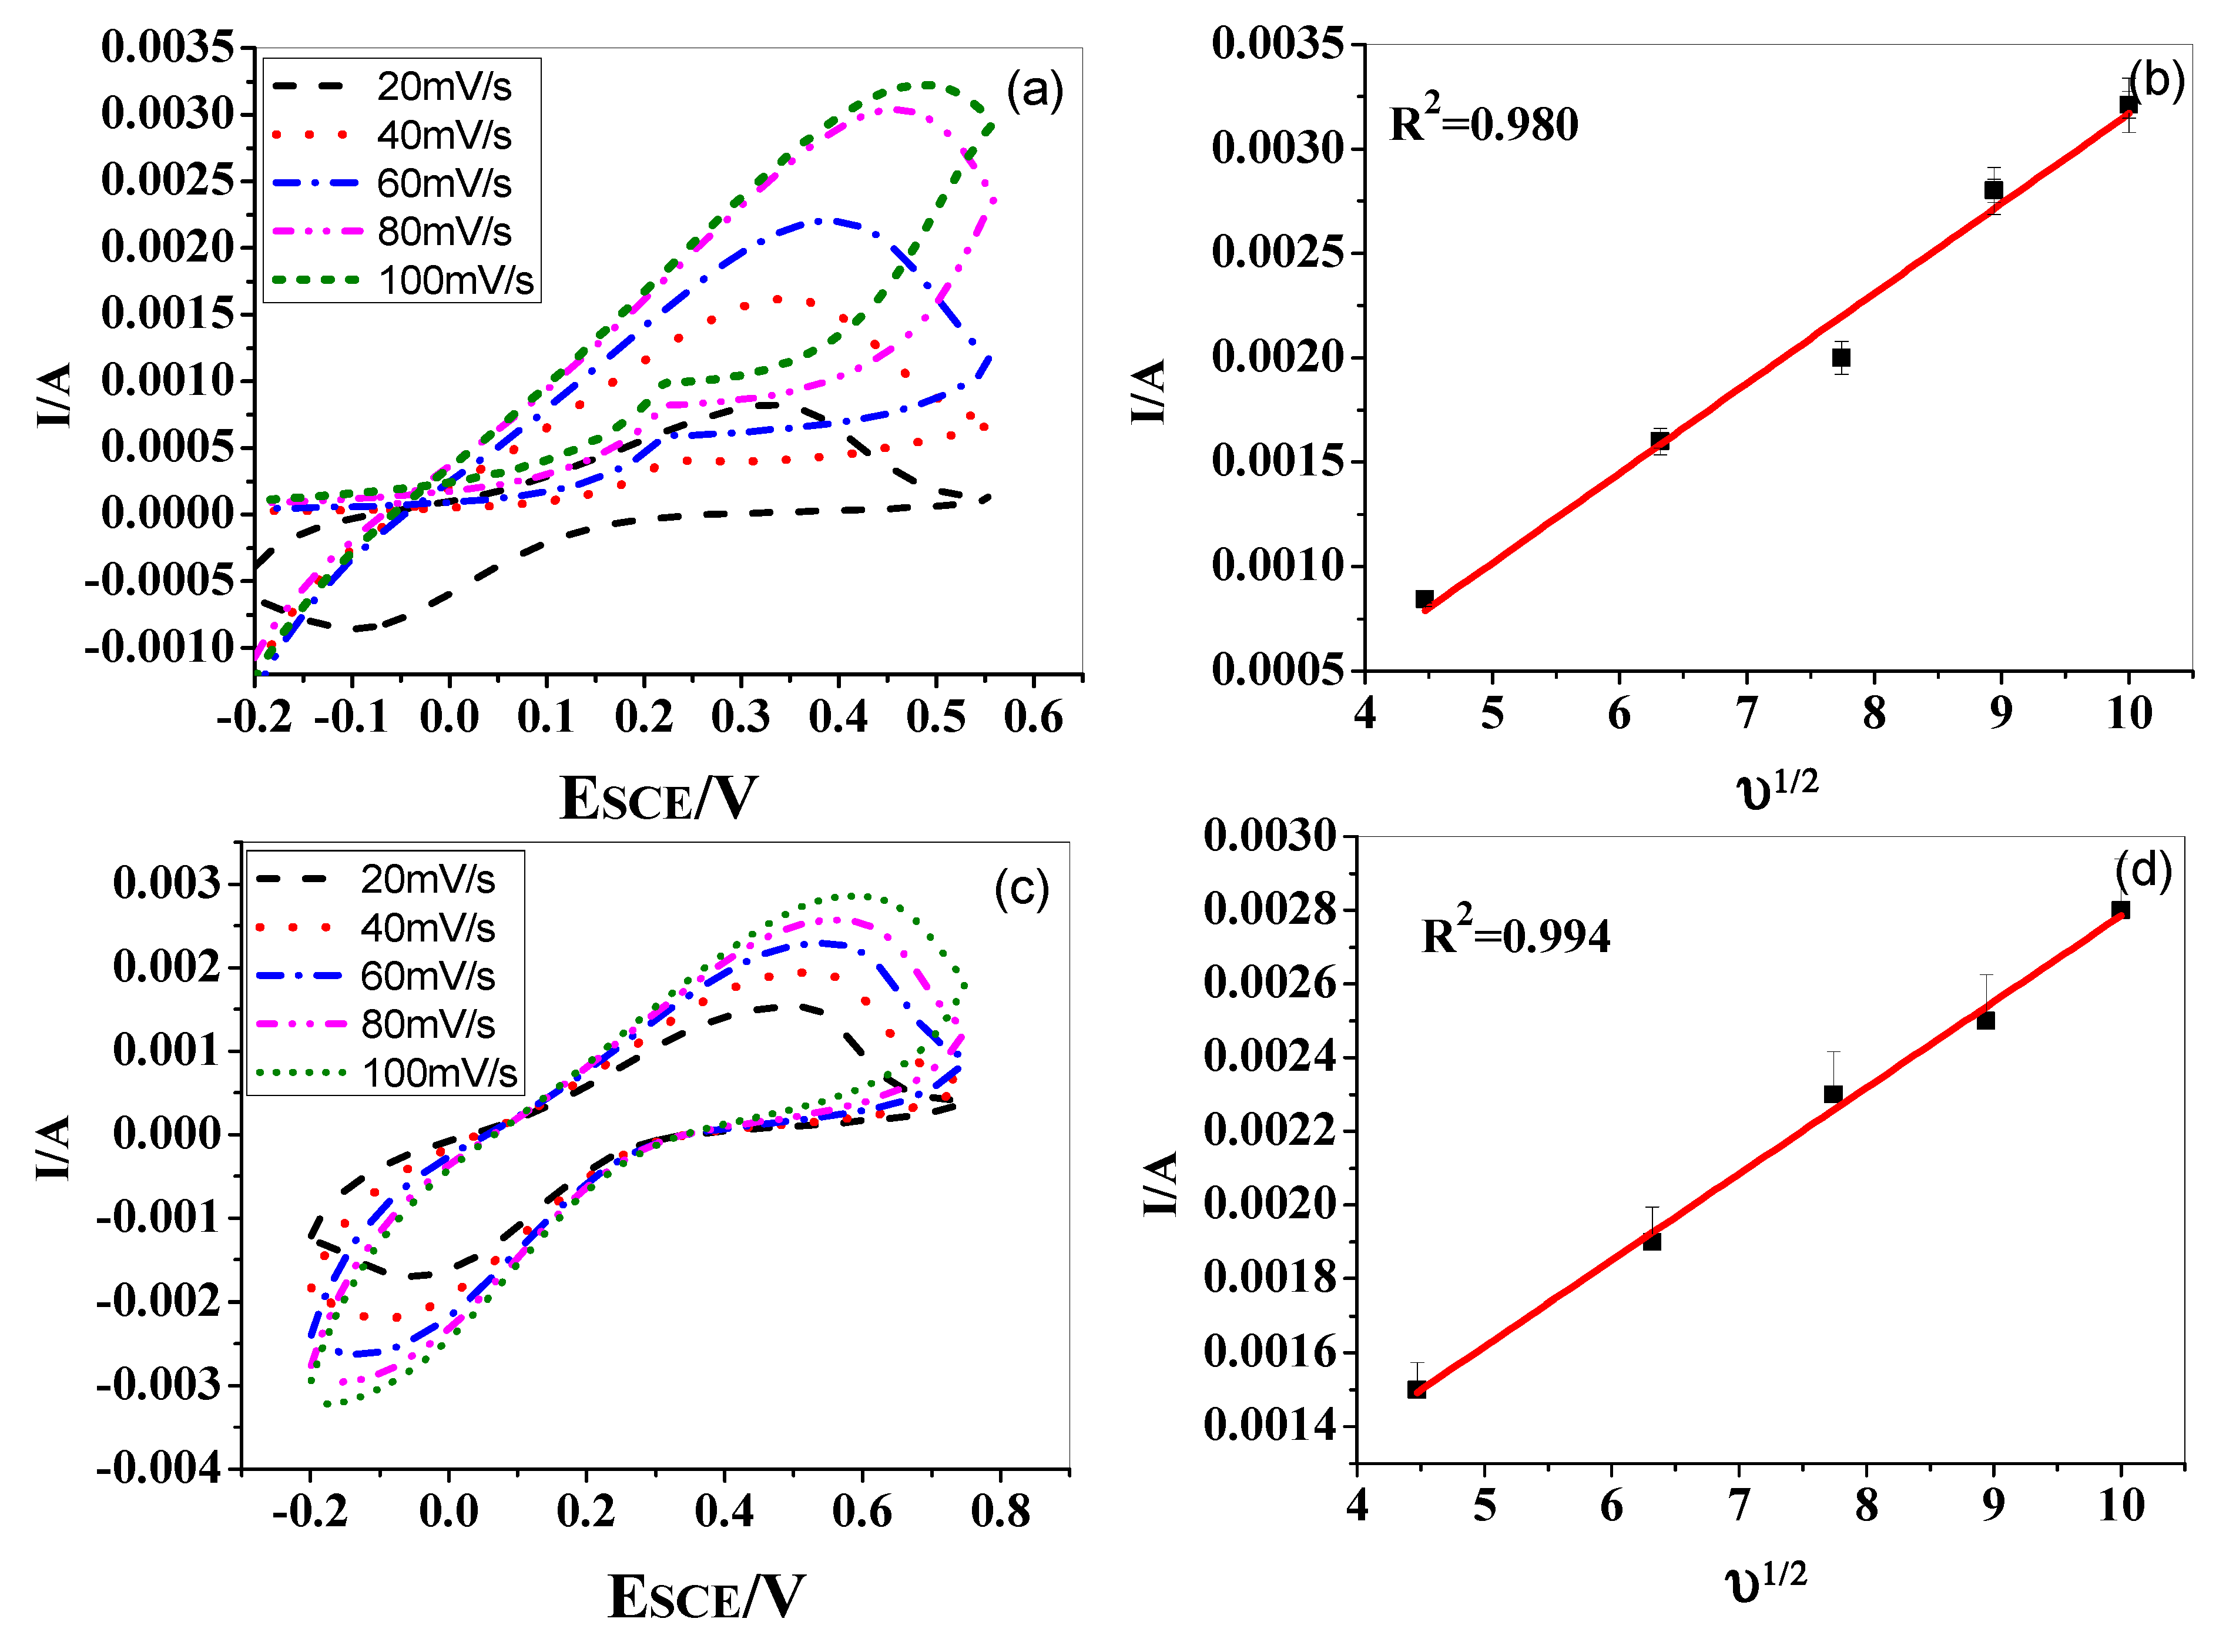
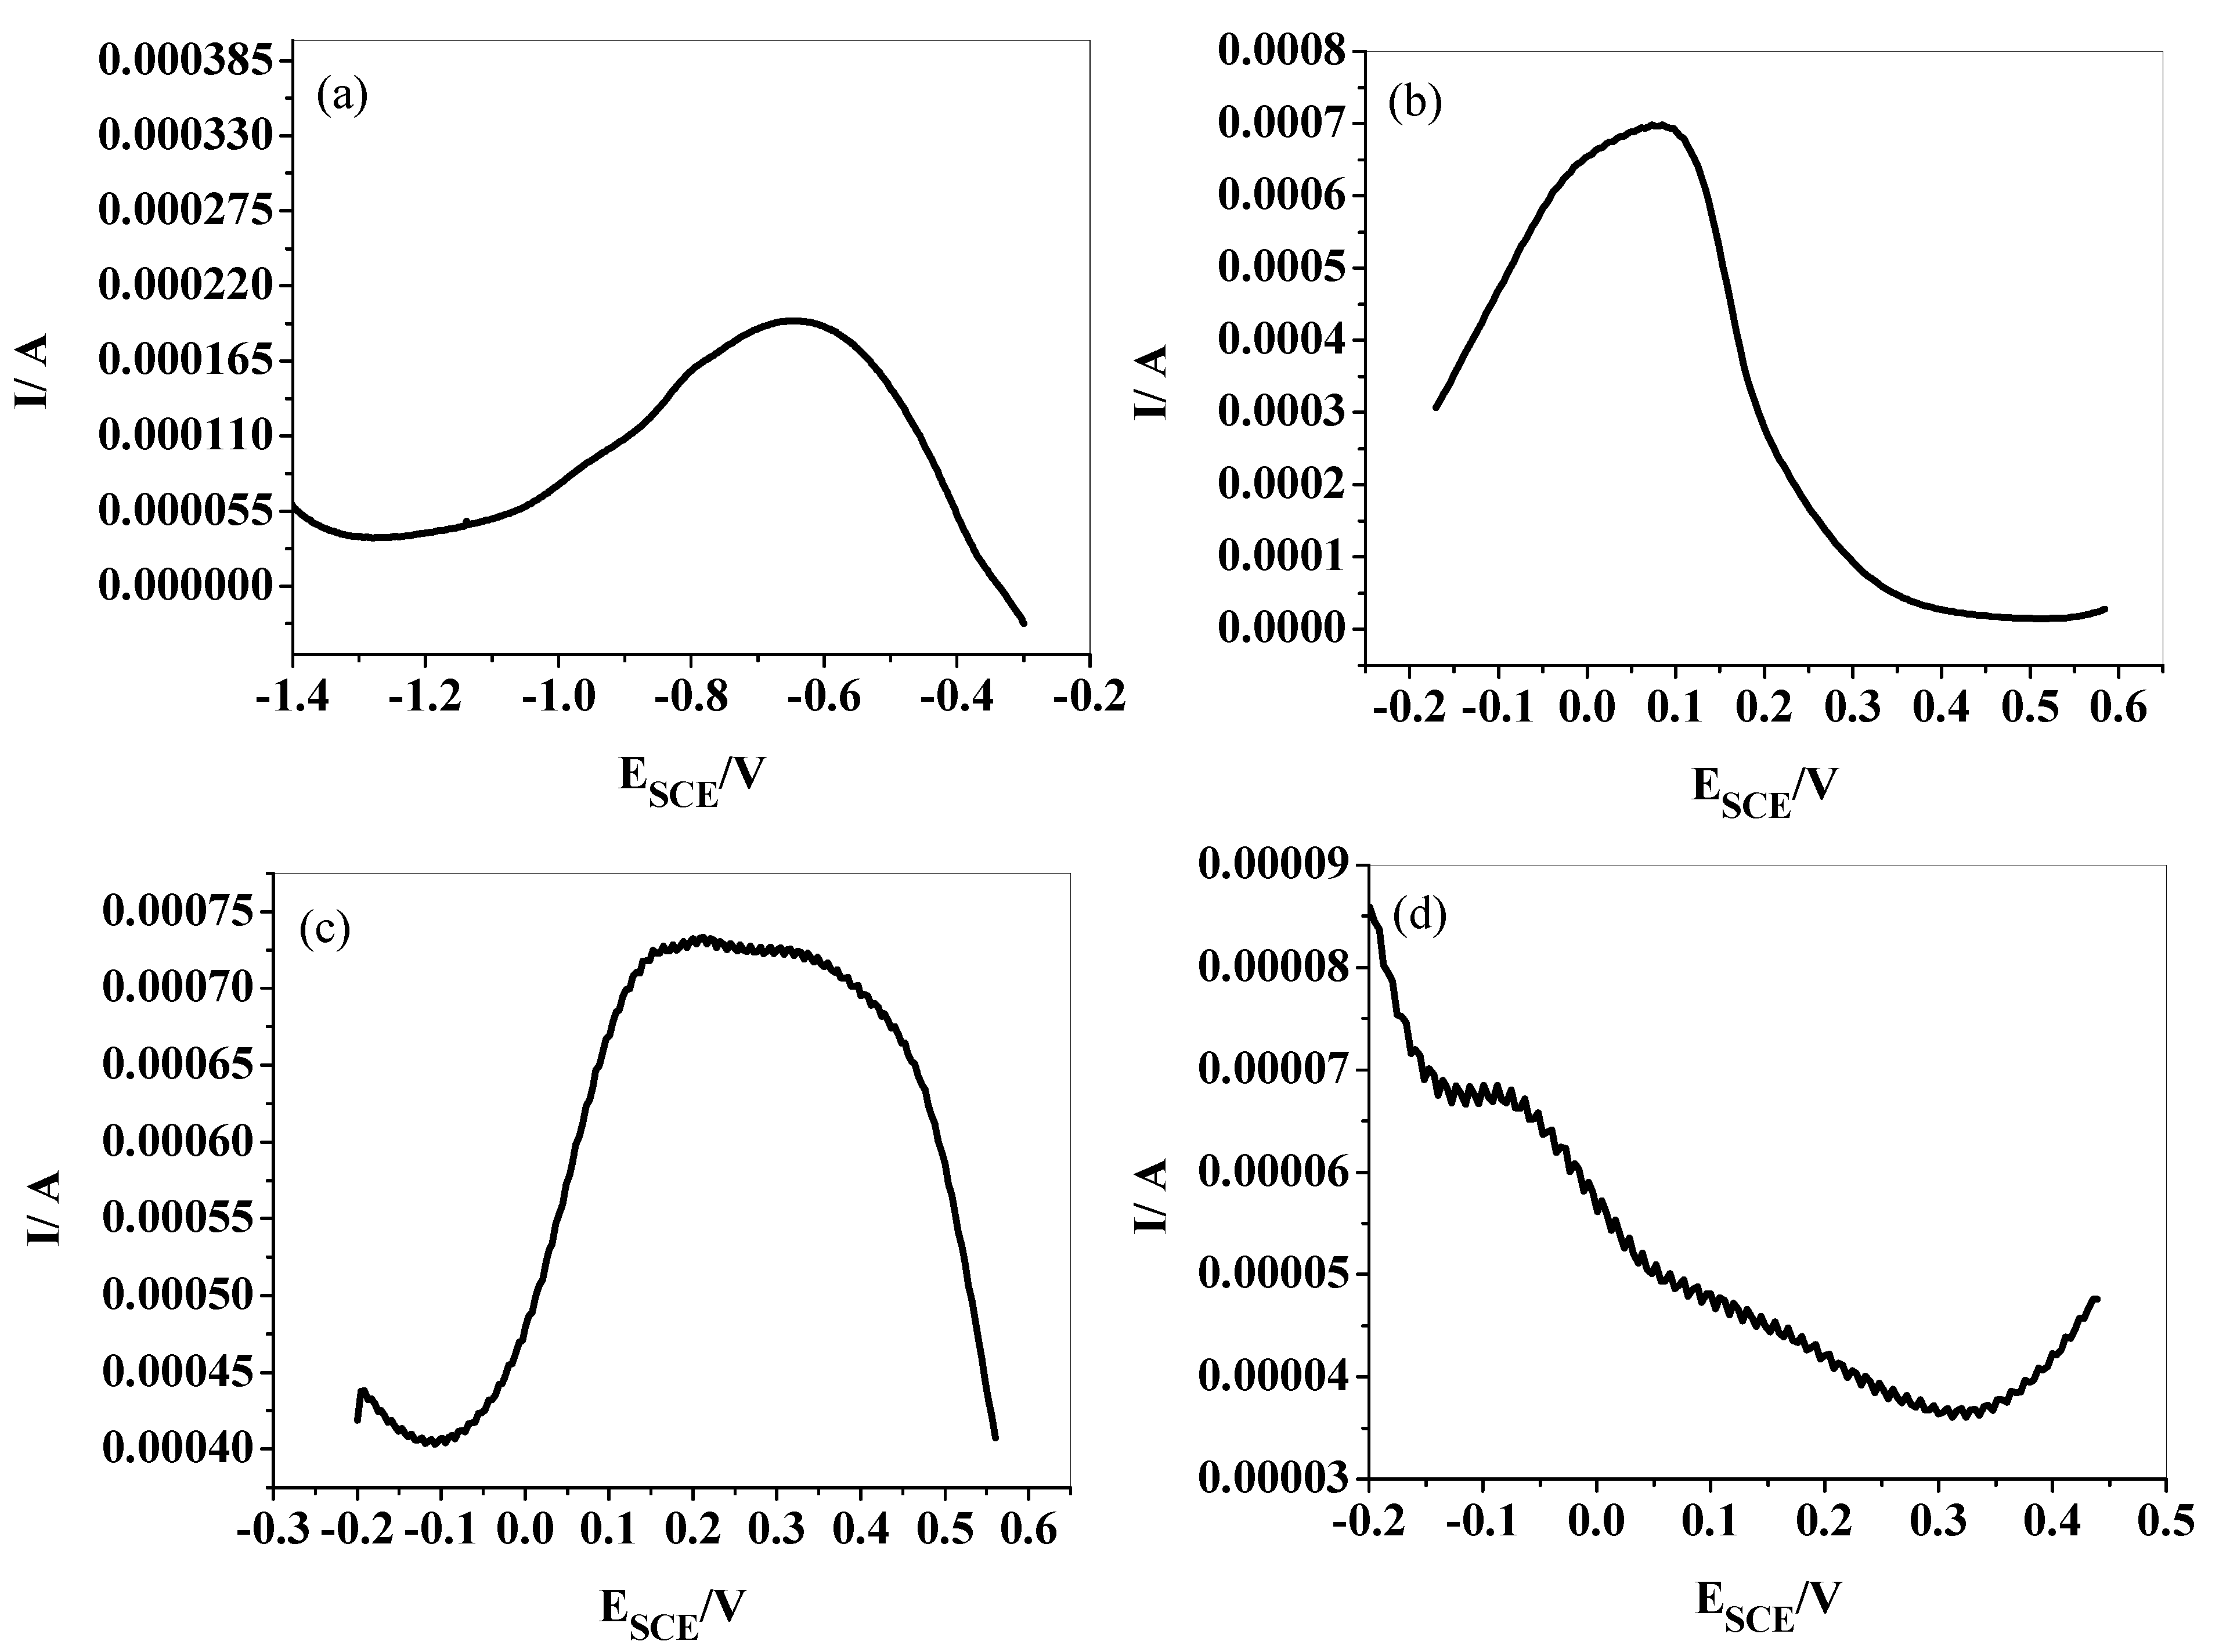
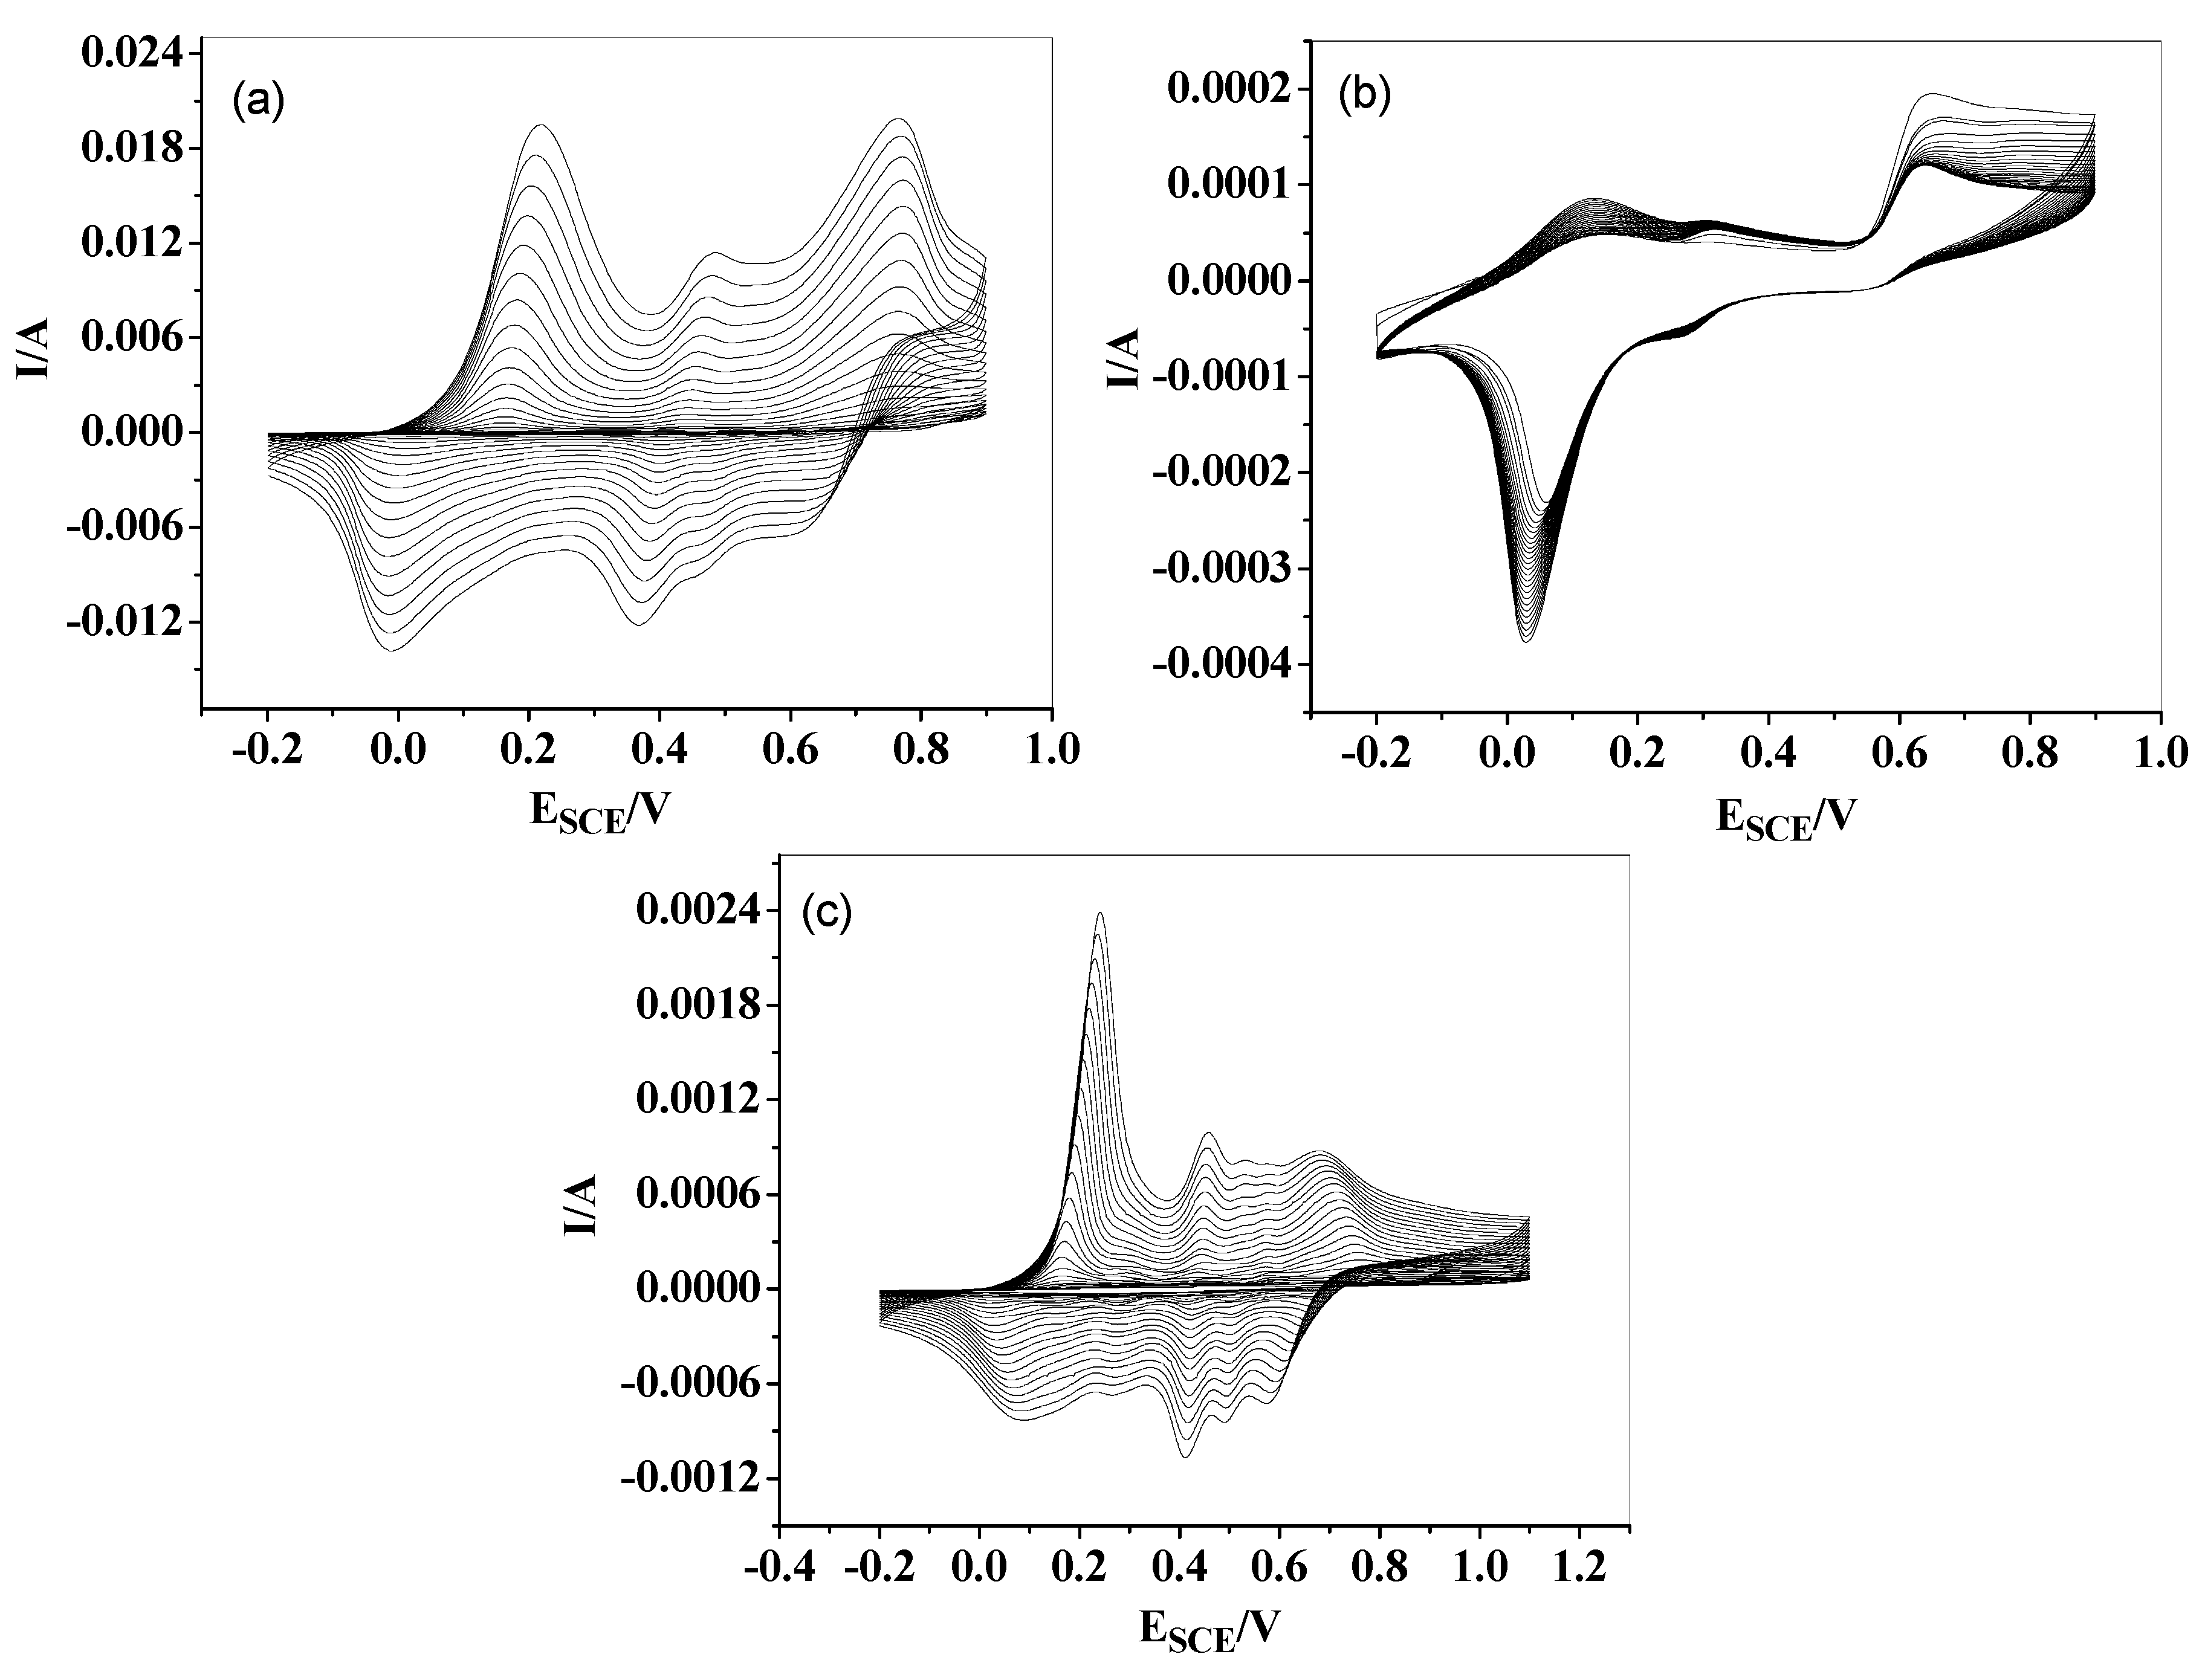
2.1. Cyclic Voltammetry Analysis

Figure 1 shows the cyclic voltammograms of bare gold electrodes, as well as PACHA-, PANI-, and PHA-coated electrodes in 0.1 M sodium citrate solution, with and without H2O2.
It can be perceived from Figure 1a that bare gold electrodes show a very small current response towards H2O2 at large oxidation potential. In Figure 1b, the copolymer displays a couple of electrochemical responses because of the redox nature of the copolymer. The anodic and cathodic peaks are observed at 0.32 V and 0.03 V, respectively, while after the addition of H2O2 the anodic and cathodic peaks shift to 0.30 V and −0.10 V. The curve also shows great increase in current peaks by the addition of H2O2. As shown in Figure 1c, the case of PANI is similar. PANI exhibits good electrochemical response towards H2O2. The anodic and cathodic peaks are observed at 0.75 V and −0.18 V, but after the addition of H2O2 the peaks shift to 0.50 V and −0.11 V, respectively. An increase in current peaks is also observed when H2O2 is added. From Figure 1, it is evident that both PANI and PACHA possess effectual electrochemical responses towards H2O2, offering a way to be used as H2O2 sensors. Based on the quantity of anodic peak currents, PANI is more electro-active towards H2O2 than PACHA. A possible reason might be the large separation of the polymer chain by side groups in the copolymer [21]. Interestingly, the H2O2 oxidation peak was observed at 0.30 V on the PACHA-coated electrodes. This potential was lower by 0.21 V compared to the H2O2 oxidation peak observed for the PANI-coated electrodes. This finding shows that the overpotential for H2O2 oxidation is greatly increased when the PACHA-coated electrode was used, indicating that the coating is favorable for H2O2 detection purposes. The PACHA detects H2O2 at a lower potential, not only with respect to PANI [26], but also poly(aniline-co-p-aminophenol) [27] and poly(thiophene-2-aminophenol-3-thiopheneacetic acid) [28]. The current response of PHA towards H2O2 is almost negligible compared to the response of PACHA and PANI; this might be due to the compact structural morphology and lower conductivity of PHA, as PHA is a redox polymer, having a ladder-like structure in which the electron transfer takes place by a hopping process, as there is no continuous path for the electron flow; thus, the conduction of the polymer is reduced. The inconsequential response of PHA towards H2O2 analysis may also be attributed to the pH of the solution in which the experiment is carried out, because the electrochemical activity of PHA quietly decreases in buffer solution of neutral pH.

2.1.1. Scan Rate and Rate Constant Analysis

The electrochemical response of PANI- and PACHA-coated electrodes towards H2O2 was checked both at lower and higher scan rates. A total of 1.4 × 10⁻⁶ M of H2O2 was taken for the purpose. It can be seen from Figure 2 that the current peak increases linearly with the square root of the scan rate (ν1/2) for H2O2, thus indicating that the redox reaction of H2O2 on the surface of PANI- and PACHA-coated electrodes is a diffusion-controlled process.
For a redox couple having an intermediate electron transfer rate constant, the anodic peak current (Ipa) and scan rate (v) can be related by Equation (1):
I p a = 0.496   n F A C D 1 2   ( ( α n α ) F v R T ) 1 2
where F is the Faraday constant, A is the area of electrode, C is concentration, D is the diffusion coefficient (in cm2 s−1), α is the charge transfer coefficient, R is universal gas constant, T is the absolute temperature, and nα is the number of electrons transferred in a reaction. The αnα can be calculated from Equation (2):
| E p a E p a / 2 | = 1.857 R T / F α n α
where E p a is the anodic peak potential and E p a / 2   is the half-peak potential. By substituting the α n α value in Equation (1), the diffusion coefficient ca be estimated. The ks (rate constant for a charge transfer reaction) value for a quasi-reversible redox reaction can also be resolute from Equation (3):
k s = 2.18 [ D ( α n α ) v F / R T ] 1 2   e x p [ α 2 n F ( E p c E p a ) / R T ]
The resulting αnα values for H2O2 at the scan rate of 0.05 Vs−1 for PANI- and PACHA-coated electrodes are 0.20 and 0.25, respectively. The diffusion coefficient of PANI was found to be 6.9 cm2 s−1, which is more than PACHA (3.47 cm2 s−1), meaning that H2O2 diffuses faster into PANI than PACHA. The ks value for PANI is 3.42 × 10⁻¹ cm s−1, while for PACHA it decreases to 2.83 × 10⁻¹ cm s−1; the reason for this may be that the charge transfer between the PANI and H2O2 takes place at a faster rate.

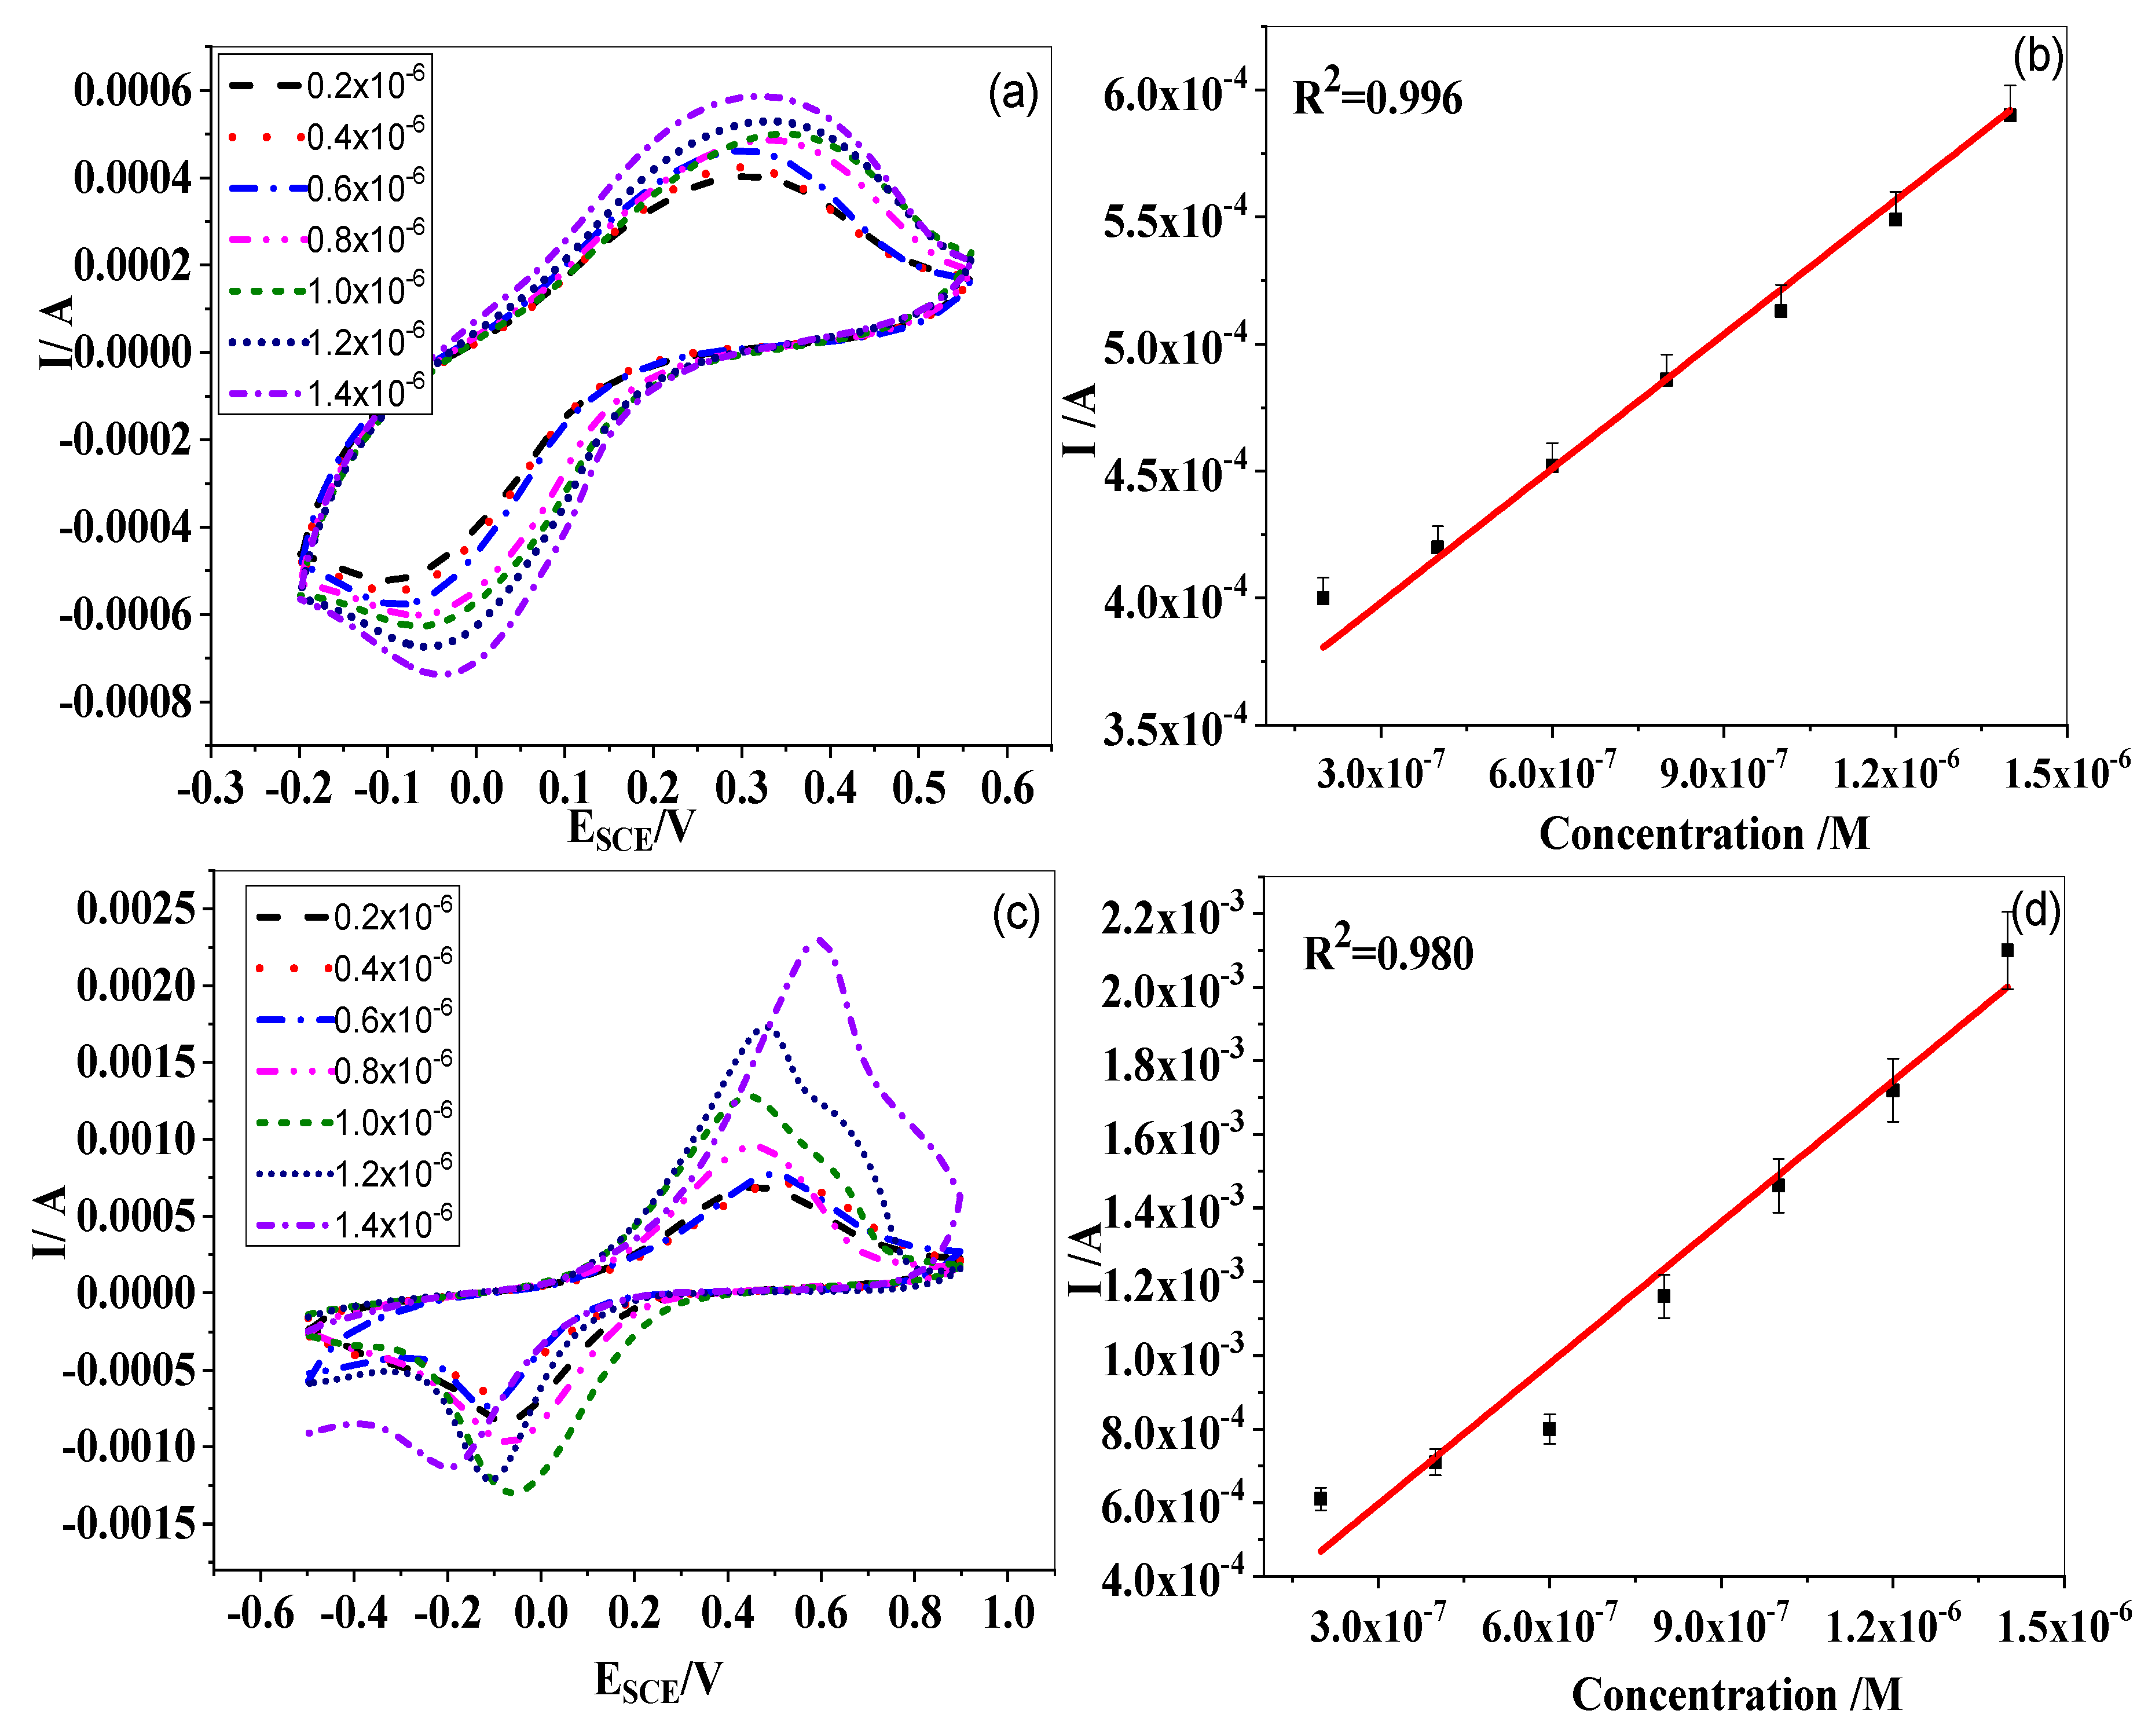
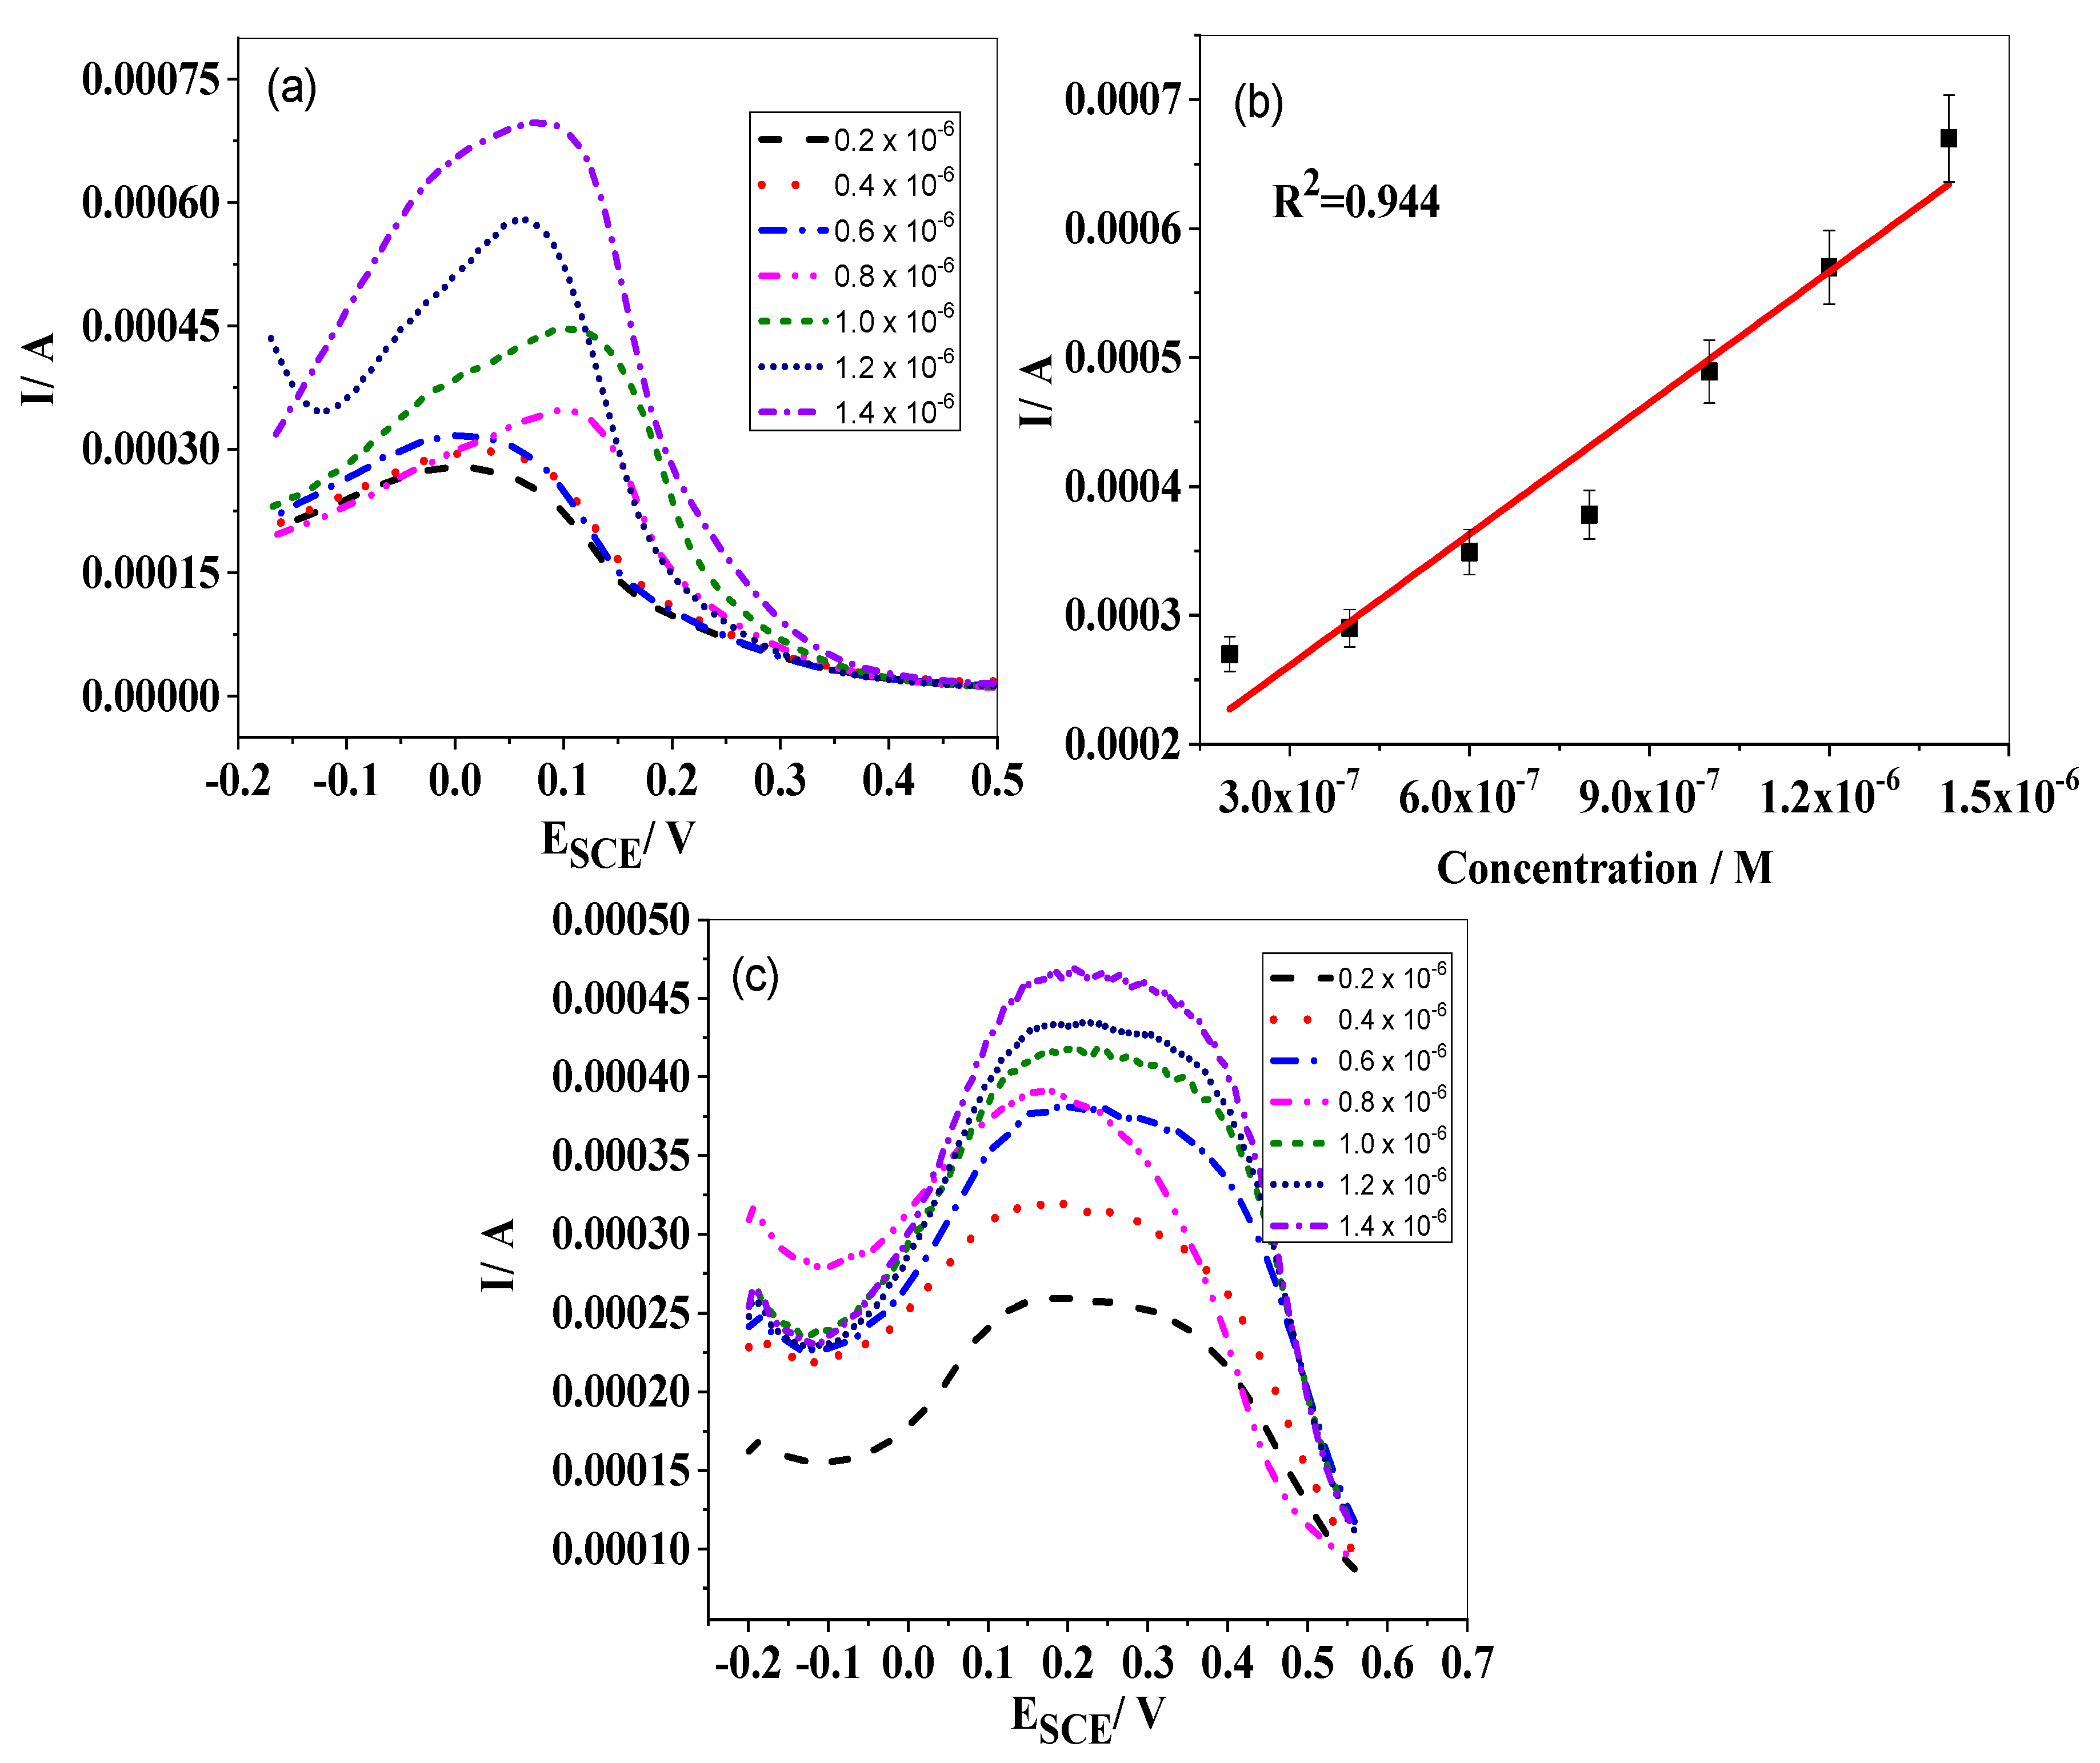
2.1.2. Electrochemical Response with an Increase in Concentration

Figure 3 shows cyclic voltammograms of PACHA- and PANI-coated electrodes in different concentrations of H2O2. It is observed that the oxidation peak constantly increases with the increase in H2O2 concentration, which means that the current peak has a direct and linear relation with H2O2 concentration [29].
The calibration curves obtained are shown in Figure 3b,d. The coefficient (R2) values attained from the linear calibration curve of H2O2 concentration ranging from 2 × 10⁻⁷ to 14 × 10−7 M at PACHA and PANI coated electrodes were 0.996 and 0.980, respectively. The limit of detection (LOD) was calculated with the help of following equation [30]:
LOD = 3 σ / m
where σ stands for the standard deviation of the blank/regression line, and m is the slope of the calibration line. The limit of detection and limit of quantification calculated were found to be 1 × 10⁻⁷ M, and 3.3 × 10⁻⁷ M for PACHA, while for PANI they increase to 1.15 × 10⁻⁷ M and 3.8 × 10⁻⁷ M, respectively.

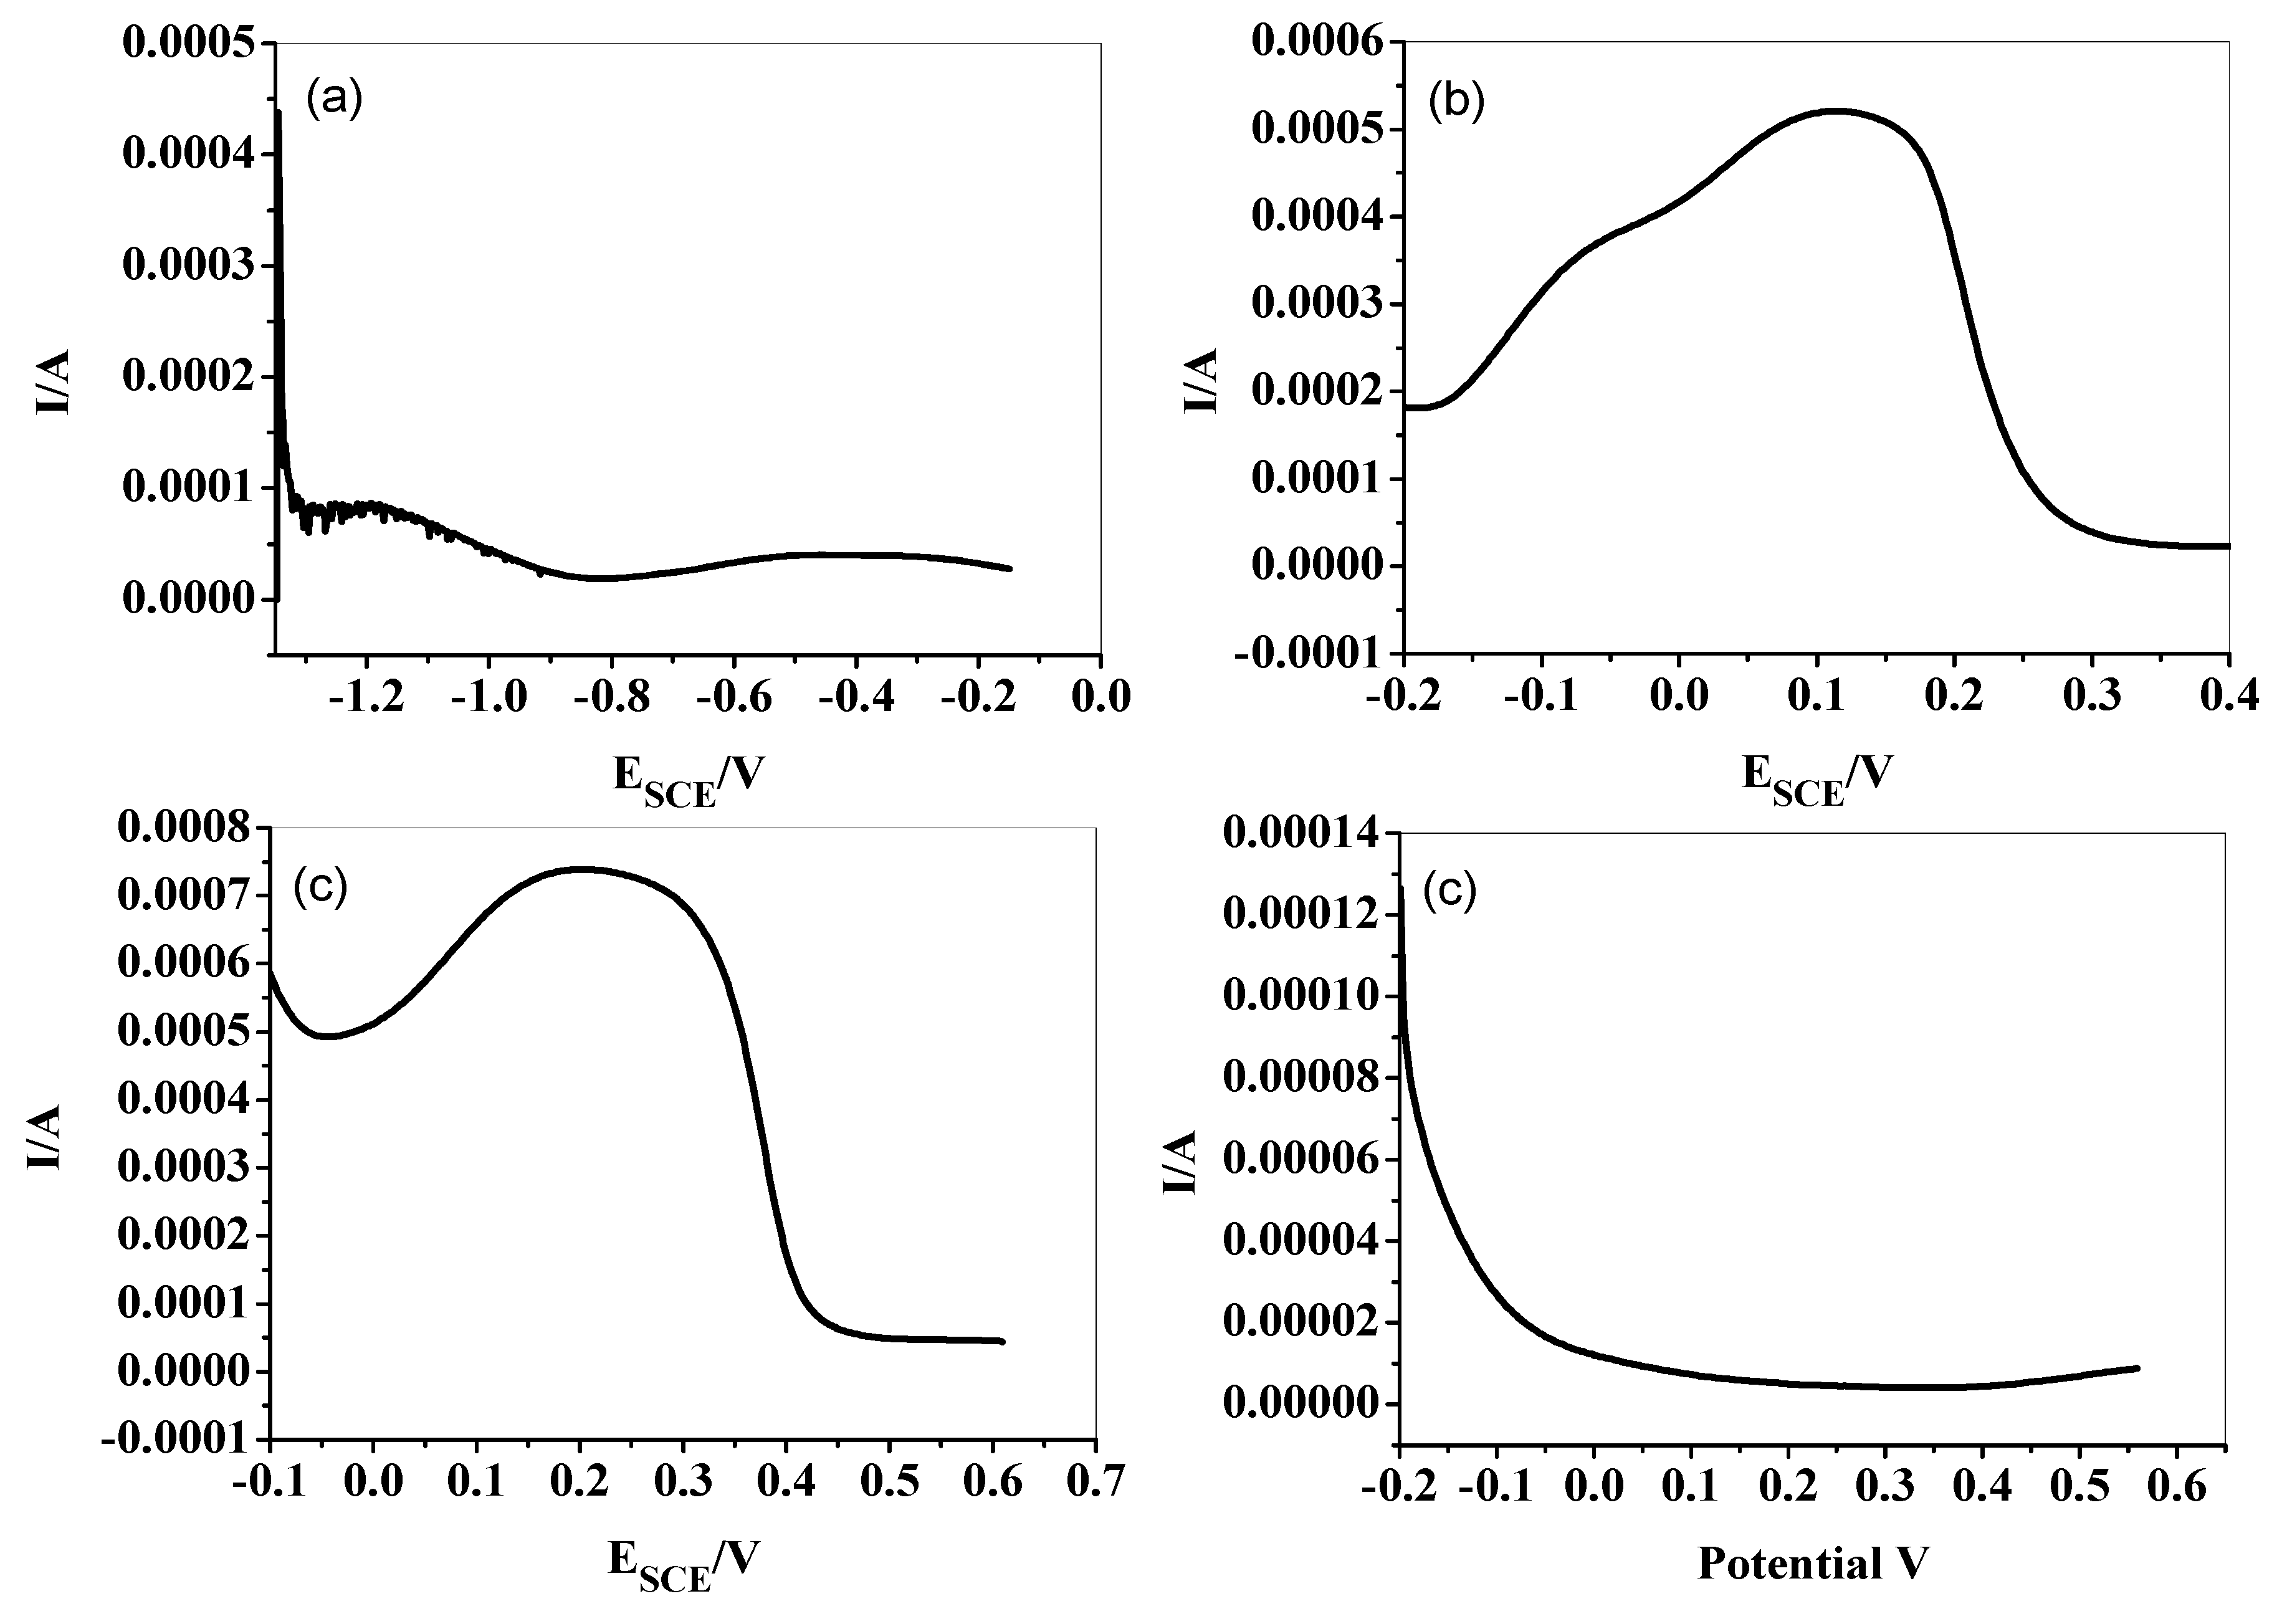
2.2. Square Wave Voltammetry Analysis

Square wave voltammetry (SWV) and Differential Pulse Voltammetry (DPV) were also employed to scrutinize the oxidation of H2O2 on PACHA-, PANI-, and PHA-coated gold electrodes, because of their high current sensitivity and low contribution to the background current.
Figure 4 shows the square wave voltammograms of bare as well as PHA-, PANI-, and PACHA-coated gold electrodes in 0.1 M acetate buffer containing 14 × 10−7 M H2O2. Oxidation peaks were obtained, and the peak potential and the current at different electrodes are quite indistinguishable. The anodic peaks at bare and PHA-coated electrodes were at −0.60 V and −0.07 V, respectively, with a very small peak current.
The oxidation of H2O2 by a PACHA-coated electrode gives rise to a single peak at 0.08 V, while PANI results at 0.20 V. The peak current in the case of PANI is greater than PACHA; however, the voltammetry peak for a PANI-coated electrode is broader, which makes the determination of individual concentration complicated [31]. PACHA resolved the merged anodic peaks in distinct voltammetry peaks. From the peak current analysis, it is clear that PACHA- and PANI-coated electrodes enhance the electrochemical response towards H2O2. The SWV results are in good agreement with the CV results.

Electrochemical Response with an Increase in Concentration

Figure 5 shows SWV voltammograms of PACHA and PANI in different concentration of H2O2. It can be observed that the current peak increases with the increase in H2O2 concentration. The calibration curve obtained is shown in the inset. The coefficient (R2) value obtained from the linear calibration curve of the H2O2 concentration at PACHA was 0.944. The limit of detection and limit of quantification calculated were found to be 1.78 × 10 −7 M and 5.6 × 10 −7 M for PACHA, respectively, while for PANI they cannot be evaluated due to the broader current peaks.

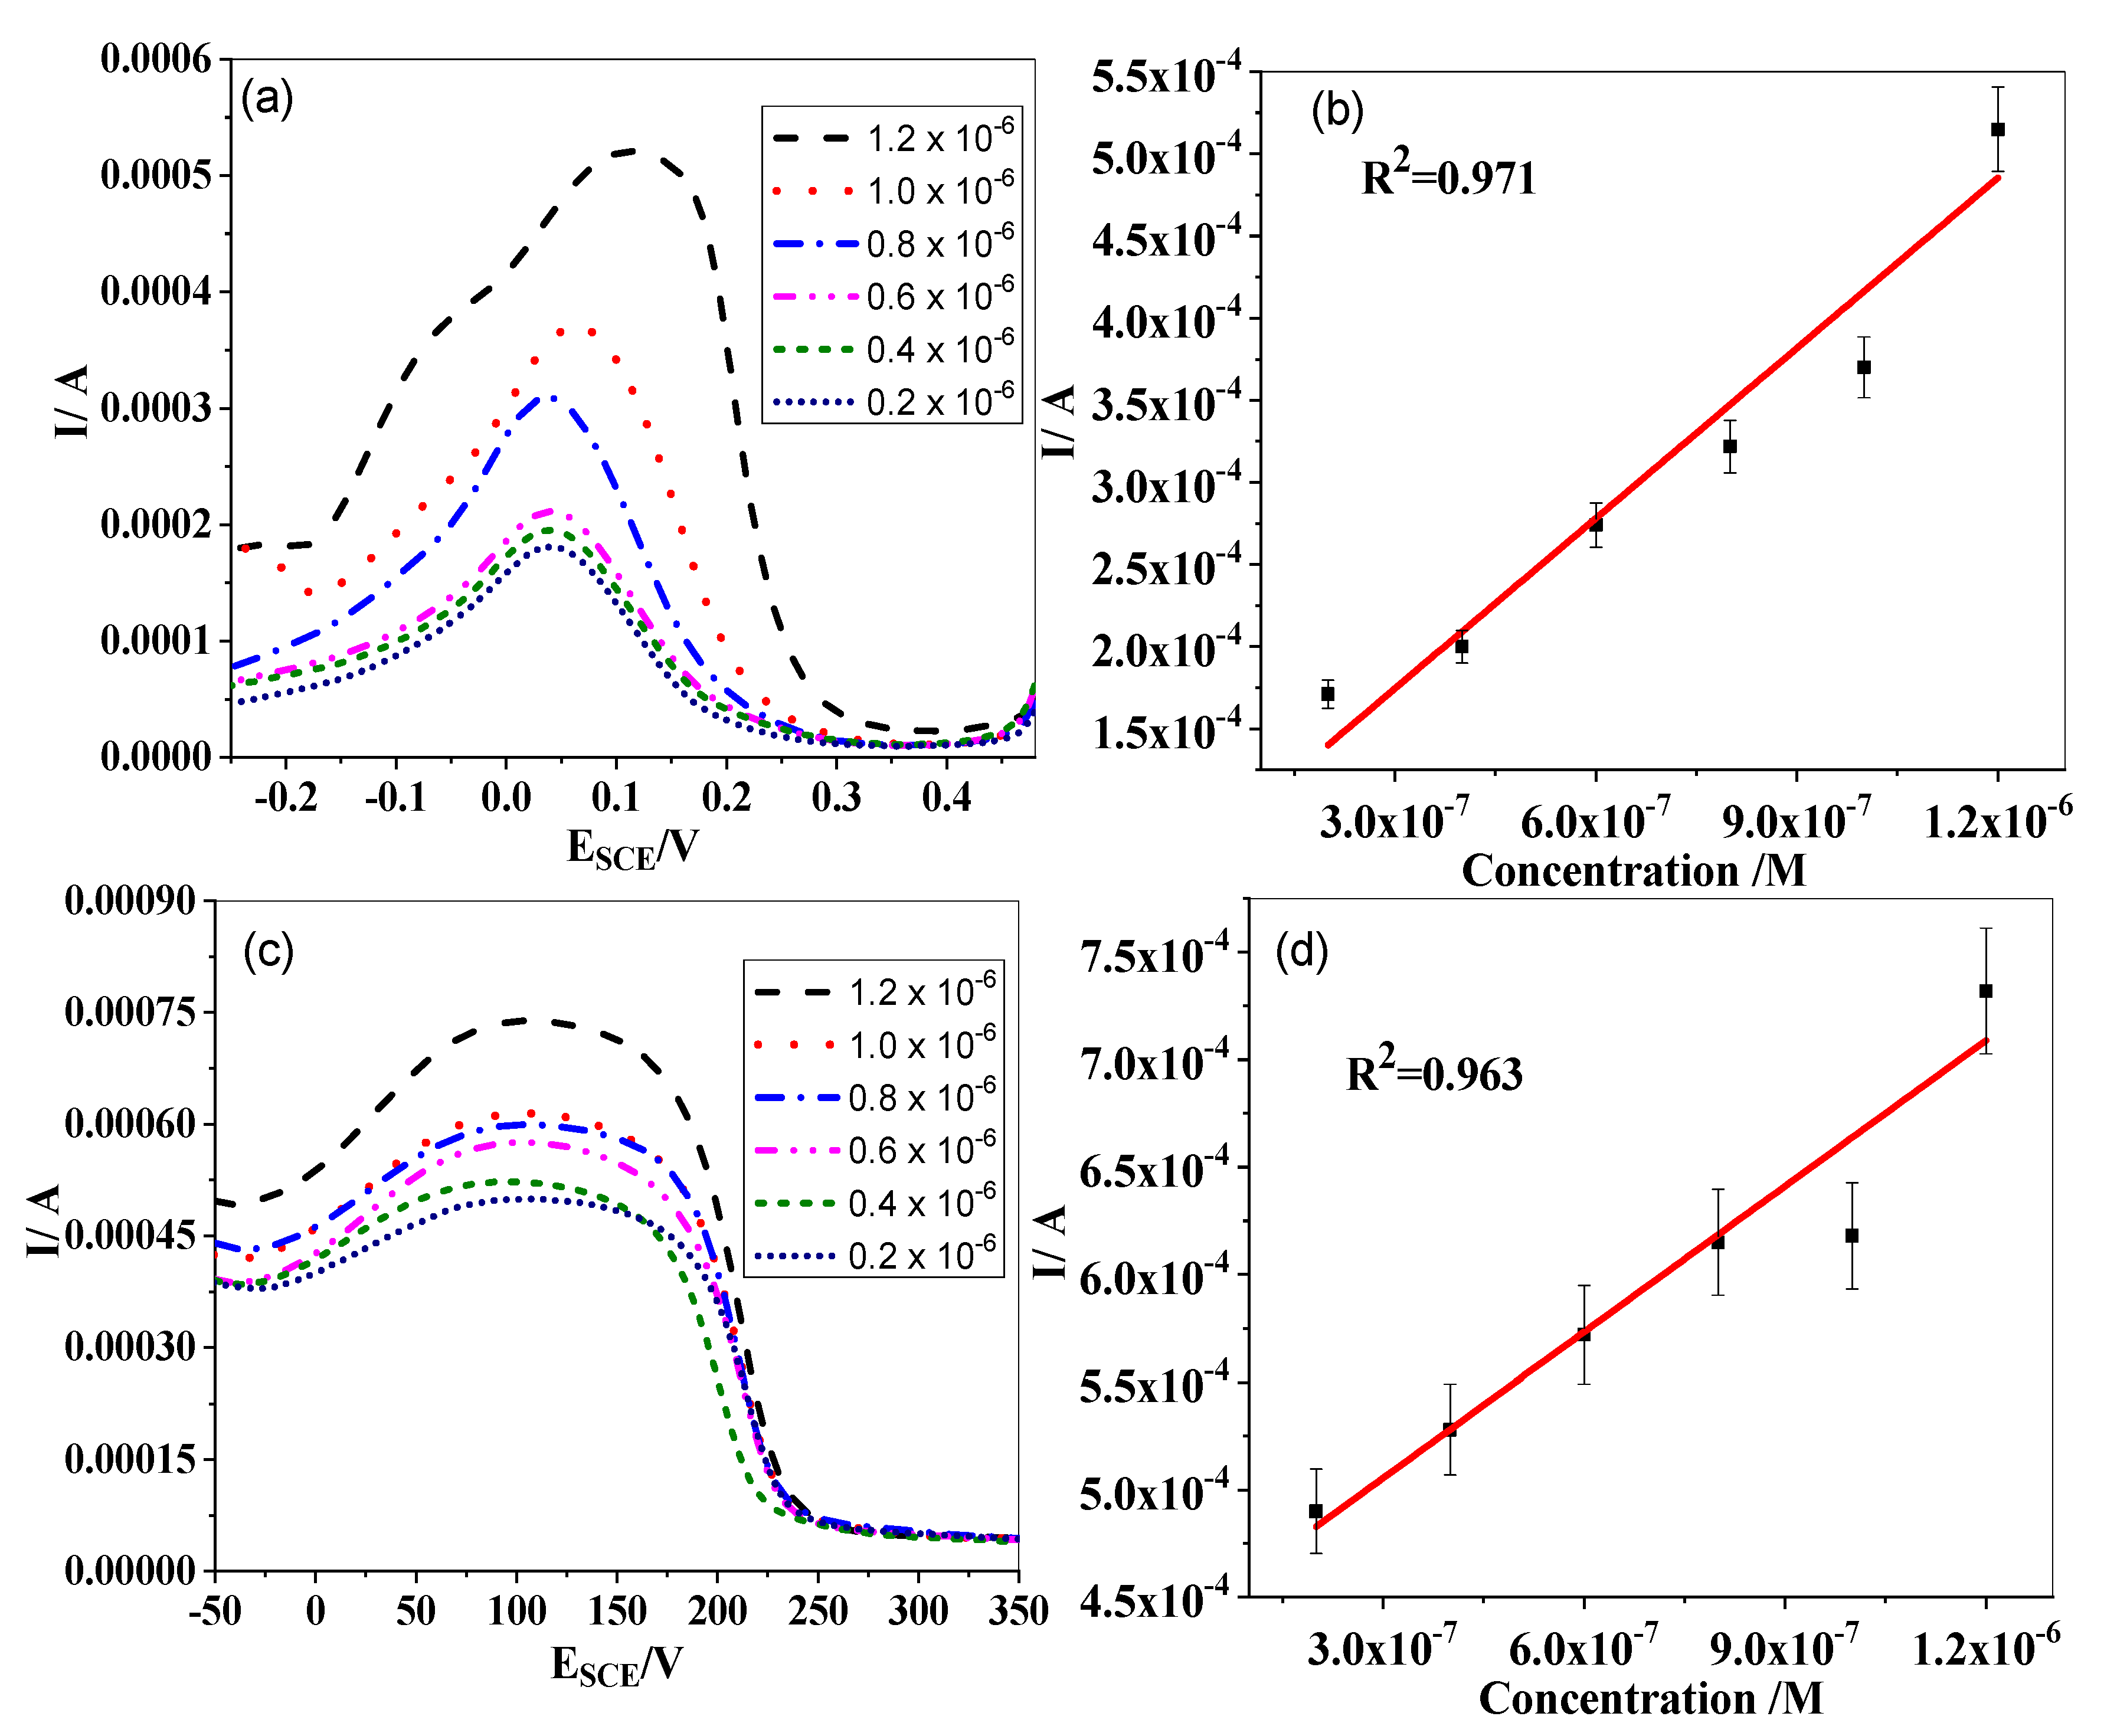
2.3. Differential Pulse Voltammetry Analysis

Differential pulse voltammograms (DPVs) of H2O2 for PACHA-, PANI-, and PHA-coated as well as bare electrodes are shown in Figure 6.
The oxidation peak of H2O2 for the PANI- and PACHA-coated electrodes are observed at 0.20 V and 0.10 V, respectively. It can be seen that the oxidation peak currents of H2O2 for the PACHA- and PANI-coated electrodes are much higher than the bare and PHA-coated electrodes. Similar to CV and SWV, the DPV results show that the oxidation of H2O2 takes place at a higher potential with PANI-coated electrodes compared to PACHA-coated electrodes. The DPV data are in agreement with the CV and SWV data. However, the current response in the case of SWV is greater than that of CV and DPV. This may be because of the efficient elimination of capacitance current [32].

Electrochemical Response with Increase in Concentration

DPVs of PACHA and PANI in different concentrations of H2O2 are given in Figure 7. Figure 7b,d shows the calibration curve with coefficient R2 values of 0.963 for PANI and 0.971 for PACHA. A direct relationship between current peak and H2O2 concentration is attained. The curves also show a peak shift with the increase of H2O2 concentration; the reason for this may be that a high voltage is required for the electrons to surpass the interface [33]. The limit of detection (LOD) and limit of quantification (LOQ) obtained were 1 × 10⁻⁷ M and 3.3 × 10⁻⁷ M, respectively, for both PANI- and PACHA-coated electrodes. The DPV results validate the CV and SWV data.
The LOD of H2O2 is given in Table 1. It can be seen from Table 1 that the LODs obtained from different techniques are quite comparable with each other, and are much lower than the already reported data [34,35,36,37]. It can be concluded from these results that electrodeposited PACHA and PANI on the surface of an Au electrode enables the detection of H2O2 at a low concentration level. The LOD and LOQ determined with a DPV have the same values both for PANI- and PACHA-coated electrodes, despite the higher peak current of PANI compared to PACHA. The DPV curves of PANI do not show sharp peaks, but rather wide current plateaus spreading over the region from 50 to 200 mV. The DPV curves of PACHA show sharp peaks around 50 mV; however, the current peaks shift towards 100 mV with the increase in concentration of ascorbic acid (AA). The LOD and LOQ values evaluated from DPV curves depend not only on the peak current, but also the linearity and slope of the calibration curve. The R2 value of PACHA (Figure 7b) is higher than for PANI (Figure 7d); therefore, the LOD and LOQ values determined with a PACHA-coated electrode resemble those determined with a PANI-coated electrode.

2.4. Stability, Sensitivity, and Reproducibility

The stability of the electrodes was determined by keeping the electrodes in 1 M solution of citrate buffer (pH 5) for 10 days and recording CV before and after immersion in 1.4 × 10⁻⁶ M H2O2 solution. The resulted CV graph is provided in Figure S1 of the supporting file. The results show that the current peak decreased very slightly for the PACHA-coated electrode, indicating its good stability. DPV measurements were carried out in order to analyze the sensitivity of the sensors. The resulted data was plotted as a calibration curve of current versus concentration in Figure S2. The sensitivity of electrodes was evaluated using Equation (5) [38]:
S e n s i t i v i t y = m A
In the above equation, m is the slope of calibration curve and A is the area of active sites of electrode, where A = 0.5 cm2. The resulted sensitivity value for PACHA was 650 A/Mcm2 in terms of current, while for PANI it was 434 A/Mcm2. The sensitivity was found to be much greater than previously reported H2O2 sensors [36,39]. The current values assure the high sensitivity of both PACHA- and PANI-coated electrodes. The reproducibility of the sensor was also scrutinized with the help of cyclic voltammetry. The electrochemical behavior of PACHA was noted in solutions of different concentrations. The derived data was reported in Figure S3 in the form of a calibration curve. The LOD calculated from the reproducibility measurement was 1 × 10⁻⁷, which is same as the LOD reported earlier, thus assuring the repeatability of the PACHA-coated electrode.

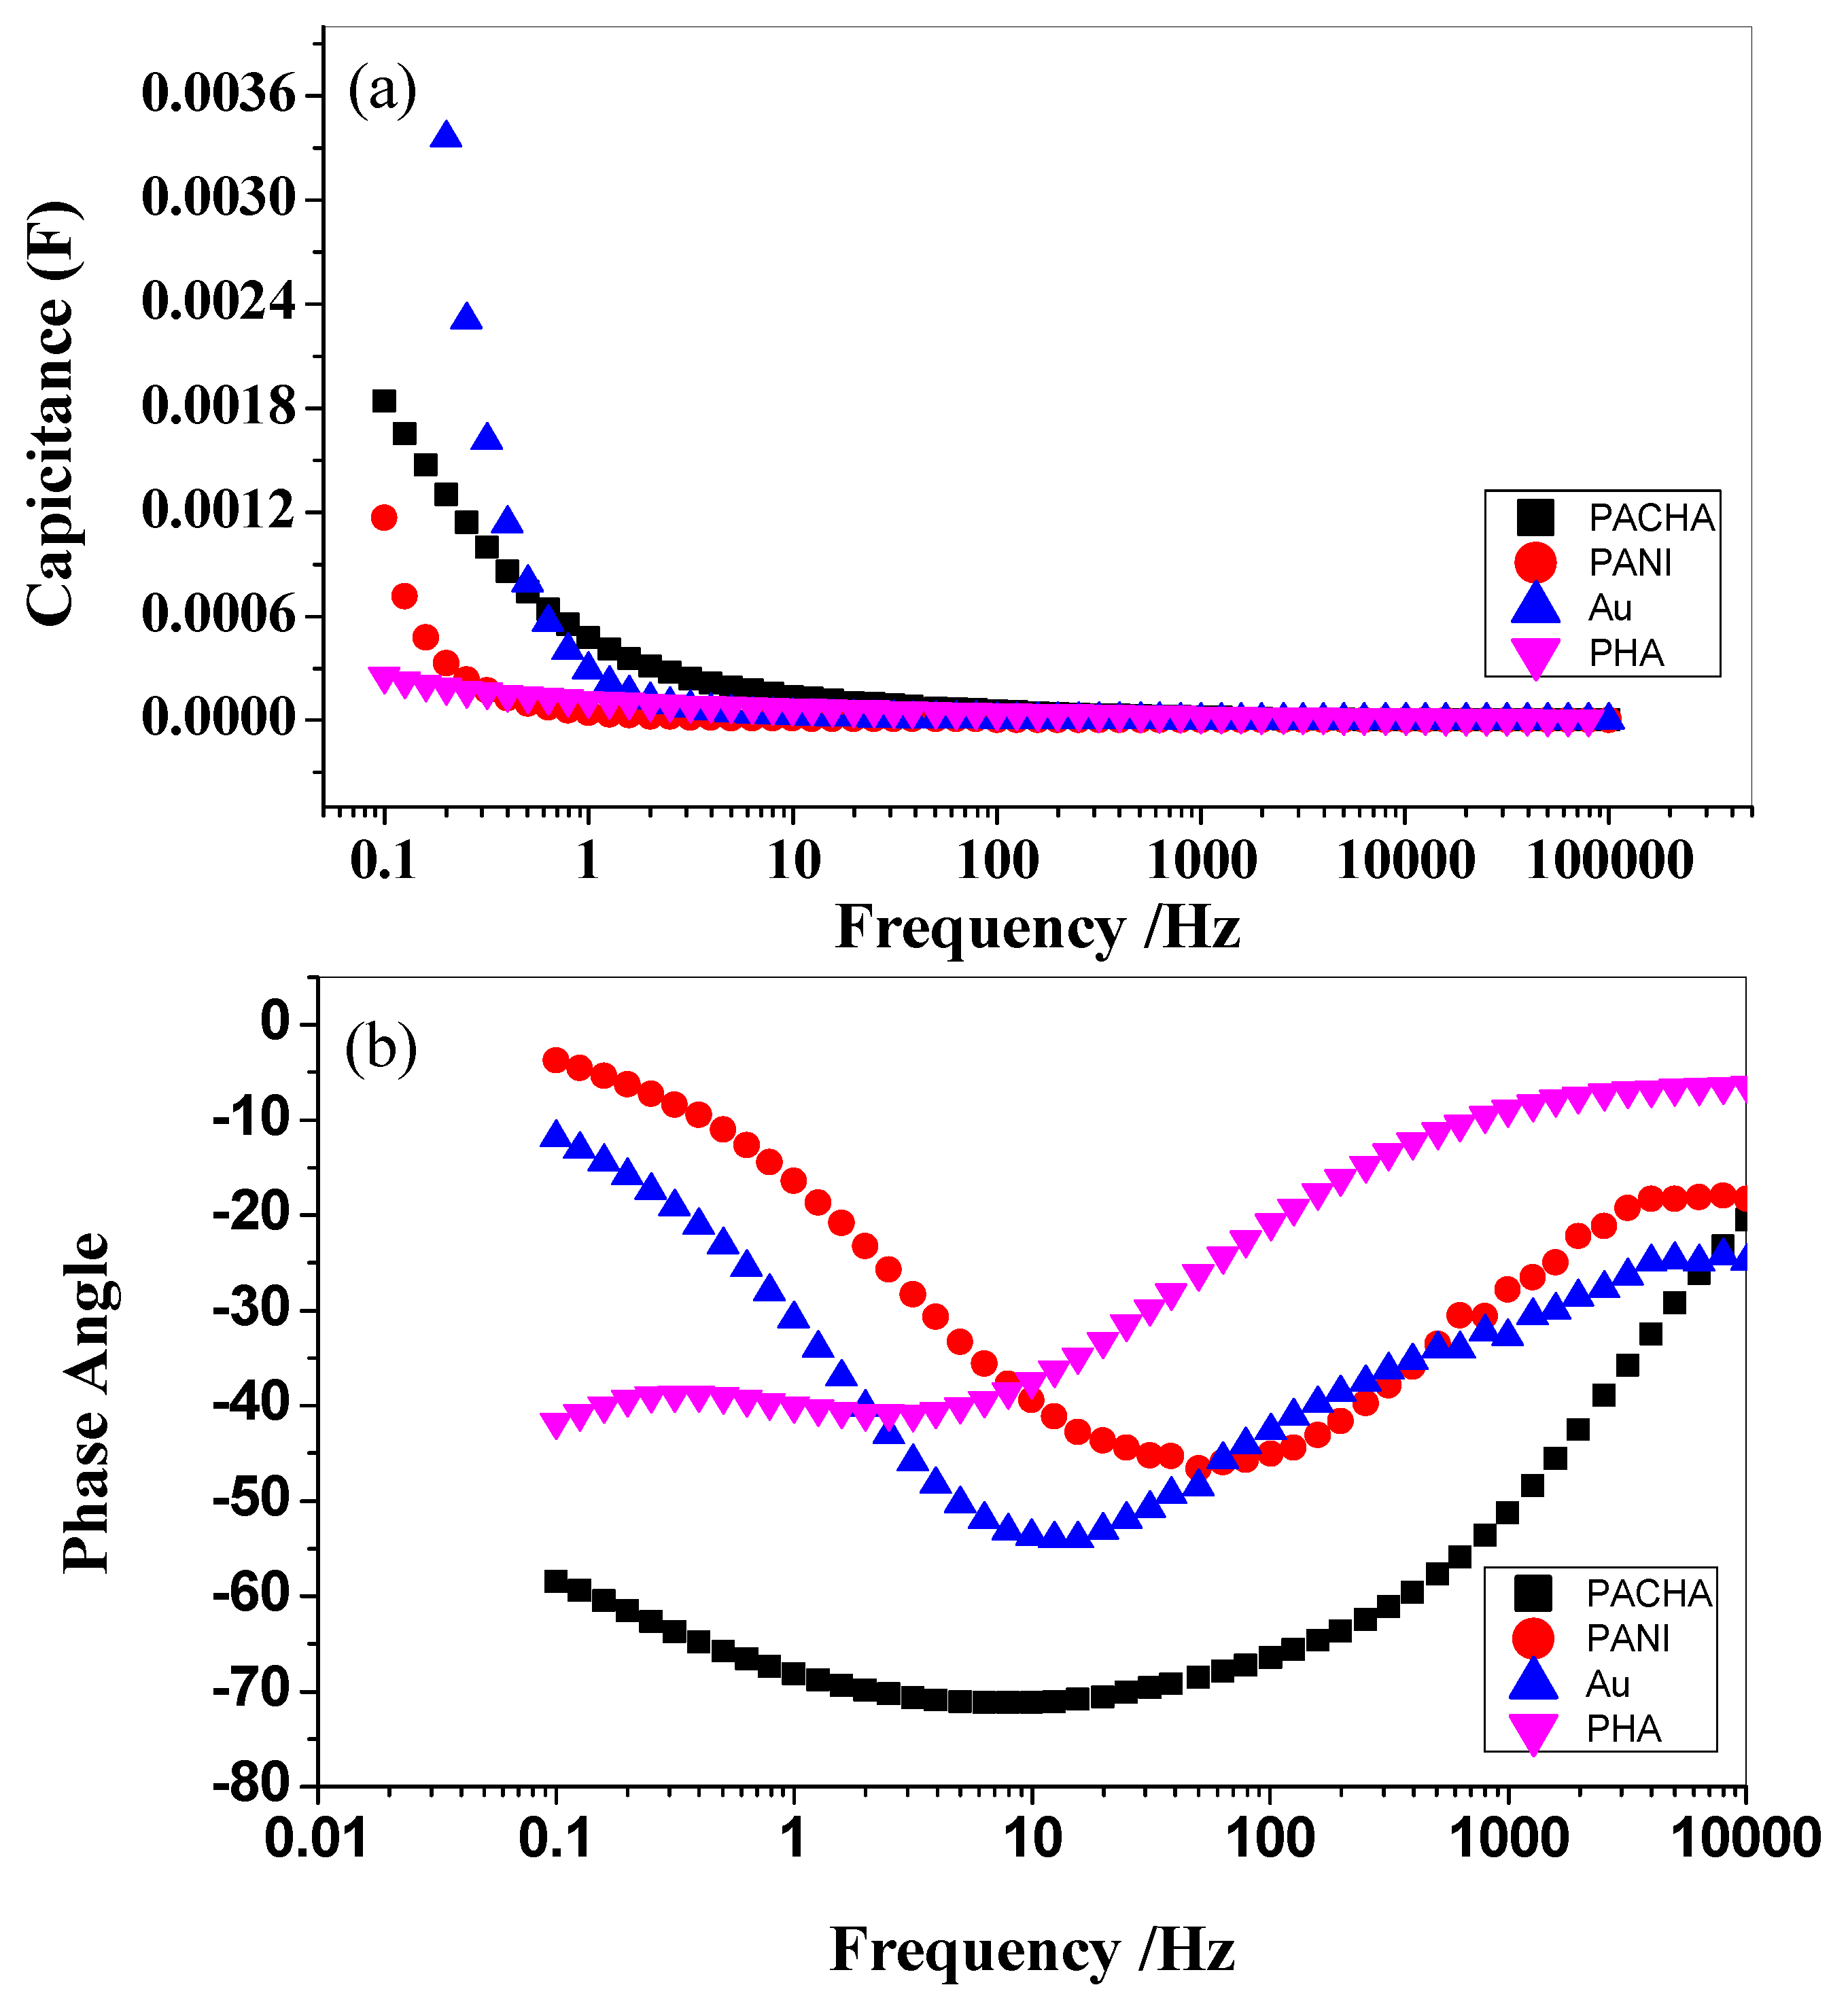
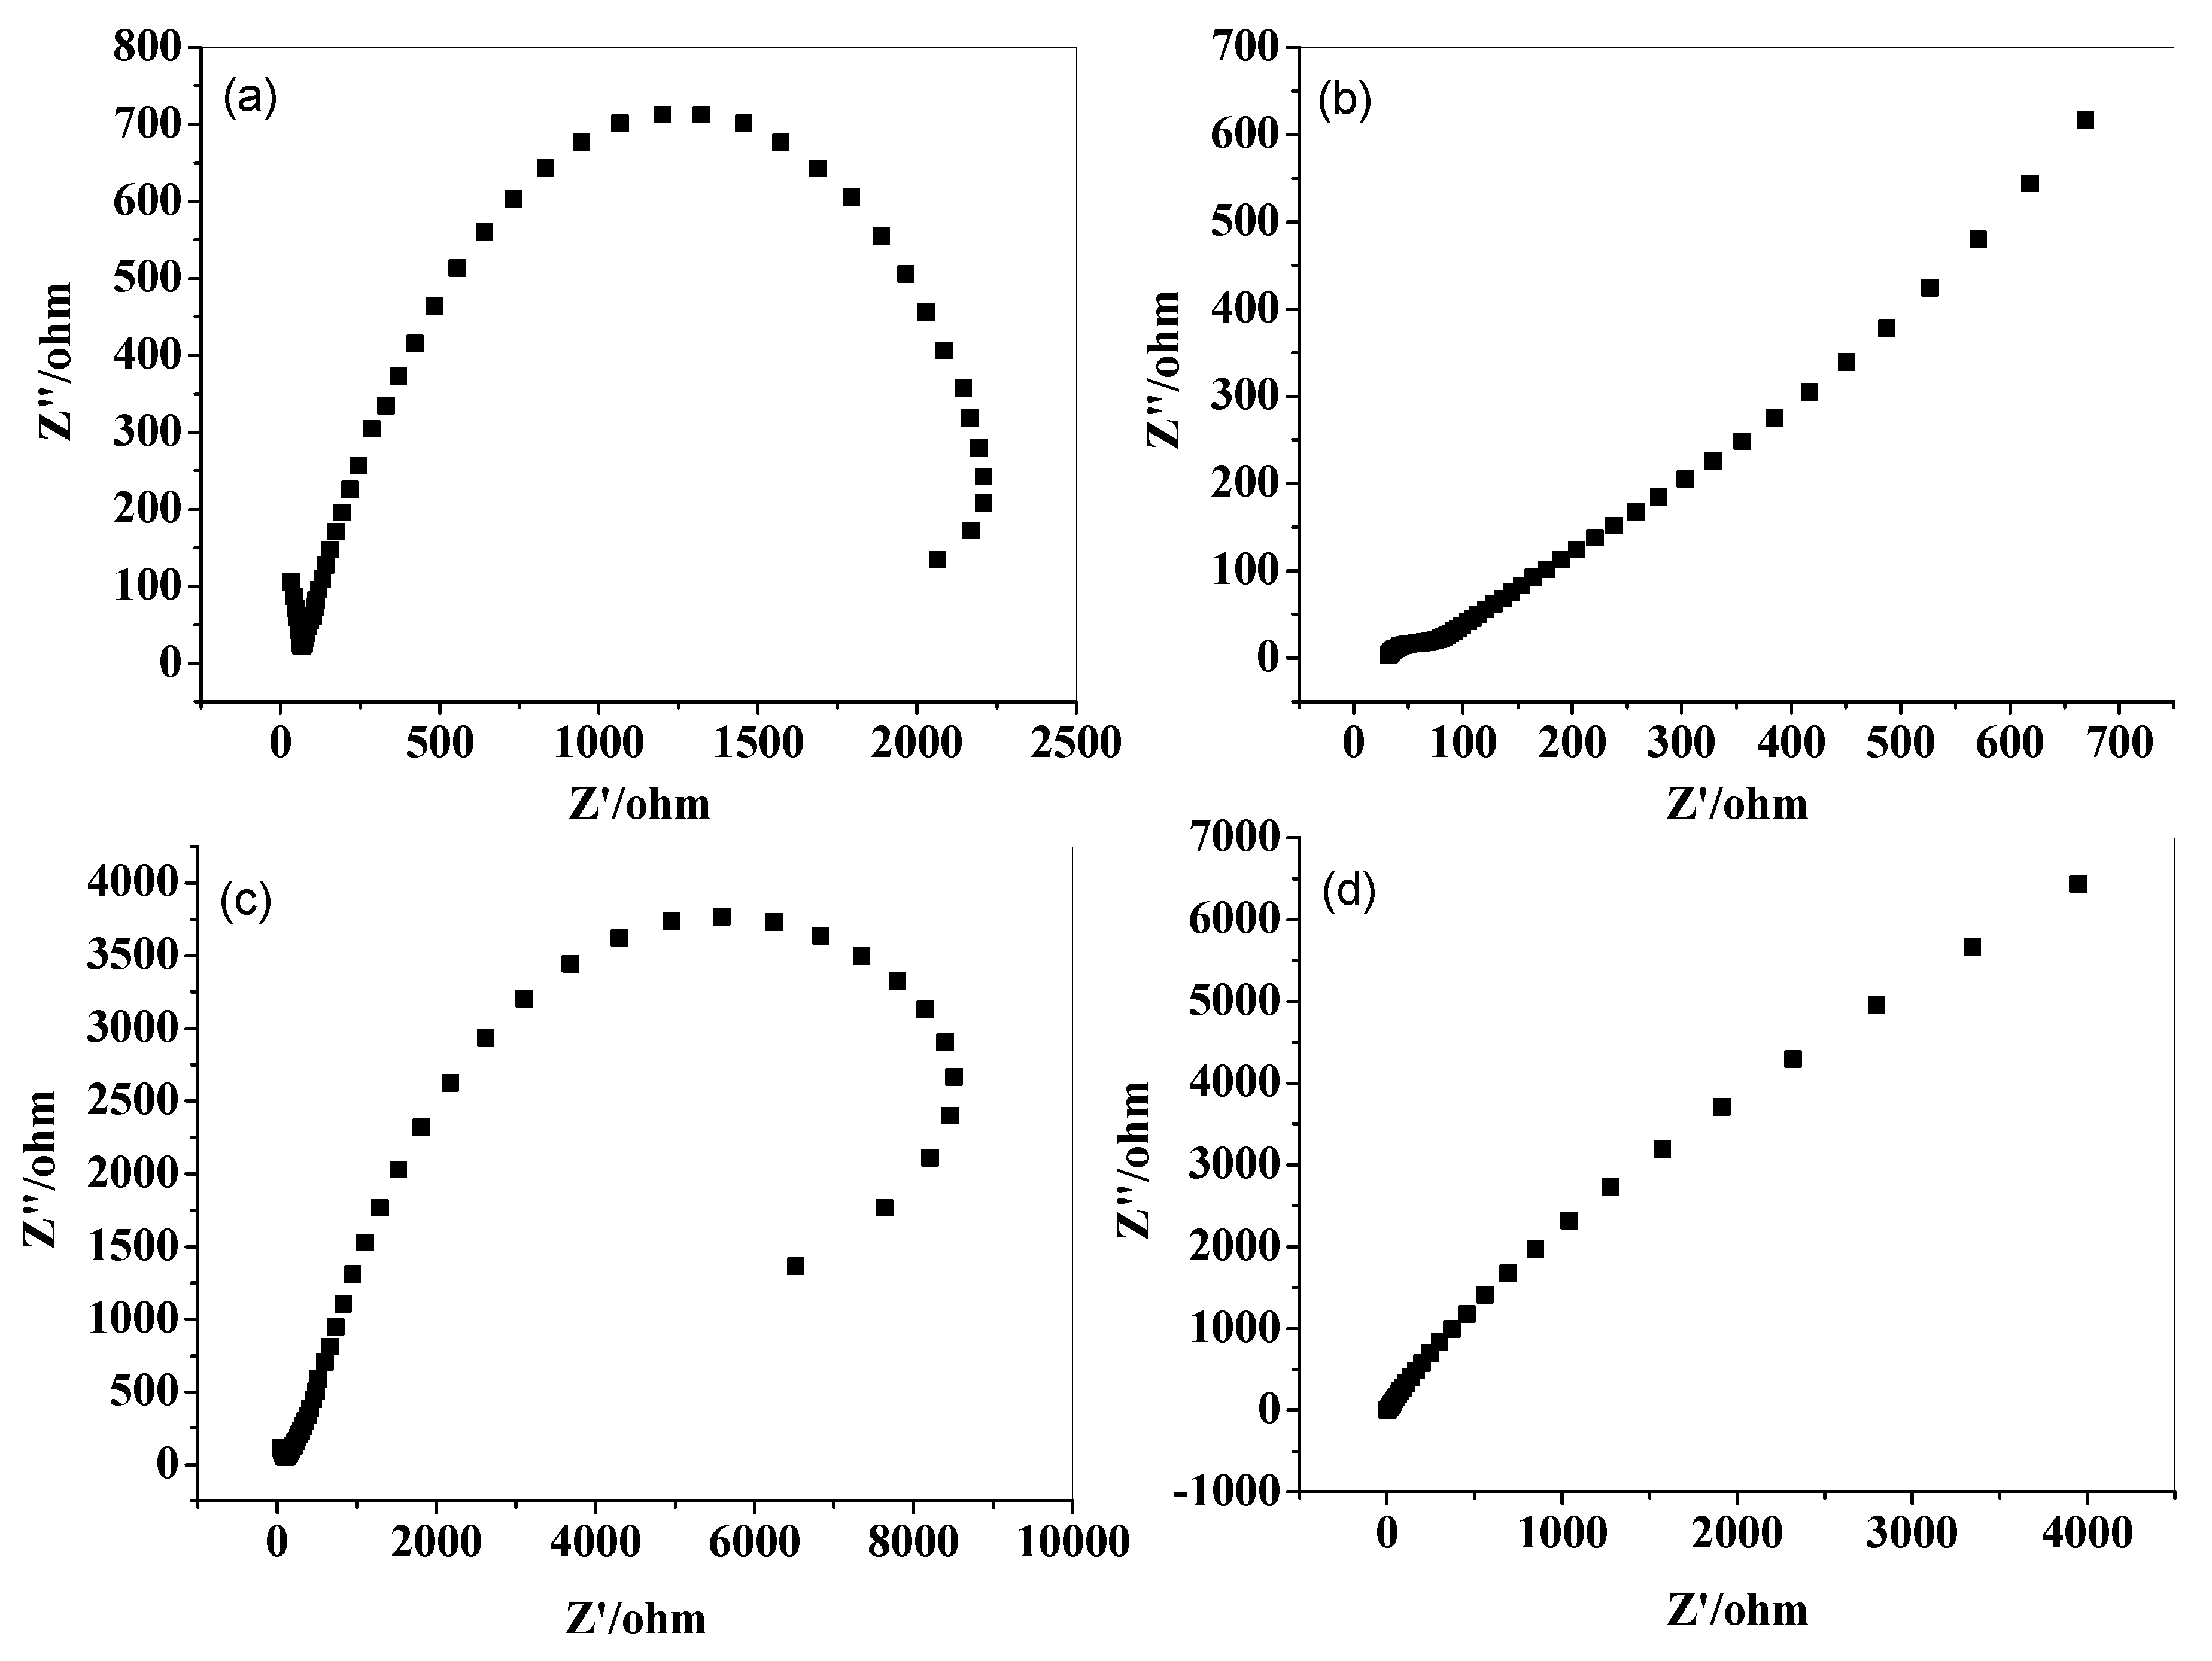
2.5. Electrochemical Impedance Measurements

Electrochemical impedance spectroscopy (EIS) is considered to be a promising tool for interfacial properties studies of surface modified electrodes. The data is usually presented in the form of Nyquist and Bode plots. The diameter of the semicircle in a Nyquist plot represents the charge transfer resistance (Rct), and the straight line shows the diffusion-related process [40]. Figure 8 shows Nyquist plots of bare gold and polymer-coated electrodes in citrate buffer (pH 5) containing 1.4 × 10⁻⁶ M H2O2 solution. As can be easily observed, PACHA exhibits both a semicircle and a straight line. However, the semicircle diameter is very small, suggesting low Rct to the H2O2 dissolved in the citrate buffer solution. The Nyquist plots of bare Au and PANI-coated electrodes indicate that the impedance is due to the interfacial charge transfer within the applied frequency range [41]. However, the PHA shows only a diffusional, limited electrochemical process [42].
The Bode plot of capacitance versus frequency, obtained with PANI-, PACHA-, PHA-coated electrodes, is given in Figure 9a. It is clear from the figure that the capacitance decreases with the increase in frequency. However, the lowering of the capacitance value is only observed in the low frequency range, whereas the ion permeability of the films remains the same at the higher frequency range. The resulted capacitance values of PACHA–Au, PANI–Au, PHA–Au, and Au were 1.84 × 10⁻³ F, 1.17 × 10⁻³ F, 2.52 × 10⁻⁴ F, and 1.21 × 10⁻² F, respectively. The capacitance of PACHA is greater than its homopolymers, which means that PACHA is more permeable and has a higher tendency for charge storage than PANI and PHA.
The phase angle decreases in order of PHA > PANI > Au > PACHA, as shown in Figure 9b. The decrease in phase angle specifies the reduction in inductive parameters like charge transfer resistance, membrane resistance, and solution resistance [43]. The decrease in phase angle also enhances the inductive behavior of the electrode. A capacitor with promising inductive behavior requires a low phase angle. It can be seen in Figure 9b that Au and PACHA exhibit low phase angles; hence, it is assumed that their inductive properties are better than both the homo-polymers. The phase angle analysis is in agreement with capacitance.

3. Materials, Instruments, and Methods

3.1. Materials and Instrument

Reagent grade aniline (Riedel–De Haën, Seelze, Germany) was distilled and then stored in nitrogen atmosphere. The reagent-grade 2-hydroxyaniline (ACROS), reagent-grade sulfuric acid (Riedel–De Haën, Seelze, Germany), H2O2 (analytical-grade), citric acid, and sodium citrate were used as received. Gamry Reference 3000 workstation (Warminster, PA, United States) was used for carrying out electrochemical measurements in a three-electrode assembly. Gold sheets of 0.5 cm2 area, gold wire, and a saturated calomel electrode were used as working, counter, and reference electrodes, respectively. LSV DPV EIS measurements were carried out in the frequency range of 0.1 Hz to 105 Hz at 0.5 V, with 5 mV AC perturbation. Square wave voltammograms were recorded in the range of −0.2 to 0.5 V at 15 Hz with 4 mV step size, 50 mV pulse size and 0.06 s pulse time. Differential pulse voltammograms were recorded with 2 mV step size, 50 mV pulse size and 0.2 s pulse time in the potential range of -0.2 to 0.56 V.

3.2. Electrode Preparation

The PANI, PHA, and PACHA were prepared by the electrooxidation of aniline, 2-hydroxyaniline, and its copolymer in 0.5 M sulfuric acid solution at 50 mV/s, while keeping the electrode potential range from −0.2–0.85 V (for aniline and 2-hydroxyaniline) and −0.2–1.1 V (for the copolymer). The resulted CVs are shown in Figure 10.
The cyclic voltammograms (CVs) in Figure 10a display the growth of polyaniline film during the electrolysis of 20 mM aniline in 0.5 M sulfuric acid solution. There were three anodic peaks at 0.2 V, 0.48 V, and 0.79 V, while three cathodic peaks at 0.6 V, 0.39 V, and 0.0 V were observed. The peak currents increase constantly with the increase in the number of potential cycles. This indicates that as the electrolysis proceeds, the film of polyaniline grows more rapidly. After electrolysis, a green film of polyaniline was formed on the working electrode.
Figure 10b shows the cyclic voltammograms for electrolysis of 2 mM 2-hydroxyaniline in 0.5 M H2SO4 solution. Two anodic peaks can be observed, one at 0.64 V, which is attributed to the oxidation of a hydroxyl group in the phenyl ring, and the other at 0.77 V, which is due to the oxidation of an amino group in the phenyl ring of 2-hydroxyaniline. Oxidation currents at 0.64 V and 0.77 V decrease quickly with increase in the number of potential cycles, while a peak at 0.13 V developed, which is attributable to the oxidation of poly (2-hydroxyaniline). After 25 potential cycles, a thin golden film of poly (2-hydroxyaniline) was obtained on the working electrode. The slenderness of the film is due to the inhibited growth during the electrolysis, owing to the low conductance of poly (2-hydroxyaniline) [21].
Cyclic voltammograms for electrolysis of the solution containing a mixture of 2 mM 2-hydroxyaniline and 20 mM aniline in 0.5 M H2SO4 is given in Figure 10c. There are three anodic peaks and four cathodic peaks on the curves—i.e., changed from the curves in Figure 10a,b. The anodic peak at 0.66 V in Figure 10c is due to the oxidation of 2-hydroxyaniline, compared with that in Figure 10b. The formation of the three cathodic peaks indicates the formation of PACHA [21]. The oxidation peak at 0.24 V and reduction peak at 0.28 V and 0.5 V occurs on the cyclic voltammogram. This extra pair of redox peaks in Figure 10c is neither from the redox of 2-hydroxyaniline nor the polyaniline film, but rather is caused by the copolymer itself. Finally, a deep yellow film was formed on the working electrode. The fabricated electrodes were then used to check out their electrochemical behavior towards H2O2 oxidation.

4. Conclusions

In conclusion, PACHA- and PANI-coated electrodes were successfully applied for the detection and determination of H2O2. The PACHA and PANI films can effectively support electron transfer, which makes them show a high electrochemical response towards H2O2. The fabricated electrodes show good sensitivity of 650 A/Mcm2 (in the case of PACHA) and 464 A/Mcm2 (in the case of PANI). Moreover, the LOD calculated from the calibration curve (CV current response to H2O2 concentration) was as low 1 × 10⁻⁷ M, in the case of PACHA-coated electrodes, and 1.15 × 10⁻⁷ M in the case of PANI-coated electrodes. Considering the advantages, like good electrochemical behaviour, high sensitivity, good stability, and reproducibility, the materials show pronounced potential for the detection and determination of H2O2. Furthermore, this opens a new doorway for PACHA and PANI to be used in analytical devices. It also offers a way to detect H2O2 in many enzymes-catalyzed reactions, environmental samples, food, and clinical industries.

Supplementary Materials

The following are available online at https://www.mdpi.com/2073-4344/9/8/631/s1. Figure S1. CV of a PACHA-coated electrode in 1.4 × 10⁻⁶ M H2O2 (a) before and (b) after 10 days. Figure S2. Calibration curve of current response of PACHA to H2O2 concentration ranges from 2 × 10⁻⁷ to 1.2 × 10⁻⁶ M. Figure S3. The current response of PACHA ti H2O2 concentration ranging from 2 × 10⁻⁷ to 8 × 10⁻⁷ M.

Author Contributions

A.u.H.A.S. conceptualized and supervised. A.I. performed experimental work. All the authors contributed in writing, editing, and analysis.

Funding

This research was funded by the Higher Education Commission Pakistan (project No. 20-1647 and 20--111/NRPU/R & D/HEC). The APC was funded by the German Research Foundation and the Open Access Publication Funds of the Technische Universität Braunschweig.

Acknowledgments

We acknowledge support from the German Research Foundation and the Open Access Publication Funds of the Technische Universität Braunschweig. S.B. acknowledges support from the Alexander von Humboldt Foundation Germany.

Conflicts of Interest

The authors declare no conflict of interest.

References

  1. Cehoin, M.; Medic, A.; Scheideler, J.; Mielcke, J.; Ried, A.; Ompare, B.K.; Gotvajn, A.Z. Hydrodynamic cavitation in combination with the ozone, hydrogen peroxide and the UV-based advanced oxidation processes for the removal of natural organic matter from drinking water. Ultrason. Sonochem. 2017, 37, 394–404. [Google Scholar] [CrossRef]
  2. Lu, Z.; Chen, G.; Siahrostami, S.; Chen, Z.; Liu, K.; Xie, J.; Liao, L.; Wu, T.; Lin, D.; Liu, Y.; et al. High efficiency oxygen reduction to hydrogen peroxide catalyzed by oxidized carbon material. Nat. Catal. 2018, 1, 240–245. [Google Scholar] [CrossRef]
  3. Sun, Y.; Luo, M.; Meng, X.; Xiang, J.; Wang, L.; Ren, Q.; Guo, S. Graphene/intermetallic PtPb nanoplates composites for boosting electrochemical detection of H2O2 released from cells. Anal. Chem. 2017, 89, 3761–3767. [Google Scholar] [CrossRef] [PubMed]
  4. Ju, J.; Chen, W. In situ growth of surfactant-free gold nanoparticles on nitrogen-doped graphene quantum dots for electrochemical detection of hydrogen peroxide in biological environments. Anal. Chem. 2015, 87, 1903–1910. [Google Scholar] [CrossRef] [PubMed]
  5. Gaschler, M.M.; Stockwell, B.R. Lipid peroxidation in cell death. Biochem. Biophys. Res. Commun. 2017, 482, 419–425. [Google Scholar] [CrossRef] [PubMed]
  6. Rahimifard, M.; Nigjeh, M.N.; Baeeri, M.; Maqbool, F.; Abdollahi, M. Multiple protective mechanisms of alpha-lipoic acid in oxidation, apoptosis and inflammation against hydrogen peroxide induced toxicity in human lymphocytes. Mol. Cell. Biochem. 2015, 403, 179–186. [Google Scholar] [CrossRef] [PubMed]
  7. Zhang, H.; Li, S.; Zhang, F.; Wang, M.; Lin, X.; Li, H. Simultaneous detection of hydroquinone and catechol on electrochemical-activated glassy carbon electrode by simple anodic and cathodic polarization. J. Solid State Electrochem. 2017, 21, 735–745. [Google Scholar] [CrossRef]
  8. Yanga, X.; Kirscha, J.; Olsenb, E.V.; Fergus, J.W.; Simonian, A.L. Anti-fouling pedot: PSS modification on glassy carbon electrodes for continuous monitoring of tricresyl phosphate. Sens. Actuators B 2013, 177, 659–667. [Google Scholar] [CrossRef]
  9. Silva, L.V.; Lopes, C.B.; Silva, W.C.; Paiva, Y.G.; SantosSilva, F.A.; Lima, P.R.; Kubota, L.T.; Goulart, M.O.F. Elevtropolymerization of ferulic acid on multi-walled carbon nanotubes modified glassy carbon electrode as a versatile platform for NADH, dopamine and epinephrine separate detection. Microchem. J. 2017, 133, 460–467. [Google Scholar] [CrossRef]
  10. Sheng, Z.H.; Zheng, X.Q.; Xu, J.Y.; Bao, W.J.; Wang, F.B.; Xia, X.H. Electrochemical sensor based on nitrogen doped graphene: simultaneous determination of ascorbic acid, dopamine and uric acid. Biosens. Bioelectron. 2012, 34, 125–131. [Google Scholar] [CrossRef]
  11. Mu, S. Catechol sensor using poly(aniline-co-o-aminophenol) as an electron transfer mediator. Biosens. Bioelectron. 2006, 21, 1237–1243. [Google Scholar] [CrossRef] [PubMed]
  12. Qin, Q.; Bai, X.; Hua, Z. Electropolymerization of a conductive β-cyclodextrin polymer on reduced graphene oxide modified screen-printed electrode for simultaneous determination of ascorbic acid dopamine and uric acid. J. Electroanal. Chem. 2016, 782, 50–58. [Google Scholar] [CrossRef]
  13. Shah, A.A.; Yasmeen, N.; Rahman, G.; Bilal, S. High electrocatalytic behaviour of Ni impregnated conducting polymer coated platinum and graphite electrodes for electrooxidation of methanol. Electrochim. Acta 2017, 224, 468–474. [Google Scholar] [CrossRef]
  14. Luo, J.; Ma, Q.; Gu, H.; Zhen, Y.; Liu, X. Three-dimensional graphene-polyaniline hybrid hollow spheres by layer-by-layer assembly for application in supercapacitor. Electrochim. Acta 2015, 173, 184–192. [Google Scholar] [CrossRef]
  15. Ullah, H.; Shah, A.A.; Bilal, S.; Ayub, K. DFT study of polyaniline NH3, CO2, and CO gas sensors: Comparison with recent experimental data. J. Phys. Chem. C 2013, 117, 23701–23711. [Google Scholar] [CrossRef]
  16. Debnath, S.; Ballav, N.; Nyoni, H.; Maity, A.; Pillay, K. Optimization and mechanism elucidation of the catalytic photo-degradation of the dyes eosin yellow (EY) and naphthol blue black (NBB) by a polyaniline-coated titanium dioxide nanocomposite. Appl. Catal. B 2015, 163, 330–342. [Google Scholar] [CrossRef]
  17. Ullah, R.; Bilal, S.; Ali, K.; Shah, A.A. Synthesis and characterization of polyaniline doped with Cu II chloride by inverse emulsion polymerization. Synth. Met. 2014, 198, 113–117. [Google Scholar] [CrossRef]
  18. Shah, A.A.; Yasmeen, N.; Rahman, G.; Mehmood, M.; Bilal, S. Electrooxidation of methanol at PANI/POAP bilayered structure modified platinum and graphite electrode. Electrochim. Acta 2016, 188, 367–377. [Google Scholar] [CrossRef]
  19. Chasta, H.R.; Goyal, R.N. Molecularly imprinted sensor based on o-aminophenol for the selective determination of norepinephrine in pharmaceutical and biological samples. Talanta 2014, 125, 167–173. [Google Scholar] [CrossRef]
  20. Shah, A.A.; Holze, R. Spectroelectrochemistry of aniline-o-aminophenol copolymers. Electrochim. Acta 2006, 52, 1374–1382. [Google Scholar] [CrossRef]
  21. Mu, S. Electrochemical copolymerization of aniline and o-aminophenol. Synth. Met. 2004, 143, 259–268. [Google Scholar] [CrossRef]
  22. Wang, M.; Wang, X.; Chen, M.; Yang, Z.; Dong, C. Nanostructured electrocatalytic materials and porous electrodes for direct methanol fuel cells. Chin. J. Catal. 2016, 37, 1037–1048. [Google Scholar] [CrossRef]
  23. Mascaro, L.H.; Berton, A.N.; Micaroni, L. Electrochemical synthesis of polyaniline/poly-o-aminophenol copolymers in chloride medium. Int. J. Electrochem. 2011, 2011, 1–8. [Google Scholar] [CrossRef]
  24. Yang, Y.; Mu, S. Poly(aniline-co-o-aminophenol): In situ Electrochemical–ESR Measurements in Aqueous Solutions and as a Probe of Radical Scavengers. J. Phys. Chem. C 2011, 115, 18721–18728. [Google Scholar] [CrossRef]
  25. Mu, S.; Chen, C. Electron Spin Resonance Spectroscopic Studies on the Radical Scavenging Capacities of Catechin and Pyrogallol. J. Phys. Chem. C 2012, 116, 3065–3070. [Google Scholar] [CrossRef]
  26. Poly, S.M. (aniline-co-o-aminophenol) nanostructured network: Electrochemical controllable synthesis and electrocatalysis. Electrochim. Acta 2006, 51, 3434–3440. [Google Scholar] [CrossRef]
  27. Chen, C.; Sun, C.; Gao, Y. Amperometric sensor for hydrogen peroxide based on poly(aniline-co-p-aminophenol). Electrochem. Commun. 2009, 11, 450–453. [Google Scholar] [CrossRef]
  28. Kim, H.; Choi, S.; Oh, S.; Woo, J.; Kim, I.K. Horseradish peroxidase immobilized on poly(thiophene-2-aminophenol-3-thiopheneacetic acid) film electrode with au nanoparticle-fabrication and evaluation as hydrogen peroxide sensor. J. Nanosci. Nanotechnol. 2008, 8, 4962–4967. [Google Scholar] [CrossRef]
  29. Yang, Y.; Mu, S. Determination of hydrogen peroxide using amperometric sensor of polyaniline doped with ferrocenesulfonic acid. Biosens. Bioelectron. 2005, 21, 74–78. [Google Scholar] [CrossRef]
  30. Shrivastava, A.; Gupta, V.B. Methods for the determination of limit of detection and limit and quantification of the analytical methods. Chron. Young Sci. 2011, 2, 21–25. [Google Scholar] [CrossRef]
  31. Žabčíková, S.; Mikysek, T.L.L.Č.; Sýs, M. Electrochemical study and determination of all-trans-retinol at carbon paste electrode modified by a surfactant. Food. Technol. Biotechnol. 2018, 56, 337–343. [Google Scholar] [CrossRef] [PubMed]
  32. Guerreiro, G.V.; Zaitouna, A.J.; Lai, R.Y. Characterization of an electrochemical mercury sensor using alternating current, cyclic, square wave and differential pulse voltammetry. Anal. Chim. Acta 2014, 810, 79–85. [Google Scholar] [CrossRef] [PubMed]
  33. Levar, C.E.; Chan, C.H.; Mehta-Kolte, M.G.; Bond, D.R. An inner membrane cytochrome required only for reduction of high redox potential extracellular electron acceptors. ASM 2014, 5, 1–9. [Google Scholar] [CrossRef] [PubMed]
  34. Yusoff, N.; Rameshkumar, P.; Mehmood, M.S.; Pandikumar, A.; Wah, L.H.; Ming, H.N. Ternary nanohybrid of reduced graphene oxide- nafion@silver nanoparticles for boosting the sensor performance in non-enzymatic amperometric detection of hydrogen peroxide. Biosens. Bioelectron. 2017, 87, 1020–1028. [Google Scholar] [CrossRef] [PubMed]
  35. Ensafi, A.A.; Rezaloo, F.; Rezaei, B. Electrochemical sensor based on porous silicon/silver nanocomposite for the determination of hydrogen peroxide. Sens. Actuators B 2016, 231, 239–244. [Google Scholar] [CrossRef]
  36. Zhang, R.; Chen, W. Recent advances in graphene-based nanomaterials for fabricating electrochemical hydrogen peroxide sensors. Biosens. Bioelectron. 2017, 89, 249–268. [Google Scholar] [CrossRef] [PubMed]
  37. Amiri, M.; Nouhi, S.; Azizian-Kalandaragh, Y. Facilesynthesis of silver nanostructures by using various deposition potential and time: A nonenzymetic sensor for hydrogen peroxide. Mater. Chem. Phys. 2015, 155, 129–135. [Google Scholar] [CrossRef]
  38. Ahmad, K.; Mohammad, A.; Mobin, S.M. Hydrothermally grown α-MnO2 nanorods as highly efficient low cost counter-electrode material for dye-sensitized solar cells and electrochemical sensing applications. Electrochim. Acta 2017, 252, 549–557. [Google Scholar] [CrossRef]
  39. Wang, Y.; Wang, Z.; Rui, Y.; Li, M. Horseradish peroxidase immobilization on carbon nanodots/CoFe layered double hydroxides: Direct electrochemistry and hydrogen peroxide sensing. Biosens. Bioelectron. 2015, 64, 57–62. [Google Scholar] [CrossRef]
  40. Chen, D.; Wang, G.; Lua, W.; Zhang, H.; Li, J.H. Photoelectrochemical study of organic–inorganic hybrid thin films via electrostatic layer-by-layer assembly. Electrochem. Commun. 2007, 9, 2151–2156. [Google Scholar] [CrossRef]
  41. Katz, E.; Willner, I. Probing biomolecular interactions at conductive and semiconductive surfaces by impedance spectroscopy: routes to impedimetric immunosensors, DNA-sensors, and enzyme Biosensors. Electroanalysis 2003, 15, 913–947. [Google Scholar] [CrossRef]
  42. Apodaca, D.C.; Pernites, R.B.; Ponnapati, R.; Mundo, F.R.D.; Advincula, R.C. electropolymerized molecularly imprinted polymer film: EIS sensing of bisphenol. Macromolecules 2011, 44, 6669–6682. [Google Scholar] [CrossRef]
  43. Jeng, K.T.; Chian, C.C.; Hsu, N.Y.; Huang, W.M.; Chiou, S.D.; Lin, S.H. Fabrication and impedance studies of DMFC anode incorporated with CNT-supported high-metal-content electrocatalyst. J. Power Sources 2007, 164, 33–41. [Google Scholar] [CrossRef]
Figure 1. Cyclic voltammetry (CV) of (a) bare gold, (b) poly(aniline-co-2-hydroxyaniline) (PACHA)-, (c) polyaniline (PANI)-, and (d) poly (2-hydroxyanilne) (PHA)-coated electrodes in a citrate buffer of pH 5, without (1) and with (2) 1.4 × 10⁻⁶ M H2O2.
Catalysts 09 00631 g001
Figure 2. CV of (a) PACHA (c) PANI at different scan rates in 1.4 × 10⁻⁶ M H2O2; (b,d) the dependence of the anodic peak current on the square root of scan rates.
Catalysts 09 00631 g002
Figure 3. CV of (a) PACHA and (c) PANI at different concentrations of H2O2; (b,d) show the calibration curve of PACHA and PANI with H2O2 concentrations ranging from 2 × 10⁻⁷ to 4 × 10⁻⁶ M.
Catalysts 09 00631 g003
Figure 4. Square wave voltammograms of (a) bare, as well as (b) PACHA-, (c) PANI-, and (d) PHA-coated electrodes in citrate buffer of pH 5, containing 1.4 × 10⁻⁶ M H2O2.
Catalysts 09 00631 g004
Figure 5. Square wave voltammograms of (a) PACHA and (c) PANI at different levels of H2O2 concentration; (b) shows the response curve of PACHA with H2O2 concentration ranges from 2 × 10⁻⁷ to 1.4 × 10⁻⁶ M.
Catalysts 09 00631 g005
Figure 6. Differential pulse voltammograms (DPVs) of (a) bare as well as (b) PACHA-, (c) PANI-, and (d) PHA-coated electrodes in citrate buffer (pH 5) containing 1.4 × 10⁻⁶ M H2O2 solution.
Catalysts 09 00631 g006
Figure 7. DPVs of (a) PACHA and (c) PANI at different H2O2 concentrations; (b) and (d) display the current response of PACHA and PANI, respectively, with H2O2 concentration ranging from 2 × 10⁻⁷–1.2 × 10⁻⁶ M.
Catalysts 09 00631 g007
Figure 8. Nyquist plot of (a) Au, (b) PACHA, (c) PANI, and (d) PHA in citrate buffer (pH 5) and 1.4 × 10⁻⁶ M H2O2 solution.
Catalysts 09 00631 g008
Figure 9. Bode plot for (a) capacitance and (b) phase angle in 1.4 × 10⁻⁶ M H2O2.
Catalysts 09 00631 g009
Figure 10. CV results recorded during the growth of (a) PANI, (b) PHA, and (c) PACHA film.
Catalysts 09 00631 g010
Table 1. Comparison of various characteristics of PANI and PACHA along with the reported data.
Electrode TechniqueDetection PotentialLinearity (M)LOD (M)LOQ (M)Sensitivity A/Mcm2
PACHA–Au, CV0.3 V2 × 10−7–1.4 × 10−61 × 10−73.3 × 10⁻⁷
PANI–Au, CV0.5 V2 × 10−7–1.4 × 10−61.15 × 10−73.8 × 10⁻⁷
PACHA–Au, SWV0.08 V2 × 10−7–1.4 × 10−61.78 × 10−75.6 × 10⁻⁷
PACHA–Au, DPV0.1 V2 × 10−7–1.4 × 10−61 × 10−73.3 × 10−7650
PANI–Au, DPV0.20 V2 × 10−7–1.4 × 10−61 × 10−73.3 × 10−7434
rGO-Nf@Ag6 5.35 × 10⁻⁷ [34]
Silicon/silver nanocomposite 1.65 × 10⁻⁶ –0.5 × 10−30.45 ×10−6 [35]
Au/graphene/HRP/CS 1.7 × 10⁻⁶ [36]
MWCNT–graphene 20 × 10−6–2.1 × 10−39.4 × 10−6 [36]
BGNs 1 × 10⁻³–20 × 10−33.8 × 10−6 [36] 266.7 × 10⁻⁶ [36]
Ag NS/ITO 0.2 × 10⁻³–4 × 10−31 × 10−6 [37]
Graphene–hAuPd 0.1 × 10⁻⁶–20 × 10−6 5.059 [36]
RGO–MWCNT–Pt/Mb 1.99 × 10⁻⁶ [36]

