Co-precipitation Synthesized MnOx-CeO2 Mixed Oxides for NO Oxidation and Enhanced Resistance to Low Concentration of SO2 by Metal Addition


 ,
,
Abstract
:1. Introduction
2. Results and Discussion
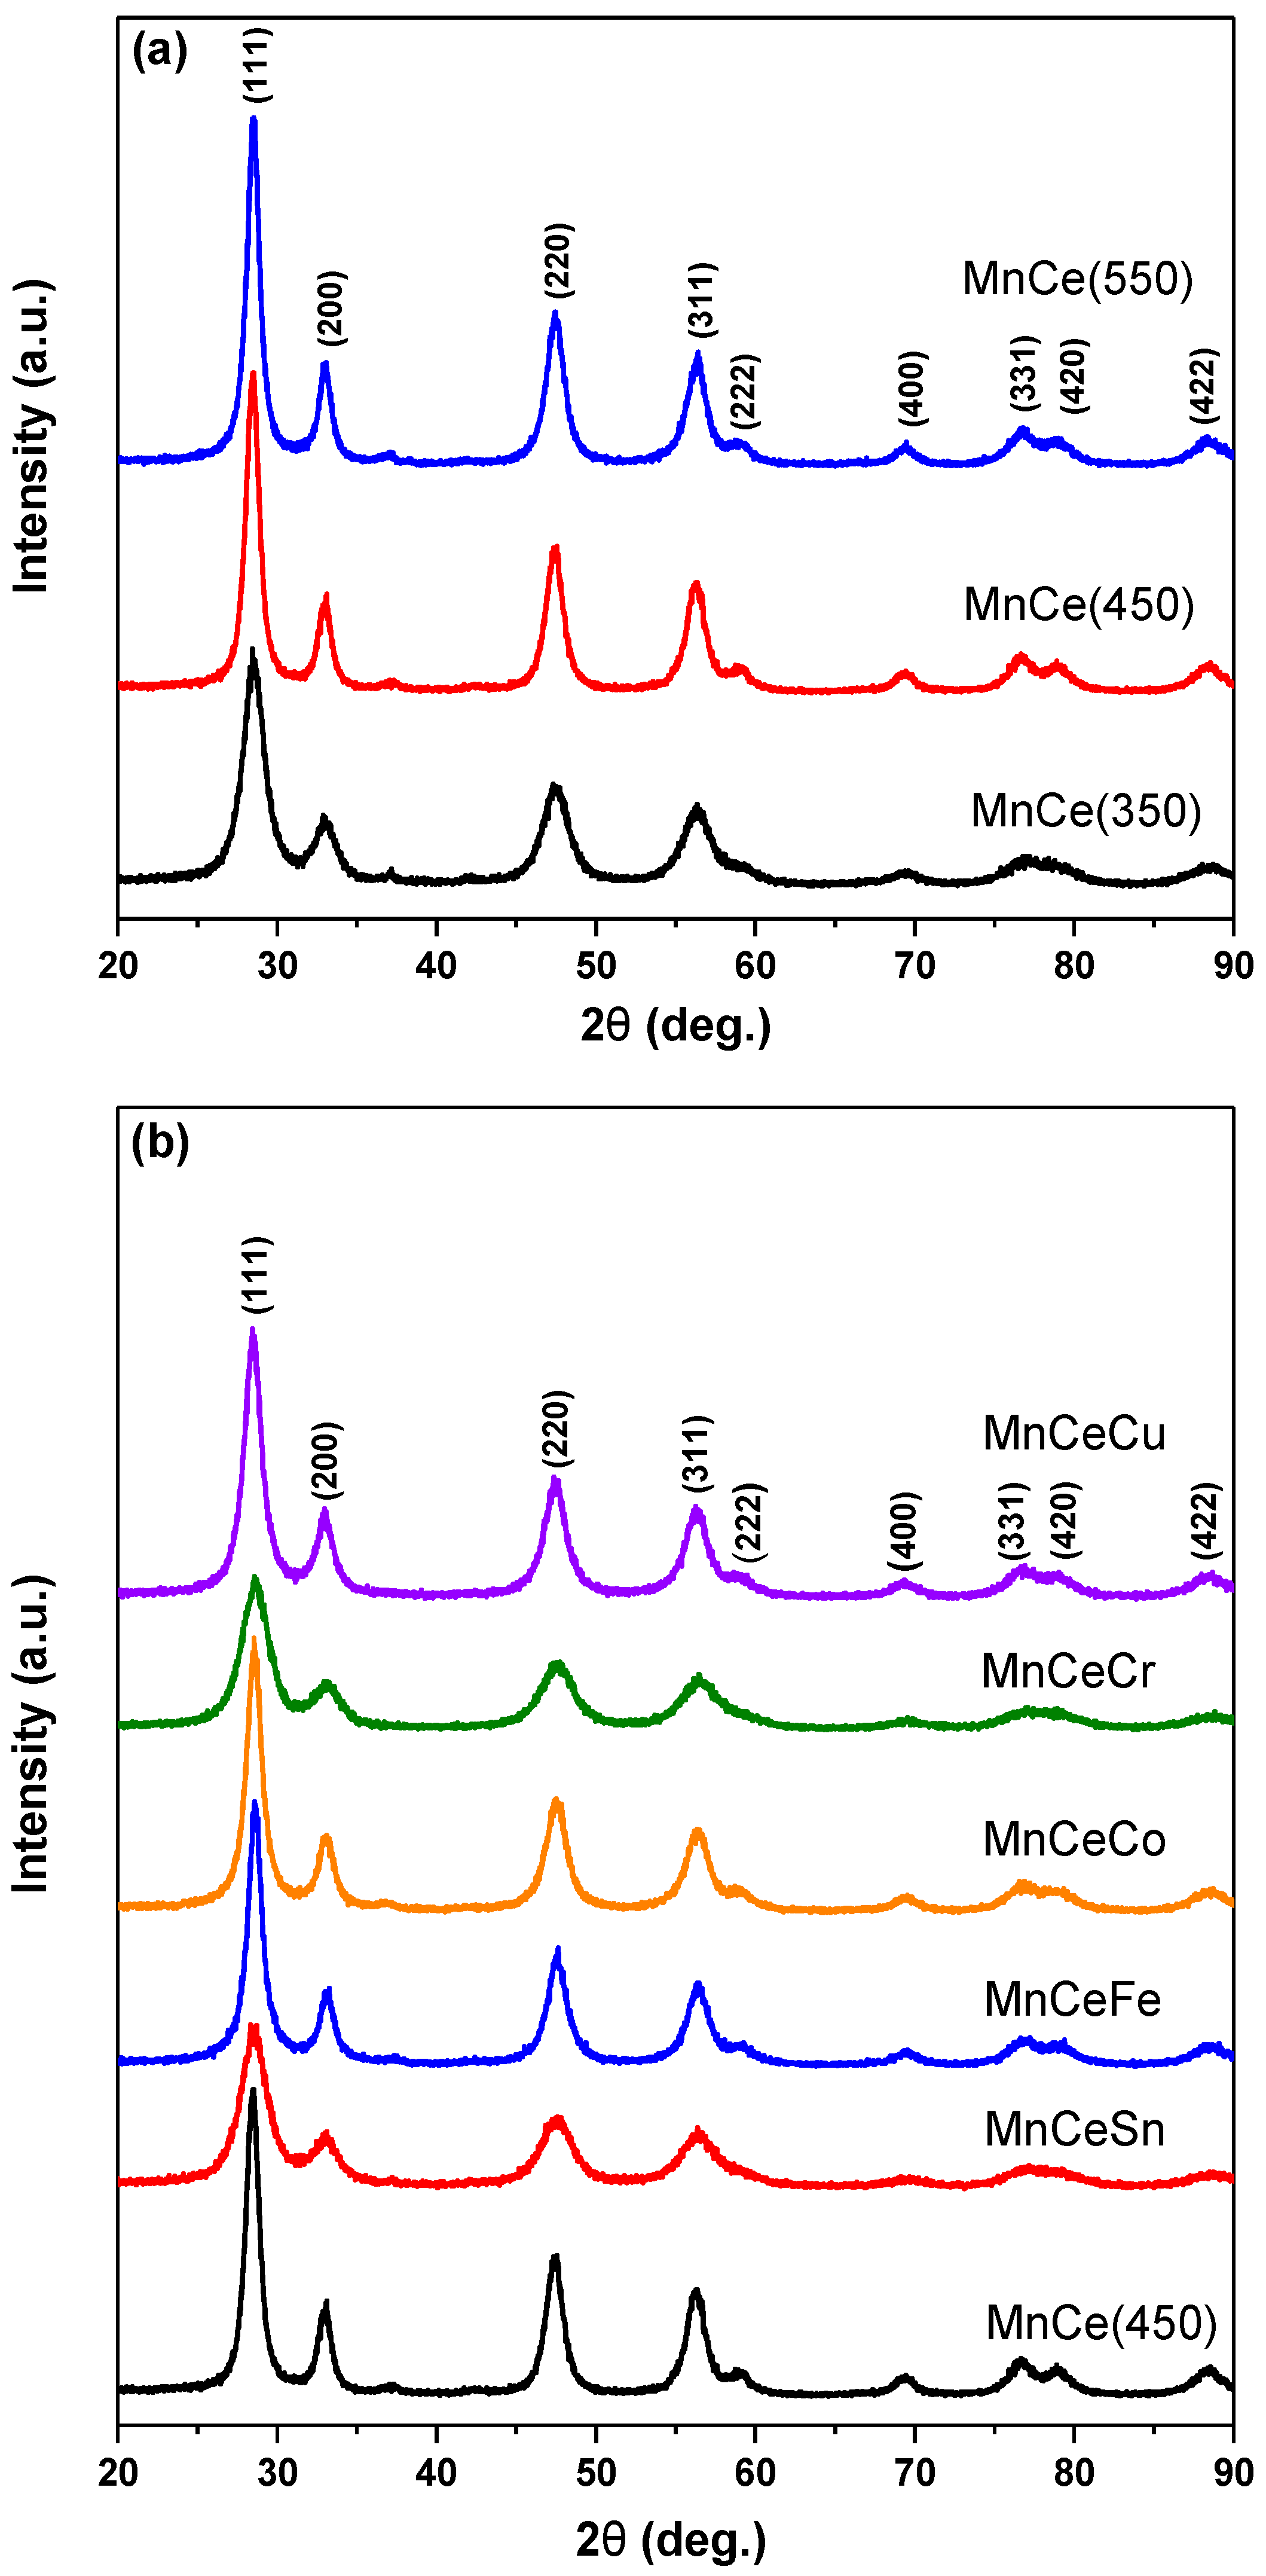
2.1. XRD and BET Results
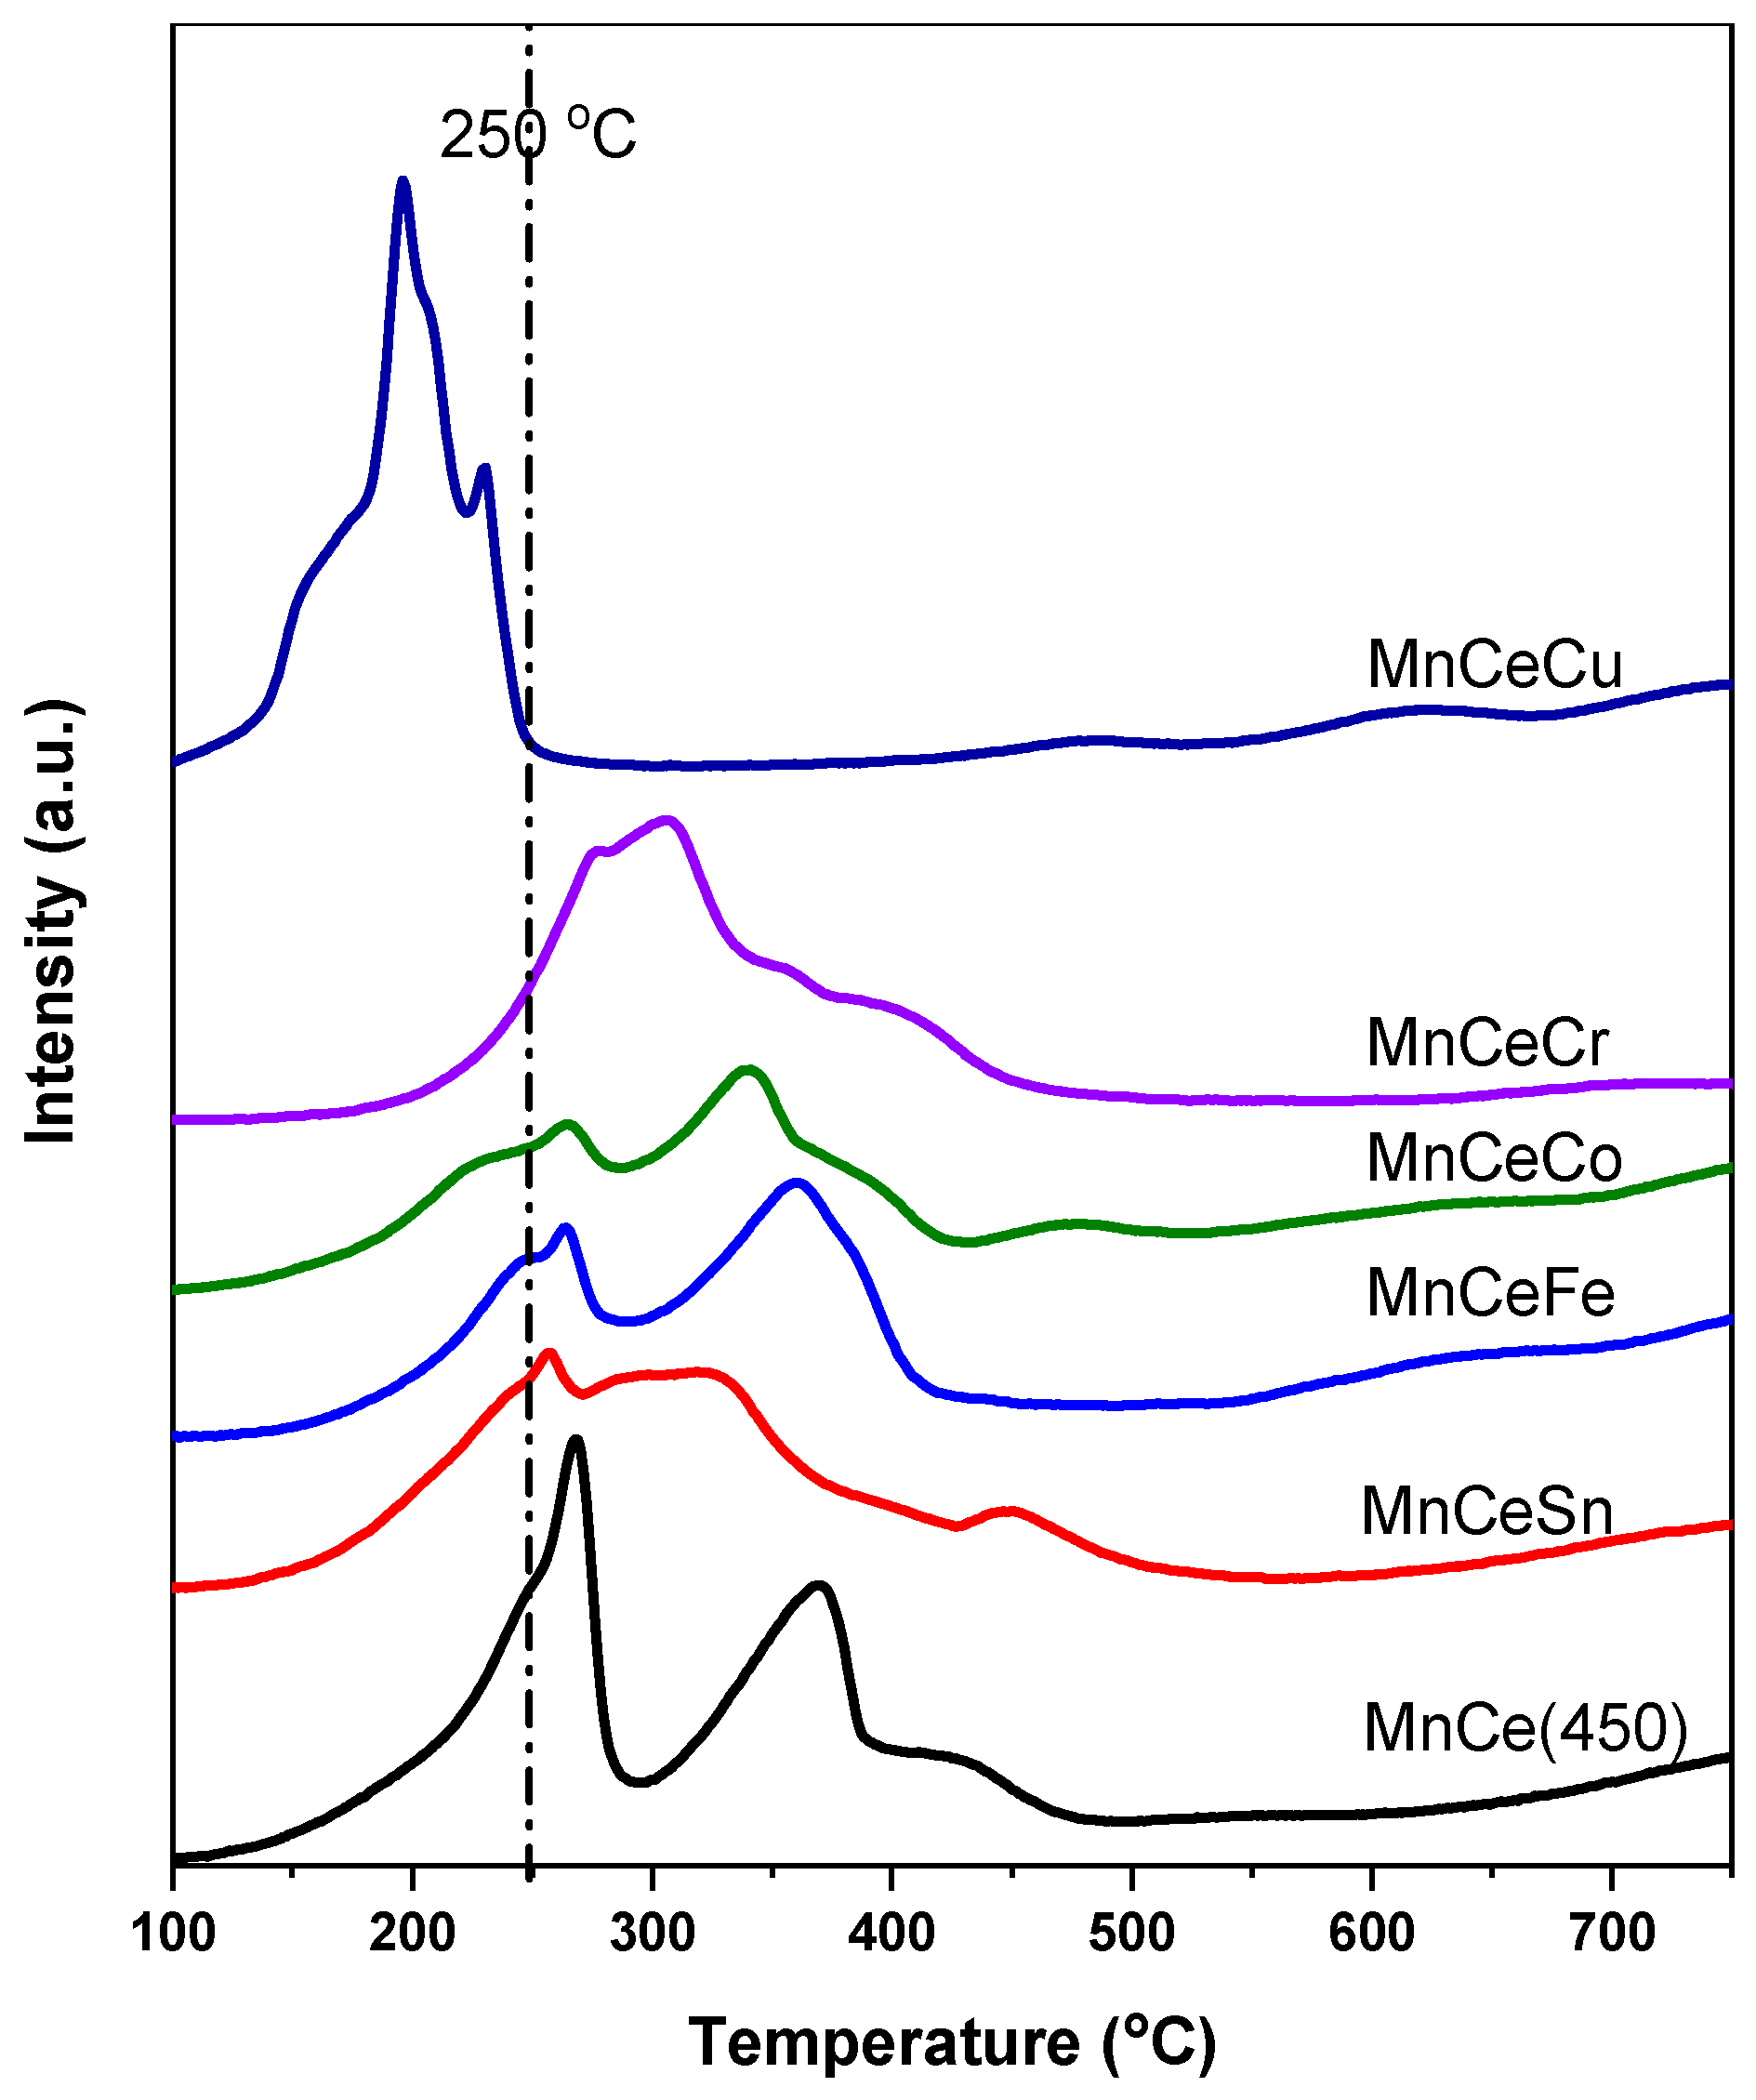
2.2. H2-TPR Measurements
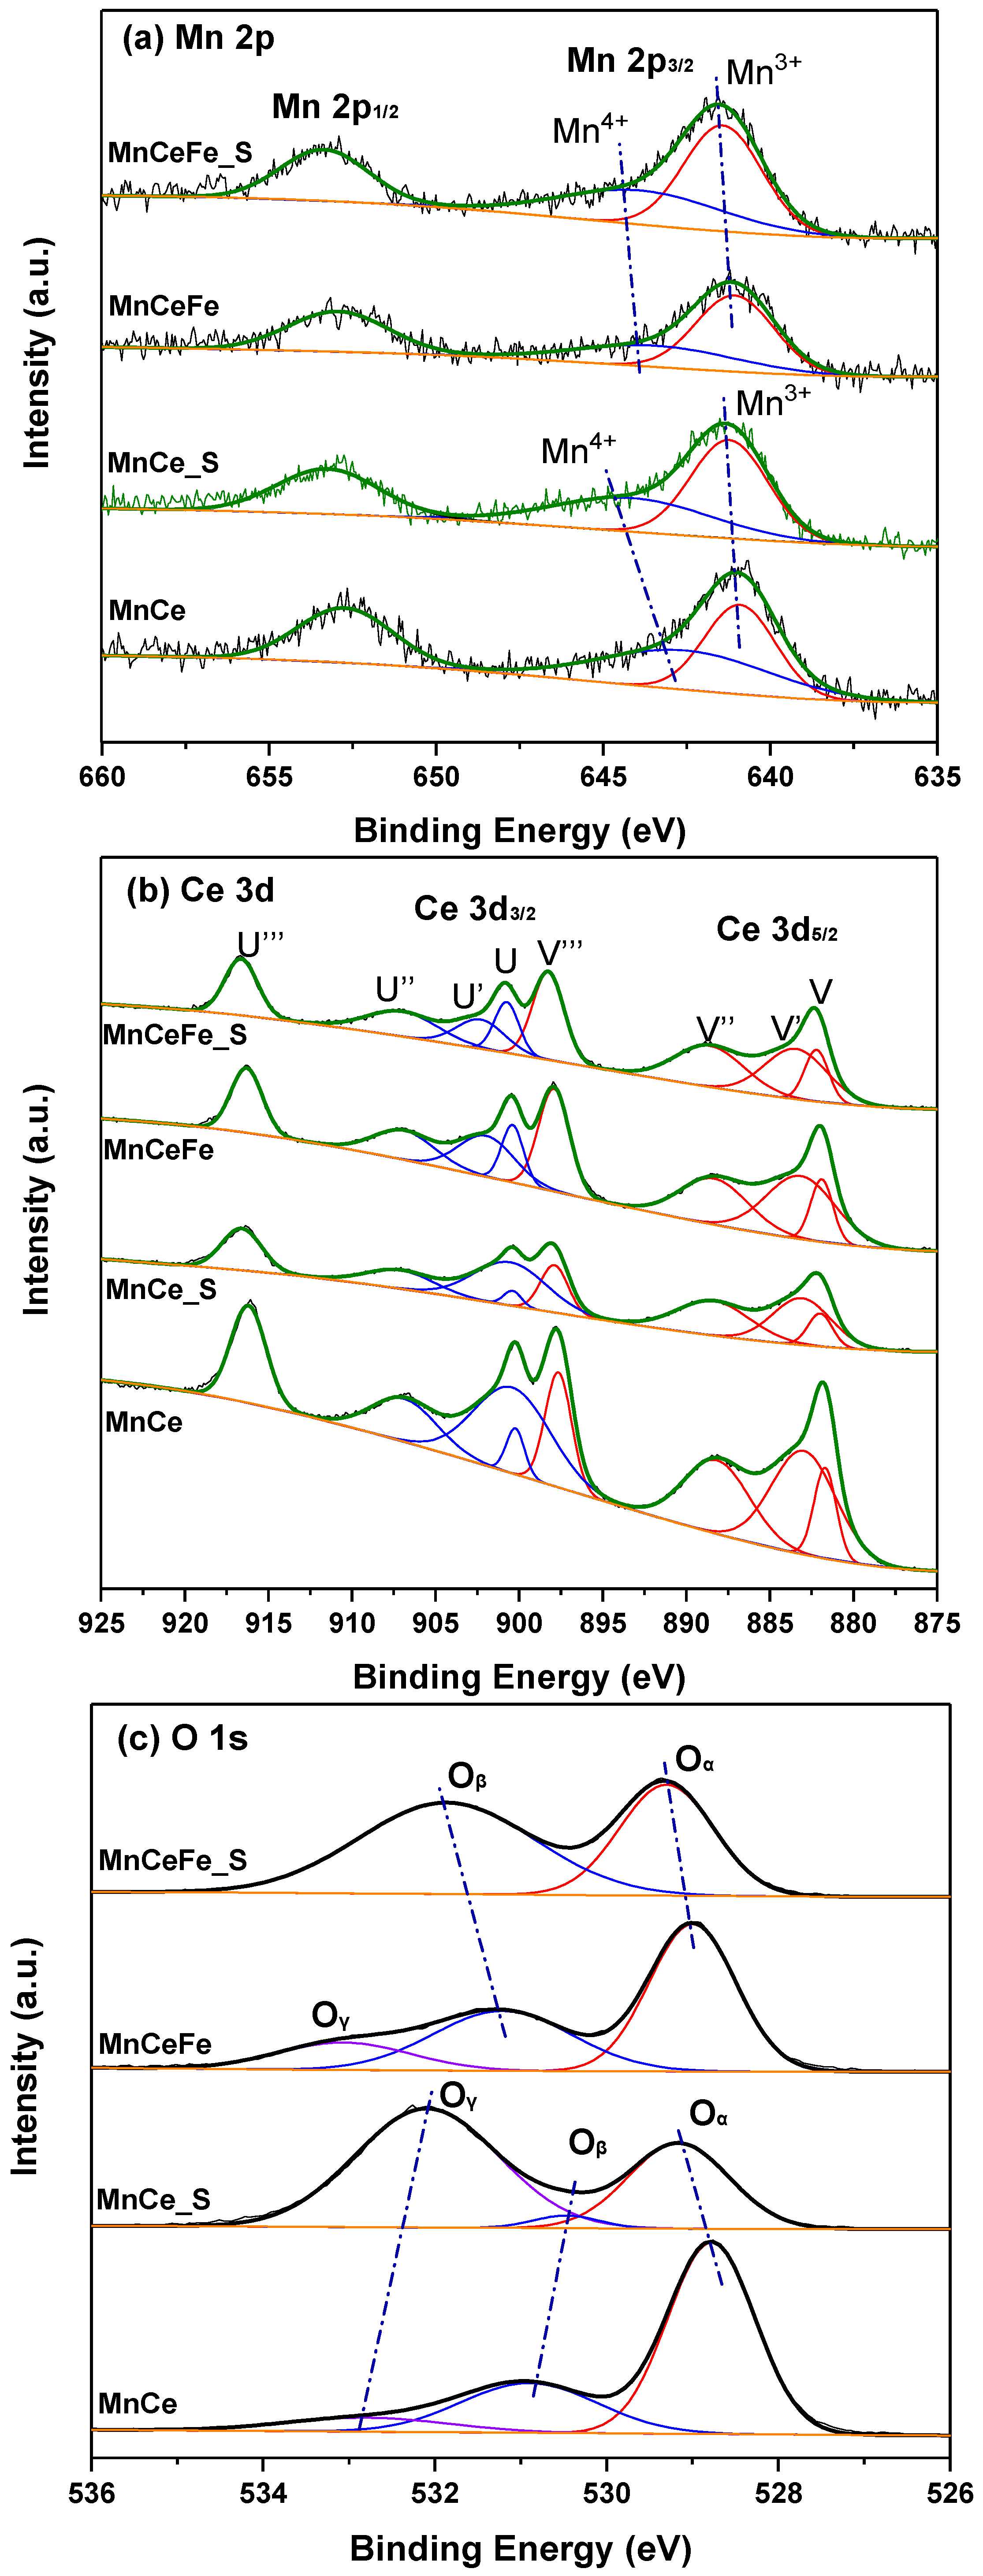
2.3. XPS Analysis
2.4. Catalytic Activity
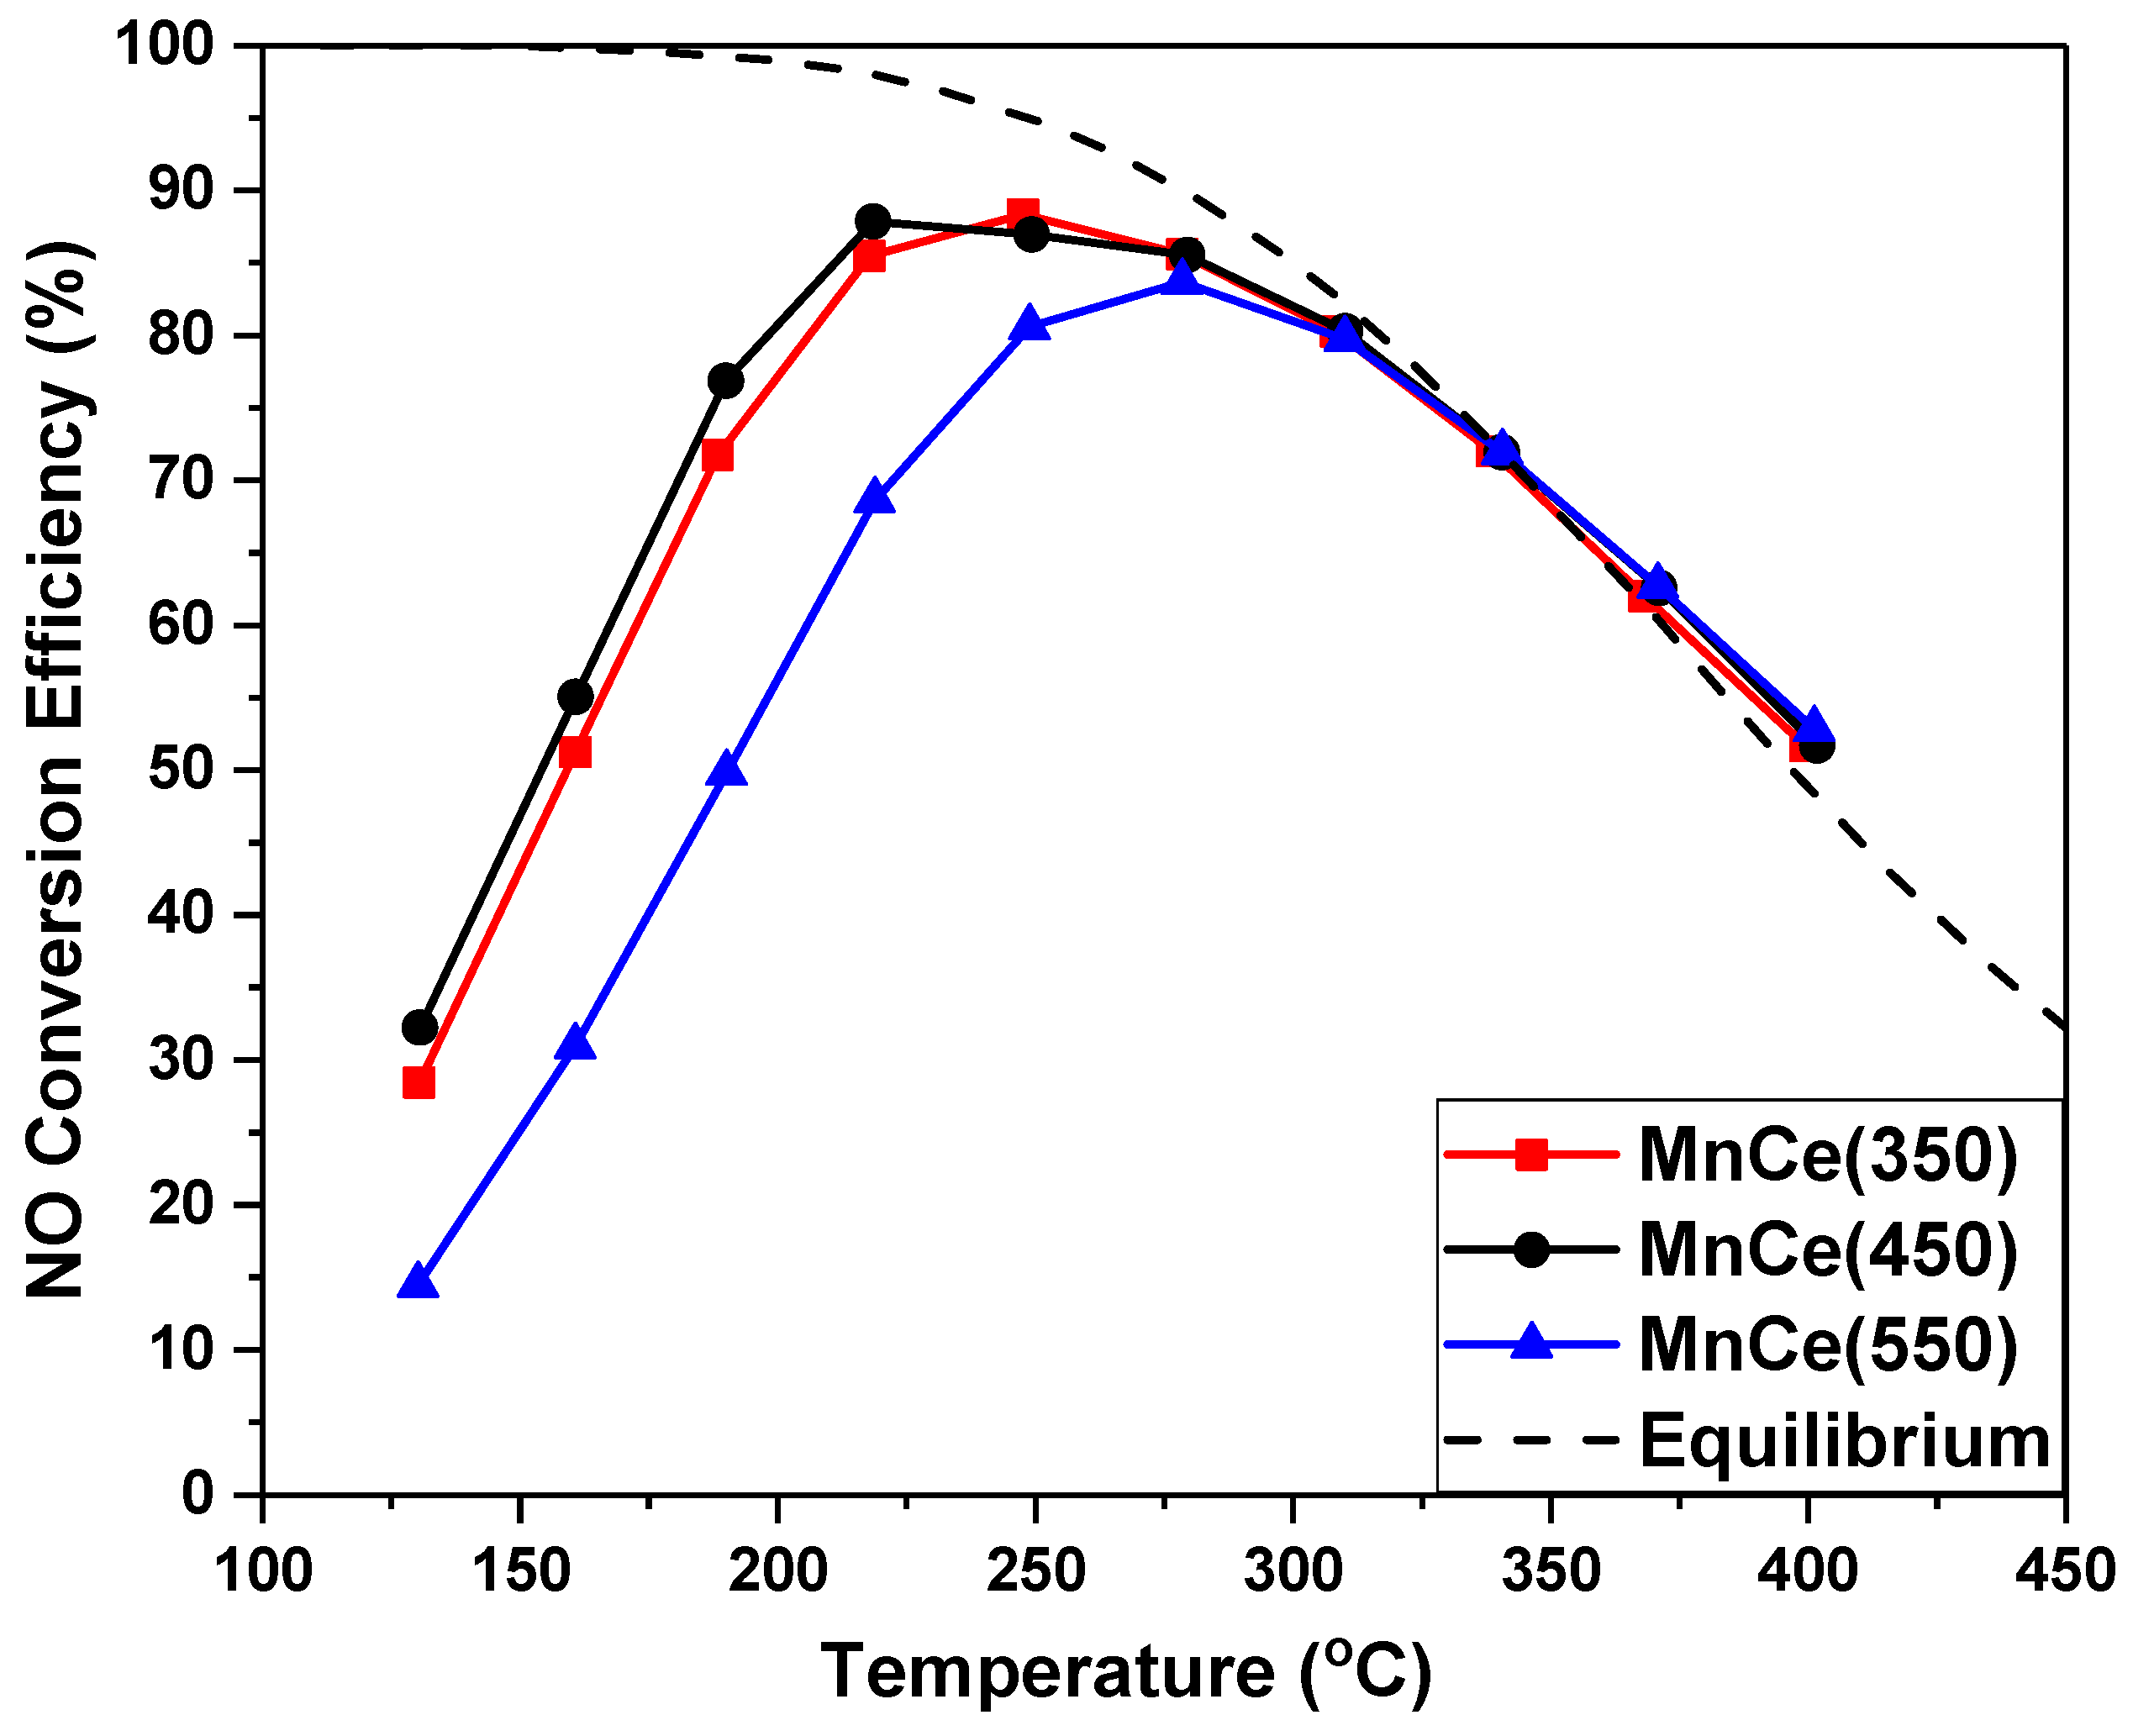
2.4.1. MnOx-CeO2 with Different Calcination Temperature
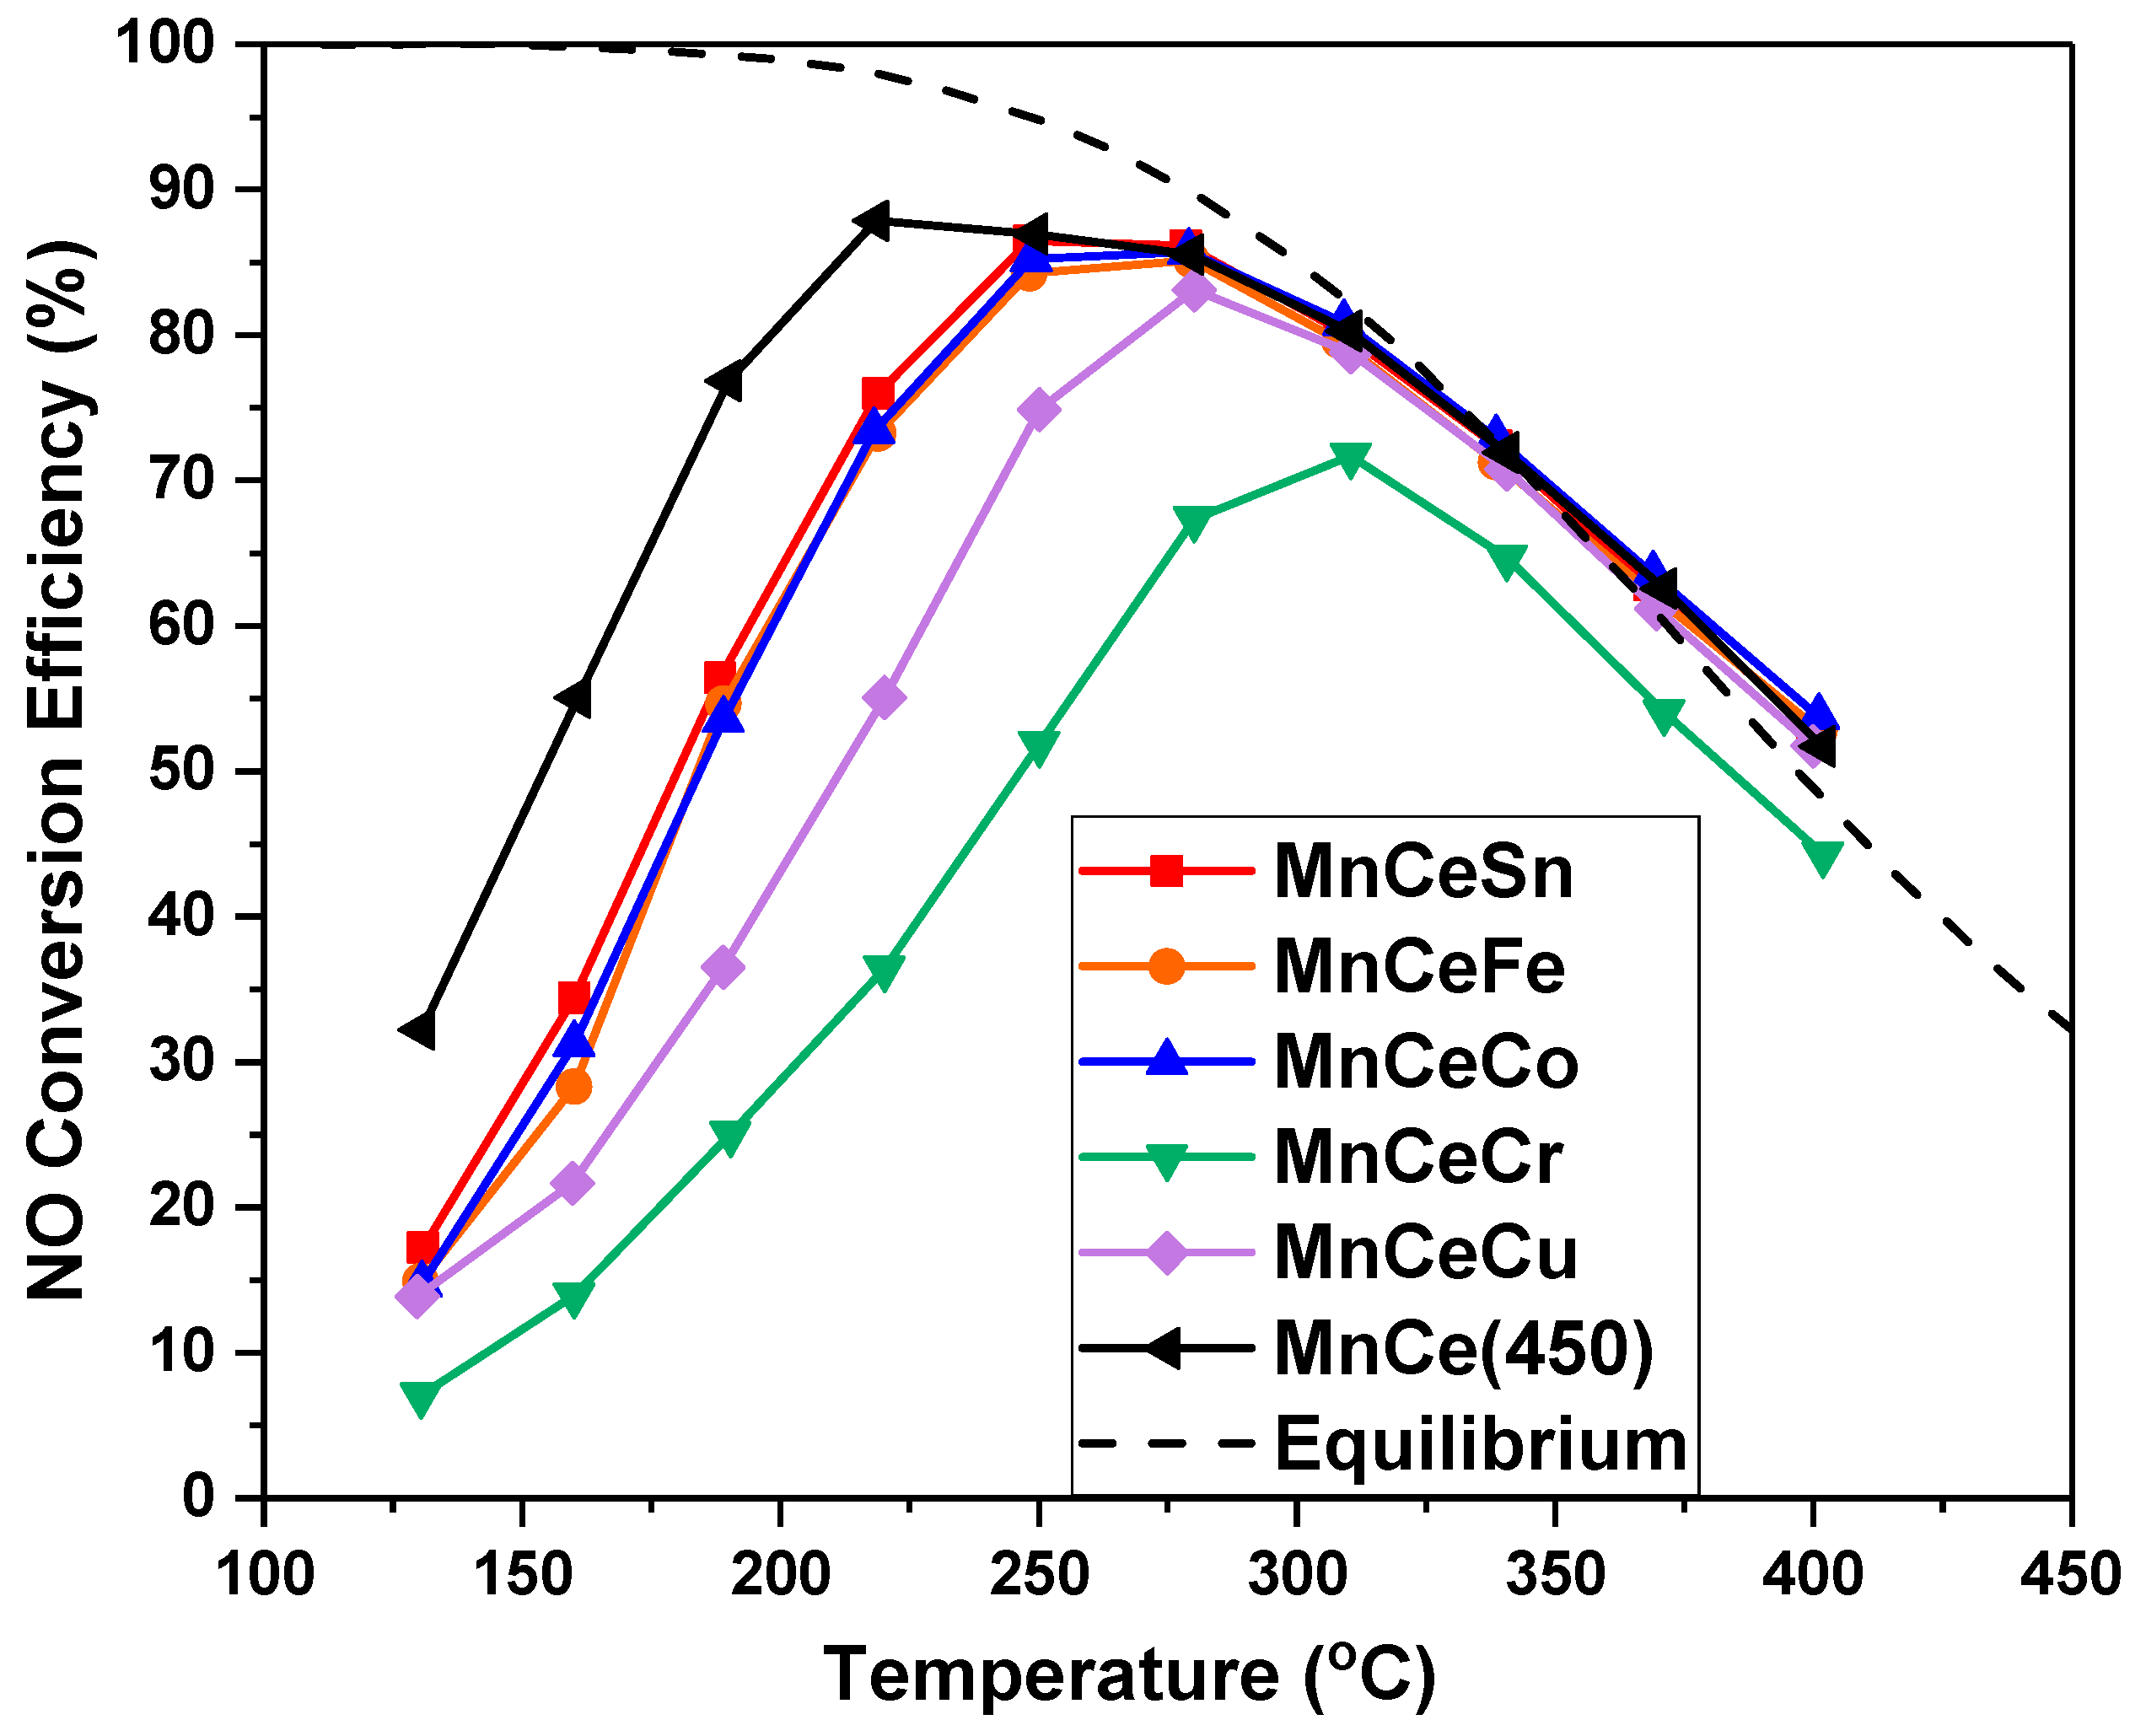
2.4.2. MnOx-CeO2 with Metal Doping
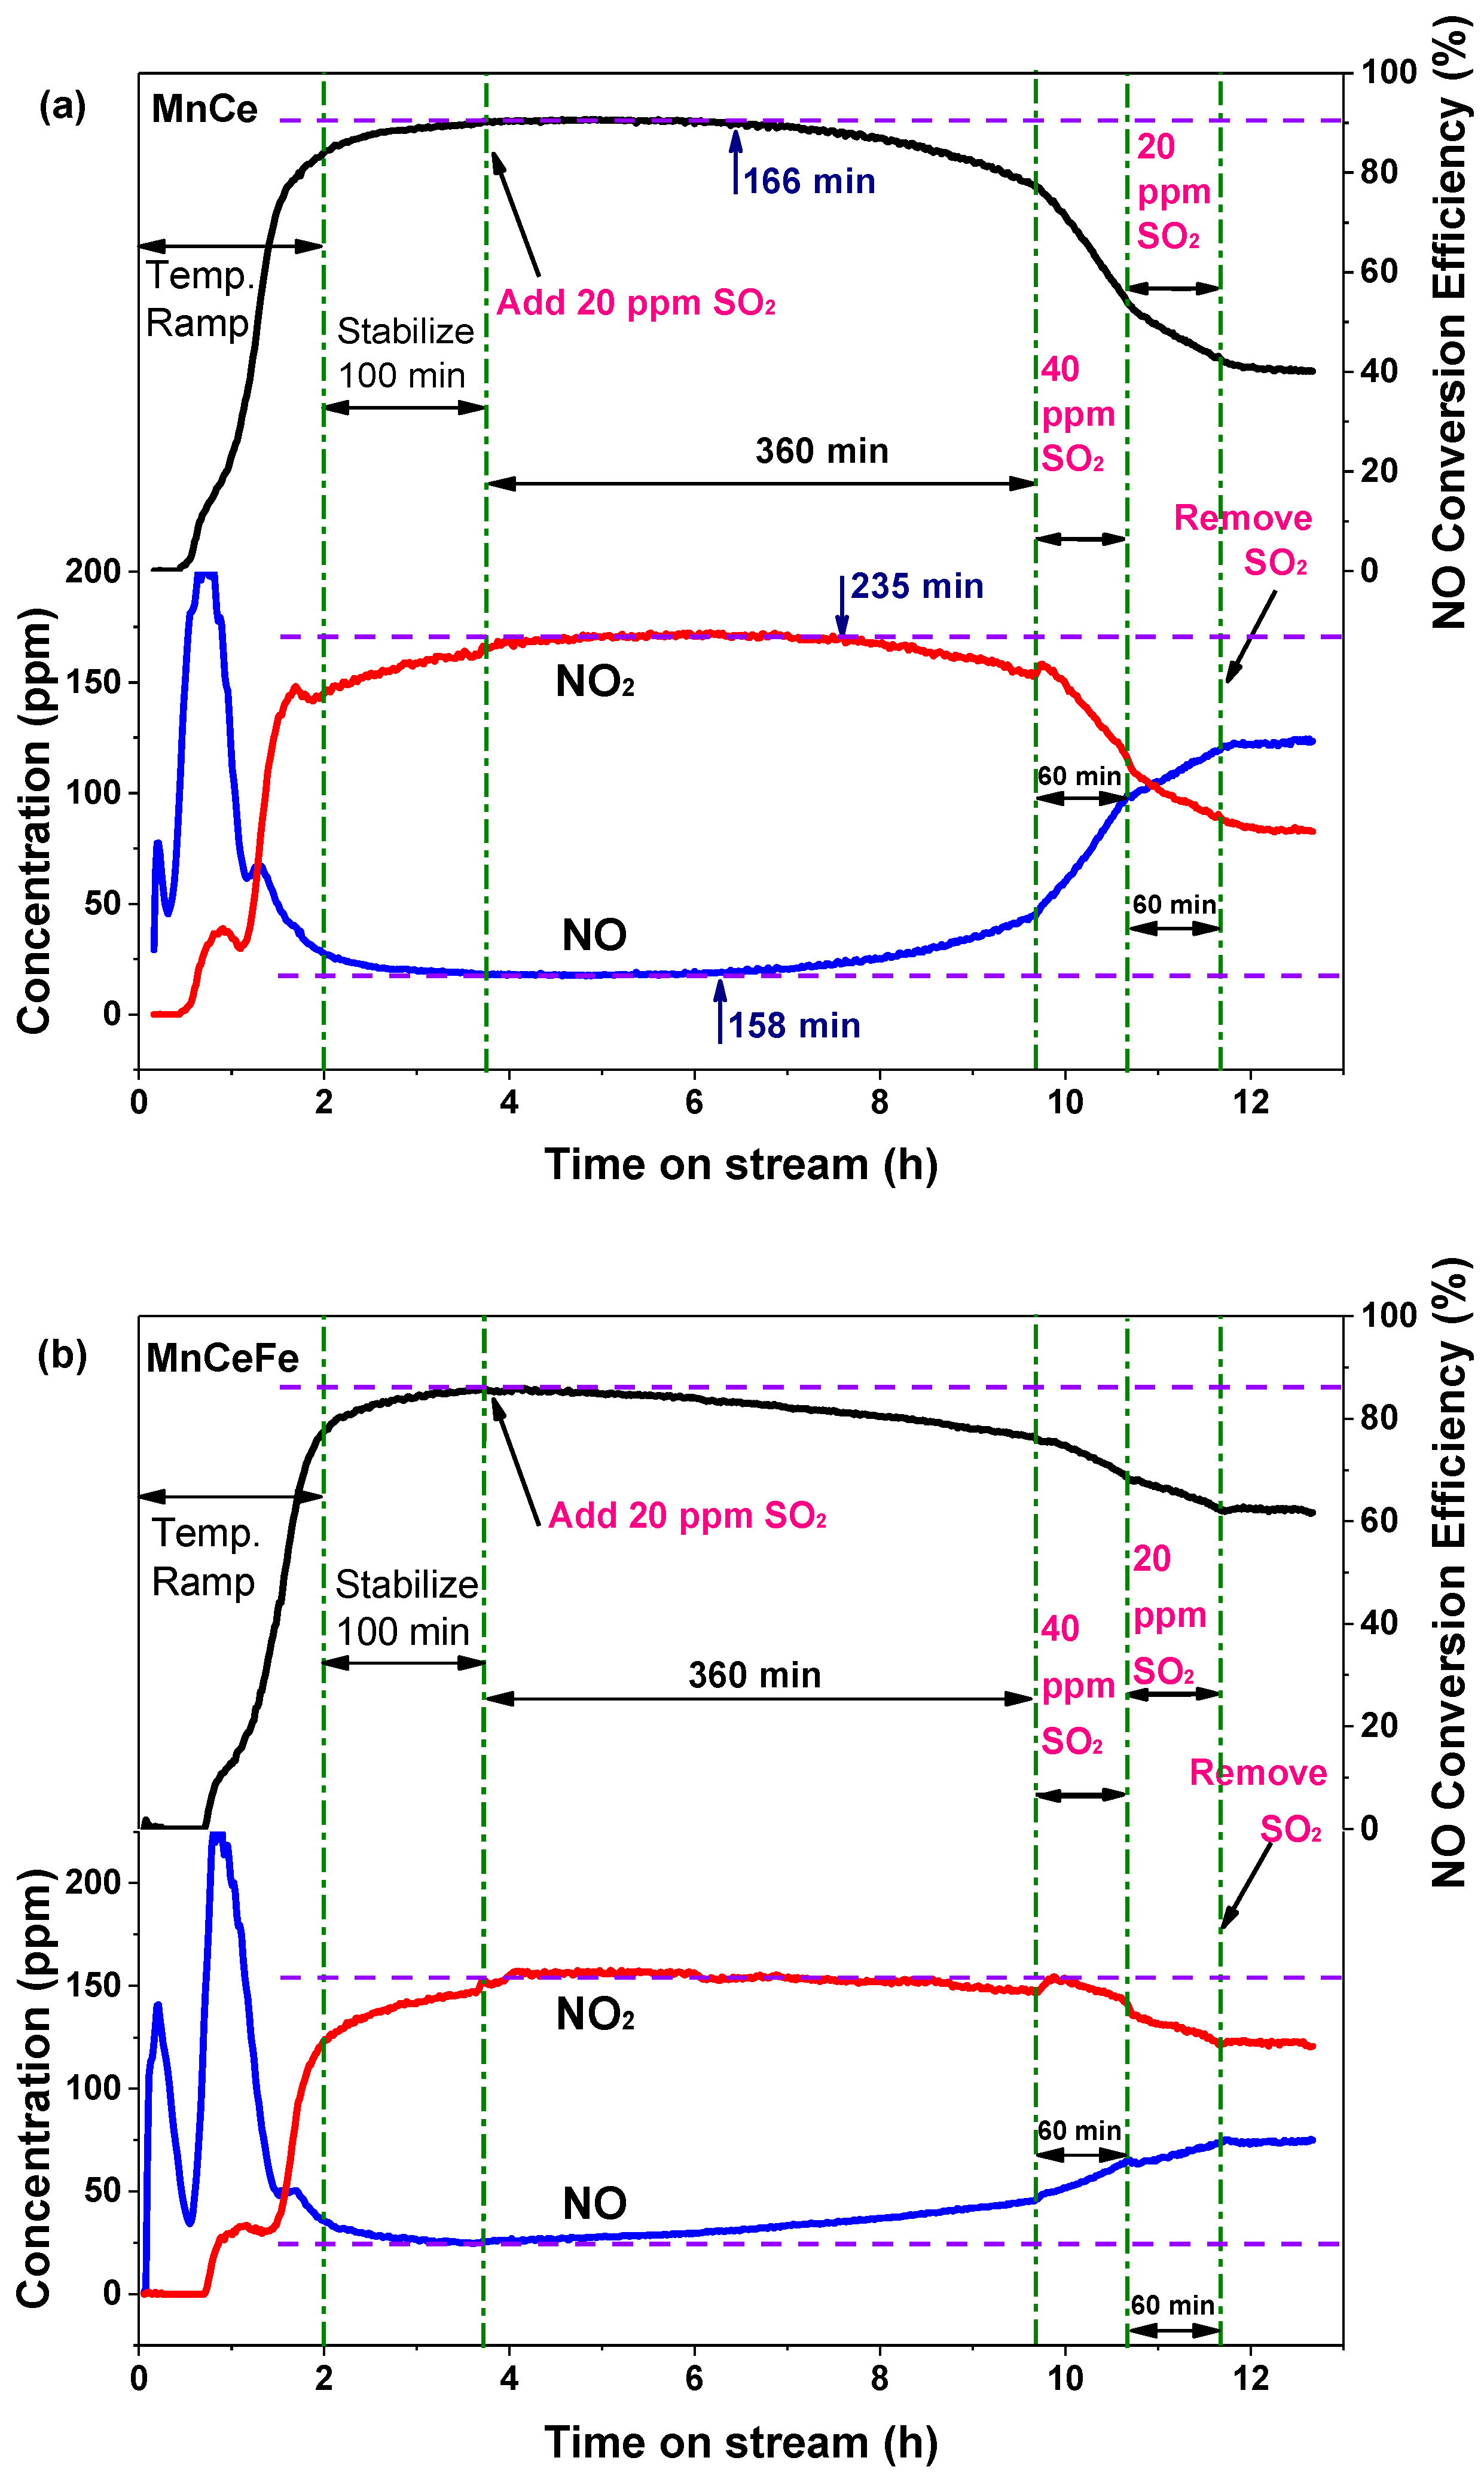
2.5. Catalyst Resistance to SO2
2.5.1. Variation of NO Oxidation with SO2 Addition
2.5.2. Surface Properties after SO2 Poisoning Process
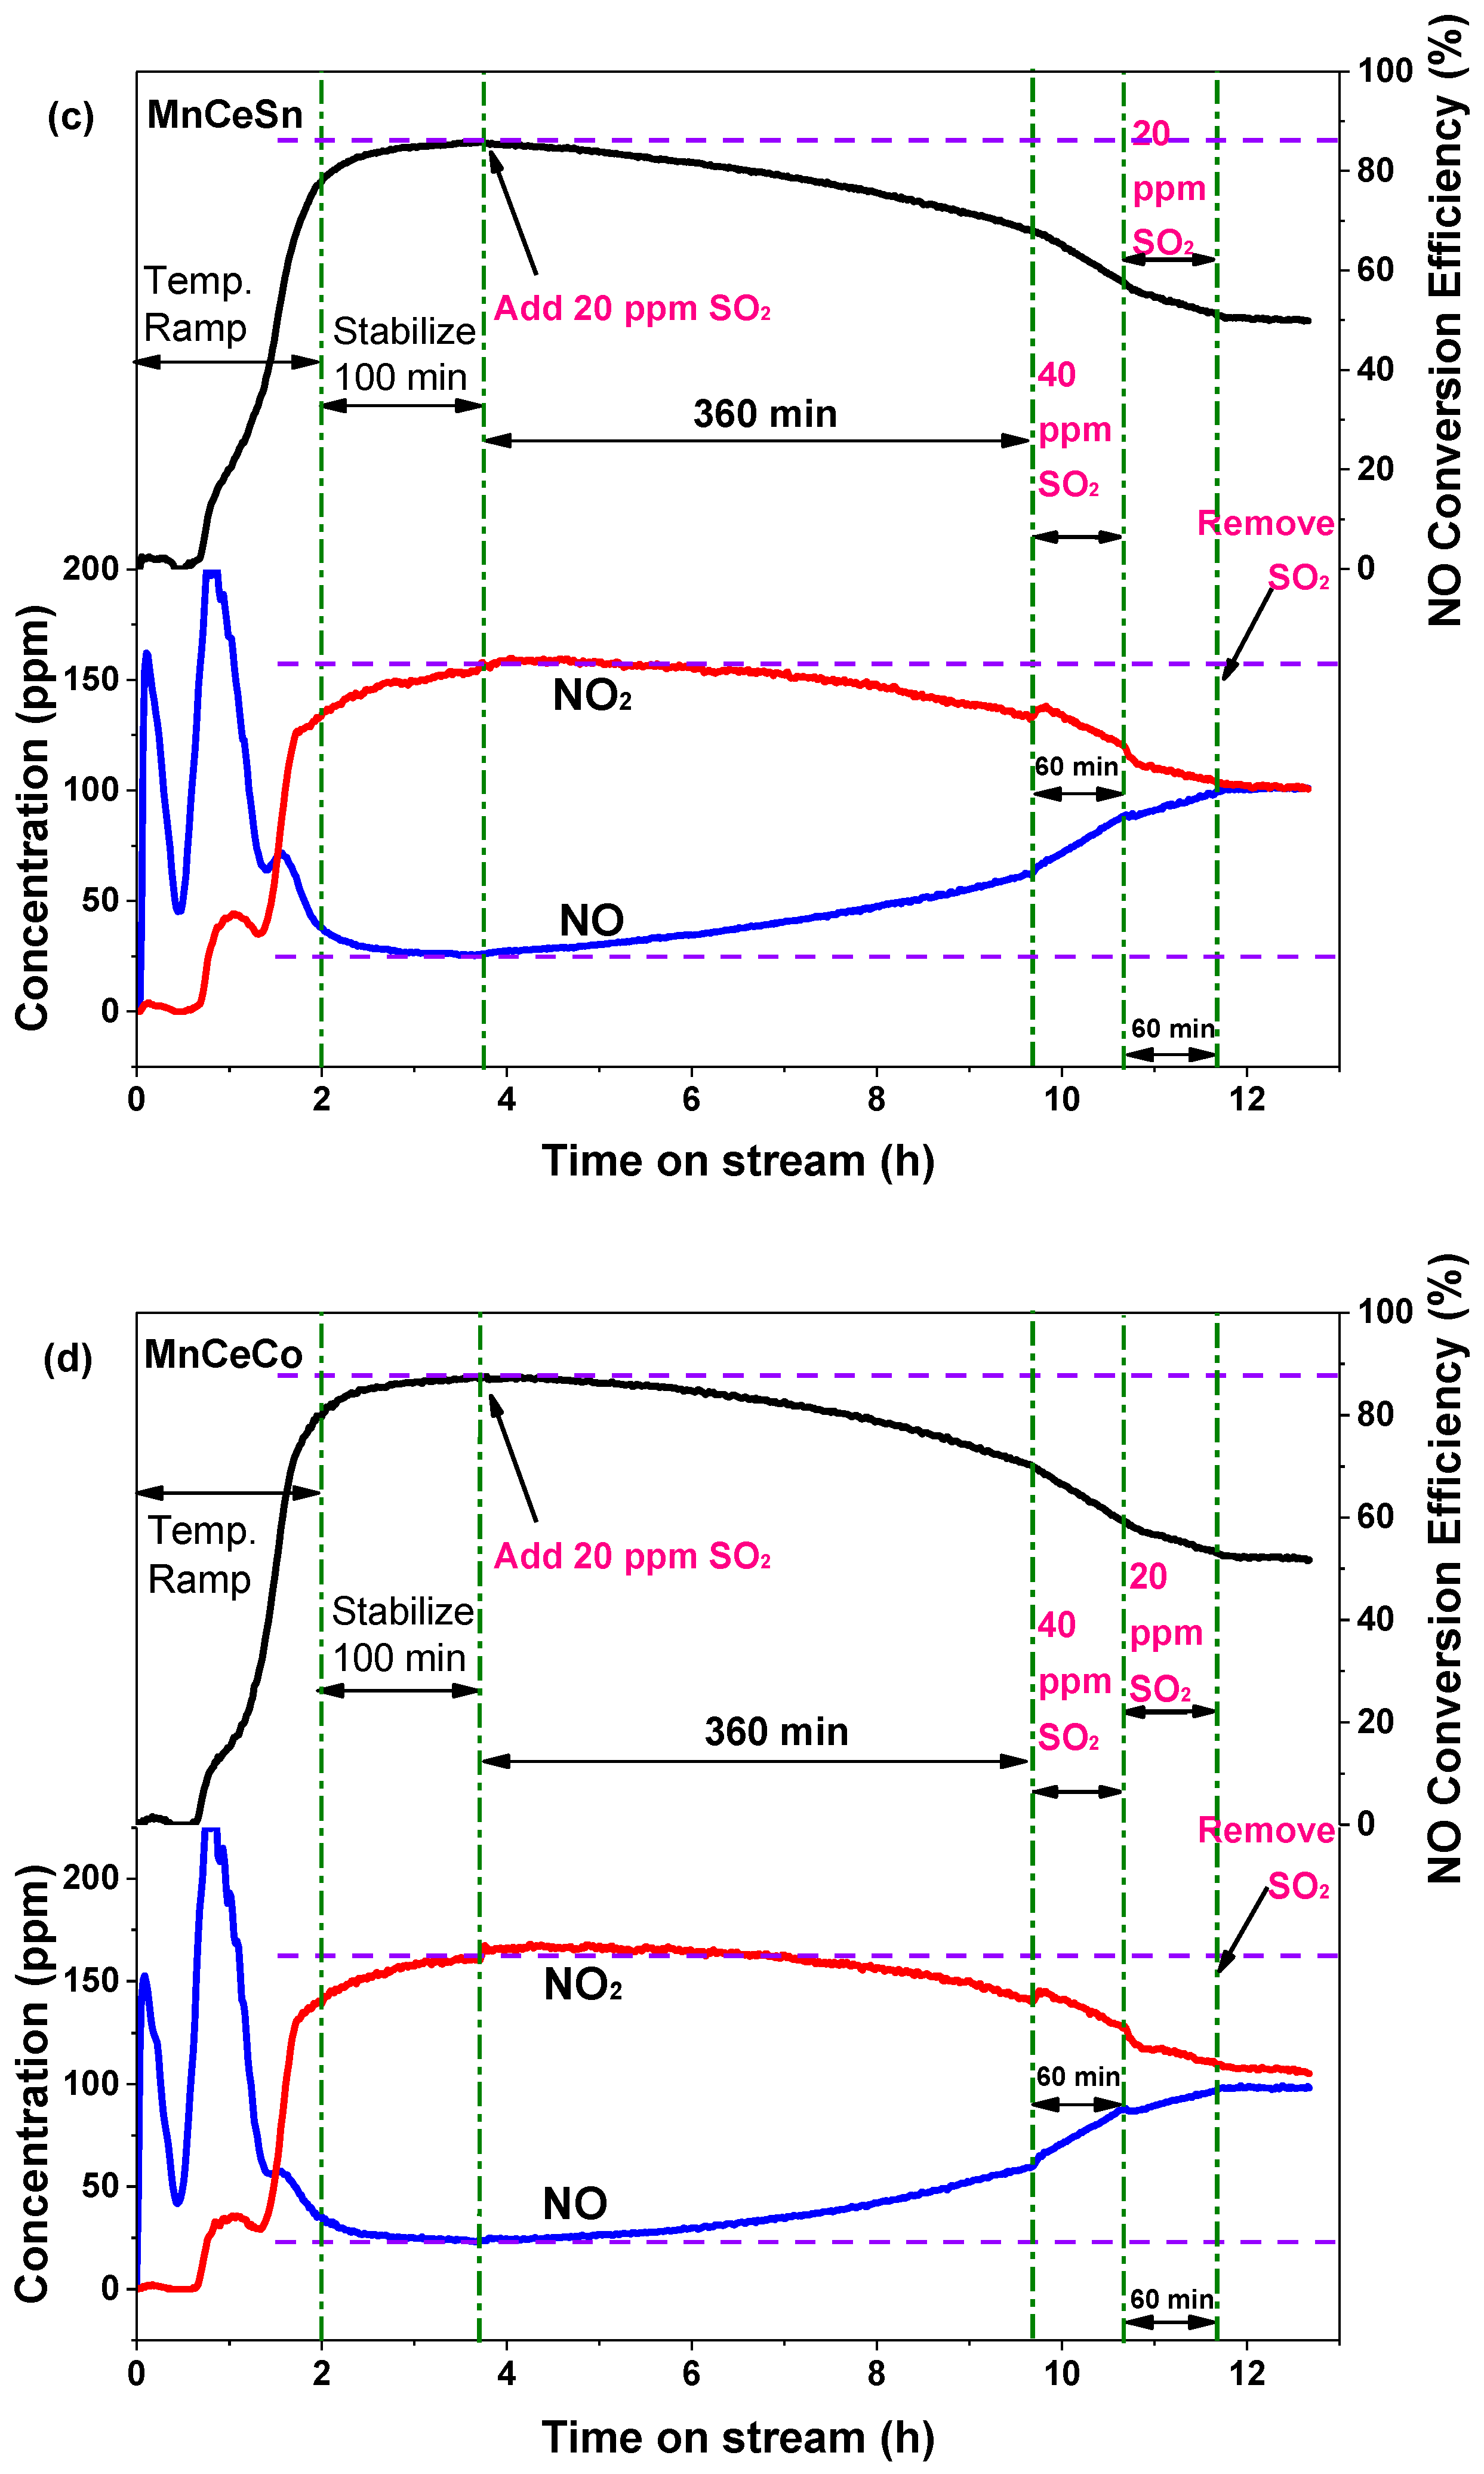
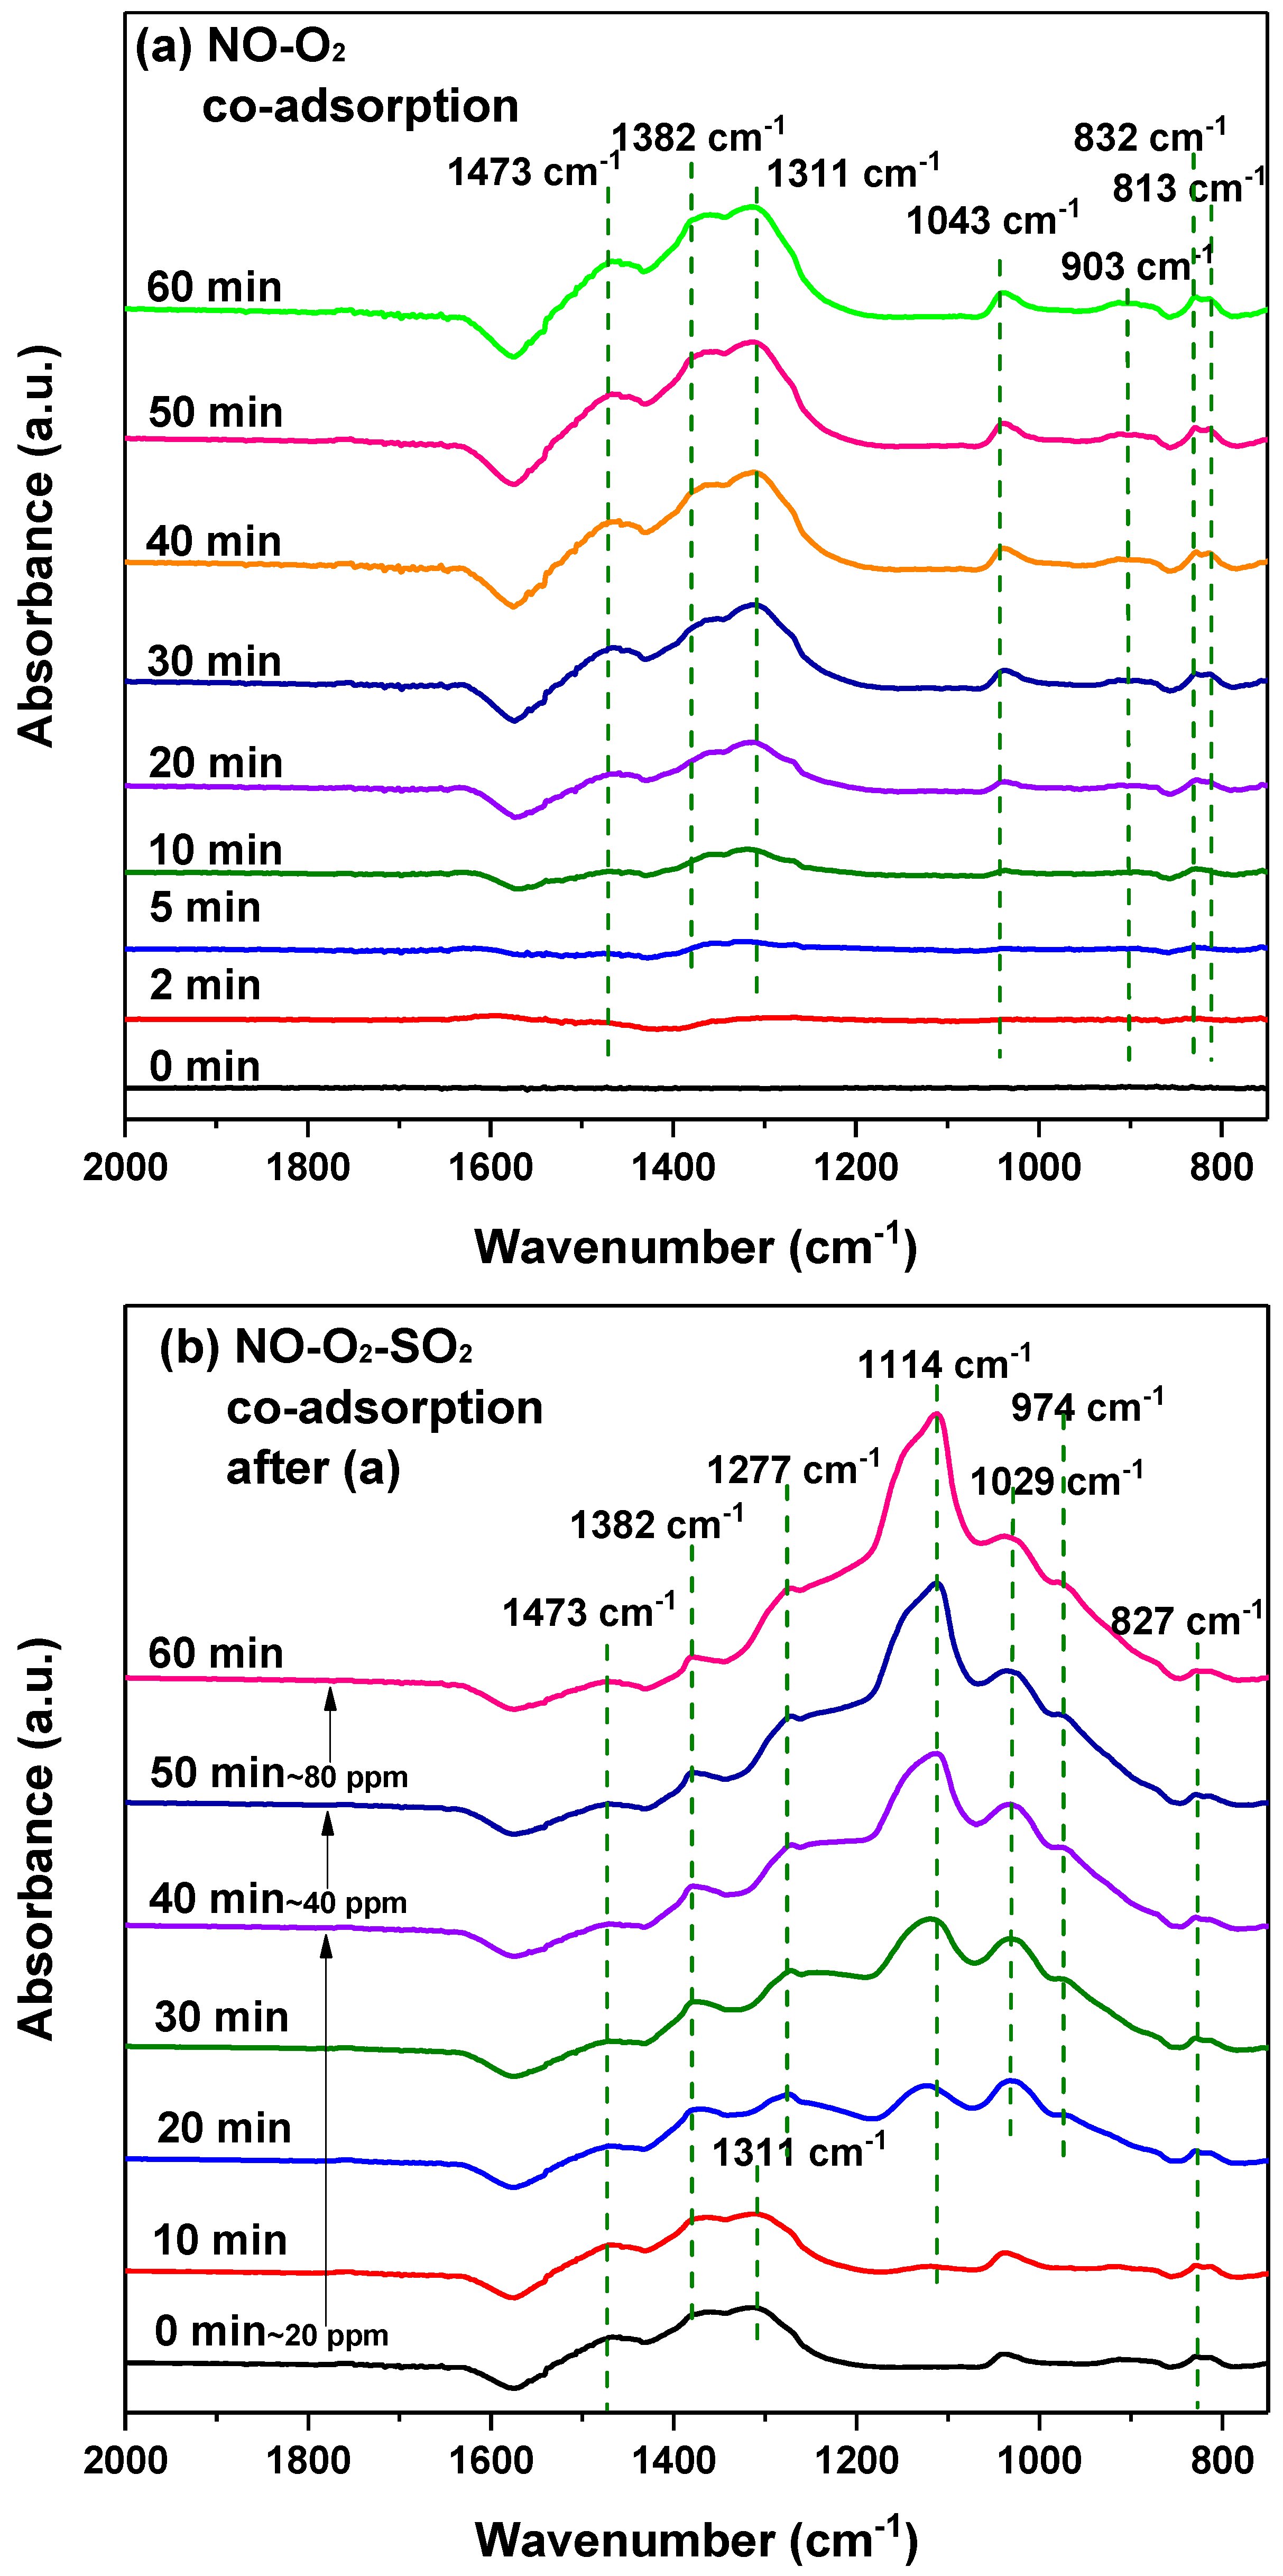
2.5.3. In-Situ DRIFTS Measurement
3. Experiments and Methods
3.1. Catalyst Preparation
3.2. Activity and Stability Tests
3.3. Catalyst Characterization
4. Conclusions
- (1)
- Higher calcination temperatures brought higher crystallization degree. MnCe catalysts calcined at 350 °C and 450 °C exhibited higher NO conversion than that calcined at 550 °C.
- (2)
- The third metal doping (Sn, Fe, Co and Cr) could reduce crystallization degree, and then improved the surface area or pore volume, but inhibited low temperature reducibility in H2-TPR, except for MnCeCu.
- (3)
- For SO2 poisoning, Fe addition into MnCe catalyst could protect Mn and Ce metal oxides from being reduced. In DRIFTS measurement, the decomposition of surface nitrates at SO2 presence gave evidence to the decreasing NO conversion efficiency. Additionally, the undestroyed parts of nitrate species on the MnCeFe catalyst surface, after SO2 poisoning, contributed to its better SO2 tolerance.
Author Contributions
Funding
Acknowledgments
Conflicts of Interest
References
- Gao, F.; Tang, X.; Yi, H.; Li, J.; Zhao, S.; Wang, J.; Chu, C.; Li, C. Promotional mechanisms of activity and SO2 tolerance of Co- or Ni-doped MnOx-CeO2 catalysts for SCR of NOx with NH3 at low temperature. Chem. Eng. J. 2017, 317, 20–31. [Google Scholar] [CrossRef]
- Adewuyi, Y.G.; Khan, M.A.; Sakyi, N.Y. Kinetics and Modeling of the Removal of Nitric Oxide by Aqueous Sodium Persulfate Simultaneously Activated by Temperature and Fe2+. Ind. Eng. Chem. Res. 2014, 53, 828–839. [Google Scholar] [CrossRef]
- Gao, F.; Tang, X.; Yi, H.; Chu, C.; Li, N.; Li, J.; Zhao, S. In-situ DRIFTS for the mechanistic studies of NO oxidation over α-MnO2, β-MnO2 and γ-MnO2 catalysts. Chem. Eng. J. 2017, 322, 525–537. [Google Scholar] [CrossRef]
- Chen, H.; Wang, Y.; Lyu, Y.-K. High catalytic activity of Mn-based catalyst in NO oxidation at low temperature and over a wide temperature span. Mol. Catal. 2018, 454, 21–29. [Google Scholar] [CrossRef]
- Hong, Z.; Wang, Z.; Li, X. Catalytic oxidation of nitric oxide (NO) over different catalysts: An overview. Catal. Sci. Technol. 2017, 7, 3440–3452. [Google Scholar] [CrossRef]
- Hao, R.; Zhang, Y.; Wang, Z.; Li, Y.; Yuan, B.; Mao, X.; Zhao, Y. An advanced wet method for simultaneous removal of SO2 and NO from coal-fired flue gas by utilizing a complex absorbent. Chem. Eng. J. 2017, 307, 562–571. [Google Scholar] [CrossRef]
- Liu, Y.; Wang, Q.; Pan, J. Novel Process of Simultaneous Removal of Nitric Oxide and Sulfur Dioxide Using a Vacuum Ultraviolet (VUV)-Activated O2/H2O/H2O2 System in A Wet VUV-Spraying Reactor. Environ. Sci. Technol. 2016, 50, 12966–12975. [Google Scholar] [CrossRef] [PubMed]
- Park, H.W.; Choi, S.; Park, D.W. Simultaneous treatment of NO and SO2 with aqueous NaClO2 solution in a wet scrubber combined with a plasma electrostatic precipitator. J. Hazard. Mater. 2015, 285, 117–126. [Google Scholar] [CrossRef] [PubMed]
- Zhang, Y.; You, R.; Liu, D.; Liu, C.; Li, X.; Tian, Y.; Jiang, Z.; Zhang, S.; Huang, Y.; Zha, Y. Carbonates-based noble metal-free lean NOx trap catalysts MOx–K2CO3/K2Ti8O17 (M= Ce, Fe, Cu, Co) with superior catalytic performance. Appl. Surf. Sci. 2015, 357, 2260–2276. [Google Scholar] [CrossRef]
- Zhang, S.; Li, H.; Zhong, Q. Promotional effect of F-doped V2O5–WO3/TiO2 catalyst for NH3-SCR of NO at low-temperature. Appl. Catal. A Gen. 2012, 435, 156–162. [Google Scholar] [CrossRef]
- Scholz, C.; Gangwal, V.; de Croon, M.; Schouten, J. Influence of CO2 and H2O on NOx storage and reduction on a Pt–Ba/γ-Al2O3 catalyst. Appl. Catal. B Environ. 2007, 71, 143–150. [Google Scholar] [CrossRef]
- Ma, J.; Wang, C.; He, H. Transition metal doped cryptomelane-type manganese oxide catalysts for ozone decomposition. Appl. Catal. B Environ. 2017, 201, 503–510. [Google Scholar] [CrossRef]
- Guo, Z.; Liang, Q.-H.; Yang, Z.; Liu, S.; Huang, Z.-H.; Kang, F. Modifying porous carbon nanofibers with MnOx–CeO2–Al2O3 mixed oxides for NO catalytic oxidation at room temperature. Catal. Sci. Technol. 2016, 6, 422–425. [Google Scholar] [CrossRef]
- Wang, X.; Wu, G.; Wang, F.; Liu, H.; Jin, T. Solvent-free selective oxidation of toluene with O2 catalysed by anion modified mesoporous mixed oxides with high thermal stability. Catal. Commun. 2017, 98, 107–111. [Google Scholar] [CrossRef]
- Guo, Y.; Wei, H.; Zhao, G.; Ma, X.; Zhu, W.; Yang, Y. Low temperature catalytic performance of coal-fired flue gas oxidation over Mn-Co-Ce-Ox. Fuel 2017, 206, 318–324. [Google Scholar] [CrossRef]
- Wang, W.; Guo, R.; Pan, W.; Hu, G. Low temperature catalytic oxidation of NO over different-shaped CeO2. J. Rare Earths 2018, 36, 588–593. [Google Scholar] [CrossRef]
- Wang, A.; Guo, Y.; Gao, F.; Peden, C.H.F. Ambient-temperature NO oxidation over amorphous CrOx-ZrO2 mixed oxide catalysts: Significant promoting effect of ZrO2. Appl. Catal. B Environ. 2017, 202, 706–714. [Google Scholar] [CrossRef]
- Mingshan, C.; Yuan, L.; Xinquan, W.; Jun, W.; Meiqing, S. Effect of preparation method on MnOx-CeO2 catalysts for NO oxidation. J. Rare Earths 2013, 31, 572–576. [Google Scholar]
- Qi, G.; Li, W. NO oxidation to NO2 over manganese-cerium mixed oxides. Catal. Today 2015, 258, 205–213. [Google Scholar] [CrossRef]
- Liang, Q.; Wu, X.; Weng, D.; Xu, H. Oxygen activation on Cu/Mn–Ce mixed oxides and the role in diesel soot oxidation. Catal. Today 2008, 139, 113–118. [Google Scholar] [CrossRef]
- Zhang, H.; Zhou, C.; Galvez, M.E.; Da Costa, P.; Chen, Y. MnOx-CeO2 mixed oxides as the catalyst for NO-assisted soot oxidation: The key role of NO adsorption/desorption on catalytic activity. Appl. Surf. Sci. 2018, 462, 678–684. [Google Scholar] [CrossRef]
- Wang, P.; Su, S.; Xiang, J.; You, H.; Cao, F.; Sun, L.; Hu, S.; Zhang, Y. Catalytic oxidation of Hg0 by MnOx–CeO2/γ-Al2O3 catalyst at low temperatures. Chemosphere 2014, 101, 49–54. [Google Scholar] [CrossRef] [PubMed]
- Xie, Y.; Li, C.; Zhao, L.; Zhang, J.; Zeng, G.; Zhang, X.; Zhang, W.; Tao, S. Experimental study on Hg0 removal from flue gas over columnar MnOx-CeO2/activated coke. Appl. Surf. Sci. 2015, 333, 59–67. [Google Scholar] [CrossRef]
- Cuo, Z.; Deng, Y.; Li, W.; Peng, S.; Zhao, F.; Liu, H.; Chen, Y. Monolithic Mn/Ce-based catalyst of fibrous ceramic membrane for complete oxidation of benzene. Appl. Surf. Sci. 2018, 456, 594–601. [Google Scholar] [CrossRef]
- Wang, Y.; Deng, W.; Wang, Y.; Guo, L.; Ishihara, T. A comparative study of the catalytic oxidation of chlorobenzene and toluene over Ce-Mn oxides. Mol. Catal. 2018, 459, 61–70. [Google Scholar] [CrossRef]
- Wang, Z.; Lin, F.; Jiang, S.; Qiu, K.; Kuang, M.; Whiddon, R.; Cen, K. Ceria substrate–oxide composites as catalyst for highly efficient catalytic oxidation of NO by O2. Fuel 2016, 166, 352–360. [Google Scholar] [CrossRef]
- Liu, L.; Zheng, C.; Wu, S.; Gao, X.; Ni, M.; Cen, K. Manganese-cerium oxide catalysts prepared by non-thermal plasma for NO oxidation: Effect of O2 in discharge atmosphere. Appl. Surf. Sci. 2017, 416, 78–85. [Google Scholar] [CrossRef]
- Shen, Q.; Zhang, L.; Sun, N.; Wang, H.; Zhong, L.; He, C.; Wei, W.; Sun, Y. Hollow MnOx-CeO2 mixed oxides as highly efficient catalysts in NO oxidation. Chem. Eng. J. 2017, 322, 46–55. [Google Scholar] [CrossRef]
- Wang, Z.; Sun, X.; Liu, J.; Li, X. The NO oxidation performance over Cu/Ce0.8Zr0.2O2 catalyst. Surf. Interfaces 2017, 6, 103–109. [Google Scholar] [CrossRef]
- Lin, F.; He, Y.; Wang, Z.; Ma, Q.; Whiddon, R.; Zhu, Y.; Liu, J. Catalytic oxidation of NO by O2 over CeO2–MnOx: SO2 poisoning mechanism. RSC Adv. 2016, 6, 31422–31430. [Google Scholar] [CrossRef]
- López, J.M.; Gilbank, A.L.; García, T.; Solsona, B.; Agouram, S.; Torrente-Murciano, L. The prevalence of surface oxygen vacancies over the mobility of bulk oxygen in nanostructured ceria for the total toluene oxidation. Appl. Catal. B 2015, 174–175, 403–412. [Google Scholar] [CrossRef]
- Qi, G.; Yang, R.T.; Chang, R. MnOx-CeO2 mixed oxides prepared by co-precipitation for selective catalytic reduction of NO with NH3 at low temperatures. Appl. Catal. B 2004, 51, 93–106. [Google Scholar] [CrossRef]
- Yang, P.; Yang, S.S.; Shi, Z.N.; Meng, Z.H.; Zhou, R.X. Deep oxidation of chlorinated VOCs over CeO2-based transition metal mixed oxide catalysts. Appl. Catal. B 2015, 162, 227–235. [Google Scholar] [CrossRef]
- Machida, M.; Uto, M.; Kurogi, D.; Kijima, T. MnOx-CeO2 binary oxides for catalytic NOx sorption at low temperatures. Sorptive removal of NOx. Chem. Mater. 2000, 12, 3158–3164. [Google Scholar] [CrossRef]
- Ma, C.; Wen, Y.; Yue, Q.; Li, A.; Fu, J.; Zhang, N.; Gai, H.; Zheng, J.; Chen, B.H. Oxygen-vacancy-promoted catalytic wet air oxidation of phenol from MnOx–CeO2. RSC Adv. 2017, 7, 27079–27088. [Google Scholar] [CrossRef]
- Wang, T.; Liu, H.; Zhang, X.; Liu, J.; Zhang, Y.; Guo, Y.; Sun, B. Catalytic conversion of NO assisted by plasma over Mn-Ce/ZSM5-multi-walled carbon nanotubes composites: Investigation of acidity, activity and stability of catalyst in the synergic system. Appl. Surf. Sci. 2018, 457, 187–199. [Google Scholar] [CrossRef]
- Tang, X.; Li, Y.; Huang, X.; Xu, Y.; Zhu, H.; Wang, J.; Shen, W. MnOx–CeO2 mixed oxide catalysts for complete oxidation of formaldehyde: Effect of preparation method and calcination temperature. Appl. Catal. B 2006, 62, 265–273. [Google Scholar] [CrossRef]
- Zhao, P.; Wang, C.; He, F.; Liu, S. Effect of ceria morphology on the activity of MnOx/CeO2 catalysts for the catalytic combustion of chlorobenzene. RSC Adv. 2014, 4, 45665–45672. [Google Scholar] [CrossRef]
- Yan, Q.; Chen, S.; Qiu, L.; Gao, Y.; O’Hare, D.; Wang, Q. The synthesis of CuyMnzAl1-zOx mixed oxide as a low-temperature NH3-SCR catalyst with enhanced catalytic performance. Dalton Trans. 2018, 47, 2992–3004. [Google Scholar] [CrossRef]
- Lin, F.; Wang, Z.; Shao, J.; Yuan, D.; He, Y.; Zhu, Y.; Cen, K. Promotional effect of spherical alumina loading with manganese based bimetallic oxides on nitric oxide deep oxidation by ozone. Chin. J. Catal. 2017, 38, 1270–1280. [Google Scholar] [CrossRef]
- Escribano, V.S.; Lopez, E.F.; Gallardo-Amores, J.M.; Martinez, C.D.; Pistarino, C.; Panizza, M.; Resini, C.; Busca, G. A study of a ceria-zirconia-supported manganese oxide catalyst for combustion of diesel soot particles. Combust. Flame 2008, 153, 97–104. [Google Scholar] [CrossRef]
- Lin, F.; Wang, Z.; Ma, Q.; Yang, Y.; Whiddon, R.; Zhu, Y.; Cen, K. Catalytic deep oxidation of NO by ozone over MnOx loaded spherical alumina catalyst. Appl. Catal. B Environ. 2016, 198, 100–111. [Google Scholar] [CrossRef]
- Yao, X.; Li, L.; Zou, W.; Yu, S.; An, J.; Li, H.; Yang, F.; Dong, L. Preparation, characterization, and catalytic performance of high efficient CeO2-MnOx-Al2O3 catalysts for NO elimination. Chin. J. Catal. 2016, 37, 1369–1380. [Google Scholar] [CrossRef]
- Hailstone, R.K.; Difrancesco, A.G.; Leong, J.G.; Allston, T.D.; Reed, K.J. A Study of Lattice Expansion in CeO2 Nanoparticles by Transmission Electron Microscopy. J. Phys. Chem. C 2009, 113, 15155–15159. [Google Scholar] [CrossRef]
- Li, H.; Tang, X.; Yi, H.; Yu, L. Low-temperature catalytic oxidation of NO over Mn-Ce-Ox catalyst. J. Rare Earths 2010, 28, 64–68. [Google Scholar] [CrossRef]
- Cai, W.; Zhao, Y.; Chen, M.; Jiang, X.; Wang, H.; Ou, M.; Wan, S.; Zhong, Q. The formation of 3D spherical Cr-Ce mixed oxides with roughness surface and their enhanced low-temperature NO oxidation. Chem. Eng. J. 2018, 333, 414–422. [Google Scholar] [CrossRef]
- Thampy, S.; Zheng, Y.; Dillon, S.; Liu, C.; Jangjou, Y.; Lee, Y.-J.; Epling, W.S.; Xiong, K.; Chabal, Y.J.; Cho, K.; et al. Superior catalytic performance of Mn-Mullite over Mn-Perovskite for NO oxidation. Catal. Today 2018, 310, 195–201. [Google Scholar] [CrossRef]
- Li, K.; Tang, X.; Yi, H.; Ning, P.; Kang, D.; Wang, C. Low-temperature catalytic oxidation of NO over Mn–Co–Ce–Ox catalyst. Chem. Eng. J. 2012, 192, 99–104. [Google Scholar] [CrossRef]
- Shang, D.; Zhong, Q.; Cai, W. Influence of the preparation method on the catalytic activity of Co/Zr1−xCexO2 for NO oxidation. J. Mol. Catal. A Chem. 2015, 399, 18–24. [Google Scholar] [CrossRef]
- Zhang, L.; Pierce, J.; Leung, V.L.; Wang, D.; Epling, W.S. Characterization of Ceria’s Interaction with NOx and NH3. J. Phys. Chem. C 2013, 117, 8282–8289. [Google Scholar] [CrossRef]
- Li, Y.; Li, Y.; Wang, P.; Hu, W.; Zhang, S.; Shi, Q.; Zhan, S. Low-temperature selective catalytic reduction of NOx with NH3 over MnFeOx nanorods. Chem. Eng. J. 2017, 330, 213–222. [Google Scholar] [CrossRef]
- Wang, Y.L.; Ge, C.Z.; Zhan, L.; Li, C.; Qiao, W.M.; Ling, L.C. MnOx-CeO2/Activated Carbon Honeycomb Catalyst for Selective Catalytic Reduction of NO with NH3 at Low Temperatures. Ind. Eng. Chem. Res. 2012, 51, 11667–11673. [Google Scholar] [CrossRef]
- Abdulhamid, H.; Fridell, E.; Dawody, J.; Skoglundh, M. In situ FTIR study of SO2 interaction with Pt/BaCO3/Al2O3 NOx storage catalysts under lean and rich conditions. J. Catal. 2006, 241, 200–210. [Google Scholar] [CrossRef]
- Jin, R.; Liu, Y.; Wang, Y.; Cen, W.; Wu, Z.; Wang, H.; Weng, X. The role of cerium in the improved SO2 tolerance for NO reduction with NH3 over Mn-Ce/TiO2 catalyst at low temperature. Appl. Catal. B 2014, 148–149, 582–588. [Google Scholar] [CrossRef]
- Liu, J.; Guo, R.-T.; Li, M.-Y.; Sun, P.; Liu, S.-M.; Pan, W.-G.; Liu, S.-W.; Sun, X. Enhancement of the SO2 resistance of Mn/TiO2 SCR catalyst by Eu modification: A mechanism study. Fuel 2018, 223, 385–393. [Google Scholar] [CrossRef]
- Chang, H.; Chen, X.; Li, J.; Ma, L.; Wang, C.; Liu, C.; Schwank, J.W.; Hao, J. Improvement of activity and SO2 tolerance of Sn-modified MnOx-CeO2 catalysts for NH3-SCR at low temperatures. Environ. Sci. Technol. 2013, 47, 5294–5301. [Google Scholar] [CrossRef]
- Yamaguchi, T.; Jin, T.; Tanabe, K. Structure of acid sites on sulfur-promoted iron oxide. J. Phys. Chem. 1986, 90, 3148–3152. [Google Scholar] [CrossRef]


| Catalyst | 2θ(111)/° | FWHM | Crystallite Size a/nm |
|---|---|---|---|
| MnCe(350) | 28.6 | 0.902 | 9.9 |
| MnCe(450) | 28.4 | 0.729 | 11.6 |
| MnCe(550) | 28.5 | 0.737 | 12.1 |
| MnCeSn | 28.6 | 1.017 | 8.8 |
| MnCeFe | 28.6 | 0.742 | 12.1 |
| MnCeCo | 28.6 | 0.772 | 11.6 |
| MnCeCr | 28.7 | 0.901 | 9.9 |
| MnCeCu | 28.5 | 0.792 | 11.3 |
| Catalyst | BET Surface Area/m2·g−1 | Pore Volume a/mL·g−1 | Avg. Pore Diameter b/nm |
|---|---|---|---|
| MnCe(450) | 73.3 | 0.10 | 9.8 |
| MnCeSn | 106.6 | 0.19 | 14.1 |
| MnCeFe | 111.7 | 0.11 | 5.5 |
| MnCeCo | 95.9 | 0.08 | 5.0 |
| MnCeCr | 126.5 | 0.26 | 14.3 |
| MnCeCu | 63.8 | 0.07 | 7.7 |
| Catalyst | Mn3+ | Mn4+ | ||
|---|---|---|---|---|
| B.E. (eV) | Mn3+/Mnn+ (%) | B.E. (eV) | Mn4+/Mnn+ (%) | |
| MnCe | 640.9 | 48.9 | 642.5 | 51.1 |
| MnCe_S | 641.2 | 58.5 | 644.1 | 41.5 |
| MnCeFe | 641.1 | 63.5 | 643.4 | 36.5 |
| MnCeFe_S | 641.4 | 60.1 | 643.9 | 39.9 |
| Catalyst | Ce4+ | Ce3+ | Ce4+/Ce | ||||||
|---|---|---|---|---|---|---|---|---|---|
| V | V’’ | V’’’ | U | U’’ | U’’’ | V’ | U’ | % | |
| MnCe | 881.7 | 888.2 | 897.7 | 900.2 | 906.9 | 916.2 | 883.0 | 900.4 | 56.2 |
| MnCe_S | 882.0 | 888.4 | 897.9 | 900.4 | 907.2 | 916.6 | 883.1 | 900.5 | 57.2 |
| MnCeFe | 881.9 | 888.3 | 897.9 | 900.4 | 906.9 | 916.3 | 883.2 | 902.0 | 65.9 |
| MnCeFe_S | 882.2 | 888.6 | 898.2 | 900.7 | 907.0 | 916.6 | 883.4 | 902.3 | 72.1 |
| Catalyst | Oα | Oβ | Oγ | |||
|---|---|---|---|---|---|---|
| B.E. (eV) | Oα/O (%) | B.E. (eV) | Oβ/O (%) | B.E. (eV) | Oγ/O (%) | |
| MnCe | 528.8 | 64.8 | 530.9 | 26.3 | 532.8 | 8.9 |
| MnCe_S | 529.2 | 32.6 | 530.5 | 3.1 | 532.1 | 64.3 |
| MnCeFe | 529.0 | 51.6 | 531.2 | 33.6 | 533.1 | 14.8 |
| MnCeFe_S | 529.3 | 39.4 | 531.9 | 60.6 | -- | -- |
| Catalyst | Preparation Method | Reaction Condition | NO Conversion | Ref |
|---|---|---|---|---|
| MnCe | Co-precipitation | 200 ppm NO, 10% O2, 15,000 h−1, 220 °C | 88% | This paper |
| MnCeOx | Citric acid method | 500 ppm NO, 3% O2, 50,902 h−1,150 °C | 46% | [45] |
| MnCeOx | Sol-gel method | 400 ppm NO, 5% O2, 360,000 h−1, 300 °C | 65% | [27] |
| MnCeOx | Co-precipitation | 200 ppm NO, 8% O2, 5% H2O, 8% CO2, 25,000 h−1, 350 °C | 69% | [19] |
| MnCeOx | CS template method | 250 ppm NO, 5% O2, 120,000 h−1, 220 °C | 82% | [28] |
| CrCeOx | Hydro-thermal method | 400 ppm NO, 8% O2, 35,400 h−1, 300 °C | 66% | [46] |
| CeCoOx | Sol-gel method | 300 ppm NO, 10% O2, 20,000 h−1, 230 °C | 93% | [26] |
| SmMn2O5 | Co-precipitation | 400 ppm NO, 10% O2, 100,000 h−1, 330 °C | 52% | [47] |
| Cu/Ce0.8Zr0.2O2 | Deposition-precipitation | 500 ppm NO, 5% O2, 80,000 h−1, 320 °C | 73% | [29] |
| MnCeCoOx | Co-precipitation | 500 ppm NO, 3% O2, 35,000 h−1, 150 °C | 80% | [48] |
| CoZrCeOx | Citrate complexation | 3900 ppm NO, 8% O2, 30,000 h−1, 300 °C | 80% | [49] |
| Catalyst | Highest Value | 360-min (20 ppm SO2) | 60-min (40 ppm SO2) | 60-min (20 ppm SO2) |
|---|---|---|---|---|
| MnCe | 90% | 77% | 54% | 42% |
| MnCeFe | 86% | 76% | 69% | 62% |
| MnCeSn | 86% | 68% | 57% | 51% |
| MnCeCo | 87% | 70% | 58% | 53% |
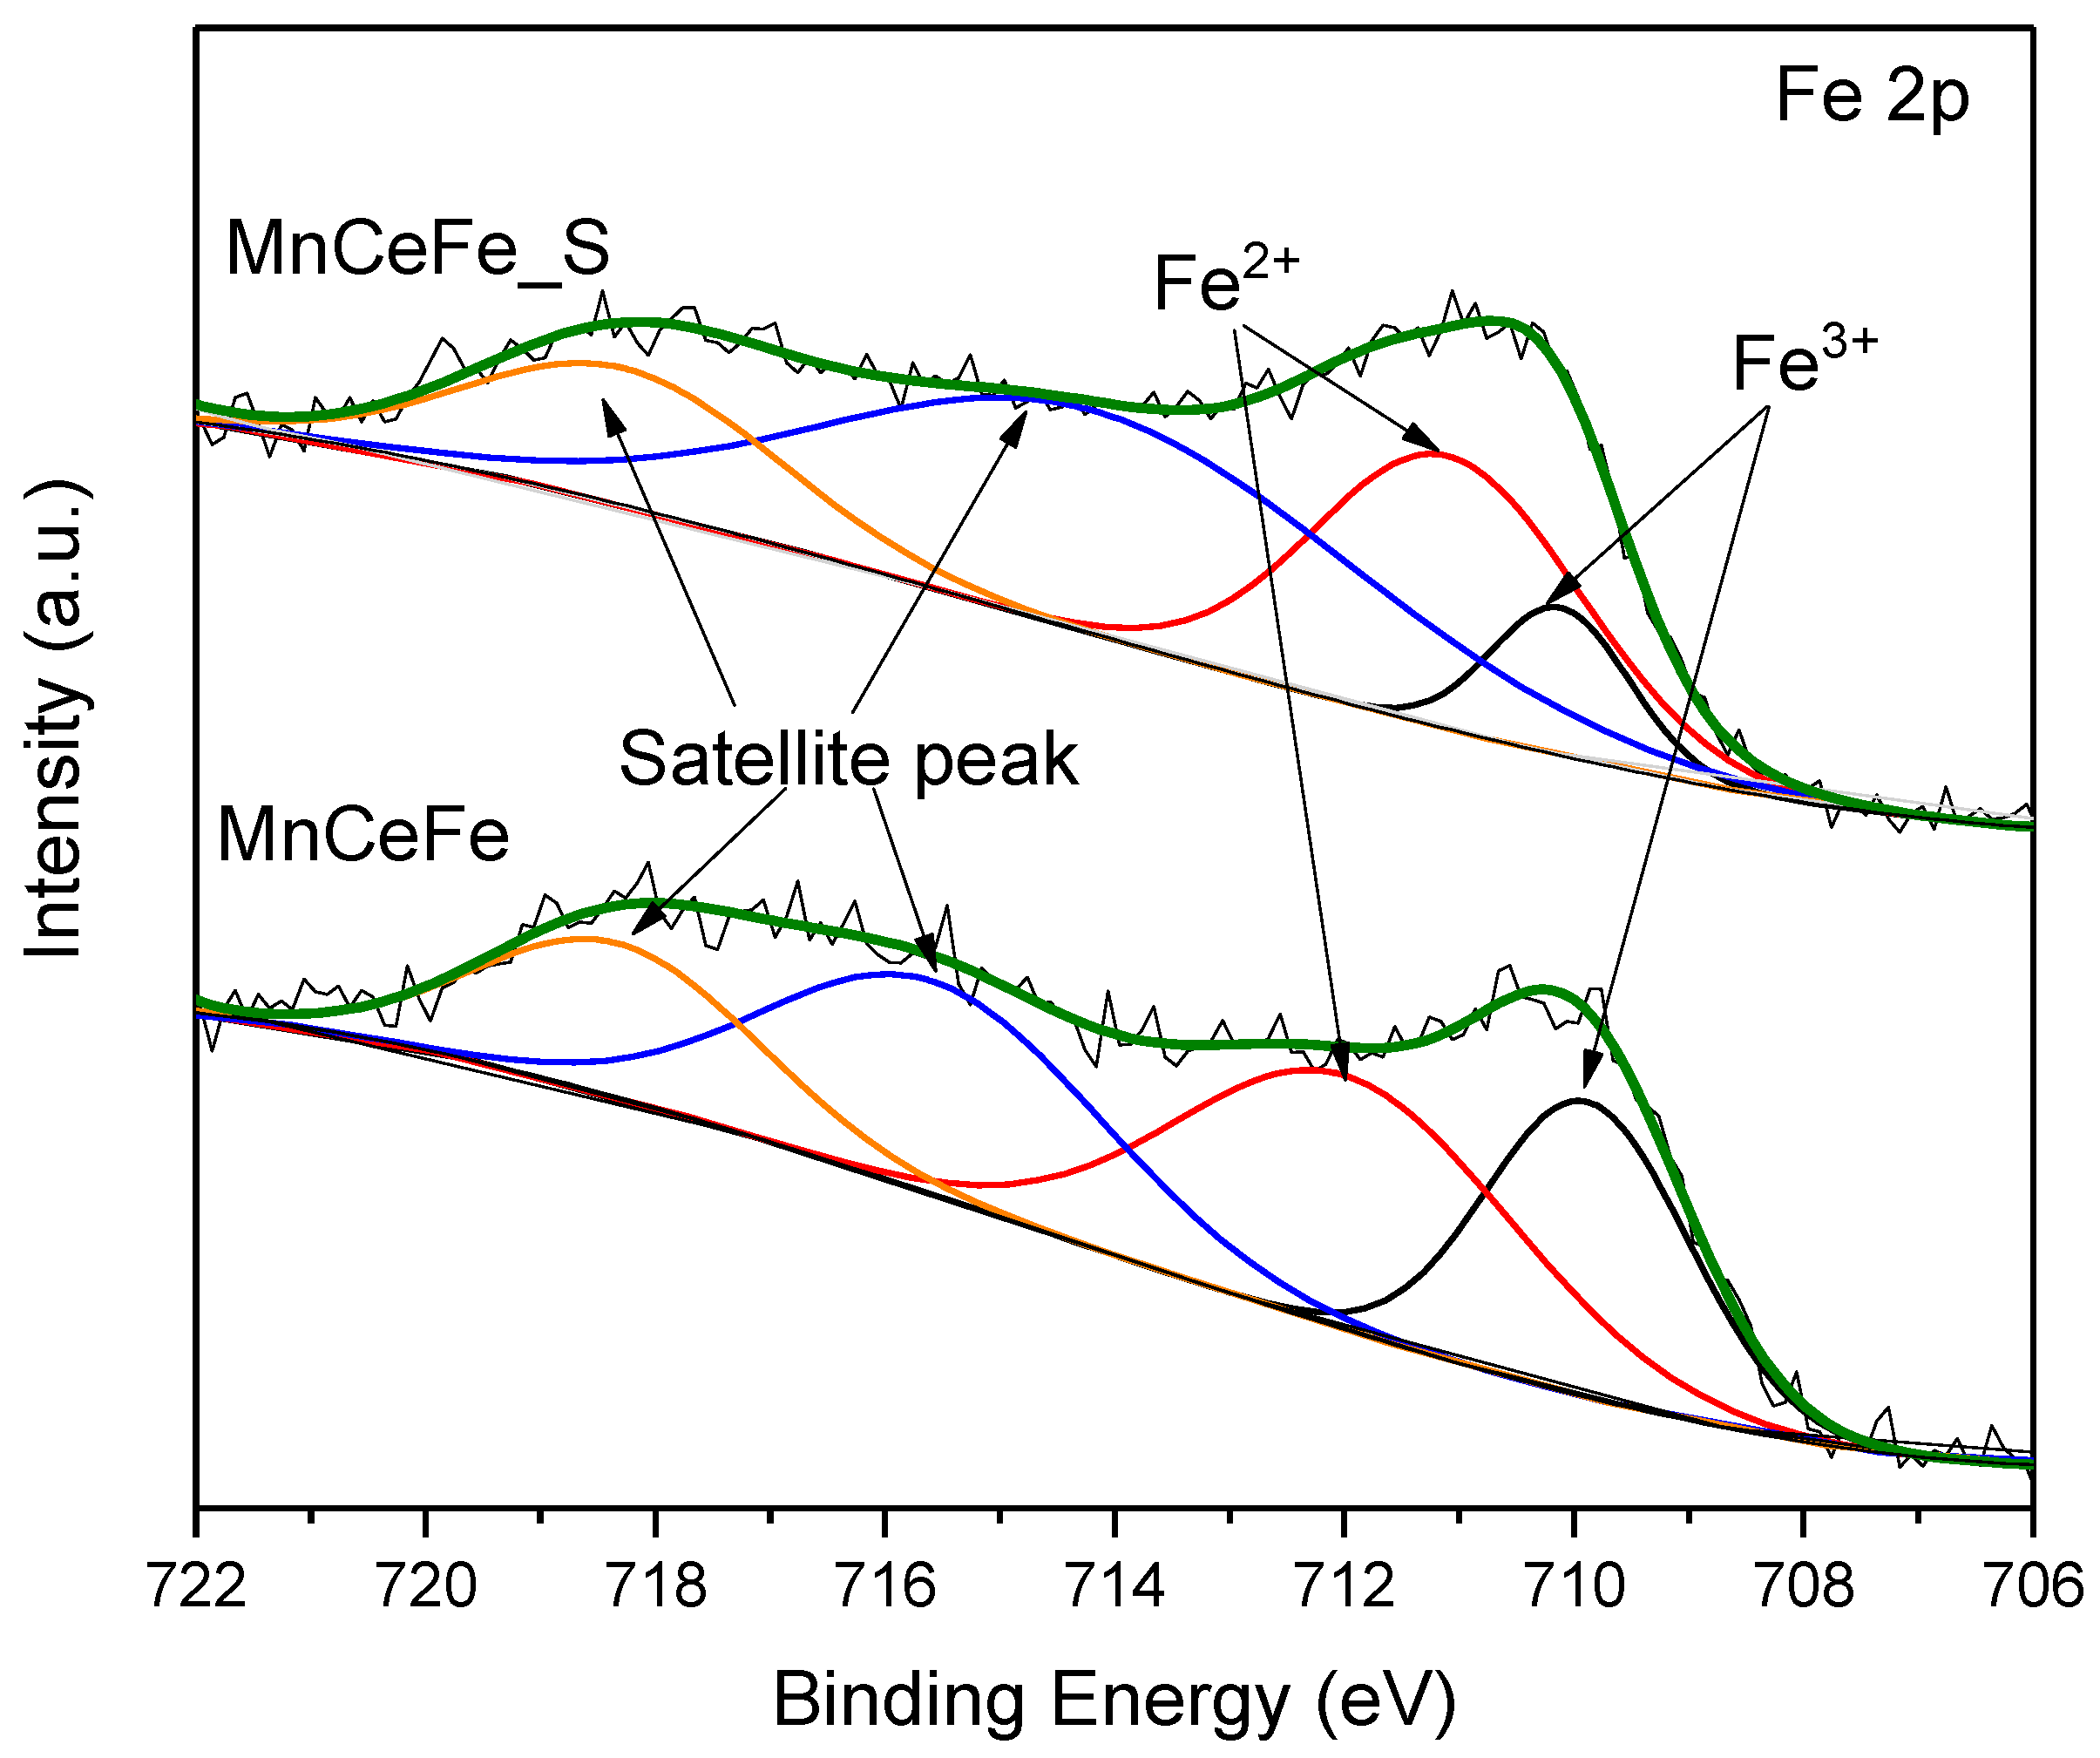
| Catalyst | Fe3+ | Fe2+ | ||
|---|---|---|---|---|
| B.E. (eV) | Fe3+/Fe (%) | B.E. (eV) | Fe2+/Fe (%) | |
| MnCeFe | 709.9 | 41.2 | 712.0 | 58.8 |
| MnCeFe_S | 710.1 | 21.9 | 711.1 | 78.1 |
© 2019 by the authors. Licensee MDPI, Basel, Switzerland. This article is an open access article distributed under the terms and conditions of the Creative Commons Attribution (CC BY) license (http://creativecommons.org/licenses/by/4.0/).
Share and Cite
Shao, J.; Lin, F.; Li, Y.; Tang, H.; Wang, Z.; Liu, P.; Chen, G. Co-precipitation Synthesized MnOx-CeO2 Mixed Oxides for NO Oxidation and Enhanced Resistance to Low Concentration of SO2 by Metal Addition. Catalysts 2019, 9, 519. https://doi.org/10.3390/catal9060519
Shao J, Lin F, Li Y, Tang H, Wang Z, Liu P, Chen G. Co-precipitation Synthesized MnOx-CeO2 Mixed Oxides for NO Oxidation and Enhanced Resistance to Low Concentration of SO2 by Metal Addition. Catalysts. 2019; 9(6):519. https://doi.org/10.3390/catal9060519
Chicago/Turabian StyleShao, Jiaming, Fawei Lin, Yan Li, Hairong Tang, Zhihua Wang, Peixi Liu, and Guanyi Chen. 2019. "Co-precipitation Synthesized MnOx-CeO2 Mixed Oxides for NO Oxidation and Enhanced Resistance to Low Concentration of SO2 by Metal Addition" Catalysts 9, no. 6: 519. https://doi.org/10.3390/catal9060519
APA StyleShao, J., Lin, F., Li, Y., Tang, H., Wang, Z., Liu, P., & Chen, G. (2019). Co-precipitation Synthesized MnOx-CeO2 Mixed Oxides for NO Oxidation and Enhanced Resistance to Low Concentration of SO2 by Metal Addition. Catalysts, 9(6), 519. https://doi.org/10.3390/catal9060519