Article

Catalytic Activity of Ni1-xLi2xWO4 Particles for Carbon Dioxide Photoreduction

1
Department of Chemistry, College of Natural Sciences, Yeungnam University, Gyeongsan, Gyeongbuk 38541, Korea
2
School of Chemical Engineering, Yeungnam University, Gyeongsan, Gyeongbuk 38541, Korea
3
Korea Institute of Energy Research, 152 Gajeong-ro, Yuseong-gu, Daejeon 34129, Korea
4
Korea Electric Power Corporation Research Institute, 105 Munji-ro, Yuseong-gu, Daejeon 34056, Korea
*
Authors to whom correspondence should be addressed.
Catalysts 2019, 9(5), 467; https://doi.org/10.3390/catal9050467
Submission received: 29 March 2019 / Revised: 10 May 2019 / Accepted: 17 May 2019 / Published: 21 May 2019
(This article belongs to the Special Issue Catalysis and Catalytic Processes for CO2 Conversion)

Abstract

:
This study introduces NiWO4 as a main photocatalyst, where the Ni component promotes methanation to generate a WO3-based catalyst, as a new type of catalyst that promotes the photoreduction of carbon dioxide by slowing the recombination of electrons and holes. The bandgap of NiWO4 is 2.74 eV, which was expected to improve the initial activity for the photoreduction of carbon dioxide. However, fast recombination between the holes and electrons was also expected. To overcome this problem, attempts were made to induce structural defects by partially replacing the Ni2+ ions in NiWO4 with Li+. The resulting CO2 conversion reaction was greatly enhanced with the Ni1-xLi2xWO4 catalysts containing Li+, compared to that of the pure NiWO4 catalysts. Notably, the total amount of CO and CH4 produced with the Ni0.8Li0.4WO4 catalyst was 411.6 nmol g−1. It is believed that the insertion of Li+ ions into the NiWO4 skeleton results in lattice defects due to charge and structural imbalance, which play a role in the capture of CO2 gas or excited electrons, thereby inhibiting recombination between the electrons and holes in the Ni1-xLi2xWO4 particles.

1. Introduction

Recently, the photochemical conversion of CO2 utilizing solar energy has attracted much attention as an environmentally friendly technology [1]. However, for the commercialization of this technology, it is essential to develop high-efficiency semiconductor photocatalysts capable of promoting the reaction. In order to efficiently reduce CO2 using solar energy, electrons must move from the valence band (VB) to the conduction band (CB) of the catalyst under visible light irradiation, which is possible if the bandgap of the catalyst overlaps with the visible light region. Therefore, the bandgap energy of the photocatalyst should be 1.75–3.0 eV. In addition, the CB edges of the semiconductor must be negatively positioned relative to the standard reduction potential of the carbon dioxide reduction reactions. Catalysts suitable for this purpose, such as TiO2 [2], ZnO [3], SnO2 [4], Cu2O [5], CuFeO2 [6], CdS [7], Ga2O3 [8], rGO [9], etc., have been reported. Sunlight reaching the earth comprises 4, 53, and 43% ultraviolet, visible, and infrared radiation, respectively. However, a photocatalyst with an energy band that can efficiently utilize the various wavelengths of sunlight has not yet been developed. Many researchers have attempted to improve the performance of photocatalysts by efficient light harvesting. In other words, if the electrons and holes excited by the light can be spatially separated, recombination of the electrons and holes can be delayed and the frequency with which they participate in oxidation-reduction reactions at the interface between the semiconductor and the reactant can be increased [10].
Based on this background, we designed a new type of photocatalyst that induces CO2 photoreduction while slowing the recombination of electrons and holes. Instead of the extensively used TiO2, NiWO4 containing Ni, a methanation catalyst, is introduced as the main photocatalyst into tungsten oxide with a bandgap of 2.6−2.8 eV. Recently, photocatalysts of metal or non-metal oxygenates such as M-VO4 [11], M-BO3 [12], M-WO4 [13], and M-PO4 [14] have been developed. The bandgaps of these catalysts are ~2.0−3.0 eV, which are smaller than that of TiO2. Recently, these oxygenates have been explored as visible-light-active catalysts. However, they are still in the early stage of research and significant achievements have not been reported yet. This is attributed to rapid recombination of the photoinduced electron–hole pairs and the narrow light response range in the solar spectrum, leading to low photocatalytic activity of the materials [15,16], which significantly hampers their widespread practical use. In particular, nickel tungstate with the formula NiWO4 has attracted significant attention due to its interesting structural and photoluminescence properties [17,18], where it has been applied to scintillation counters, lasers, optical fibers, and catalysts [19,20]. Because NiWO4 as a photocatalyst has a small bandgap, electron transfer from the valence band (VB) to the conduction band (CB) is possible with a small amount of energy, and good optical activity is expected at the beginning of the reaction, but there is some concern about the fast recombination between the excited electrons and holes [21]. The rapid recombination of charge carriers strongly hinders its catalytic applications. The design of heterostructure semiconductors with different materials and phases is beneficial for extending the visible-light response, as well as for enhancing the separation and lifetime of the charge carriers [22]. As another approach, we attempted to introduce holes or electron traps in the crystal lattice to maintain efficient charge separation between the electron and the hole. Herein, Frenkel defects are introduced into the lattice by substituting the Ni2+ ions in the NiWO4 lattice with Li+ ions [23]. A Frenkel defect is a type of point defect in a crystal lattice, and is formed when an atom or smaller ion leaves its place in the lattice, creating a vacancy, and becomes an interstitial defect by lodging in a nearby location [24]. Such defects are expected to effectively induce charge separation between the electrons and holes and maximize adsorption of CO2 gas at the defect surface of the catalyst to improve the photocatalytic activity.

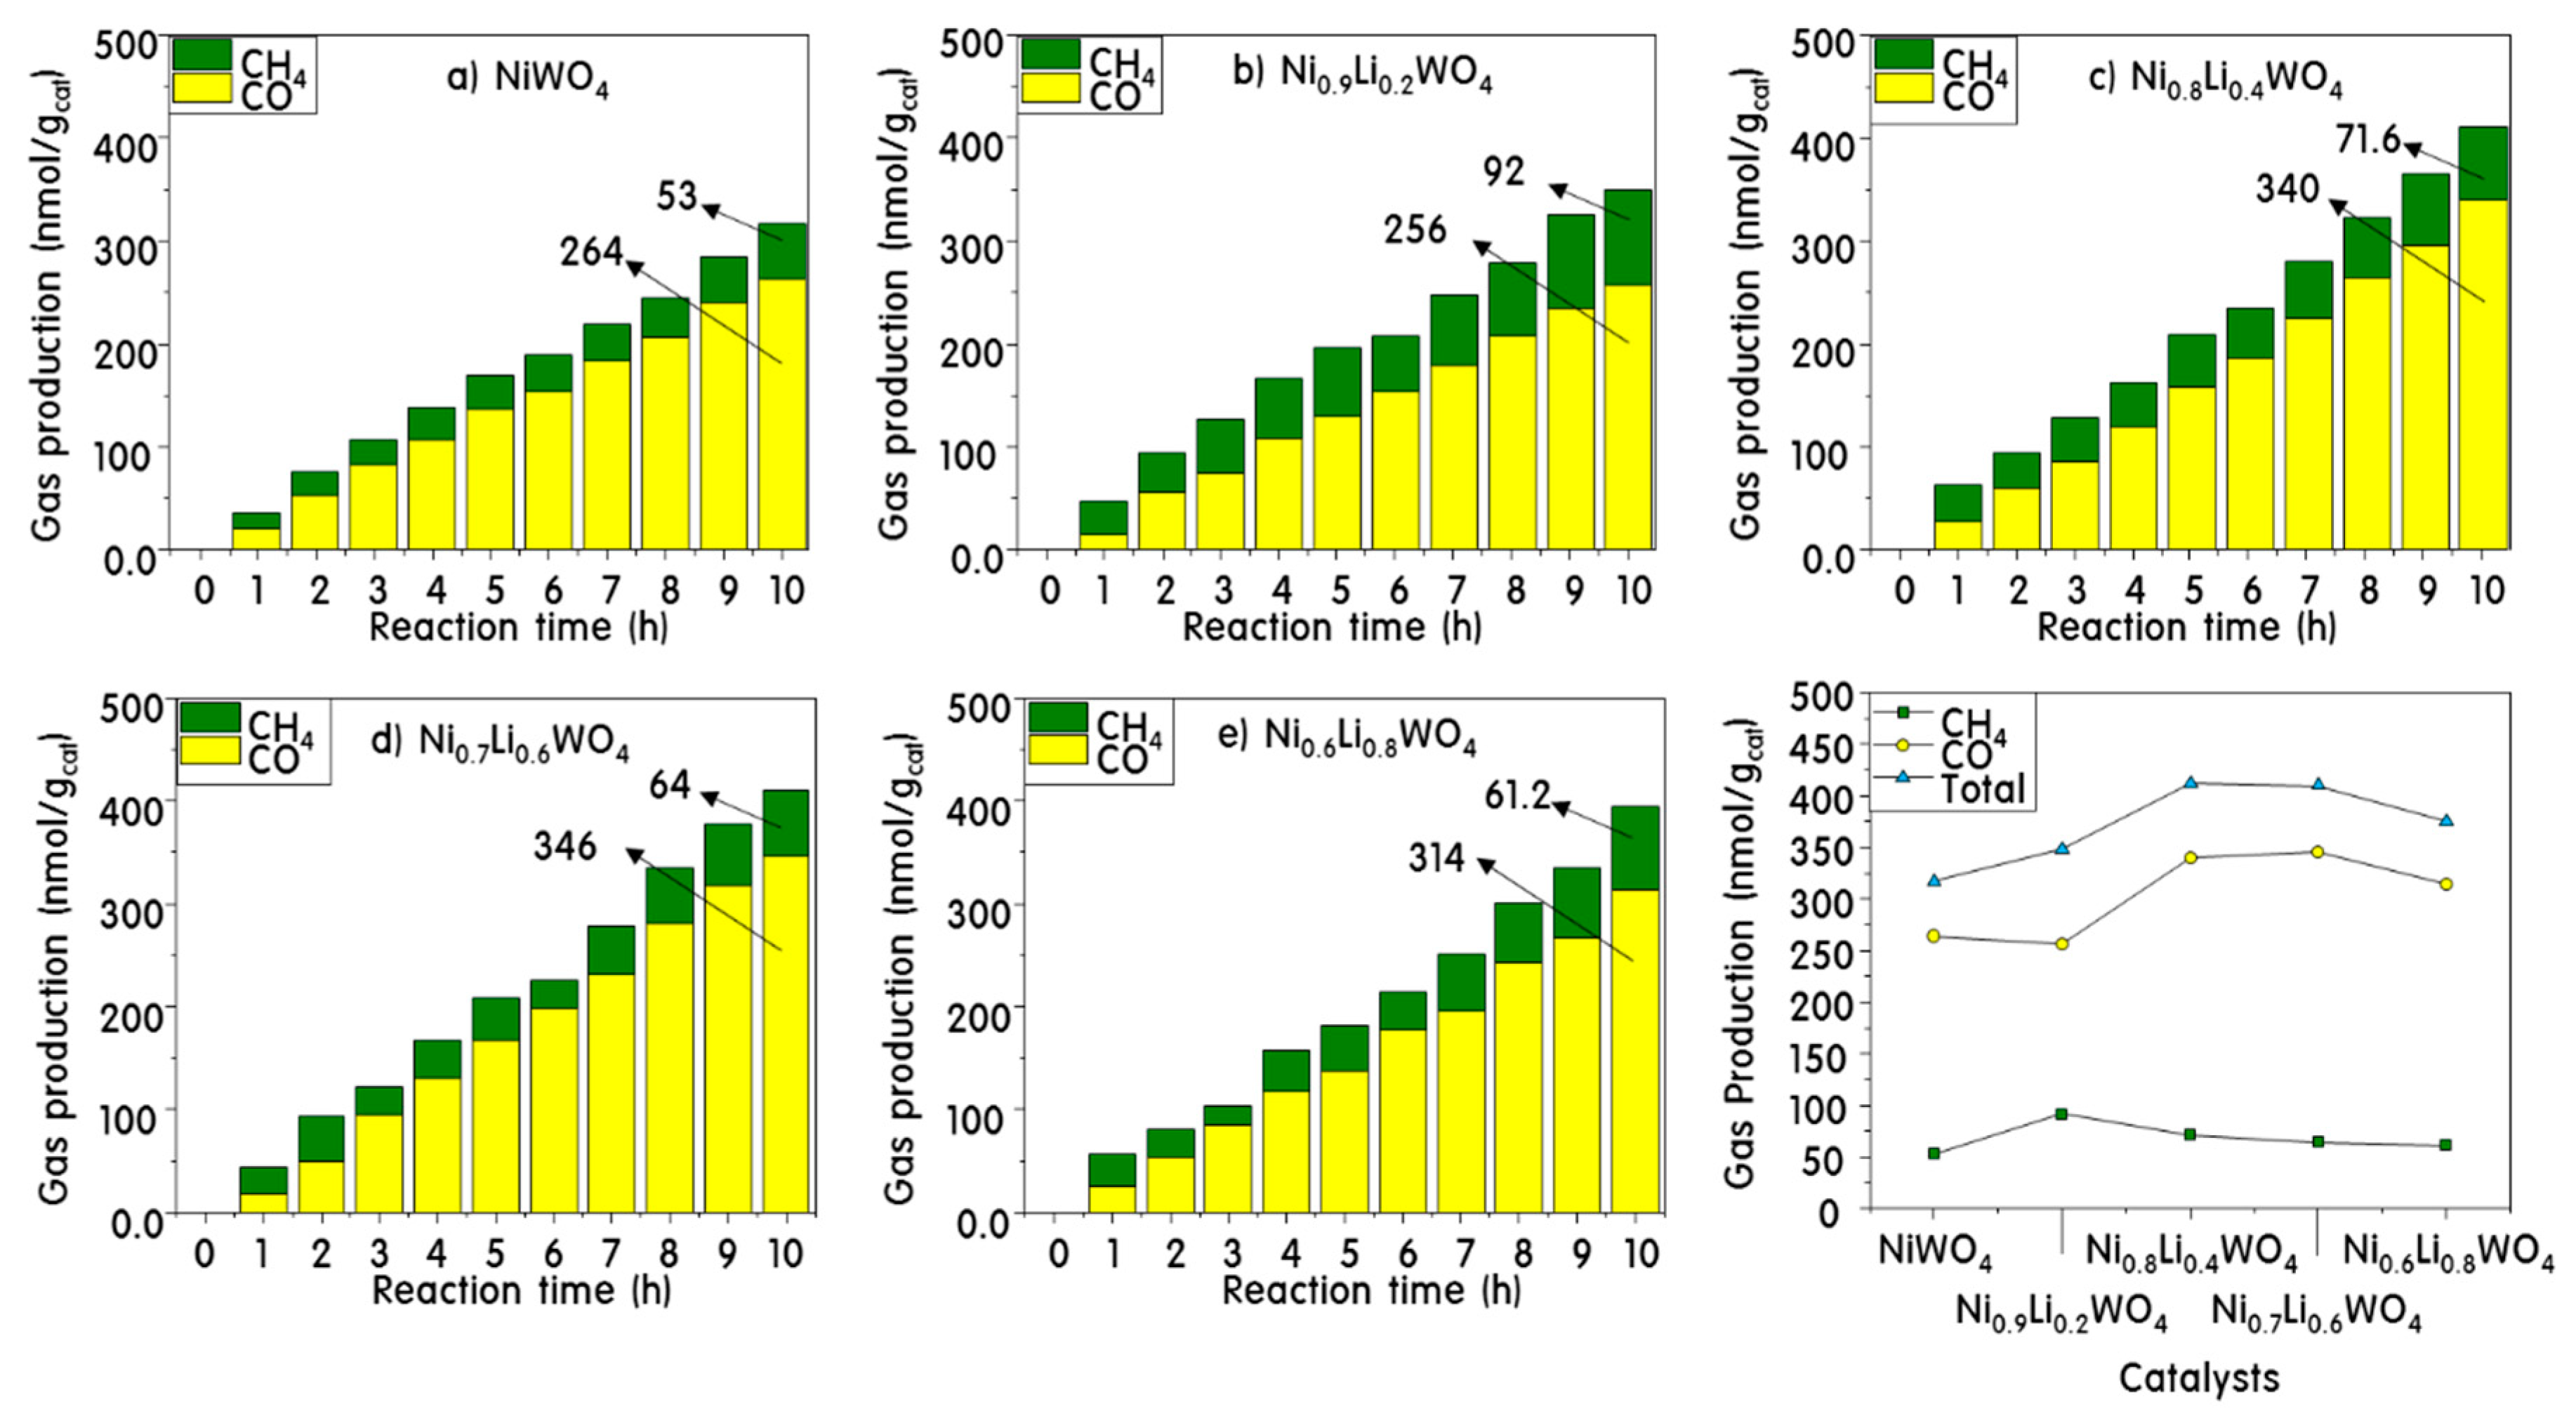
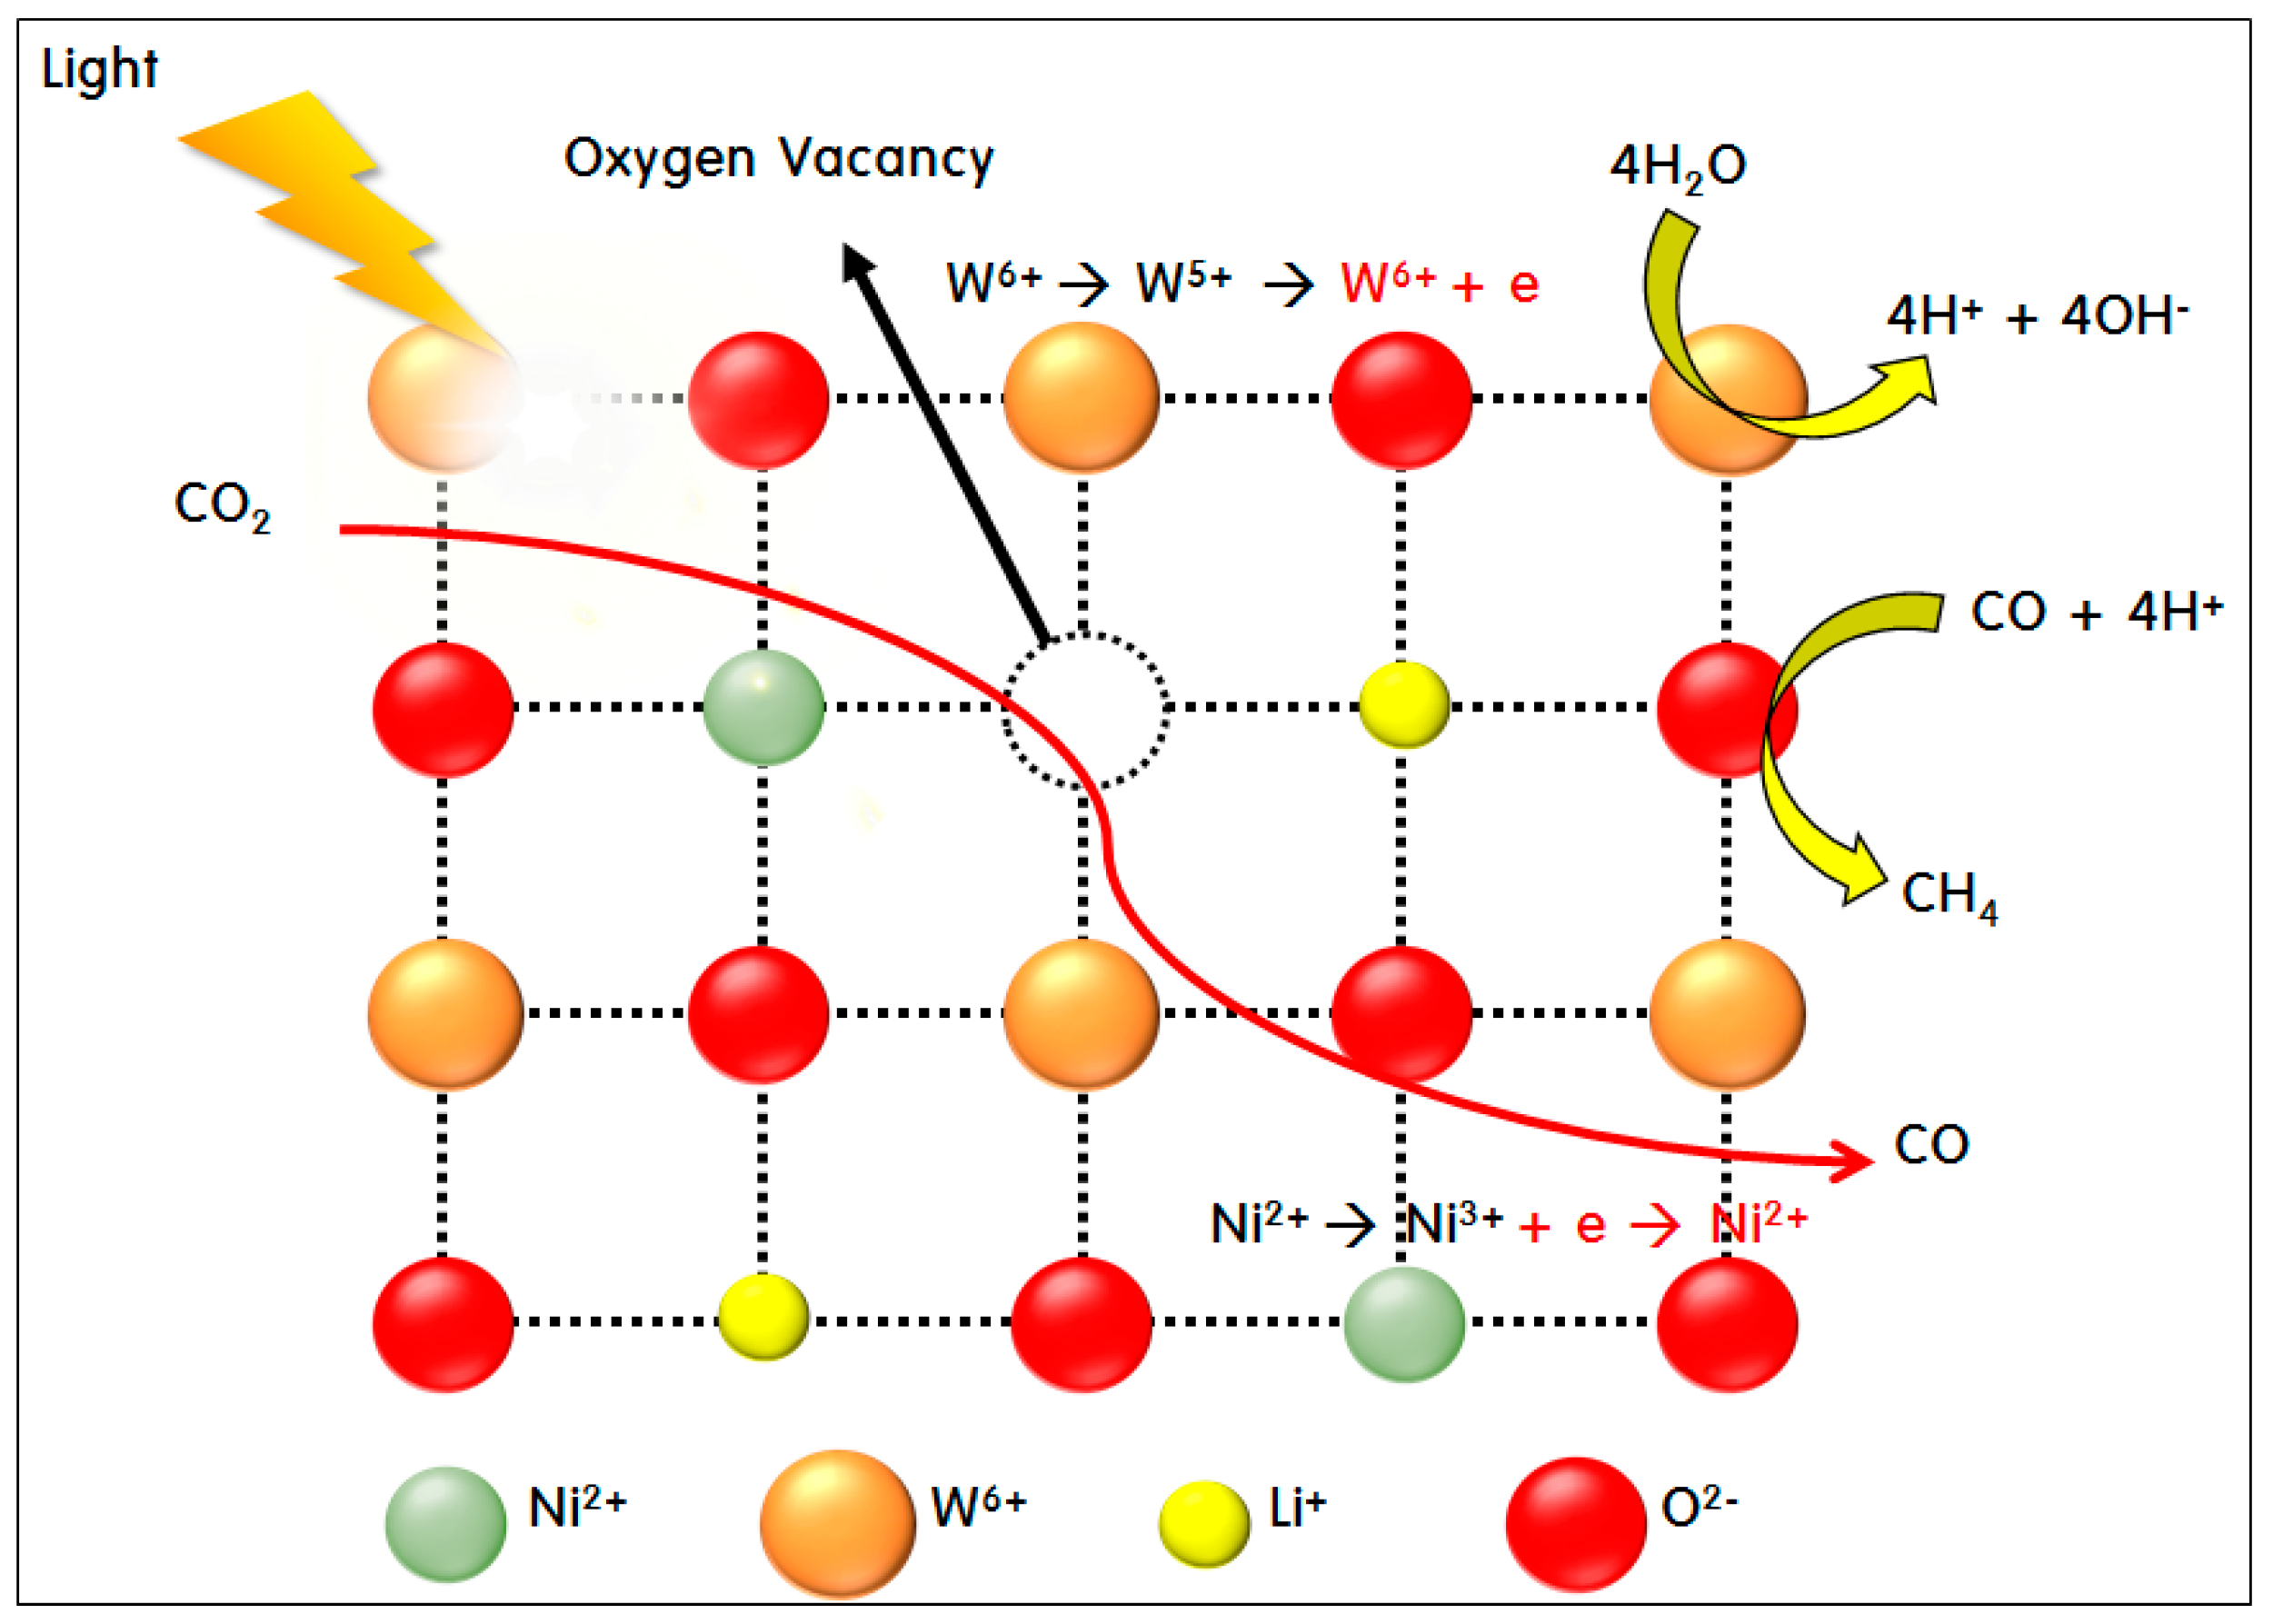
2. Results and Discussion

Characteristics of NiWO4 and Ni1-xLi2xWO4 Particles
Figure 1 shows the X-ray diffraction patterns of the pure NiWO4 and Ni1-xLi2xWO4 particles substituted with various molar ratios of Li+ ions. In general, the peak positions in the XRD (X-ray diffraction) pattern of the NiWO4 particles were consistent with those of the monoclinic crystal system (JCPDS No.15-0755) [25]. The obtained patterns also clearly demonstrated the absence of phase impurities. There was no shift of the peaks of the Ni1-xLi2xWO4 crystals despite the addition of Li+, and because no peaks belonging to LiOH, Li2O, or Li2O2 were visible, it is believed the Ni2+ ions in the lattices were successfully substituted by Li+ ions. The peak intensity decreased in proportion to the increase in the amount of Li+ substitution. The crystallite size can be calculated by the Scherrer equation (Equation (1)) based on the characteristic peak at 31˚ [26].
τ = K λ β cos θ
where τ is the mean size of the ordered (crystalline) domains, which may be smaller or equal to the grain size; and K is a dimensionless shape factor, with a value close to unity. The shape factor has a typical value of about 0.9, but varies with the actual shape of the crystallite. λ is the X-ray wavelength; β is the line broadening at full width and half the maximum intensity (FWHM) after subtracting the instrumental line broadening, in radians; and θ is the Bragg angle. The crystal sizes of NiWO4, Ni0.9Li0.2WO4, Ni0.8Li0.4WO4, Ni0.7Li0.6WO4, and Ni0.6Li0.8WO4 were 48.5, 26.6, 25, 25.8, and 27.5 nm, respectively, as determined from this equation. As the amount of Li ions increased, the size of the crystals first became smaller and then increased. Generally, when the size of a crystal or a particle decreases, the number of particles per unit area increases, resulting in an increase in the surface area. The large surface area means that the available amount of catalytic reaction sites is increased, and thus the catalytic activity is increased. It is also anticipated that oxygen defects would be formed in the lattice of the Ni1-xLi2xWO4 crystal due to the charge balance effect of the non-stoichiometric charge defects (the Frenkel defects). If the amount of lattice oxygen vacancies is excessive, the resulting unstable structure may cause collapse of the skeleton, but it is well known that a certain degree of oxygen defects in the crystal structure of semiconductor photocatalysts has a favorable effect on the photocatalytic activity [27]. Here, with increasing addition of Li+ ions up to 0.6 mol, the size of the crystallites became smaller. It is considered that the Li ions are interposed between the Ni and W ions, thereby preventing crystallization of NiWO4.
Unfortunately, we could not identify the presence of substituted Li in the Ni1-xLi2xWO4 crystals from the XRD data in Figure 1. XPS (X-ray photoelectron spectroscopy) is a useful surface analysis technique for determining the oxidation states and ratios of metals. However, it only probes a depth of 20 nm into the sample, and thus does not indicate the amount of the elements in the sample as a whole. Nevertheless, XPS is very useful for analyzing substituted metal ions, and not only shows what elements are within a sample, but also the nature of bonding. Typical high-resolution quantitative XPS spectra of the NiWO4 and Ni0.8Li0.4WO4 particles are presented in Figure 2. The Ni 2p3/2 spin orbital photoelectron spectrum showed two signals at binding energies of 855.9 and 857.6 eV (873.5 and 875.3 eV for Ni 2p1/2), respectively, attributed to Ni2+ and Ni3+ in NiWO4. However, most of the Ni is present as Ni2+, and the amount of Ni3+ seems low. For Ni0.8Li0.4WO4, the peaks were slightly shifted to a higher binding energy compared to those of NiWO4 [28], indicating that Ni was in a slightly higher oxidation state. The amount of Ni3+ in Ni0.8Li0.4WO4 was larger than that in NiWO4 because the Ni2+ ions were possibly partially converted to Ni3+ for charge balance when Li+ was substituted into the Ni2+ sites.
The W 4f7/2 and W 4f5/2 spin orbital photoelectrons were located at binding energies of 35.6 and 37.8 eV, respectively, revealing the W6+ oxidation state in NiWO4. Two peaks were observed at binding energies of 35.2 and 37.4 eV in the profile of Ni0.8Li0.4WO4. The Ni 2p peaks of Ni0.8Li0.4WO4 were slightly shifted to lower binding energy compared to those of NiWO4. This indicates that the oxygen atoms around W were released from the crystal lattice, with resulting reduction of the W oxidation state due to substitution of the Li+ ions into the lattice. A W 5p3/2 peak was also observed at 41.2 eV in the profile of Ni0.8Li0.4WO4. Sundberg et al. [29] reported that after sputter cleaning by Ar+ ion bombardment using photon energies of 6 keV, the spectra of sputter-cleaned films included effects of sputter damage, resulting in observation of the W 5p3/2 peak in the W 4f spectral region. The observation of the W 5p3/2 peak in the profile of Ni0.8Li0.4WO4 suggests that the Ni0.8Li0.4WO4 crystal was defective due to the addition of Li+ to the lattice, and moreover, the defects are considered to have resulted in some damage around the W atoms. As mentioned in the discussion of the W 4f and W 5p binding energies, the insertion of Li ions created oxygen defects or vacancies (as Frenkel defects) in the lattice, which resulted in a decrease in the O 1s binding energy. Generally, the O 1s region consists of two main contributions, the O2− state of lattice oxygen (M−O) at 530.6 eV and the O2− state of oxygen defects/vacancies at 531.8 eV in NiWO4 [30]. For Ni0.8Li0.4WO4, the O 1s peak was divided into three peaks at 530.1, 531.6, and 533.5 eV by Gaussian fitting. Notably, the second peak was clearly observed, which means that the number of oxygen deficiencies in the lattice increased greatly due to the Li substitution. The O 1s peak at 533.5 eV is attributed to adsorbed OH/H2O or other oxygen species at the surface of Ni0.8Li0.4WO4 [30]. The third peak in this study plausibly arises from reduction of the W ions and oxidation of the Ni ions by lattice insertion of Li+ ions. At this time, we attribute it to the combination of OH groups or water around the oxidized Ni3+ for charge balance in the crystal. On the other hand, a peak was observed at a binding energy of 53.8 eV in the Li 1s XPS profile of Ni0.8Li0.4WO4, which is attributed to Li+ of Li2O [31]. From this result, it can be confirmed that the Li+ ion is stably substituted in the Ni2+ lattice. The atomic% of the components from elemental analysis via XPS is shown in the table below. The atomic ratio of Ni:W:O in NiWO4 was approximately 1:1:5, which is very close to the quantitative value. However, for Ni0.8Li0.4WO4, the atomic ratio of Li:Ni:W:O was 1.5:1.0:3.0:11.5. The Li present in Ni0.8Li0.4WO4 was approximately 40% of the amount of Ni, which is more than the expected amount (33%). In particular, the total amount of W was large; thus, lower amounts of both Ni and Li ions were considered to be inserted into the WO3 framework. It is, however, recognized that there is a measurement limit for the surface analysis.
Figure 3 shows TEM (Transmission electron microscopy) images of the NiWO4 and Ni0.8Li0.4WO4 particles. In the image of NiWO4, uniform cubic-shaped crystals of about 40−50 nm with almost the same length and width were observed. On the other hand, in the image of Ni0.8Li0.4WO4, widely distributed rectangular-shaped particles with sizes of 10−40 nm were observed. The smaller particle size relative to that of NiWO4 is attributed to slowing of the rate of crystallization of NiWO4 as Li ions are inserted between the Ni and W ions.
In order to observe the surface morphology of the prepared particles, SEM (Scanning electron microscope) images of the NiWO4 and Ni0.8Li0.4WO4 particles were acquired, as shown in Figure 4. The NiWO4 particles were strongly aggregated, which caused the surfaces of the particles to be sintered to each other. However, the image of Ni0.8Li0.4WO4 shows that the particles were separated from each other, with a gap between the particles, and no surface sintering due to aggregation occurred. Thus, it is expected that more of the reaction gases will be adsorbed on the surface of the Ni0.8Li0.4WO4 particles with gaps than on the surface of the dense NiWO4 particles during the reaction. The size of the Ni0.8Li0.4WO4 particles was slightly smaller than that of the NiWO4 particles, as already mentioned in relation to the TEM image.
Figure 5 displays the ultraviolet-visible diffuse reflectance spectra (UV-vis DRS) A) and Tauc plots B) of the NiWO4 and Ni1-xLi2xWO4 particles, which were used to determine their bandgaps. According to de Oliveira et al. [32], NixWOy has absorption bands at 1.48, 1.67, 2.74, and 3.7 eV due to the transitions from the 3A2g state to the 3T2g, 1Eg, 3T1g, 1T2g and 3T1g excited states, respectively. In the present work, absorbance maxima were observed at 740 nm (1.68 eV), 515 nm (2.40 eV), 455 nm (2.73 eV), 360 nm (3.44 eV), and 275 nm (4.50 eV) (Figure 5A), where the first two low-intensity bands correspond to the blue range and the high intensity fourth and fifth bands are in the ultraviolet range. The middle band is located in the visible range. These bands were assigned to Ni2+ and charge transfer between clusters [33]. The bands at 2.40 and 3.44 eV are assigned to the forbidden electronic transitions from 3A2g to 1Eg and 1T2g, respectively, and the last band at 4.50 eV is related to a charge transfer transition [34]. During the electronic transition, an oxygen 2p electron moves into one of the empty tungsten 5d orbitals. Thus, the band at 2.73 eV could be assigned to the 3A2g to 3T1g transition in the Ni2+ crystals. Additionally, it was concluded that the band at 1.68 eV is assigned to the presence of Ni2+Ox, indicating that Frenkel defects are present in NiWO4, with the dislocation of Ni2+ from octahedral to tetrahedral sites [35]. In particular, as the amount of Li+ added increased, the number of defects became larger. As the amount of Li+ increased, the forbidden peaks disappeared, leaving only three specific absorption peaks that were slightly shifted toward a longer wavelength. On the other hand, as shown in Figure 5A, the bandgap was specified as the maximum point, whereas in Figure 5B, the Tauc plot was drawn to ensure accuracy of the bandgap. An extension line from the tangent line was drawn by extrapolation to the third absorption peak for all samples, and the vertex of the cross with the horizontal line was found. The point was drawn down along the x axis to determine the bandgap. Thus, it was concluded herein that the bandgaps of NiWO4, Ni0.9Li0.2WO4, Ni0.8Li0.4WO4, Ni0.7Li0.6WO4, and Ni0.6Li0.8WO4 were 2.48, 2.47, 2.45, 2.43, and 2.42 eV, respectively, which corresponds to 3A2g to 3T1g absorptions as determined from the Tauc plot presented in Figure 5B. Generally, it is known that as the bandgap of a catalyst becomes narrower, electrons can be easily excited by weak light, thereby increasing the initial photocatalytic activity.
However, the electrons excited into the CB of the particle relax again and recombine with the holes. It is also possible that non-radiative recombination occurs. The analytical method for measuring this relaxation of photoelectrons is photoluminescence (PL), as shown in Figure 6. The electrons excited at 365 nm underwent radiative relaxation with emission at 410 nm. For the pure NiWO4 crystals, a large phosphorescence peak appeared at 410 nm and a small fluorescence peak was observed at 470 nm. The broad PL peak around 550 nm may be due to interference between the luminescence bands of the WO3 groups [36]. However, for Ni0.8Li0.4WO4 with added Li+ ions, the intensity of the PL peaks at 410 and 470 nm was very low. This is believed to be due to electron capture [37] due to defects in the Ni0.8Li0.4WO4 crystals or due to the intercalation phenomenon [38] with other adjacent phases. In any case, the number of excited electrons that recombined with the holes would be reduced, ultimately increasing the activity of the photocatalyst.
In general, photocatalytic activity is known to be promoted by effective separation of charge [39]. If the excited electrons flow well on the surface of the catalyst, charge separation between the electrons and holes will be adequate, which helps to maintain the redox reaction in the VB and CB. Analysis of the photocurrent density is the method for measuring the degree of current flow on the catalyst surface; the corresponding data are presented in Figure 7. A larger current density means that more electrons flow through the surface without recombining with the holes. For NiWO4, the current density was 250 nA cm−2 after the 5th cycle. The current density increased with increasing Li+ ion doping, and reached the maximum of 450 nA cm−2 at Ni0.8Li0.4WO4, followed by a decrease. From these results, we predicted that Ni0.8Li0.4WO4 with the highest current density should exhibit the best photocatalytic activity. The results are also consistent with the PL results in Figure 6.
Figure 8 shows the CO2 gas-adsorption capacity of the NiWO4 and Ni0.8Li0.4WO4 particles. The particles were treated at 300 °C for 30 min to remove impurities, and CO2 gas was adsorbed at 50 °C for 2 h. The temperature was increased to 550 °C at a rate of 10 °C min−1 to determine the desorption amount. For pure NiWO4, small desorption peaks appeared near 300, 380, and 470 °C, but were difficult to distinguish from the noise. However, the desorption peaks were surprisingly large at 380 and 450 °C for the Ni0.8Li0.4WO4 particles. Plausibly, the amount of CO2 gas adsorbed increased with increasing Li+ content. The incorporation of Li+ into the lattice increases the amount of oxygen vacancies in the lattice due to charge balancing. It was concluded that more oxygen vacancies provided more attractive areas for CO2 gas in the particles.
Figure 9 shows the results of the reduction reaction of CO2 and H2O under 450 nm irradiation. As expected from the properties, after 10 h of reaction on the NiWO4 catalyst, 264 nmol g−1 of CO as the primary reduction product and 53 nmol g−1 of CH4 as the final product were generated. The amount of product gradually increased with the amount of Li+ incorporated into the catalyst. In particular, the yield of CH4 was increased markedly to 92 nmol g−1 with the Ni0.9Li0.2WO4 catalyst containing 0.2 mol of Li+. However, the total amount of product increased linearly with increasing Li+ ion incorporation, but the yield of CH4 was slightly lowered. This is presumably because as Li+ was incorporated into the lattice, the Frenkel crystal defects increased, oxygen vacancies were generated, and the oxygen of CO2 was inserted into this space, eventually increasing the CO production. Overall, it is expected that lattice defects will affect the conversion of CO2 to CO, but not the reaction for CH4 generation. For Ni0.8Li0.4WO4, the maximum total amount of reduction product generated was 412 nmol g−1.
Finally, we present a mechanism for the photoreduction of CO2 on Ni1-xLi2xWO4 under visible-light irradiation (Scheme 1). The products are generated by a two-electron mechanism [40]. In the first stage, Ni0.8Li0.4WO4 absorbs visible light, and electrons are transferred from the VB to the CB. Here, CO2 gas is adsorbed on the oxygen vacancies and desorbed with the loss of an O atom. Thus, CO2 is easily reduced to CO, or electrons are trapped by the oxygen vacancy, leading to effective charge separation, and thus the photocatalytic performance can be maintained for a long time. On the surface of WO3, H2O is decomposed to produce H+, and four H radicals react with CO to produce CH4 on the surface of NiO. The stoichiometric conversion of CO2 to CH4 occurs via the following reaction:
CO2 + 4H2O → CH4 + 2H2O + 2O2

3. Materials and Methods

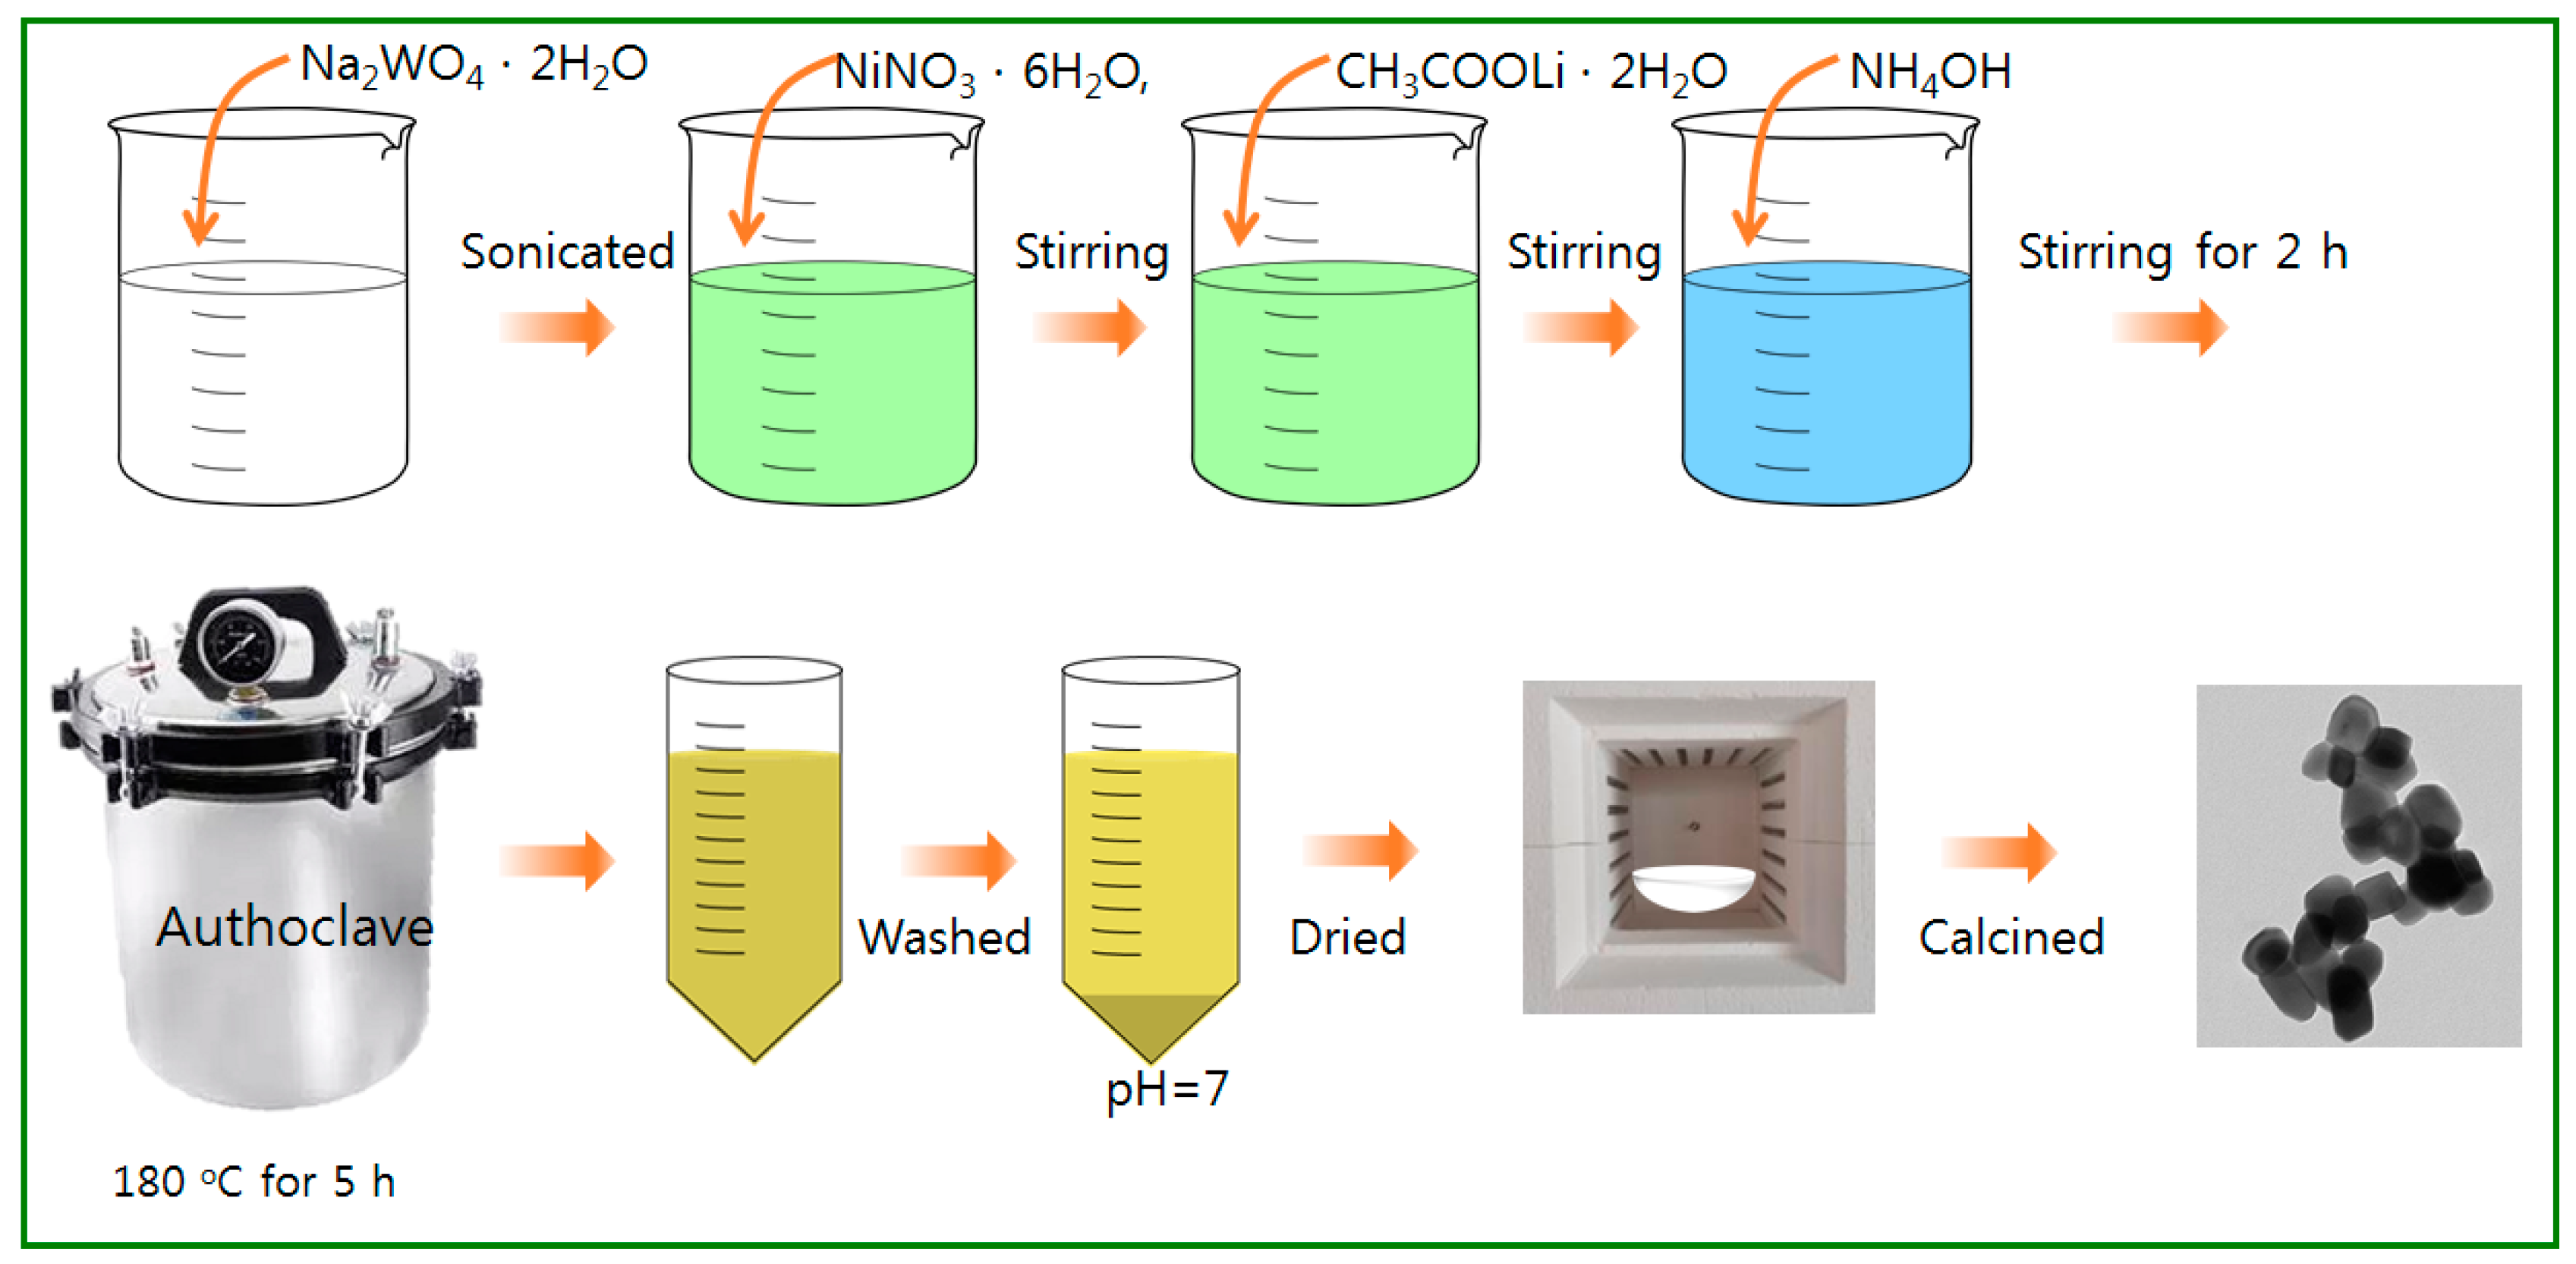
3.1. Synthesis of NiWO4 and Ni1-xLi2xWO4 Particles

The NiWO4 and Ni1-xLi2xWO4 particles were prepared by using a typical hydrothermal method, as shown in Figure 10. For the sol-mixtures, nickel nitrate (Ni(NO3)2·6H2O, 99.99%, Junsei Chem., Tokyo, Japan), sodium tungstate (Na2WO4·2H2O, 99.99%, Junsei Chem., Tokyo, Japan), and lithium acetate (CH3COOLi·2H2O, 99.99%, Junsei Chem., Tokyo, Japan) were used as the Ni, W, and Li precursors, respectively. As the first step for NiWO4 synthesis, Na2WO4·2H2O (1.0 mol) was dissolved in distilled water (600 mL), and after sonication for 10 min, Ni(NO3)2·6H2O (1.0 mol) was dropped in the mixed solution with stirring. NH4OH was added to the mixture in the next step to fix the pH at 9.0, and the solution was stirred to homogeneity for 2 h. The final solution was moved to an autoclave for thermal treatment at 180 °C for 5 h under a nitrogen environment. After thermal treatment, the resulting precipitate was washed with deionized water and ethanol several times and dried at 80 °C for 24 h. Finally, the obtained power sample was calcined in air at 600 °C for 6 h for crystallization. As the second step for the synthesis of Ni1-xLi2xWO4, the process was carried out as for the synthesis of NiWO4, but the atomic molar percentages of Li and Ni ions in the starting materials was adjusted to Ni:Li = 0.9:0.2, 0.8:0.4, 0.7:0.6, and 0.6:0.8, corresponding to 1.0 mol of W ions. Consequently, five kinds of particles, represented as NiWO4, Ni0.9Li0.2WO4, Ni0.8Li0.4WO4, Ni0.7Li0.6WO4, and Ni0.6Li0.8WO4, were synthesized in this study.

3.2. Characterization of NiWO4 and Ni1-xLi2xWO4 Particles

The structures and shapes of the crystals of the synthesized NiWO4, Ni0.9Li0.2WO4, Ni0.8Li0.4WO4, Ni0.7Li0.6WO4, and Ni0.6Li0.8WO4 particles were identified by X-ray diffraction (XRD, X’Pert Pro MPD PANalytical, nickel-filtered Cu-Kα (λ =1.5406 Å), 30 kV, 15 mA, 2θ = 10−80˚) and transmission electron microscopy (TEM, H-7600, Hitachi, Tokyo, Japan). The X-ray photoelectron spectra (XPS) of the NiWO4 and Ni0.8Li0.4WO4 particles were obtained using a Kratos Axis Nova instrument using monochromatic Al-Kα radiation (225 W, 15 mA, and 15 kV). To evaluate the optical properties, diffuse reflectance ultraviolet–visible spectrometry (DR-UV–Vis, Neosys-2000, Scinco Co., Daejeon, Korea, wavelength of 200−800 nm), photoluminescence spectroscopy (PL, Perkin Elmer, He–Cd laser source, wavelength of 320 nm), and photocurrent (2000 solar simulator, ABET Tech., Milford, CT, USA) analyses were performed. To confirm the amount of CO2 adsorbed on the surfaces of the catalysts, CO2-TPD experiments (BEL Japan Inc., Osaka, Japan) were conducted.

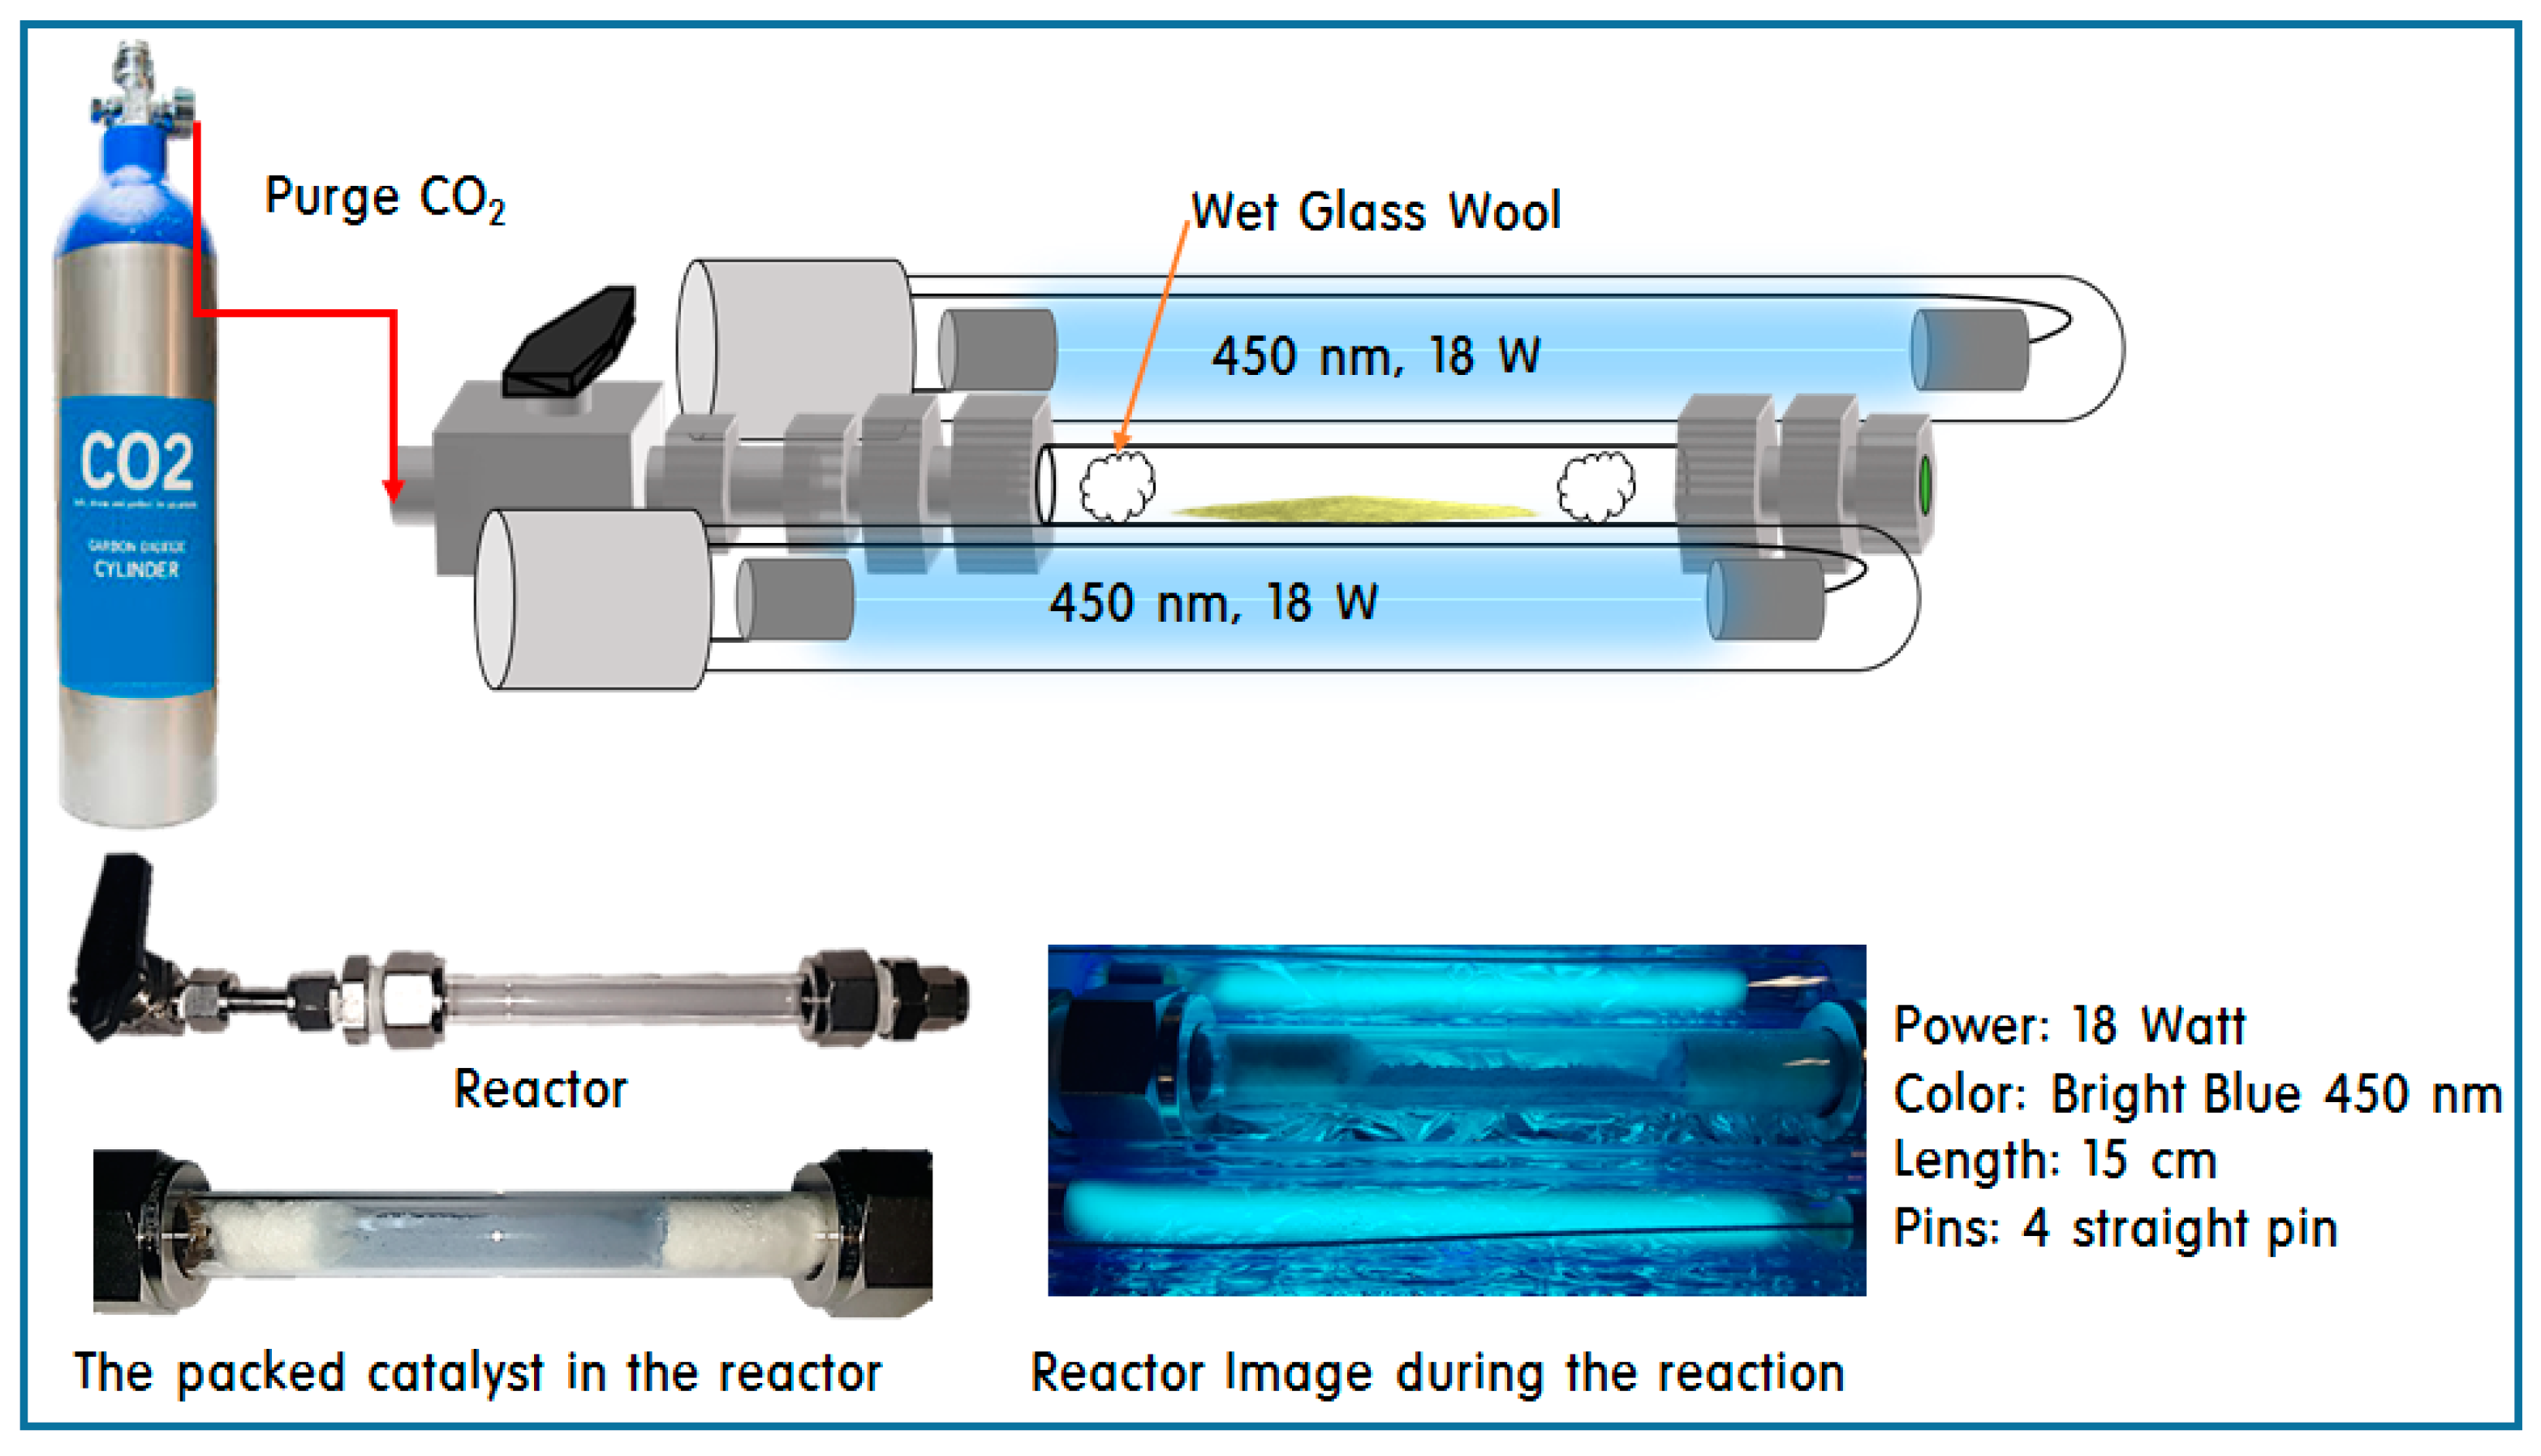
3.3. CO2 Photoreduction on NiWO4 and Ni1-xLi2xWO4 Particles

The CO2 photoreduction activities of the synthesized NiWO4, Ni0.9Li0.2WO4, Ni0.8Li0.4WO4, Ni0.7Li0.6WO4, and Ni0.6Li0.8WO4 particles with H2O were analyzed using a closed cylinder type quartz vessel (length: 15.0 cm; diameter: 1.0 cm; total volume: 12.50 mL). Figure 11 presents a schematic diagram of the photoreactor. Here, 0.2 g of the catalyst and 40.0 mL of distilled water were placed in the photoreactor. Supercritical fluid-grade CO2 gas was used as the reactant, and the chamber was purged with CO2 gas to remove the air before irradiation. The reactor chamber was then closed and the lamp was switched on. A bright-blue lamp (18 W cm−2 × 2ea, Shinan, Pochon, Korea) emitting at 450 nm was used as the irradiation source. The photoreduction was carried out at room temperature and atmospheric pressure. The product gases were analyzed using a gas chromatography (GC; Master GC, SCINCO, Daejeon, Korea) instrument equipped with thermal conductivity (TCD) and flame ionization detectors (FID) to separate the C1–C3 light hydrocarbons and oxygenated compounds, such as CH4, CH3OH, HCHO, HCOOH, and CO. The product selectivity was calculated using Equation (3):
Ci (%) = Ci moles of the product/total moles of C produced × 100%

4. Conclusions

The aim of this study was to improve the photoreduction of CO2 by employing Ni1-xLi2xWO4 particles substituted with Li+. The conversion of CO2 to CO (the rate-determining step in the CO2 reduction reaction) was accelerated with this catalyst. Notably, the Ni0.8Li0.4WO4 catalyst showed the best performance under UV irradiation because Li+ was stably substituted into the lattice surface of NiWO4 at the oxygen defect sites. The Ni0.8Li0.4WO4 catalyst provided the maximal CO2 adsorption capacity, and PL and photocurrent analyses confirmed that excellent charge separation was achieved on the catalyst. Based on these results, we believe that the oxygen vacancies in the lattice can contribute greatly to controlling the products of the photoreaction.

Author Contributions

Conceptualization, M.K.; Data curation, J.S. and J.Y.D.; Formal analysis, J.S., R.K. and N.S.; Investigation, M.W.S. and J.C.; Methodology, N.K.P., H.-J.R. and Y.-S.Y.; Supervision, M.K.; Writing—original draft, M.K.; Writing—review & editing, M.K.

Funding

This work was conducted under framework of the research and development program of the Korea Institute of Energy Research (B9-2446), and was supported by the Energy Efficiency and Resources Programs of the Korea Institute of Energy Technology Evaluation and Planning (KETEP), granted financial resources from the Ministry of Trade, Industry and Energy, Korea (20163010 050080).

Conflicts of Interest

The authors declare no conflict of interest.

References

  1. Huang, C.H.; Tan, C.S. A Review: CO2 Utilization. AAQR 2014, 14, 480–499. [Google Scholar] [CrossRef]
  2. Lee, B.Y.; Park, S.H.; Lee, S.C.; Kang, M.; Park, C.H.; Choung, S.J. Optical properties of Pt-TiO2 catalyst and photocatalytic activities for benzene decomposition. Korean J. Chem. Eng. 2003, 20, 812–818. [Google Scholar] [CrossRef]
  3. Liu, X.; Ye, L.; Liu, S.; Li, Y.; Ji, X. Photocatalytic Reduction of CO2 by ZnO Micro/nanomaterials with Different Morphologies and Ratios of {0001} Facets. Sci. Rep. 2016, 6, 38474. [Google Scholar] [CrossRef] [PubMed]
  4. Yang, H.; Huang, Y.; Deng, J.; Wu, Y.; Han, N.; Zha, C.; Li, L.; Li, Y. Selective electrocatalytic CO2 reduction enabled by SnO2 nanoclusters. J. Energy Chem. 2019, 37, 93–96. [Google Scholar] [CrossRef]
  5. Choi, J.; Song, J.T.; Jang, H.S.; Choi, M.J.; Sim, D.M.; Yim, S.; Lim, H.; Jung, Y.S.; Oh, J. Interfacial Band-Edge Engineered TiO2 Protection Layer on Cu2O Photocathodes for Efficient Water Reduction Reaction. Electron. Mater. Lett. 2017, 13, 57–65. [Google Scholar] [CrossRef]
  6. Read, C.G.; Park, Y.; Choi, K.S. Electrochemical Synthesis of p-Type CuFeO2 Electrodes for Use in a Photoelectrochemical Cell. J. Phys. Chem. Lett. 2012, 3, 1872–1876. [Google Scholar] [CrossRef]
  7. Cheng, L.; Xiang, Q.; Liaoa, Y.; Zhang, H. CdS-Based photocatalysts. Energy Environ. Sci. 2018, 11, 1362–1391. [Google Scholar] [CrossRef]
  8. Chen, D.; Zhang, X.; Lee, A.F. Synthetic strategies to nanostructured photocatalysts for CO2 reduction to solar fuels and chemicals. J. Mater. Chem. A. 2015, 3, 14487. [Google Scholar] [CrossRef]
  9. Yadav, H.M.; Kim, J.S. Solvothermal synthesis of anatase TiO2-graphene oxide nanocomposites and their photocatalytic performance. J. Alloy. Compd. 2016, 688, 123–129. [Google Scholar] [CrossRef]
  10. Gomis-Berenguer, A.; Velasco, L.F.; Velo-Gala, I.; Ania, C.O. Photochemistry of nanoporous carbons: Perspectives in energy conversion and environmental remediation. J. Colloid Interface Sci. 2017, 490, 879–901. [Google Scholar] [CrossRef] [Green Version]
  11. Sommers, J.M.; Alderman, N.P.; Viasus, C.J.; Gambarotta, S. Revisiting the behaviour of BiVO4 as a carbon dioxide reduction photo-catalyst. Dalton Trans. 2017, 46, 6404–6408. [Google Scholar] [CrossRef] [PubMed]
  12. Li, Q.; Zhang, L.; Zhao, P.S.; Yin, J.; Xia, J.; Sheng, A.H.; Wang, F.; Wang, Z.; Yin, C.; Lin, J. Retraction: Synthesis of Fe3+-incorporated open-framework gallium borate catalyst for photocatalytic CO2 reduction driven by visible light irradiation. Inorg. Chem. Front. 2019, 6, 632. [Google Scholar] [CrossRef]
  13. Vignesh, K.; Kang, M. Facile synthesis, characterization and recyclable photocatalytic activity of Ag2WO4@g-C3N4, Mater. Sci. Eng. B. 2015. Sci. Eng. B. 2015, 199, 30–36. [Google Scholar] [CrossRef]
  14. Lee, H.U.; Lee, S.C.; Won, J.; Son, B.C.; Choi, S.; Kim, Y.; Park, S.Y.; Kim, H.S.; Lee, Y.C.; Lee, J. Stable semiconductor black phosphorus (BP)@titanium dioxide (TiO2) hybrid photocatalysts. Sci. Rep. 2015, 5, 8691. [Google Scholar] [CrossRef]
  15. Pourmortazavi, S.M.; Rahimi-Nasrabadi, M.; Khalilian-Shalamzari, M.; Zahedi, M.M.; Hajimirsadeghi, S.S.; Omrani, I. Synthesis, structure characterization and catalytic activity of nickel tungstate nanoparticles. Appl. Surf. Sci. 2012, 263, 745–752. [Google Scholar] [CrossRef]
  16. Mani, S.; Vediyappan, V.; Chen, S.M.; Madhu, R.; Pitchaimani, V.; Chang, J.Y.; Liu, S.B. Hydrothermal synthesis of NiWO4 crystals for high performance non-enzymatic glucose biosensors. Sci. Rep. 2016, 6, 24128. [Google Scholar] [CrossRef] [PubMed]
  17. Sinelnikov, B.M.; Sokolenko, E.V.; Zvekov, V.Y. The Nature of Green Luminescence Centers in Scheelite. J. Inorg. Mater. 1996, 32, 999–1001. [Google Scholar]
  18. He, H.Y. Luminescence properties of NiWO4 powders and films prepared with novel methods. Mater. Res. Innov. 2008, 12, 138–141. [Google Scholar] [CrossRef]
  19. Bhattacharya, A.K.; Biswas, R.G.; Hartridge, A. Environment sensitive impedance spectroscopy and dc conductivity measurements on NiWO4. J. Mater. Sci. 1997, 32, 353–356. [Google Scholar]
  20. Pandey, P.K.; Bhave, N.S.; Kharat, R.B. Structural, optical, electrical and photovoltaic electrochemical characterization of spray deposited NiWO4 thin films. Electrochim. Acta. 2006, 51, 4659–4664. [Google Scholar] [CrossRef]
  21. Ke, J.; Younis, M.A.; Kong, Y.; Zhou, H.; Liu, J.; Lei, L.; Hou, Y. Nanostructured Ternary Metal Tungstate-Based Photocatalysts for Environmental Purification and Solar Water Splitting: A Review. Nanomicro Lett. 2018, 10, 69. [Google Scholar] [CrossRef]
  22. Opoku, F.; Govender, K.K.; Sittert, C.G.C.E.; Govender, P.P. Charge transport, interfacial interactions and synergistic mechanisms in BiNbO4/MWO4 (M = Zn and Cd) heterostructures for hydrogen production: Insights from a DFT+U study. Phys.Chem.Chem.Phys. 2017, 19, 28401. [Google Scholar] [CrossRef]
  23. Do, J.Y.; Chava, R.K.; Mandari, K.K.; Park, N.K.; Ryu, H.J.; Seo, M.W.; Lee, D.; Senthil, T.S.; Kang, M. Selective methane production from visible-light-driven photocatalytic carbon dioxide reduction using the surface plasmon resonance effect of superfine silver nanoparticles anchored on lithium titanium dioxide nanocubes (Ag@LixTiO2). Appl. Catal. B-Environ. 2018, 237, 895–910. [Google Scholar] [CrossRef]
  24. Chiang, Y.M.; Birnie, D., III; Kingery, W.D. Physical Ceramics: Principles for Ceramic Science and Engineering, 1st ed.; John Wiley & Sons: Hoboken, NJ, USA, 1997; Volume 1, pp. 102–107, ISBN-10: 0471598739. [Google Scholar]
  25. Rico, J.L.; Albiter, M.; Espino, J.; Hargreaves, J.S.J.; Ostroumov, M.; Salcedo, L.I.; Wilson, K. Synthesis and ammonolysis of nickel and cobalt tungstates and their characterization. J. Saudi Chem. Soc. 2016, 20, 405–410. [Google Scholar] [CrossRef]
  26. Jacob, R.; Nair, H.G.; Isac, J. Structural and Morphological Studies of Nanocrystalline Ceramic BaSr0.9Fe0.1TiO4. ILCPA 2014, 41, 100–117. [Google Scholar] [CrossRef]
  27. Zhou, W.; Fu, H. Defect-mediated electron–hole separation in semiconductor photocatalysis. Inorg. Chem. Front. 2018, 5, 1240–1254. [Google Scholar] [CrossRef]
  28. Chen, S.; Yang, G.; Jia, Y.; Zheng, H. Three-dimensional NiCo2O4@NiWO4 core–shell nanowire arrays for high performance supercapacitors. J. Mater. Chem. A. 2017, 5, 1028–1034. [Google Scholar] [CrossRef]
  29. Sundberg, J.; Lindblad, R.; Gorgoi, M.; Rensmo, H.; Jansson, U.; Lindblad, A. Understanding the effects of sputter damage in W–S thin films by HAXPES. Appl. Surf. Sci. 2014, 305, 203–213. [Google Scholar] [CrossRef] [Green Version]
  30. Kushwaha, A.; Aslam, M. Hydrogen-incorporated ZnO nanowire films: Stable and high electrical conductivity. J. Phys. D: Appl. Phys. 2013, 46, 485104. [Google Scholar] [CrossRef]
  31. Xu, J.; Lin, F.; Nordlund, D.; Crumlin, E.J.; Wang, F.; Bai, J.; Doeff, M.M.; Tong, W. Elucidation of the surface characteristics and electrochemistry of high-performance LiNiO2. Chem. Commun. 2016, 52, 4239–4242. [Google Scholar] [CrossRef] [PubMed]
  32. Oliveira, A.L.M.; Ferreira, J.M.; Silva, M.R.S.; Souza, S.C.; Vieira, F.T.G.; Longo, E.; Souza, A.G.; Santos, I.M.G. Influence of the thermal treatment in the crystallization of NiWO4 and ZnWO4. J. Therm. Anal. Calorim. 2009, 97, 167–172. [Google Scholar] [CrossRef]
  33. Valente, J.S.; Orta, M.V.; Herrera, H.A.; Solórzano, R.Q.; Angel, P.; Salgado, J.R.; López, J.R.M. Controlling the redox properties of nickel in NiO/ZrO2 catalysts synthesized by sol–gel. Catal. Sci. Technol. 2018, 8, 4070. [Google Scholar] [CrossRef]
  34. Babu, B.; Sundari, G.R.; Ravindranadh, K.; Yadav, M.R.; Ravikumar, R.V.S.S.N. Structural, spectroscopic and magnetic characterization of undoped, Ni2+ doped ZnO nanopowders. J. Magn. Magn. Mater. 2014, 372, 79–85. [Google Scholar] [CrossRef]
  35. Zawawi, S.M.M.; Yahya, R.; Hassan, A.; Mahmud, H.N.M.E.; Daud, M.N. Structural and optical characterization of metal tungstates (MWO4; M=Ni, Ba, Bi) synthesized by a sucrose-templated method. Chem. Cent. J. 2013, 7, 80. [Google Scholar] [CrossRef] [PubMed]
  36. Harshan, H.; Priyanka, K.P.; Sreedevi, A.; Jose, A.; Varghese, T. Structural, optical and magnetic properties of nanophase NiWO4 for potential applications. Eur. Phys. J. B. 2018, 91, 1–10. [Google Scholar] [CrossRef]
  37. Xiong, G.; Pal, U.; Serrano, J.G. Correlations among size, defects, and photoluminescence in ZnO nanoparticles. J. Appl. Phys. 2007, 101, 024317. [Google Scholar] [CrossRef]
  38. Taira, N.; Saitoh, M.; Hashimoto, S.; Moonc, H.R.; Yoon, K.B. Effect of electron-acceptor strength of zeolite on the luminescence decay rate of Ru(bpy)32+ incorporated within zeolites. Photochem. Photobiol. Sci. 2006, 5, 822–827. [Google Scholar] [CrossRef]
  39. Ma, F.; Yang, Q.; Wang, Z.; Liu, Y.; Xin, J.; Zhang, J.; Hao, Y.; Li, L. Enhanced visible-light photocatalytic activity and photostability of Ag3PO4/Bi2WO6 heterostructures toward organic pollutant degradation and plasmonic Z-scheme mechanism. RSC Adv. 2018, 8, 15853–15862. [Google Scholar] [CrossRef]
  40. Peng, C.; Reid, G.; Wang, H.; Hu, P. Perspective: Photocatalytic reduction of CO2 to solar fuels over semiconductors. J. Chem. Phys. 2017, 147, 030901. [Google Scholar] [CrossRef]
Figure 1. X-ray diffraction patterns of Ni1-xLi2xWO4 particles.
Catalysts 09 00467 g001
Figure 2. Ni 2p, W 4f, O 1s, and Li 1s XPS spectra of NiWO4 and Ni0.8Li0.4WO4 particles, and elemental compositions.
Catalysts 09 00467 g002
Figure 3. TEM images of NiWO4 and Ni0.8Li0.4WO4 particles.
Catalysts 09 00467 g003
Figure 4. SEM images of NiWO4 (a) and Ni0.8Li0.4WO4 (b) particles.
Catalysts 09 00467 g004
Figure 5. UV-vis DRS spectra A) and Tauc plots B) of the NiWO4 and Ni1-xLi2xWO4 particles.
Catalysts 09 00467 g005
Figure 6. PL spectra of Ni1-xLi2xWO4 particles.
Catalysts 09 00467 g006
Figure 7. Photocurrent responses of Ni1-xLi2xWO4 particles.
Catalysts 09 00467 g007
Figure 8. CO2 gas-adsorption capacity of NiWO4 and Ni0.8Li0.4WO4 particles.
Catalysts 09 00467 g008
Figure 9. CH4 and CO product distributions during CO2 photoreduction over NiWO4 (a) and Ni1-xLi2xWO4 (b–e) catalysts.
Catalysts 09 00467 g009
Scheme 1. Mechanism of CO2 photoreduction on Ni1-xLi2xWO4 under UV irradiation.
Catalysts 09 00467 sch001
Figure 10. Synthesis of Ni1-xLi2xWO4 particles by the hydrothermal method.
Catalysts 09 00467 g010
Figure 11. Configuration and schematic of CO2 photoreduction reactor.
Catalysts 09 00467 g011

