Article

Effect of Shale Ash-Based Catalyst on the Pyrolysis of Fushun Oil Shale

1
College of Petroleum Engineering, Liaoning Shihua University, Fushun 113001, China
2
School of mechanics and civil architecture, Northwestern Polytechnical University, Xi’an 710129, China
3
School of Environment, Tsinghua University, Beijing 100084, China
*
Author to whom correspondence should be addressed.
Catalysts 2019, 9(11), 900; https://doi.org/10.3390/catal9110900
Submission received: 6 October 2019 / Revised: 18 October 2019 / Accepted: 24 October 2019 / Published: 28 October 2019

Abstract

:
The effect of shale ash (SA)-based catalysts (SA as carriers to support several transition metal salts, such as ZnCl2, NiCl2·6H2O, and CuCl2·2H2O) on oil shale (OS) pyrolysis was studied. Results showed that SA promoted OS pyrolysis, and the optimum weight ratio of OS:SA was found to be 2:1. The SA-supported transition metal salt catalyst promoted the OS pyrolysis, and the catalytic effect increased with increasing load of the transition metal salt within 0.1–3.0 wt%. The transition metal salts loaded on the SA not only promoted OS pyrolysis and reduced the activation energy required but also changed the yield of pyrolysis products (reduced shale oil and semi-coke yields and increased gas and loss yield). SA-supported 3 wt% CuCl2·2H2O catalyst not only exhibited the highest ability to reduce the activation energy in OS pyrolysis (32.84 kJ/mol) but also improved the gas and loss yield, which was 4.4% higher than the uncatalyzed reaction. The supporting transition metal salts on the SA also increased the content of short-chain hydrocarbons in aliphatic hydrocarbons in shale oil and catalyzed the aromatization of aliphatic hydrocarbons to form aromatic hydrocarbons. The catalytic activity of the transition metal salt on the SA-based catalyst for OS pyrolysis decreased in the order of CuCl2·2H2O > NiCl2·6H2O > ZnCl2.

1. Introduction

Since the 20th century, the massive use of traditional fossil fuel has led to rapid depletion of its reserve. The lack of fossil fuel encourages some countries to develop alternative energy sources, such as synthetic oil from coal and other fossil fuels. For many countries, oil shale (OS) represents a valuable potential source of liquid hydrocarbons and energy. In China, OS resources are estimated at 978 billion tons; of which, OS resources in extensional basins are approximately 632 billion tons, which account for 65% of the China’s total OS resources or approximately 32 billion tons of in situ shale oil [1,2,3,4]. Shale oil has high H/C atomic ratio and is similar to crude oil. OS has become an ideal substitute for fossil fuel [5].
Dry distillation is an attractive conversion method, where OS is converted into different phases, including shale oil, semi-coke, and gas. Many influencing factors, including shale particle size, pyrolysis atmosphere, pyrolysis temperature, heating rate, and residence time, have been studied to improve the production of shale oil and its quality [6,7].
Various types of catalysts have been investigated for the catalytic pyrolysis of OS. Williams et al. [8,9] studied the effect of zeolite catalysts in a two-stage reactor and reported that the catalysts decrease the overall contents of N and S and the yield of the derived Pakistan shale oil. Gai et al. [10] studied the effect of pyrite on OS pyrolysis; inherent pyrite improves the oil yield, but additional pyrite increases the amount of volatiles. Hu et al. [11] found that montmorillonite and gypsum enhance oil formation and minimize residue formation during kerogen pyrolysis, whereas calcite inhibits oil formation. Jiang et al. [12] investigated the catalytic effects of CoCl2 and MnSO4 on OS pyrolysis. The results showed that CoCl2 can function as an activation center to accelerate the decomposition of chemical bonds in organic matter, thereby increasing the shale oil yield. Chang et al. [13] studied the effects of FeCl2·4H2O, CoCl2·6H2O, NiCl2·6H2O, and ZnCl2 on OS pyrolysis by fixed bed and thermogravimetric analyses. These pyrolysis experiments indicated that all transition metal salts can enhance the secondary cracking of shale oil, thereby reducing the oil production and increasing pyrolysis the gas production. Transition metal salts can also catalyze the aromatization of aliphatic hydrocarbons to obtain aromatic hydrocarbons.
Coal chars have a good catalytic effect on coal pyrolysis and can be used as a carrier to support metal chloride and maximize the utilization of its surface. Metal minerals and metal chlorides inside the coal char synergistically lead to heavy tar cracking effect [14,15]. Coal and OS are fossil fuel sources with similar properties. Thus, the solid product shale ash (SA), after pyrolysis or combustion of OS has good catalytic effect similar to coal char. Shi et al. [16] studied the effect of SA on the pyrolysis of Huadian OS. SA exerts a negligible effect on product yield but significant effect on gas and oil components. Lai et al. [17] demonstrated that OS ash has a catalytic effect on the secondary cracking and upgrading of shale oil to facilitate the conversion of the heavy oil fraction to light oil and gas.
Up to now, few studies pay attention to the effect of catalysts loaded with the carrier of Cu and SA on pyrolysis of the OS. Therefore, the mixed pyrolysis behavior of the Fushun OS and SA based catalyst was investigated, as well as the effect of SA loaded with a different transition metal salt (ZnCl2, NiCl2·6H2O, and CuCl2·2H2O) on the pyrolysis behavior and product.

2. Experimental

2.1. Materials

OS and SA were obtained from Fushun City, Liaoning Province, China, and their main properties are shown in Table 1. The OS samples were pulverized by a jaw crusher (Zhengzhou, China) and screened with molecular sieves. The OS sample had a particle size of 40–60 mesh. Before the experiment, the OS samples were washed seven to eight times with deionized water and dried overnight at 80 °C [12,18,19,20]. Transition metal salts such as ZnCl2, NiCl2·6H2O, and CuCl2·2H2O were all analytically pure. The transition metal salt loading referred to herein is the transition metal loading, with values of 0.1, 0.5, 1, and 3 wt%, which are the ratio of transition metal quality to the sum of transition metal and SA. The OS:SA mass ratios were 1:0, 2:1, and 1:1, and the loss of SA in the thermogravimetric and pyrolysis experiments was considered negligible. SA-based catalysts were prepared by equal-volume impregnation.
The sample with SA-based catalyst mixed with OS was denoted as OS–SA–Q, where Q represents the type of the transition metal element used. For example, OS–SA refers to an OS sample mixed with OS and SA, and OS–SA–Ni refers to an OS sample mixed with OS and SA-loaded NiCl2·6H2O. Furthermore, the pyrolyzed semi-coke sample is denoted as M–SC, where M represents the pyrolyzed sample used. For example, OS–SA–SC refers to a semi-coke sample, and SC refers to a semi-coke after pyrolysis with OS alone.
The components of Fushun OS and SA were analyzed by X-ray diffraction (XRD). The XRD spectrum indicated that the minerals in the OS were mainly composed of quartz and aluminosilicates, of which the aluminosilicates included kaolinite and illite. In addition, a small amount of carbonates, such as siderite, existed. The composition of SA was mainly composed of SiO2, and the signals of Fe2O3 and MnO2 could also be clearly detected. However, some metal oxides or salts may not be crystallized after high-temperature treatment; as such, even high levels cannot be detected by XRD analysis. In addition, some peaks overlap and cannot be fully recognized [16]. In this regard, SA composition was also analyzed by X–ray fluorescence (Table 2).
Table 2 shows that Fushun SA was mainly composed of SiO2, Al2O3, and Fe2O3, which account for 91.6% of the total composition. Small amounts of K2O, MgO, TiO2, and CaO were also present.

2.2. OS Pyrolysis

Thermal behavior analysis: As one of the most important thermochemical methods, thermogravimetric analysis was applied to observe changes in the pyrolysis behavior of OS samples with/without SA-based catalysts. The thermal analyzer used (US TA company, Shenyang, China) has microbalance sensitivity of less than ±0.1 °C and temperature accuracy of ±0.5 °C. In each experiment, the initial weight of the sample loaded into the crucible was 10 ± 0.5 mg to avoid heating transfer limitation, and then was set to increase the temperature from room temperature to 900 °C at a heating rate of 10 °C/min. The Ar, as carrier gas and shielding gas, was maintained at 50 and 20 mL/min during the whole experiment process to ensure the inert atmosphere. The influence of buoyancy and weight loss of the crucible was calibrated by the baseline carried out with a blank experiment before the sample experiment. To ensure the reasonable reproducibility, all the potentiodynamic polarization tests were normally repeated at least three times under the same condition. The conversion rate formula used in the thermogravimetric analysis is as follows.
α   =   m 0 m t m 0 m ,
where m0 is the initial mass of the oil shale, mt is the remaining mass of the oil shale at time t, and m is the mass of the final non-decomposable residue.
Pyrolysis experiment: A homemade fixed bed pyrolysis device was used. The device was mainly composed of five parts, namely, a feeding device, a pyrolysis device, a condensing device, a drying device, and a gas analysis device. The pyrolysis unit was decomposed into a three-part pyrolysis furnace. Cool water was added to the furnace mouth and tail to ensure appropriate operation of the unit. In each experiment, the samples (10 ± 0.5 g) were placed in a pyrolysis furnace and purged with N2 to ensure the inertness of the pyrolysis atmosphere. The temperature was then raised at a rate of 5 °C/min from room temperature to 520 °C, which was maintained for 20 min. The volatile products formed by pyrolysis were purged by N2 into the system for condensation. The non-condensable gas was passed through an infrared in-line analyzer after drying for real-time detection. The yield of the pyrolysis product was then obtained according to the work of Jiang et al. [12].

2.3. Analytical Methods

The characteristics of shale semi-coke and shale oil were analyzed by Fourier transform attenuated total reflection infrared spectroscopy (ATR–FTIR, Nicolet iS50 model, Shanghai, China). Spectral recording was conducted between 400 and 4000 cm−1 with a spectral resolution of 4 cm−1. An Agilent 7890A gas chromatograph equipped with an Agilent 5975C mass spectrometer (Shenyang, China) was used to detect the chemical composition of the product.

3. Results and Discussion

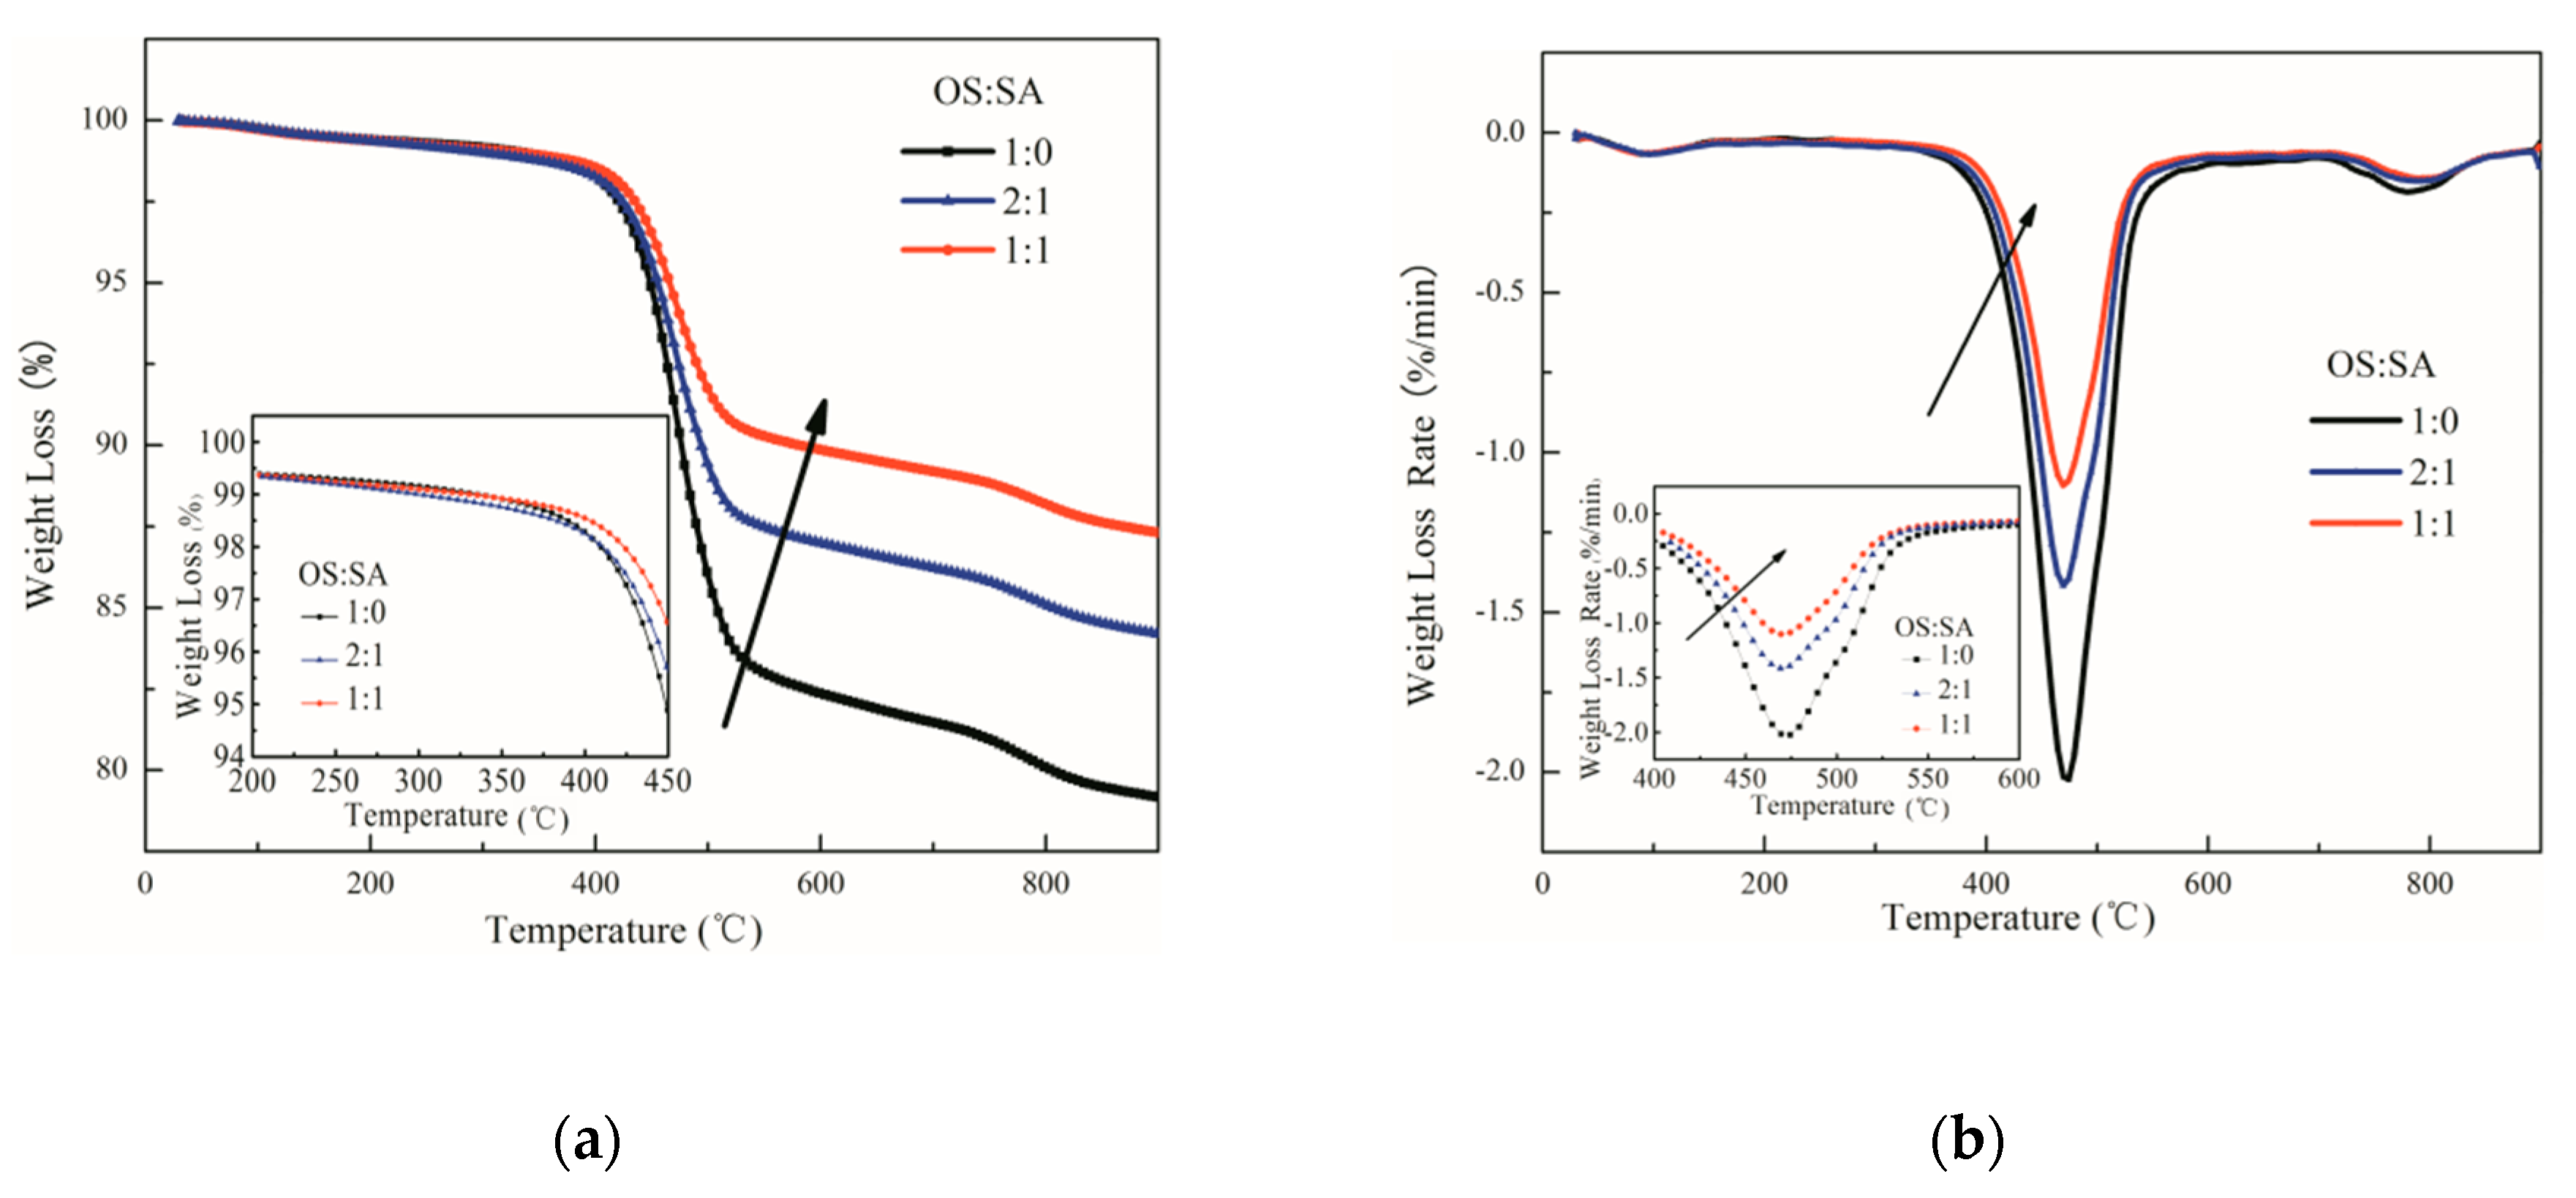
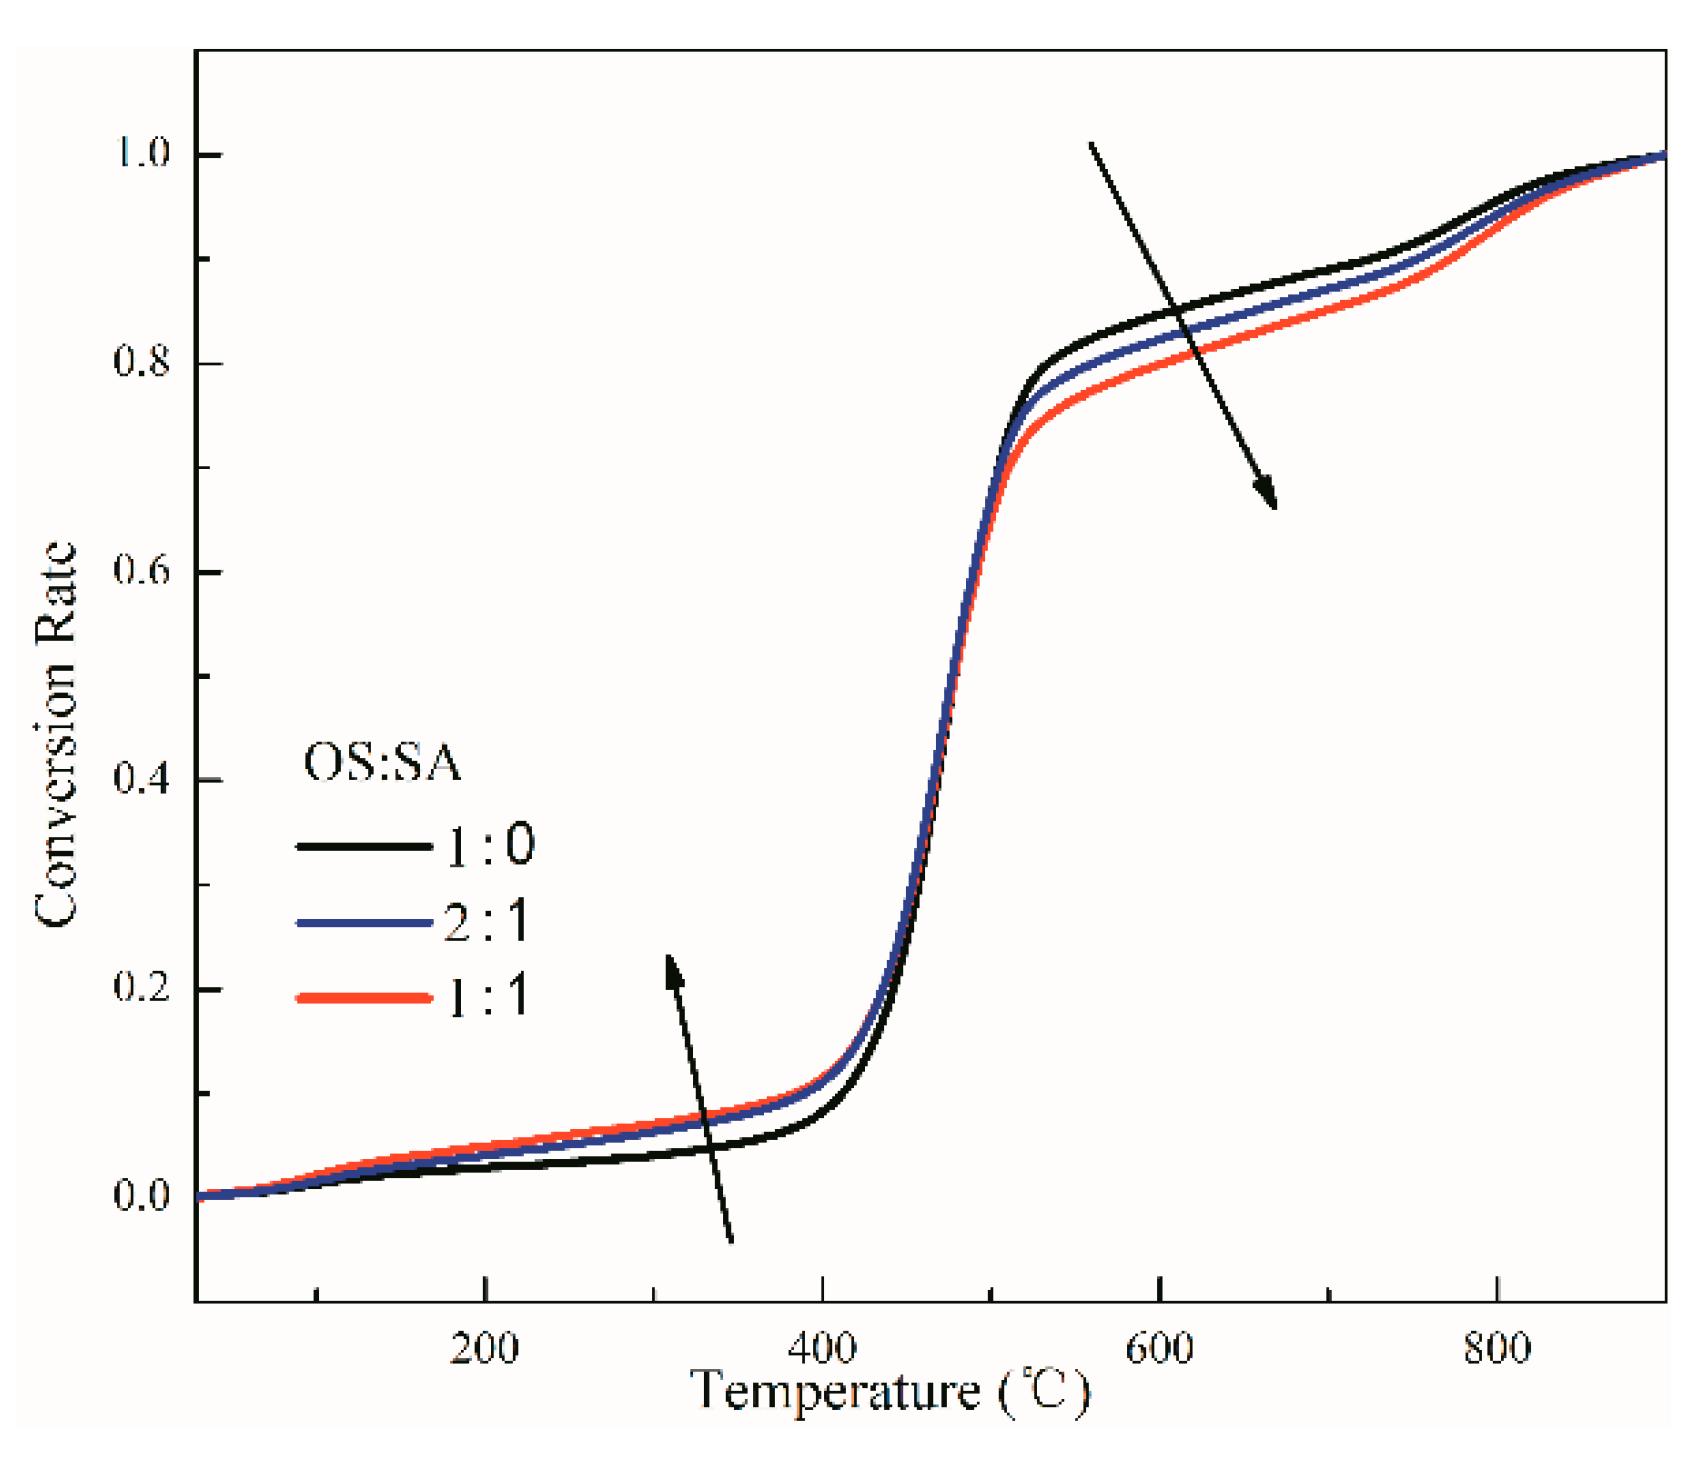
3.1. Influence of SA Content on OS Pyrolysis

Figure 1 shows the TG (Thermal Gravity) and DTG (Differential Thermal Gravity) curves of the mixed pyrolysis of OS and SA. The TG curve shows that the thermal decomposition of the OS sample without catalysts could be outlined in three stages. The first stage, which occurred from room temperature to 300 °C, mainly involved the dehydration of water. A drum wind drying oven was used prior to the trial, and the weightlessness was relatively gentle. The second stage occurred from 300 °C to 600 °C, at which the weight loss rate was as high as 16.8 wt%, accounting for 80.6 wt% of the total weight loss. Therefore, the second stage was the main stage of thermal decomposition. The third stage occurred from 600 °C to 900 °C, at which organic matter was completely degraded. The decomposition reaction of some clay minerals and siderite was observed [21] but was relatively weak. This finding indicates that the Fushun OS contained less carbonate minerals [22], which conforms to the XRD analysis results.
Figure 1 shows the same trends of the three TG and DTG curves. In the TG curve, the total weight loss rate of pyrolysis gradually decreased with gradually increasing SA content because of the dilution of OS organic matter as the SA ratio increased. Moreover, the volatile matter remained in the pyrolysis system for a long time, resulting in a secondary reaction and changing the oil yield and composition. The secondary reaction of volatile materials during diffusion in the reactor is primarily due to the coking of the hydrogen-depleted species and the cracking of the aliphatic portion [23]. The coking causes the shale oil to form solid product or coke, which is dominant at relatively low temperatures such as below 450 °C [24,25]. The catalytic action of SA caused the cracking and coking of organic matter at relatively low temperatures.
The DTG curve shows that the maximum weight loss rate gradually decreased as the SA ratio increased. The corresponding temperature was approximately 5 °C lower than that at the maximum weight loss rate of OS when the OS:SA ratio was 2:1. However, when the ratio of OS: SA was 1:1, the decreasing temperature at the maximum weight loss rate was less than 5 °C. Thus, the ratio of OS:SA quality was 2:1.
Figure 2 shows the conversion curves for different mass ratios of OS:SA. The graph shows that at less than 434 °C, the conversion rate of OS gradually increased as the SA ratio increased; the conversion rate of OS:SA (2:1) was higher than the other two at 434–500 °C. At greater than 500 °C, the conversion rate of the individual OS pyrolysis was the largest possibly because of the good thermal conductivity of SA [26], resulting in rapid decomposition of the organic matter of OS containing a high ratio of SA; most of which was decomposed at lower than 500 °C. Above this temperature, the decomposition of minerals in the OS mainly occurs.
In summary, SA as a catalyst promoted OS decomposition. However, the SA ratio should not be large. When SA was used as the supported metal catalyst, the optimum ratio of OS:SA was 2:1.

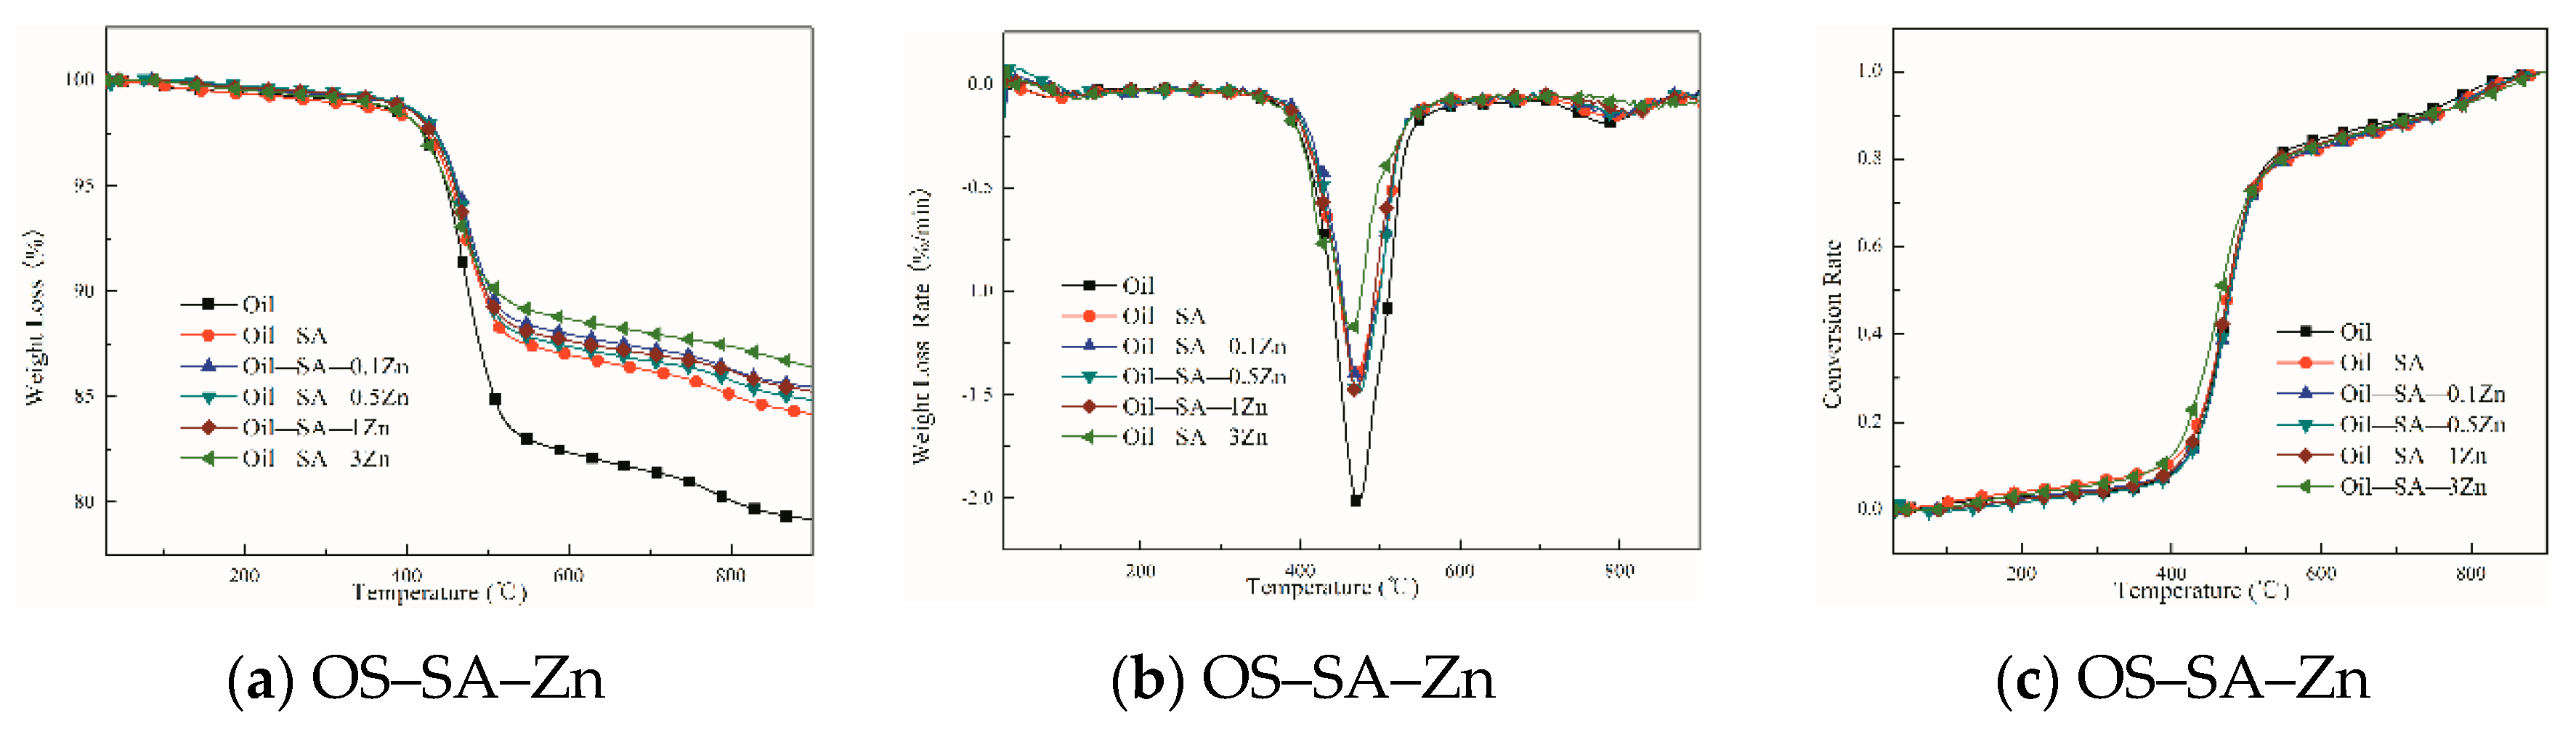
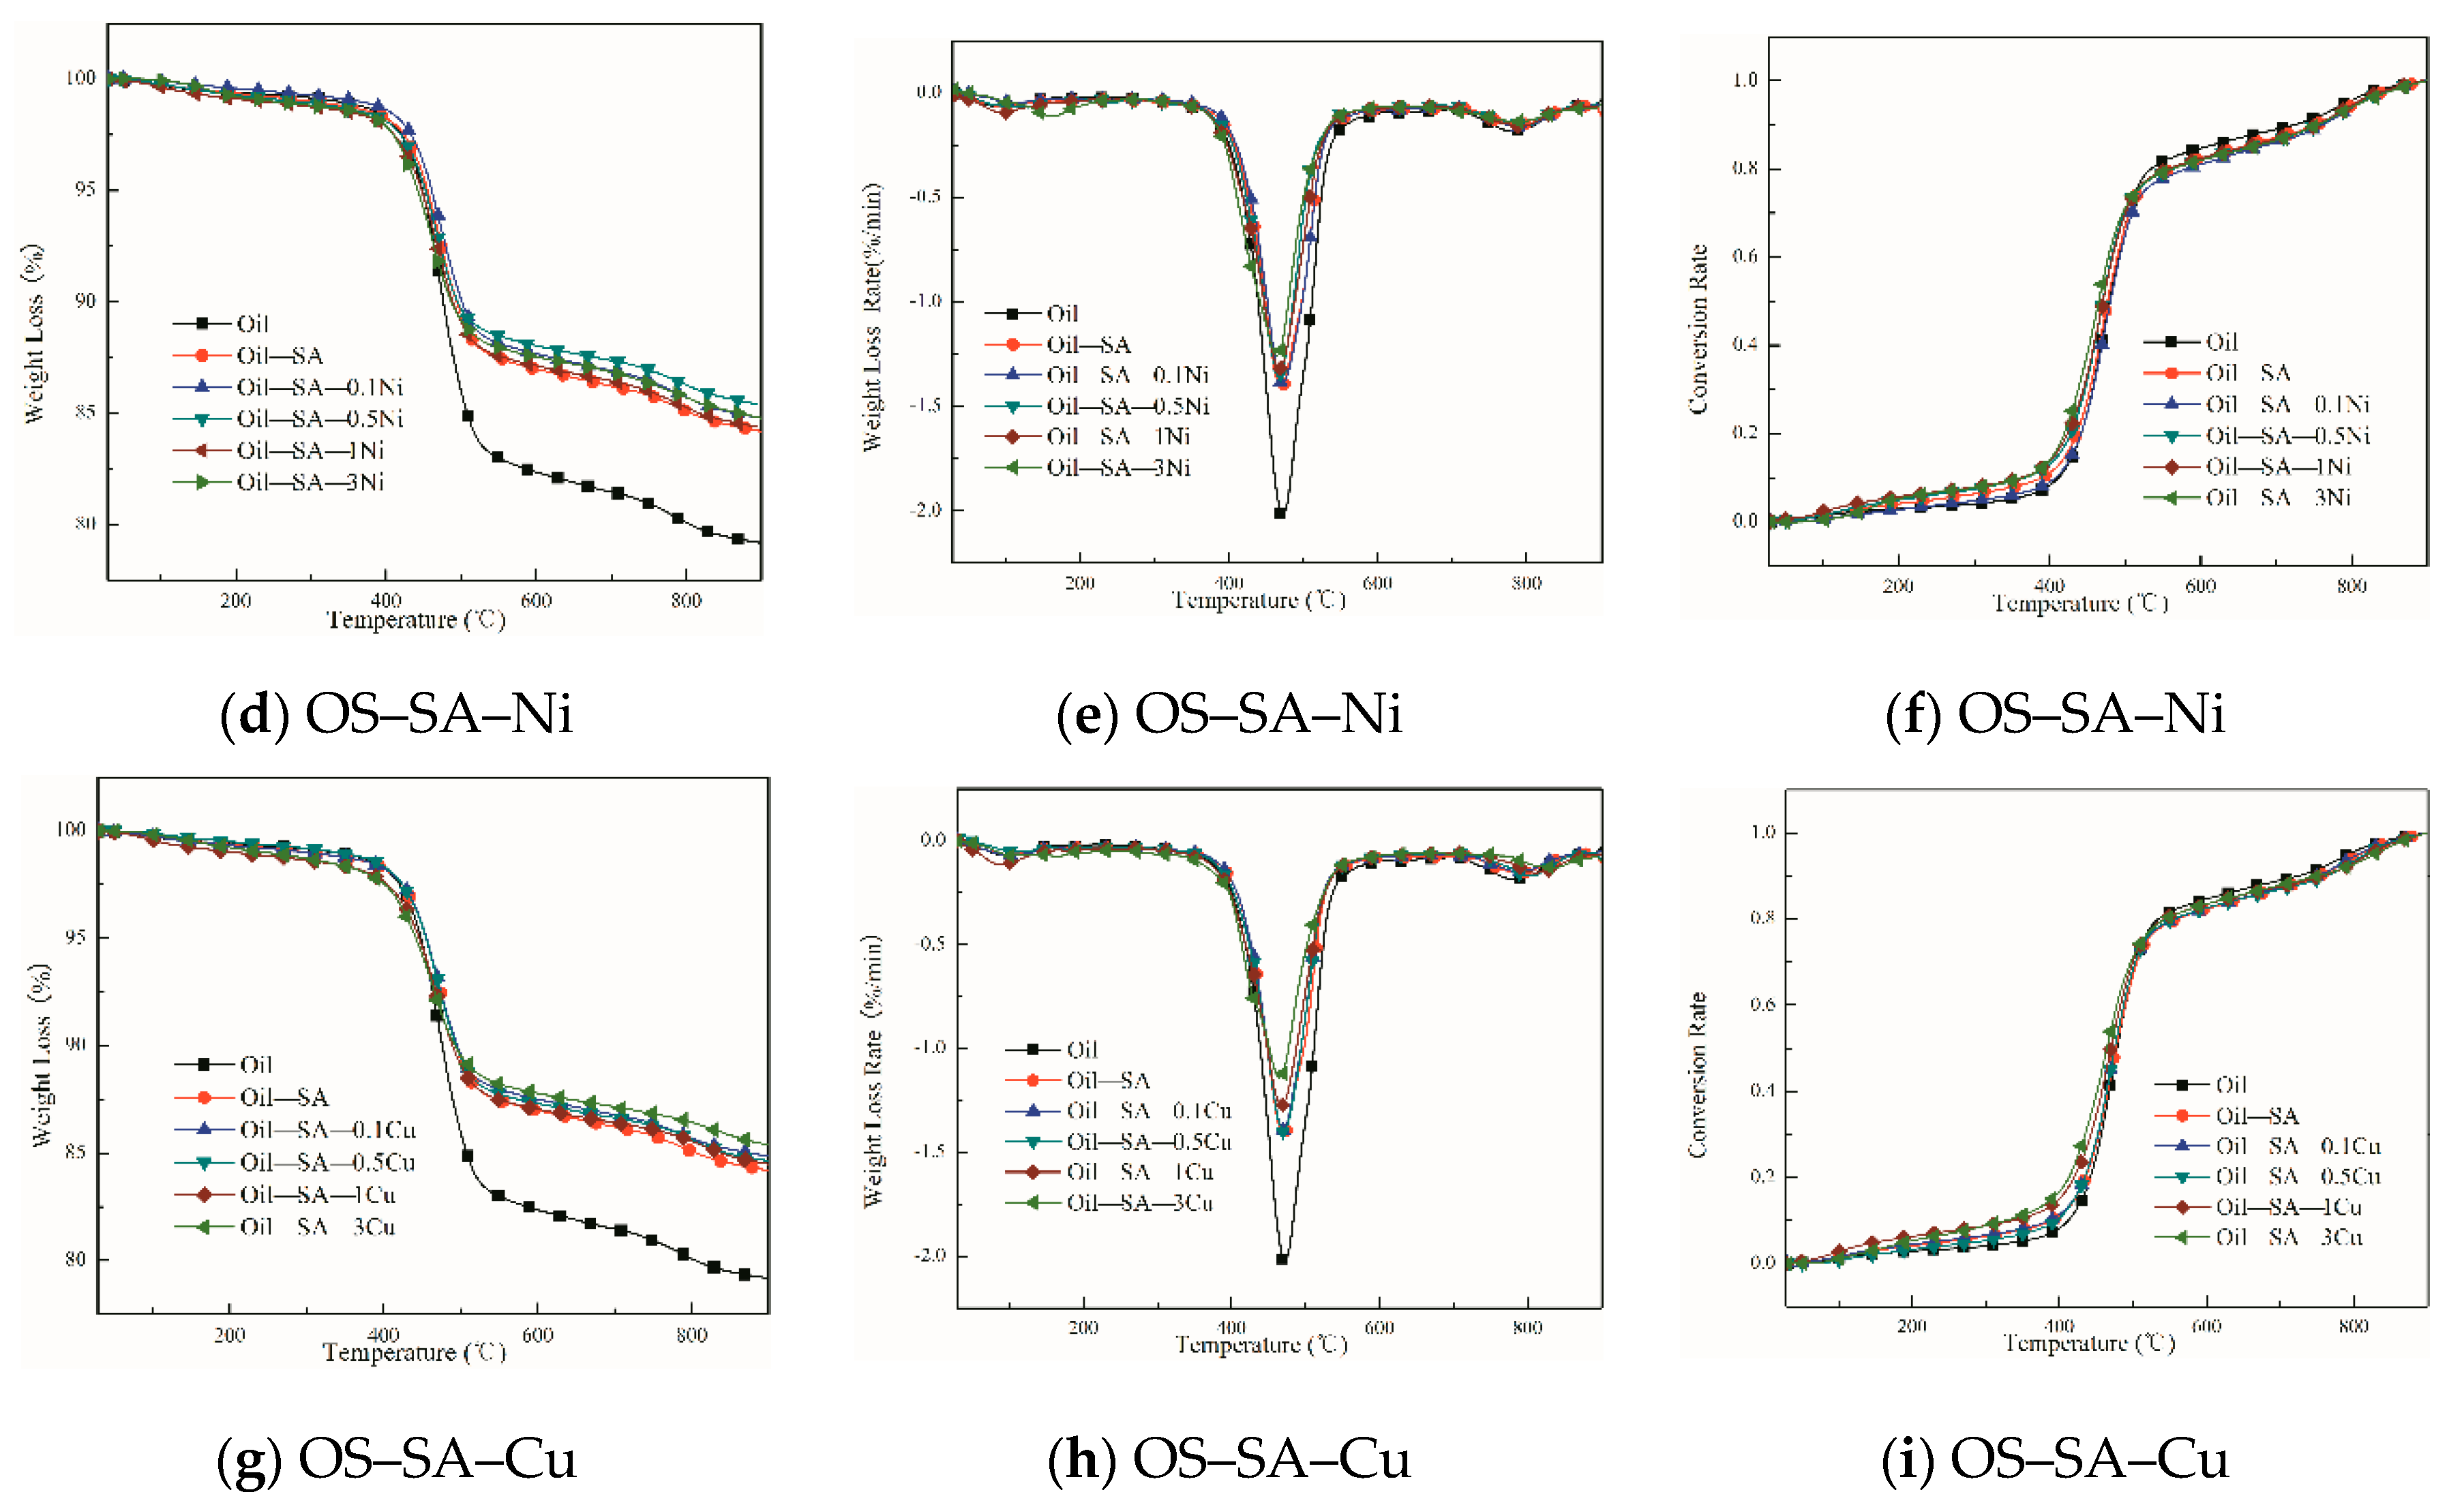
3.2. Effects of Different Loading of Transition Metal Salts on SA on OS Pyrolysis

Figure 3 shows the TG, DTG, and conversion curves of the mixed pyrolysis of OS and SA-based catalysts. The pyrolysis of the supported transition metal salts and OS on SA considerably differed from that of OS. Figure 3a,d,g show that when OS and SA–Q were mixed and pyrolyzed, the total weight loss rate of the OS was less than the weight loss rate of the mixed pyrolysis of OS and SA. In addition, the initial pyrolysis temperature of the OS gradually decreased with increasing transition metal salt loading. This result may have been due to the fact that the supported transition metal salt reduced the activation energy required for OS pyrolysis, thereby allowing OS organics to pyrolyze in the low temperature range [27,28]. When the temperature increased, the volatile substances remaining in the pyrolysis system for a long time undergo a secondary reaction, which leads to an increase in carbon deposits and a consequent decrease in the weight loss rate. Figure 3b,e,h show that the maximum weight loss rate of OS–SA–Ni and OS–SA–Cu at different loadings was lower than that of OS–SA. However, the maximum weight loss rate was lower than OS–SA when ZnCl2 has the largest amount in OS–SA–Zn. In addition, when the transition metal salt loading was low, the temperature corresponding to the maximum weight loss rate did not change. When the transition metal salt loading was 3 wt%, the temperature of the maximum weight loss rate changed remarkably and was approximately 5 °C lower than the OS–SA pyrolysis temperature. The conversion curve Figure 3c,f,i show that at large transition metal salt loading, the conversion rate in the organic decomposition stage (300–520 °C) was high.
Therefore, various transition metal salts on the SA promoted OS pyrolysis, and the catalytic effect improved as the amount of the transition metal salt increased within 0.1–3 wt%.

3.3. Effects of Different Transition Metal Salts of SA Loading on OS Pyrolysis

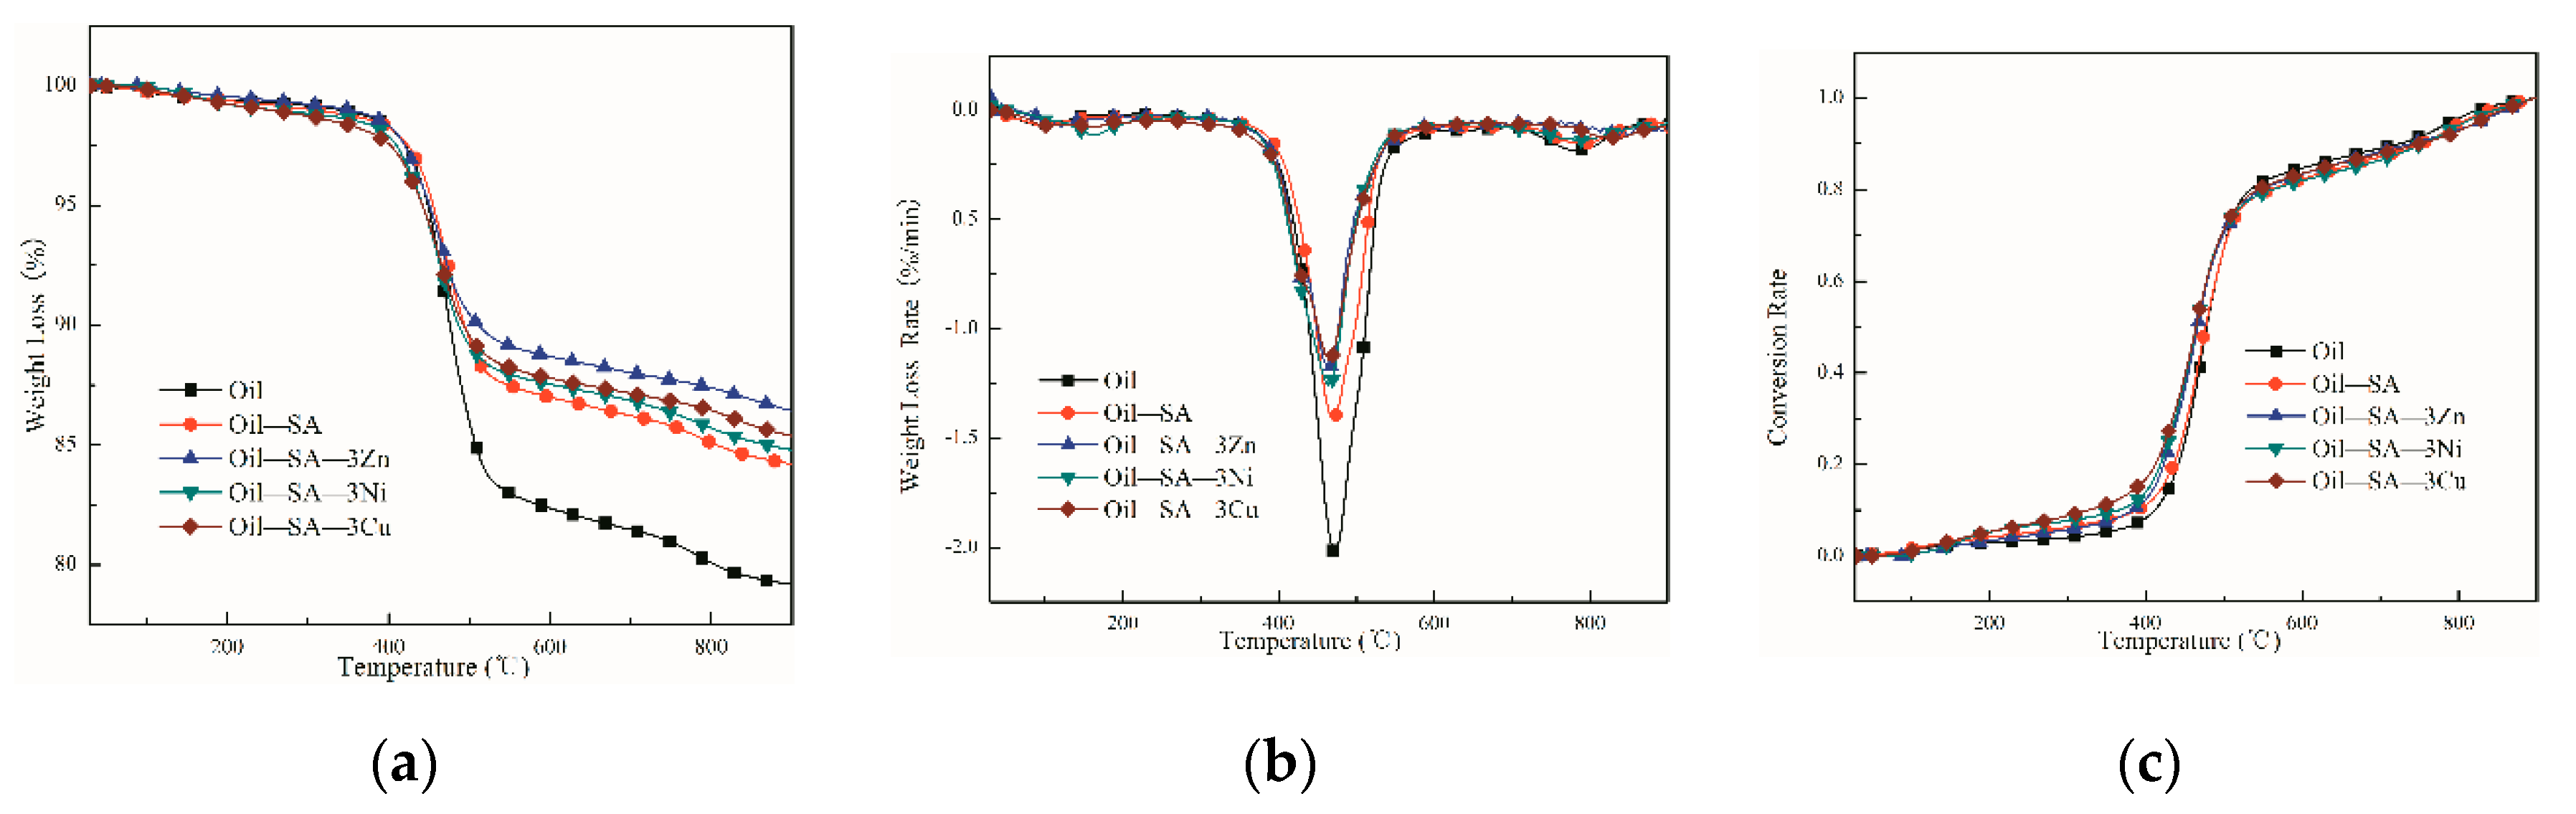
3.3.1. Analysis of Catalytic Pyrolysis Behavior

Figure 4 presents a graph of TG, DTG, and conversion of mixed pyrolysis of SA loaded with 3 wt% ZnCl2, NiCl2·6H2O, and CuCl2·2H2O with OS. The graphs of the samples with 3 wt% ZnCl2, NiCl2·6H2O, and CuCl2·2H2O were compared to study the effects of different transition metal salts loaded on SA on OS pyrolysis. The TG curve (Figure 4a) shows that the temperature of OS–SA–Zn at the same weight loss rate was lower than the other two other samples throughout the experiment. The mass loss demarcation temperature of OS–SA–Ni and OS–SA–Cu was 444.1 °C, prior to which the temperature required for OS–SA–Cu was low at the same weight loss rate. At temperatures higher than 444.1 °C, OS–SA–Ni was smaller than OS–SA–Cu at the same weight loss rate. In addition, OS–SA–Zn had the lowest total mass loss of pyrolysis, which was less than the total mass loss of OS–SA pyrolysis. Thus, ZnCl2, NiCl2·6H2O, and CuCl2·2H2O synergistically functioned with SA to promote OS pyrolysis, reduced the temperature required for pyrolysis, induced a secondary reaction of volatile products, and ultimately led to a decrease in total weight loss rate. This finding is consistent with previous analysis. The total weight loss rate of OS–SA–Zn was the smallest possibly because ZnCl2 started to volatilize rapidly at 450 °C and the OS interacted with ZnCl2, thereby decreasing the total weight loss rate of OS [13,29].
The DTG curve (Figure 4b) shows that the temperatures corresponding to the maximum weight loss rate of OS–SA–Zn, OS–SA–Ni, and OS–SA–Cu were the same. However, the maximum weight loss rate of OS–SA–Cu was the smallest, followed by OS–SA–Zn and, finally, OS–SA–Ni. In addition, the main pyrolysis intervals of OS–SA–Zn, OS–SA–Ni, and OS–SA–Cu moved to the low temperature zone. Figure 4c shows that the SA-based catalyst primarily affected OS pyrolysis during the main stage. At this stage, the conversion rate of OS–SA–Q was greater than that the conversion rate of OS and OS–SA. The conversion rate of OS–SA–Cu was higher than that of the two other samples at 200–520 °C. Furthermore, the conversion of OS–SA–Zn was greater than the conversion of OS and OS–SA at above 370 °C. Thus, when SA was used as support, the catalytic sequence of the transition metal salts was CuCl2·2H2O > NiCl2·6H2O > ZnCl2.

3.3.2. Kinetics Analysis

The related kinetics parameters in the thermochemical system were calculated to investigate the underlying mechanism. In the numerous analytical models, Coats–Redfern (C–R) method [30,31] has consistently been used to calculate the related kinetics parameters of solid fuel pyrolysis. Therefore, this study used the C–R model to analyze the mechanism of mixed pyrolysis of SA-supported 3 wt% ZnCl2, NiCl2·6H2O, and CuCl2·2H2O with OS. The formula can be expressed as follows:
l n   [ l n ( 1 α ) T 2 ]   = l n   [ A R β E ( 1 2 R T E ) ]     E R T ,
where α was the conversion rate; T was the absolute temperature, K; β was the heating rate under non-isothermal conditions, K/min; E is the apparent activation energy, kJ/mol; A is the pre-exponential factor; R is the gas constant. For the general reaction temperature range and most E, 2 R T E was far less than 1, so   l n   [ A R β E ( 1 2 R T E ) ]   could be regarded as a constant. Therefore, l n   [ l n ( 1 α ) T 2 ] and 1 T could be used for drawing. The values of the activation energy E and the frequency factor A could be obtained by the slope   E R and intercept of the line l n   [ A R β E ( 1 2 R T E ) ] .
Table 3 shows the thermodynamic parameters of the main pyrolysis stage of oil shale with and without catalyst. The main pyrolysis stage indicated that the weight loss rate accounted for 60 wt% or more of the weight loss rate of the second pyrolysis section. The curve and fitting results of C–R method indicated that the main stage of OS pyrolysis was the first-order reaction, and the correlation coefficient R2 was greater than 0.995. This high correlation coefficient proved the reliability of the computational model. The remaining fitting results are shown in Table 3. The activation energy required for OS pyrolysis in the main pyrolysis stage was 116.04 kJ/mol. When SA and SA–Q were added as catalysts, the activation energy required for the main pyrolysis stage of OS was reduced. The activation energy required for the pyrolysis of OS added with SA was reduced by 11.08 kJ/mol, accounting for 9.5% of the activation energy required for OS pyrolysis. The activation energy decreased when the transition metal salt was loaded on the SA; the energy was reduced the most at 32.84 kJ/mol in the sample containing CuCl2·2H2O with a load of 3 wt%, followed by the samples with 3 wt% by weight of NiCl2·6H2O (24.43 kJ/mol) and ZnCl2 (22.7 kJ/mol). This finding suggests that SA-based catalysts can accelerate the decomposition of chemical bonds in organic matter. The decrease in apparent activation energy also indicated the highly complicated pyrolysis reactions, including the decomposition of long-chain alkanes, aromatization of alicyclic compounds, and rupture of heterocyclic compounds. Therefore, from the perspective of activation energy, SA could promote OS pyrolysis. After the transition metal salt was added to SA, the catalytic effect improved in the order of CuCl2·2H2O > NiCl2·6H2O > ZnCl2. This finding was consistent with the thermogravimetric analysis results.

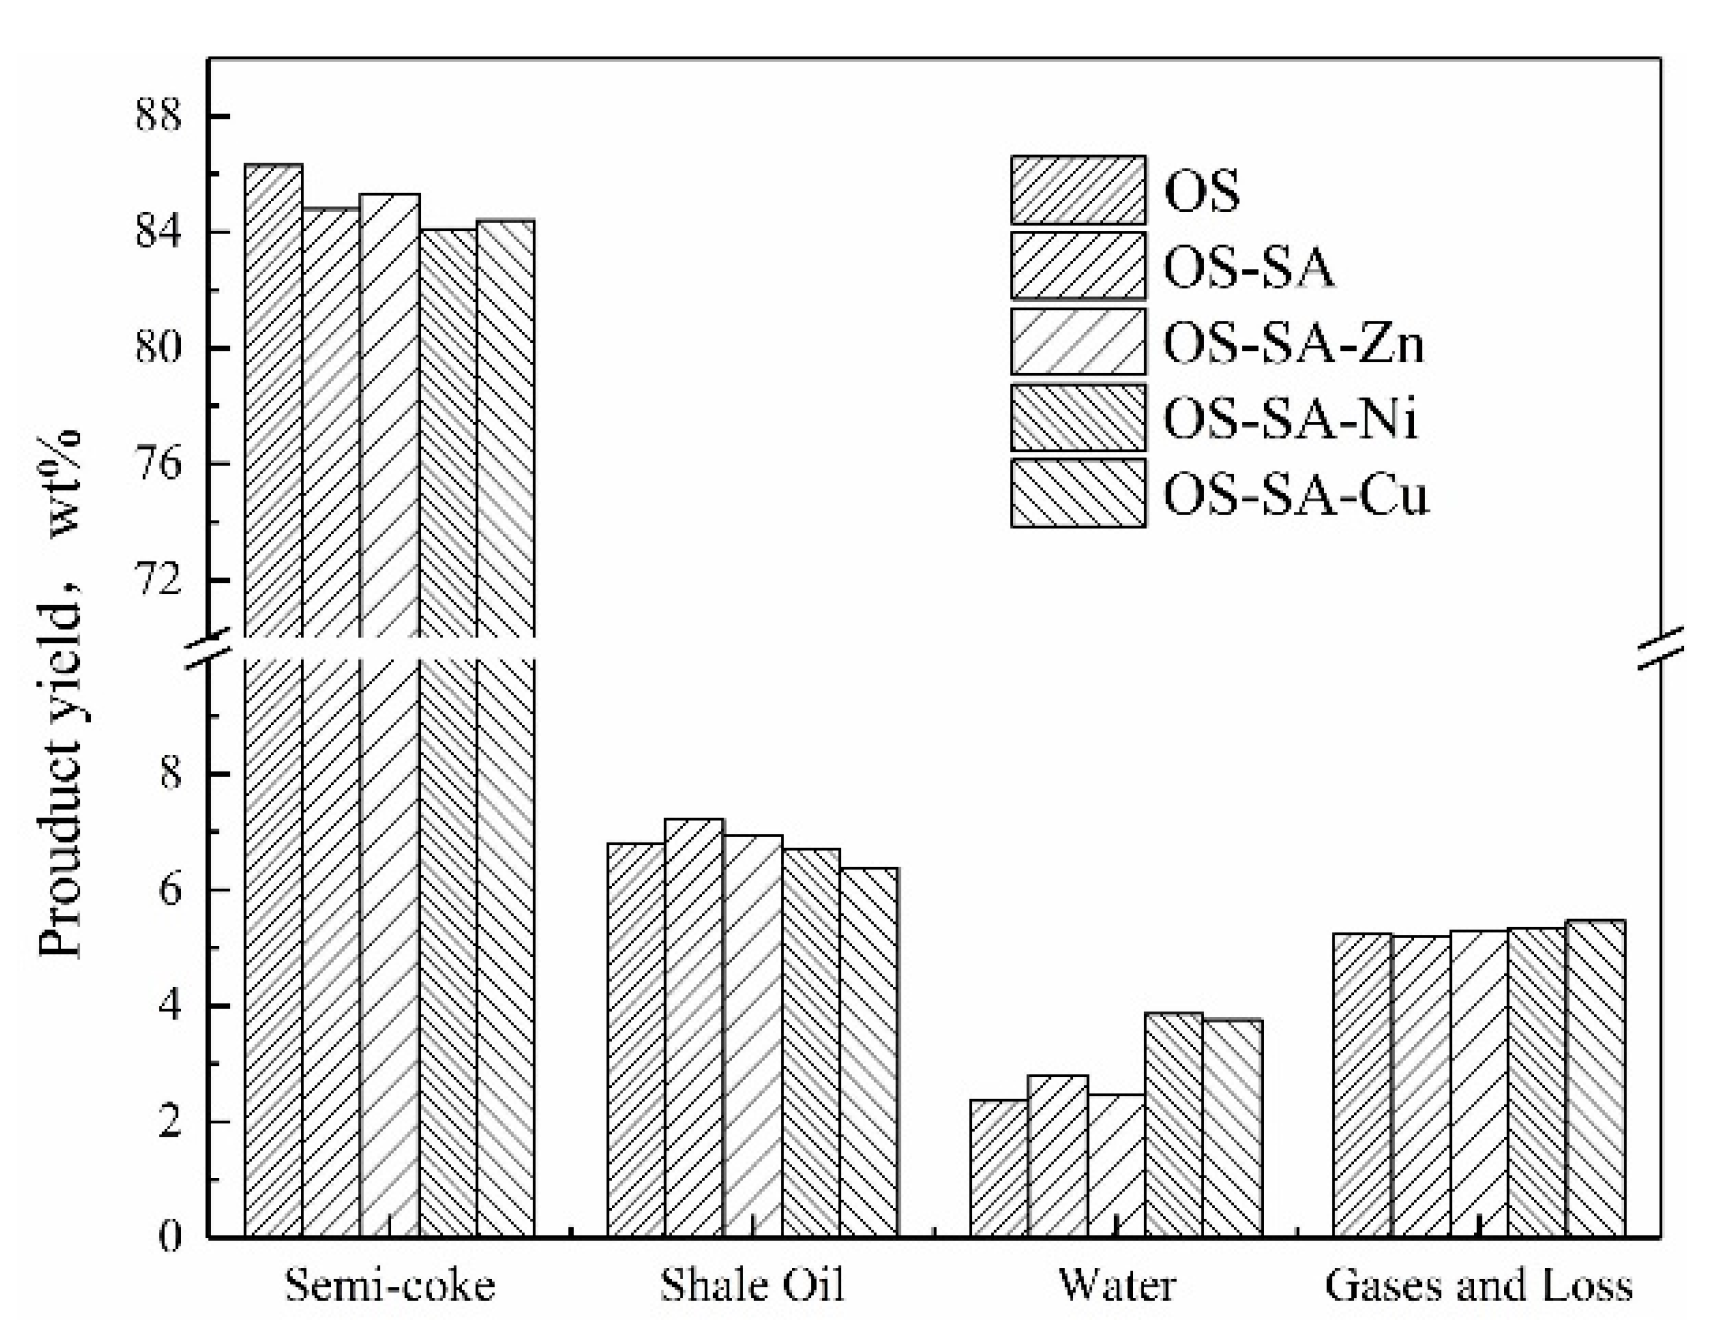
3.4. Product Yield in Fixed Bed Pyrolysis Experiments

Figure 5 shows the yield of mixed pyrolysis products of Fushun OS and SA and supported with 3 wt% ZnCl2, NiCl2·6H2O, and CuCl2·2H2O. The mixed pyrolysis of OS and SA promoted the formation of shale oil and reduced the production of shale semi-coke and gas and loss. This result is similar to that reported by Niu et al. [32], who claimed that SA can increase the yield and quality of shale oil. When ZnCl2, NiCl2·6H2O, and CuCl2·2H2O were added to the SA, and the OS was pyrolyzed and the amount of shale oil produced decreased compared with the shale oil formed by OS–SA pyrolysis. In addition, the pyrolysis of OS–SA–Zn resulted in larger semi-coke yield compared with that of the two other metals; however, the semi-coke yield remained lower than that in OS pyrolysis (Figure 5). The catalyst increased the mass loss of OS pyrolysis, and the trend of forming shale semi-coke was consistent with the thermogravimetric analysis results. Moreover, these results are consistent with the report of Chang et al. [13], who observed that FeCl2·4H2O, CoCl2·6H2O, NiCl2·6H2O, and ZnCl2 can enhance the secondary cracking of shale oil, reduce the oil production, and increase the gas produced during pyrolysis. The reduction of shale oil may have been due to the fact that SA loaded with the transition metal salt promotes OS pyrolysis, which caused the shale gas to remain in the pyrolysis system for a long time. Moreover, the transition metal of the activation center could have exerted a catalytic cracking effect on shale gas, which resulted in a secondary reaction.
In addition, the yields of gas and loss generated by OS–SA–Q pyrolysis were higher than those derived from pyrolysis of OS and OS–SA. The yields from the pyrolysis of OS–SA–Cu were the largest and 4.4% higher than those of OS. Hence, the SA-based catalyst promoted the secondary reaction of the OS to produce several non-condensable gases.

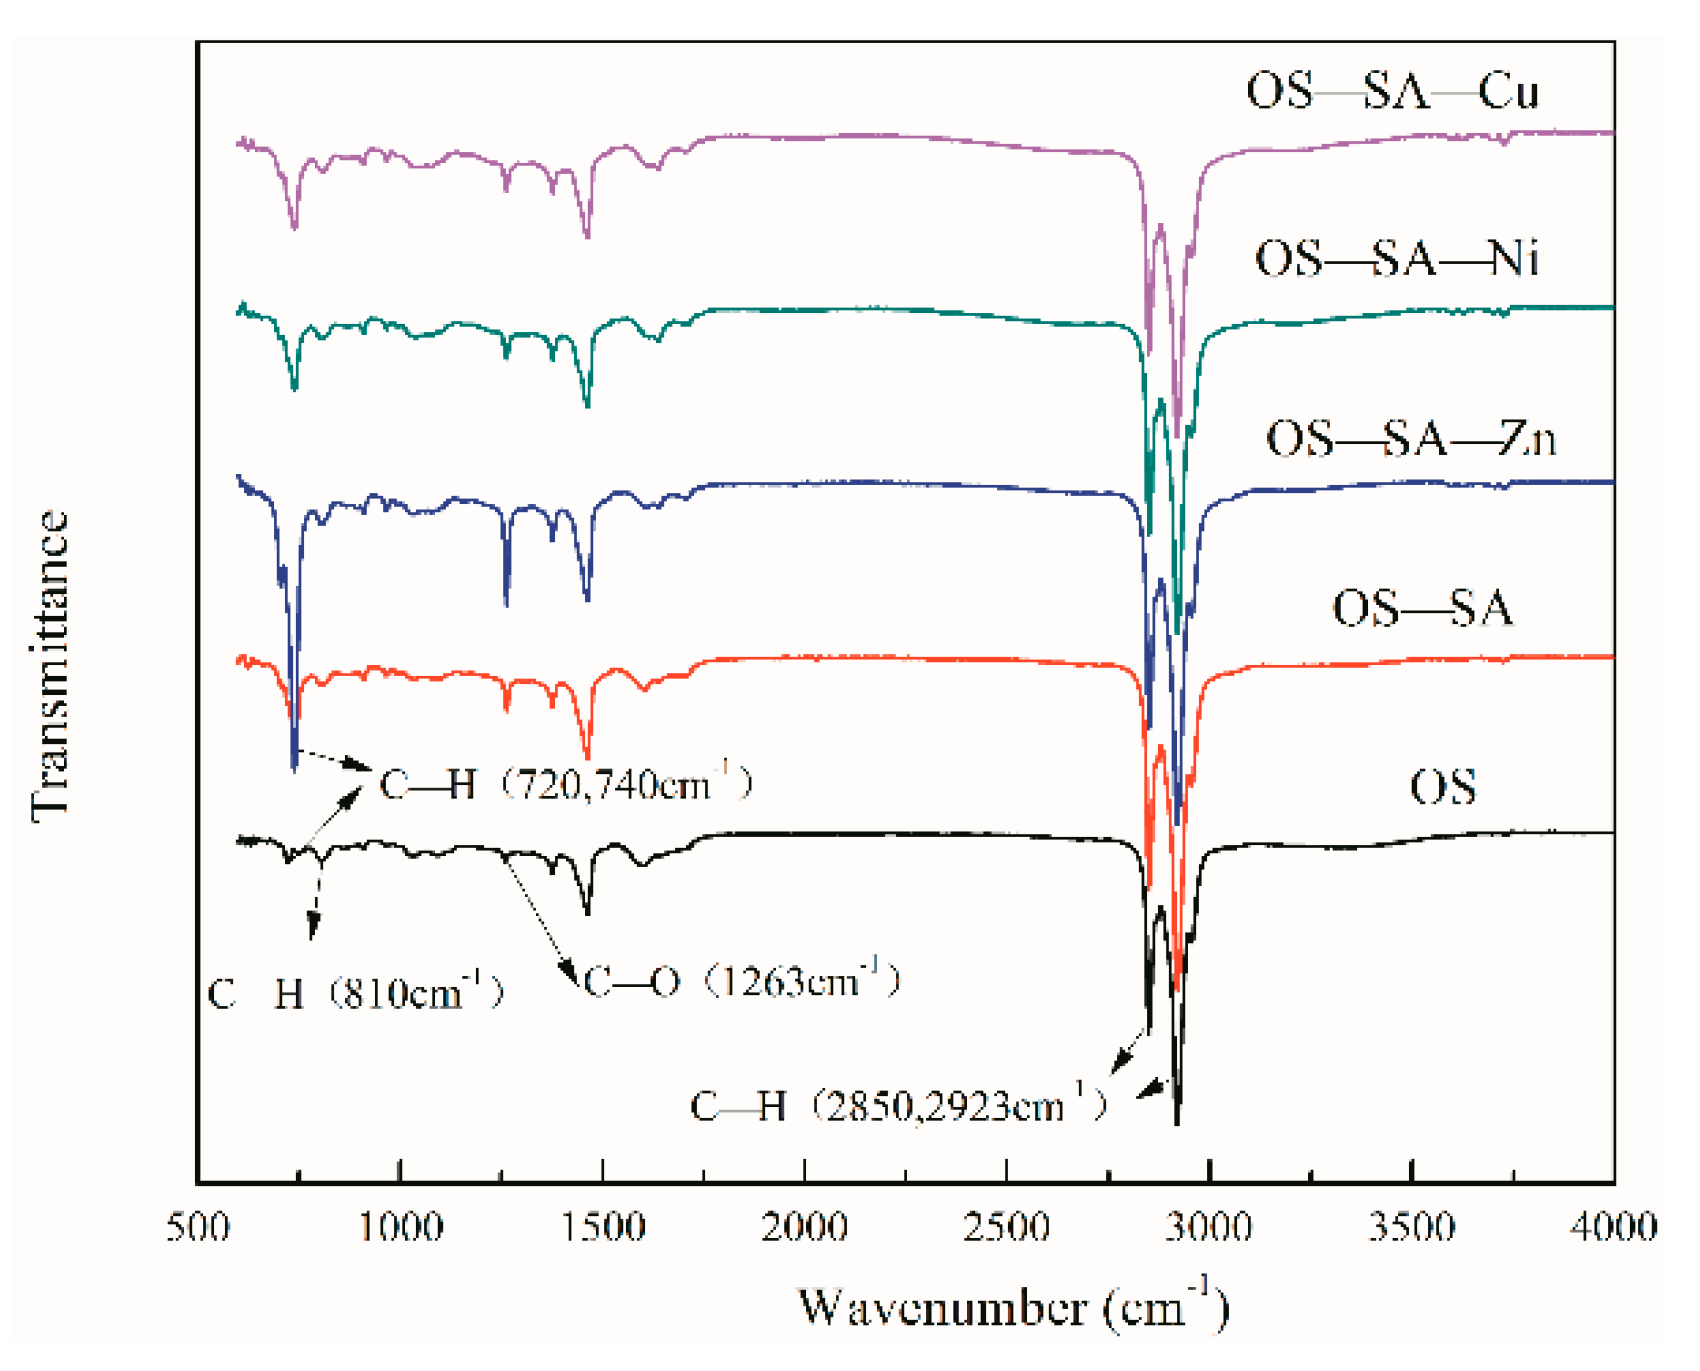
3.5. Characteristics of Semi-Coke after Pyrolysis

Figure 6 shows an ATR–FTIR diagram of OS and semi-coke, where Figure 6a presents the total in situ Fourier infrared spectrum, and Figure 6b illustrates the spectrum with a wavenumber between 3000 and 2800 cm−1. The overall trends were the same for OS and SC. The wavenumber showed a strong absorption band at 1100–900 cm−1, which is the absorption peak of silicate [33,34]. The medium intensity band near 690 cm−1 and the double band at 796 and 776 cm−1 were attributed to quartz and are characteristic absorption peaks of quartz, respectively [35]. The stretching vibration of hydroxyl (OH) in silicate kaolinite is between 3700 and 3500 cm−1, particularly at 3695 and 3620 cm−1 [36,37]. In addition, the spectrum of the semi-coke of OS–SA–Cu exhibited an absorption band at approximately 3400 cm−1, which was an absorption peak not found in the other spectra and may have been caused by water absorption of the sample in air [35,38].
Numerous mineral peaks will have covered some of the organic matter peaks due to the high mineral content in the OS. Figure 6a,b show that the most evident absorption peaks of the organic matter of Fushun OS were at 2923 and 2857 cm−1, which are the characteristic absorption peaks of aliphatic hydrocarbons and the stretching vibration of aliphatic hydrocarbon C–H (methylene) [39], respectively. Thus, the main component of the organic matter of OS was aliphatic hydrocarbon. The absorption peaks at 2923 and 2857 cm−1 disappeared after OS pyrolysis, indicating that the OS organic matter was completely pyrolyzed at this stage. The absorption peaks of the remaining wavenumbers slightly changed.

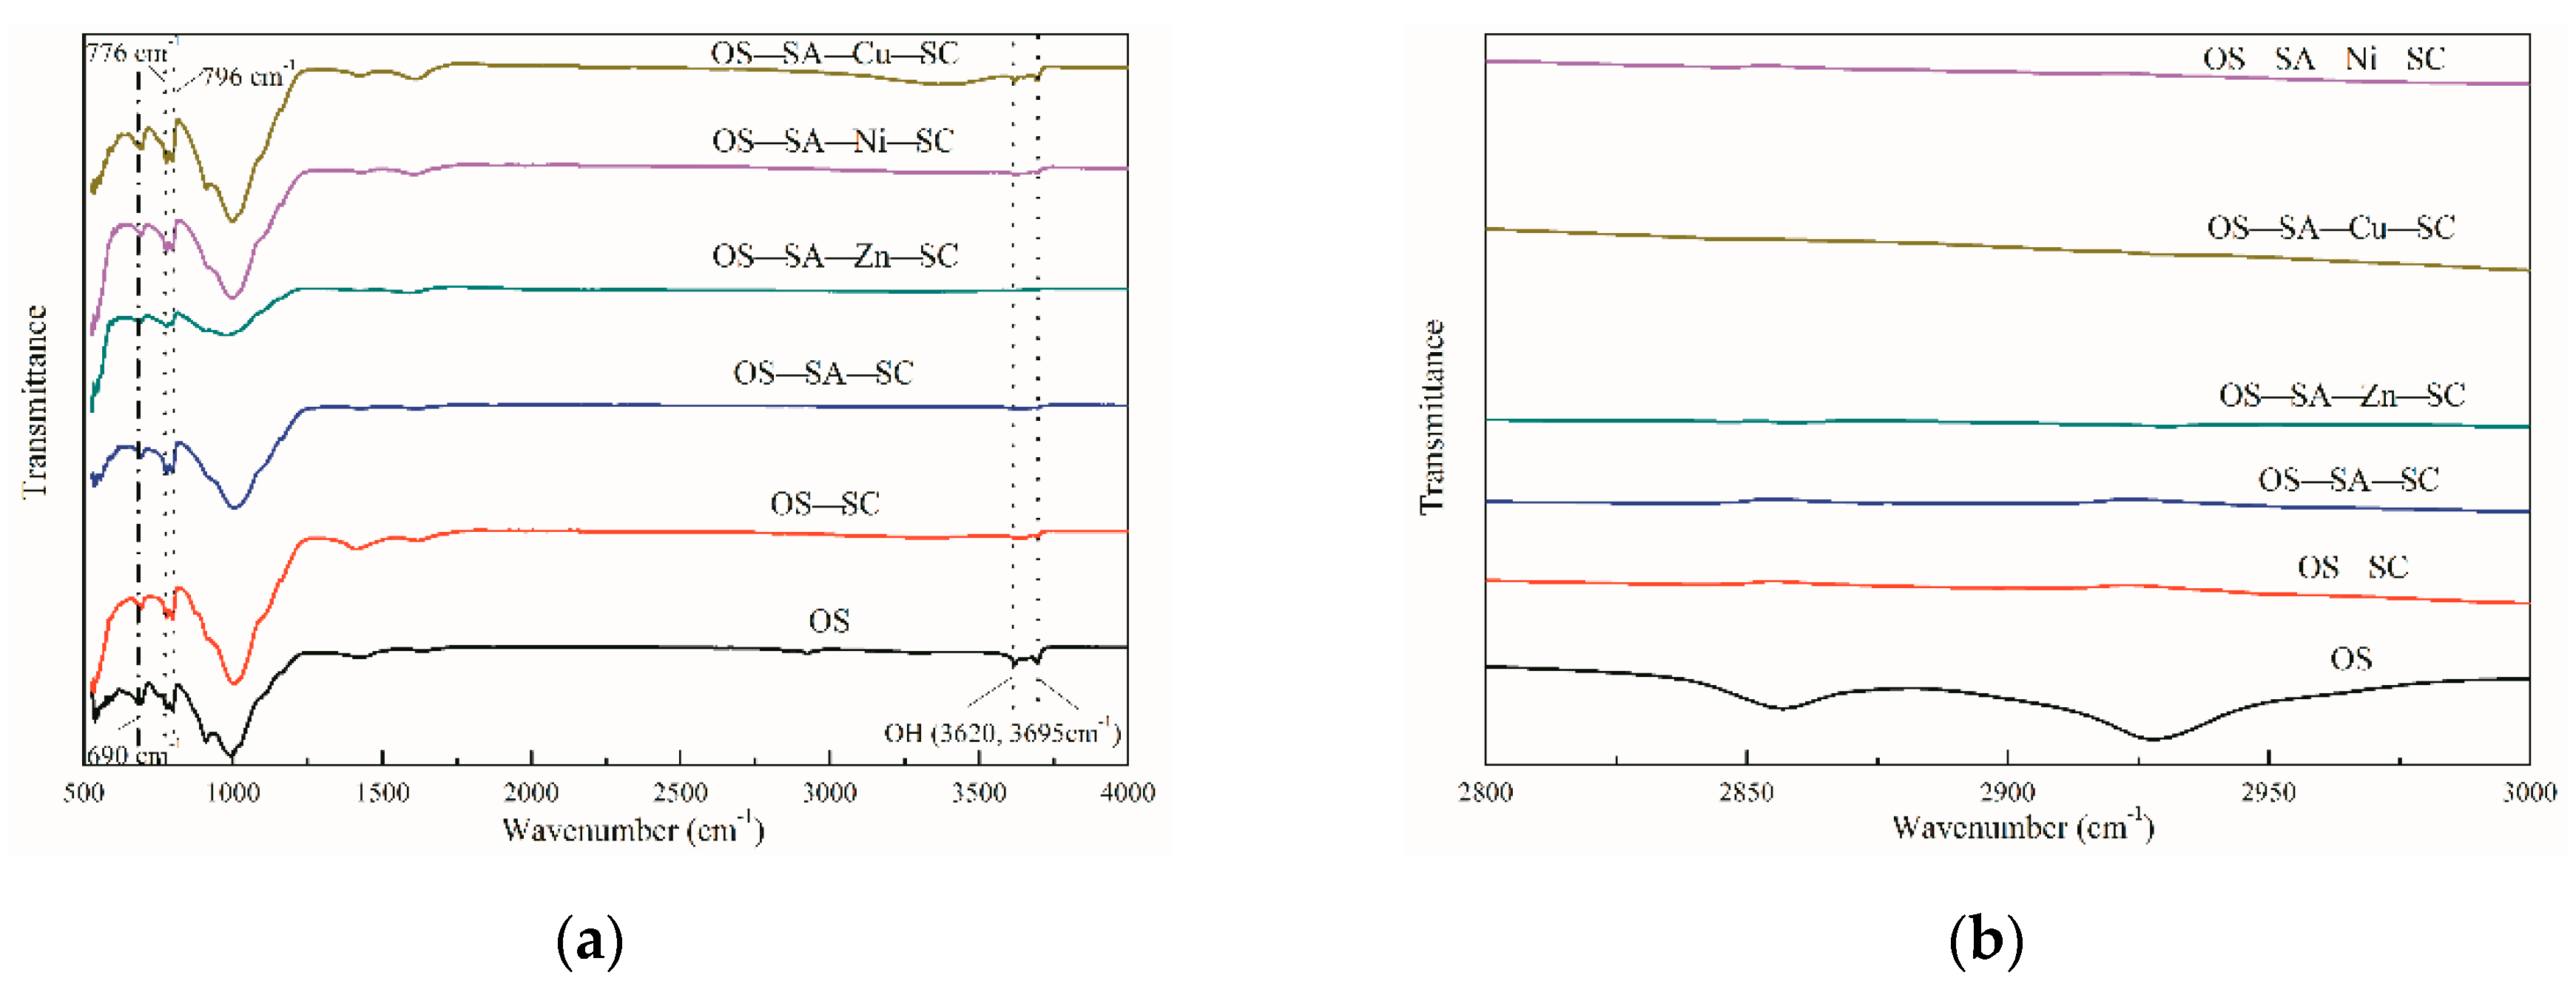
3.6. Characteristics of Shale Oil

3.6.1. Characterization of Shale Oil Produced from Catalytic OS Pyrolysis

Figure 7 shows the ATR–FTIR spectra of shale oil produced with and without a catalyst. The overall trend of the five shale oils was the same, and the main functional groups fluctuated within wavenumber ranges of 3000–2800, 1800–1000, and 900–700 cm−1. Wavenumber 3000–2800 cm−1 is mainly assigned to an aliphatic substance. Shale oil was the most evident in this range and mainly fluctuated near two wavenumbers, namely, 2920 and 2850 cm−1, which were methylene (CH2) C–H stretching vibration absorption peaks (Figure 7) [40,41]. An aliphatic C–H bending vibration was at 1462 and 1377 cm−1 within the wavenumber range of 1800–1000 cm−1 [42]. The catalyst-added shale oil did not change considerably, although the change was remarkable at the wavenumber of 1263 cm−1; in particular, OS–SA–Zn was prominent. Adding catalysts promoted the formation of aromatic structure oxygenates, as evident by the peak at 1263 cm−1, which was the stretching vibration of aromatic ether C–O [43]. Shale oil after OS pyrolysis exhibited a peak assigned to long-chain hydrocarbon at 720 cm−1 within the wavenumber range of 900–700 cm−1. After the addition of the SA-based catalyst, the shale oil disappeared and became a short-chain hydrocarbon at 740 cm−1 [44]. The shale oils of OS and SA–Q pyrolysis were stronger at 740 cm−1 wavenumber than OS and SA pyrolysis shale oil. Hence, the supported transition metal salt on SA promoted the cracking of long-chain hydrocarbons to form short-chain hydrocarbons. OS–SA–Zn had strong fluctuations, indicating that ZnCl2 could promote the formation of short-chain hydrocarbons in shale oil. In addition, five types of shale oil had characteristic peaks of bending vibration at approximately 810 cm−1. Davis et al. [45] suggested that the peak at 810 cm−1 is attributed to aromatic C–H out-of-plane bending mode. Therefore, the shale oil had an aromatic component.
This analysis revealed that the main component in the shale oil was an aliphatic hydrocarbon substance. Adding SA–Q addition promoted not only the decomposition of long-chain aliphatic hydrocarbons into short-chain aliphatic hydrocarbons but also the formation of aliphatic and aromatic compounds in shale oils. Therefore, the loading of transition metal salts on SA and OS pyrolysis changed the composition of shale oil, thereby providing a basis for improving the quality of shale oil in engineering practice.

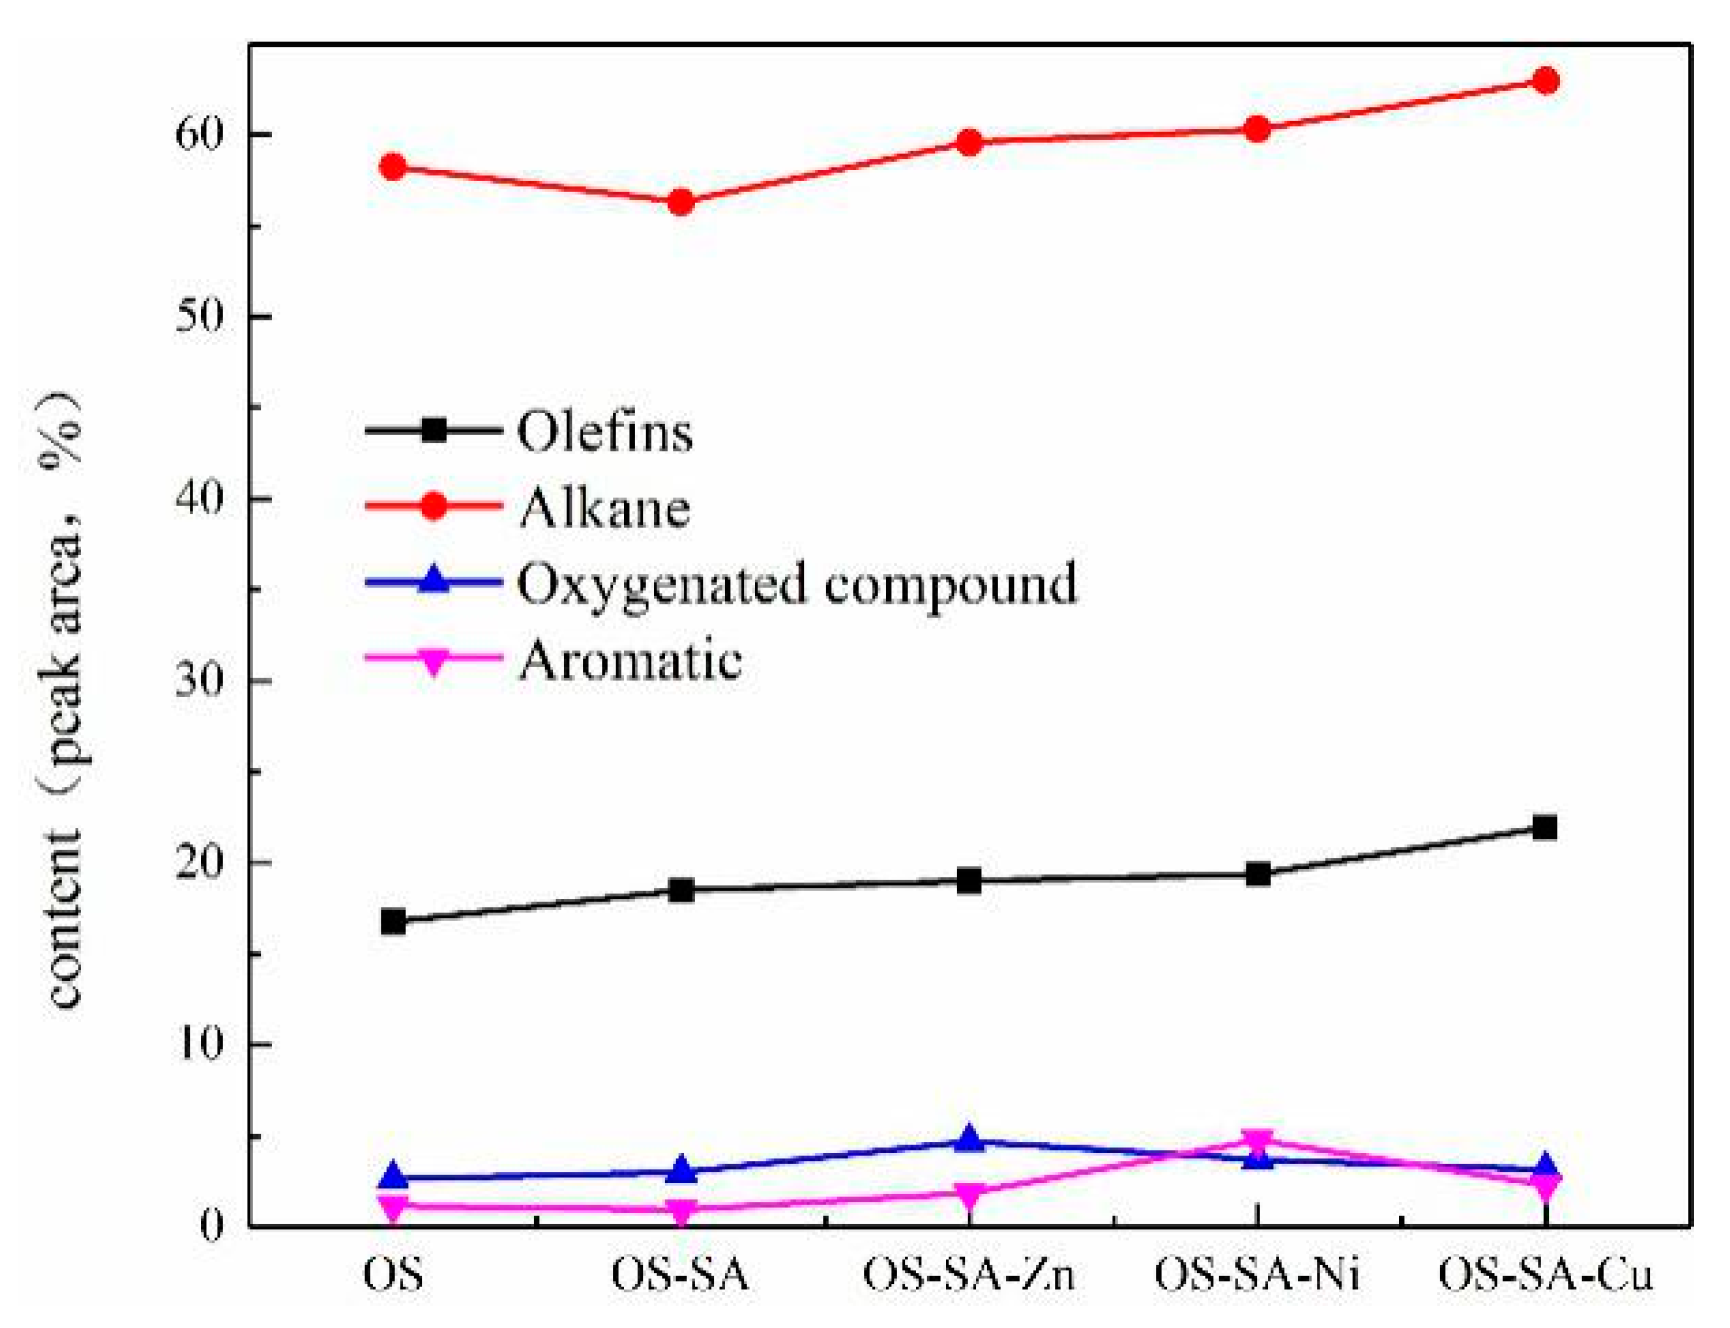
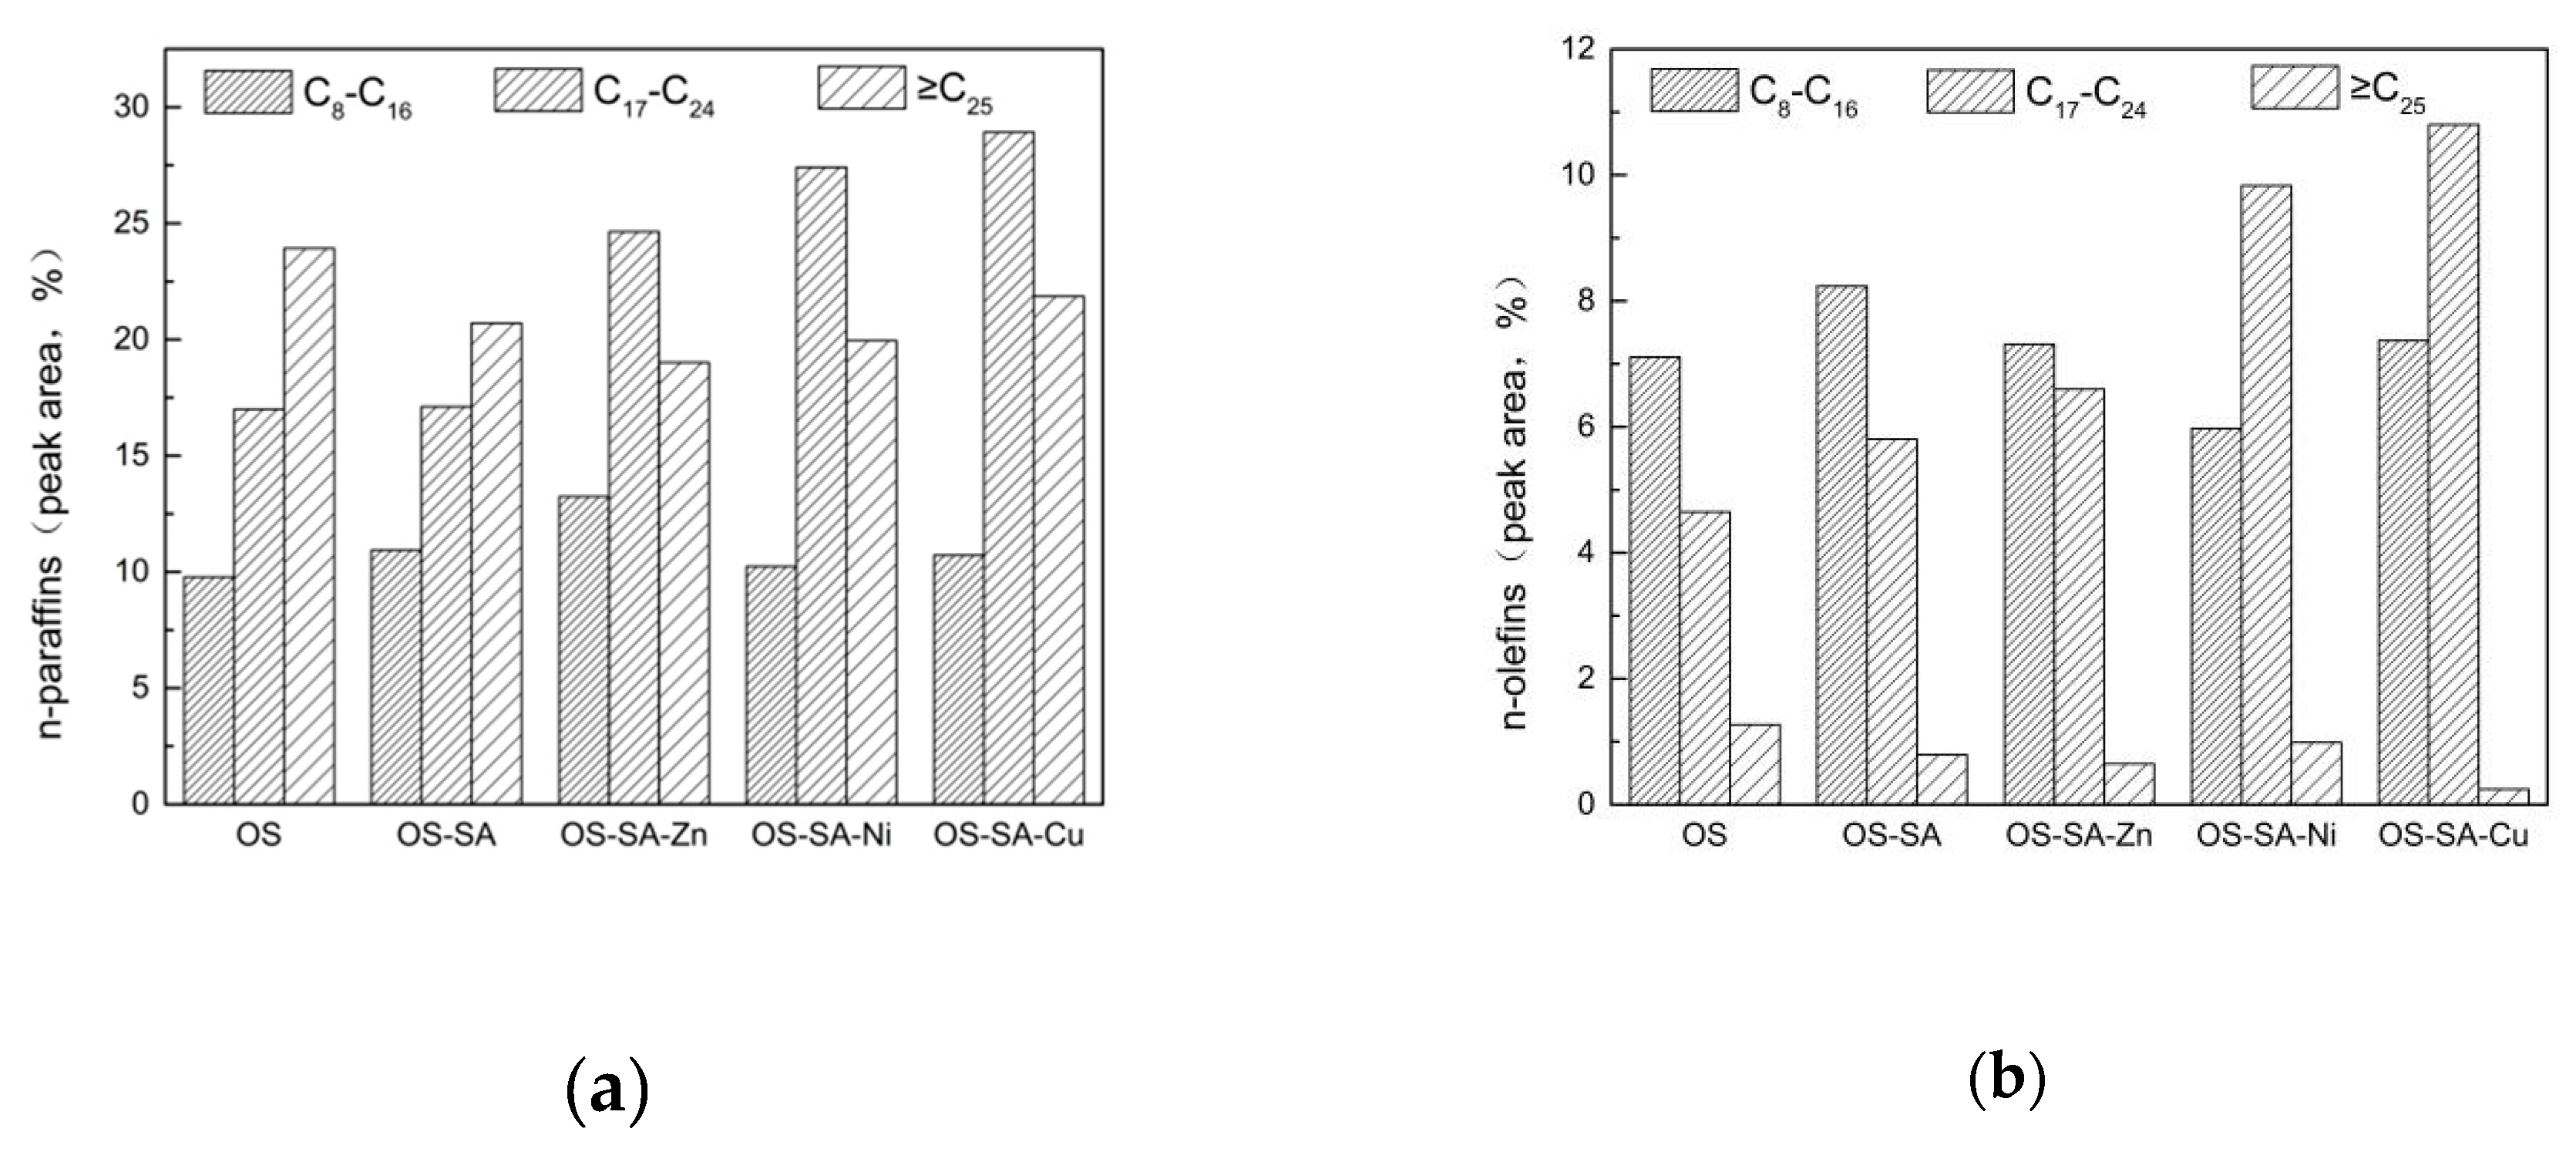
3.6.2. Shale Oil Composition Analysis

The composition of shale oil is complex and diverse. Under the set instrument conditions (GC–MS, Gas Chromatography–Mass Spectrometry), the composition of shale oil with a mass fraction of greater than 0.1% was analyzed and found to include alkanes, olefins, oxygenates, and aromatic hydrocarbons. Oxygen-containing compounds mainly included acids, alcohols, esters, and ketones, whereas aromatic hydrocarbons included naphthalene, anthracene, benzene, and benzene series. These results are consistent with previous reports [13,46].
The area of the ion peak was used to provide relative content of the major class components to estimate the effect of SA and its supported transition metal salt catalyst on shale oil composition (Figure 8) [47]. The main components in shale oil were alkanes and alkenes in aliphatic hydrocarbons, accounting for more than 75% of the total mass, consistent with the analysis of major aliphatic hydrocarbons in shale oil and the results of Lai et al. [23]. Adding SA increased the olefin content and decreased the alkane contents compared with uncatalyzed pyrolysis of shale oil, leading to a small reduction in the total amount of aliphatic compounds. The gas phase cracking of the aliphatic compound during pyrolysis caused the aromatization of the hydrocarbon species and leds to a small increase in the contents of aromatics [16]. However, when the transition metal salt was supported on SA, the amounts of aromatic and aliphatic components in the shale oil increased. Hence, adding transition metal salt on SA decreased the pyrolysis temperature of the OS. During fixed bed pyrolysis experiments, the catalyst promoted the secondary reaction of volatile products with increasing temperature, thereby promoting the formation of hydrocarbons in the resulting oil, including aliphatic cracking, cracking of aromatic hydrocarbons and asphaltene side chains, and hydrogenolysis of hetero-carbon bonds of polar compounds [48,49]. For example, during cracking of an aliphatic group, the long chain alkyl group is cleaved to an olefin, and the short alkyl group can be further cracked or converted into an alkane by attracting a hydrogen atom.
The catalyst promoted not only the formation of an aromatic compound but also the formation of an oxygen-containing compound. The content of the oxygen-containing compound was proportional to the catalytic action of the catalyst. The pyrolysis oil of OS–SA–Zn had a high oxygenated compound of 4.692%, leading to the stronger total ionogram of OS–SA–Zn shale oil at approximately 20 min than the other shale oil. The pyrolysis oil of OS–SA–Ni had the highest aromatic content of 4.774%. However, the increase in aromatics negatively affects the stability of shale oil [32]. For the pyrolysis oil of OS–SA–Cu, the content of aromatics was considerably lower than that of OS–SA–Ni because SA–Cu had a strong catalytic effect on OS pyrolysis, resulting in a prolonged residence time of volatile substances in the pyrolysis system. Aromatic hydrocarbons tend to coke before volatilization due to the prolonged residence time, thereby decreasing the amount of aromatics [32]. Therefore, the effect of promoting the formation of aliphaticity and the stability of shale oil suggest that the sequence of the catalytic effect of transition metal salts loaded on SA was CuCl2·2H2O > NiCl2·6H2O > ZnCl2.
The n-paraffins and n-olefins in the shale oil sample can be divided based on the number of carbon atoms into C8–C16, C17–C24, and C25+ (Figure 9). The presence of the catalyst decreasesd the contents of C25+ long-chain alkane and olefin and increased the contents of C8–C16 and C17–C24 chain hydrocarbons as well as the alkane and olefin contents of C17–C24. The number of short-chain hydrocarbon products of C8–C16 in the shale oil generated by OS–SA–Zn pyrolysis was the highest, which was consistent with the FTIR analysis of shale oil. Hence, OS–SA–Zn shale oil has many short-chain hydrocarbons. This result provided direct evidence for the catalysis of the catalyst for aliphatic pyrolysis. In addition, the content of aliphatic hydrocarbons changed after loading the transition metal salt on SA, indicating that SA had strong catalytic activity after loading the transition metal salt. Thus, transition metal salts considerably affected the composition of shale oil and promoted aliphatic formation.

4. Conclusions

This study investigated the effects of SA and SA loaded with ZnCl2, NiCl2·6H2O, and CuCl2·2H2O on the pyrolysis of Fushun OS. The following conclusions can be drawn from the experimental results.
(1) SA-based catalysts can promote OS pyrolysis. The optimum ratio of OS to SA weight is 2:1. The SA-supported transition metal salt catalyst can reduce the initial pyrolysis temperature of the OS, and the catalytic effect increases with the loading of transition metal salt within the range of 0.1–3 wt%.
(2) The catalytic effects of different transition metal salts vary. The analysis of the catalytic cracking behavior indicates that CuCl2·2H2O exhibits the best catalytic effect. Based on the kinetic analysis, the activation energy required for OS pyrolysis is 116.04 kJ/mol, which is reduced by 11.08 kJ/mol (2:1) after adding SA. The loading of 3 wt% transition metal salts on the SA reduces the activation energy required for OS pyrolysis. CuCl2·2H2O has the best catalytic effect, reducing the activation energy of OS pyrolysis by 32.84 kJ/mol.
(3) SA catalyst can increase the amount of shale oil produced. However, loading the transition metal salt on the SA catalyzes the secondary cracking reaction of the shale oil and leads to decreased oil yield and increased gas yield. The samples with 3 wt% CuCl2·2H2O have the largest gas and loss during pyrolysis, which are 4.4% higher than those of OS alone.
(4) The loading of the transition metal salt on the SA not only increases the oxygenate content but also promotes the cracking and aromatization of the aliphatic hydrocarbons to form short-chain aliphatic and aromatic hydrocarbons. Furthermore, the contents of aliphatic compounds, represented by an alkane and an olefin, increase. When SA is used as support, the order of the catalytic effect of the transition metal salt is CuCl2·2H2O > NiCl2·6H2O > ZnCl2.
The catalyst of shale ash cannot only accelerate the pyrolysis of the shale ash, but also change the compositions of the shale ash. It guides reducing pyrolysis temperature and obtaining the stable shale oil. On the base of the present research, further work is suggested on the effect of the catalysis on the composition and structure of shale oil. Moreover, the mechanic strength of the block SA-based catalysts should also be investigated.

Author Contributions

Conceptualization, F.J.; Investigation, H.L. and C.G.; Resources, X.L. and G.L.; Writing—original draft, H.L.; Writing—review & editing, H.P.

Funding

This research was funded by the Talent Scientific research fund of LSHU (No. 2018XJJ-011), the Open Foundation of Key Laboratory of Industrial Ecology and Environmental Engineering, MOE (No. KLIEEE-18-04), the Natural Science Foundation Guidance and Planning Program of Liaoning Province, China (2019-ZD0065), the General Project for Higher Education Research of Education Department of Liaoning Province, China (L2016016), the National Natural Science Foundation of China (NO.51706091), the PhD research startup foundation of Liaoning Shihua University (NO.2016XJJ-025), the National Natural Science Foundation of China (Nos. 51508464, 11572249), the Natural Science Foundation of Shanxi Province (No. 2017JM1013), the Astronautics Supporting Technology Foundation of China (No. 2017-HT-XG), and the Fundamental Research Funds for the Central Universities (No. 3102018ZY015).

Conflicts of Interest

The authors declare that there is no conflict of interests regarding the publication of this article.

References

  1. Liu, Z.J.; Meng, Q.; Dong, Q.; Zhu, J.; Guo, W.; Ye, S.; Liu, R.; Jia, J.L. Characteristics and resource potential of oil shale in China. Oil Shale 2017, 34, 15–41. [Google Scholar] [CrossRef]
  2. Liu, Z.J.; Yang, D.; Hu, Y.Q.; Zhang, J.W.; Shao, J.X.; Song, S.; Kang, Z.Q. Influence of In Situ Pyrolysis on the Evolution of Pore Structure of Oil Shale. Energies 2018, 11, 755. [Google Scholar] [CrossRef]
  3. Fuke, D.; Zijun, F.; Yang, D.; Zhao, Y.S.; Derek, E. Permeability Evolution of Pyrolytically-Fractured Oil Shale under In Situ Conditions. Energies 2018, 11, 3033–3041. [Google Scholar]
  4. Hu, S.Y.; Xiao, C.L.; Jiang, X.; Liang, X.J. Potential Impact of In-Situ Oil Shale Exploitation on Aquifer System. Water 2018, 10, 649. [Google Scholar] [CrossRef]
  5. Wang, S.; Liu, J.X.; Jiang, X.M.; Han, X.X.; Tong, J.H. Effect of heating rate on products yield and characteristics of non-condensable gases and shale oil obtained by retorting Dachengzi oil shale. Oil Shale 2013, 30, 27–47. [Google Scholar] [CrossRef]
  6. Araújo, A.M.M.; Queiroz, G.S.M.; Maia, D.O.; Gondim, A.; Souza, L.D.; Fernandes, V.J.; Araujo, A.S. Fast Pyrolysis of Sunflower Oil in the Presence of Microporous and Mesoporous Materials for Production of Bio-Oil. Catalysts 2018, 8, 261. [Google Scholar] [CrossRef]
  7. Du, W.Z.; Wang, Y.; Liu, X.L.; Sun, L.L. Study on Low Temperature Oxidation Characteristics of Oil Shale Based on Temperature Programmed System. Energies 2018, 11, 2594–2605. [Google Scholar] [CrossRef]
  8. Williams, P.T.; Chishti, H.M. Two stage pyrolysis of oil shale using a zeolite catalyst. J. Anal. Appl. Pyrolysis 2000, 55, 217–234. [Google Scholar] [CrossRef]
  9. Williams, P.T.; Chishti, H.M. Influence of residence time and catalyst regeneration on the pyrolysis–zeolite catalysis of oil shale. J. Anal. Appl. Pyrolysis 2001, 60, 187–203. [Google Scholar] [CrossRef]
  10. Gai, R.H.; Jin, L.J.; Zhang, J.B.; Wang, J.Y.; Hu, H.Q. Effect of inherent and additional pyrite on the pyrolysis behavior of oil shale. J. Anal. Appl. Pyrolysis 2014, 105, 342–347. [Google Scholar] [CrossRef]
  11. Hu, M.J.; Cheng, Z.Q.; Zhang, M.Y.; Liu, M.Z.; Song, L.H.; Zhang, Y.Q.; Li, J.F. Effect of Calcite, Kaolinite, Gypsum, and Montmorillonite on Huadian Oil Shale Kerogen Pyrolysis. Energy Fuels 2014, 28, 1860–1867. [Google Scholar] [CrossRef]
  12. Jiang, H.F.; Song, L.H.; Cheng, Z.Q.; Chen, J.; Zhang, L.; Zhang, M.Y.; Hu, M.J.; Li, J.N.; Li, J.F. Influence of pyrolysis condition and transition metal salt on the product yield and characterization via Huadian oil shale pyrolysis. J. Anal. Appl. Pyrolysis 2015, 112, 230–236. [Google Scholar] [CrossRef]
  13. Chang, Z.B.; Chu, M.; Zhang, C.; Bai, S.X.; Lin, H.; Ma, L.B. Investigation of the effect of selected transition metal salts on the pyrolysis of huadian oil shale, china. Oil Shale 2017, 34, 354–367. [Google Scholar] [CrossRef]
  14. Öztaş, N.A.; Yürüm, Y. Effect of Catalysts on the Pyrolysis of Turkish Zonguldak Bituminous Coal. Fuel Energy Abstr. 2000, 14, 820–827. [Google Scholar] [CrossRef]
  15. Zou, X.W.; Yao, J.Z.; Yang, X.M.; Song, W.L.; Lin, W.G. Catalytic Effects of Metal Chlorides on the Pyrolysis of Lignite. Energy Fuels 2007, 21, 619–624. [Google Scholar] [CrossRef]
  16. Shi, W.J.; Wang, Z.; Song, W.L.; Li, S.G.; Li, X.Y. Pyrolysis of Huadian oil shale under catalysis of shale ash. J. Anal. Appl. Pyrolysis 2016, 123, 160–164. [Google Scholar] [CrossRef]
  17. Lai, D.G.; Chen, Z.H.; Chen, Z.H.; Lin, L.X.; Zhang, Y.M.; Gao, S.Q.; Xu, G.W. Secondary Cracking and Upgrading of Shale Oil from Pyrolyzing Oil Shale over Shale Ash. Energy Fuels 2015, 29, 2219–2226. [Google Scholar] [CrossRef]
  18. Jaber, J.; Abu-Rahmeh, T.; Al-Alawin, A.; Kloub, N.M. Surface Retorting of Jordanian Oil Shale and Associated CO2 Emissions. Jordan J. Mech. Ind. Eng. 2010, 4, 591–596. [Google Scholar]
  19. Yang, Y.C.; Jia, F.R.; Jian, W.W.; Zhang, S.P.; Ma, D.Z.; Liu, G.X. Influence of Cr3+ Concentration on SO2 Removal over TiO2 Based Multi-Walled Carbon Nanotubes. China Pet. Process. Petrochem. Technol. 2019, 1, 23–35. [Google Scholar]
  20. Jia, F.R.; Li, Z.; Wang, E.G.; He, J.C.; Dong, H.; Liu, G.X.; Jian, W.W. Preparation and SO2 adsorption behavior of coconut shell-based activated carbon via microwave-assisted oxidant activation. China Pet. Process. Petrochem. Technol. 2018, 20, 67–74. [Google Scholar]
  21. Wang, Z.J.; Deng, S.H.; Gu, Q.; Zhang, Y.M.; Cui, X.J.; Wang, H.Y. Pyrolysis kinetic study of Huadian oil shale, spent oil shale and their mixtures by thermogravimetric analysis. Fuel Process. Technol. 2013, 110, 103–108. [Google Scholar] [CrossRef]
  22. Pan, L.W.; Dai, F.Q.; Huang, J.J.; Liu, S.; Li, G.Q. Study of the effect of mineral matters on the thermal decomposition of Jimsar oil shale using TG-MS. Thermochim. Acta 2016, 627, 31–38. [Google Scholar] [CrossRef]
  23. Lai, D.G.; Shi, Y.; Geng, S.L.; Chen, Z.H.; Gao, S.Q.; Zhan, J.H.; Xu, G.W. Secondary reactions in oil shale pyrolysis by solid heat carrier in a moving bed with internals. Fuel 2016, 173, 138–145. [Google Scholar] [CrossRef]
  24. Burnham, A.K. Chemistry and Kinetics of Oil Shale Retorting. In Oil Shale: A Solution to the Liquid Fuel Dilemma; ASC: Washington, DC, USA, 2010; Volume 1032, pp. 115–134. [Google Scholar]
  25. Dung, N.V.; Yip, V. Basis of reactor design for retorting Australian oil shales. Fuel 1991, 70, 1336–1341. [Google Scholar] [CrossRef]
  26. Xiong, L.P.; Hu, S.B.; Wang, J. Analysis on the thermal conductivity of rocks from se china. Acta Petrol. Sin. 1994, 10, 323–329. [Google Scholar]
  27. Wu, Y.Y.; Qin, Y.; Liu, J.Z.; Wang, A.K. Catalysis Action of Mineral/Metal Elements during Coalderived Hydrocarbons Process, An Example of the Late Permian Coal from Dahebian Coal Mine in Eastern Yunnan and Western Guizhou. J. Nat. Gas Geosci. 2012, 23, 141–152. [Google Scholar]
  28. Li, S.Y.; Lin, S.J.; Guo, S.H.; Liu, L.F. Effects of inorganic salts on the hydrocarbon generation from kerogens. Geochimica 2002, 31, 15–20. [Google Scholar]
  29. Han, J.Z.; Wang, X.D.; Yue, J.R.; Gao, S.Q.; Xu, G.W. Catalytic upgrading of coal pyrolysis tar over char-based catalysts. Fuel Process. Technol. 2014, 122, 98–106. [Google Scholar] [CrossRef]
  30. Bai, F.T.; Guo, W.; Lü, X.S.; Liu, Y.M.; Guo, M.Y.; Li, Q.; Sun, Y.H. Kinetic study on the pyrolysis behavior of Huadian oil shale via non-isothermal thermogravimetric data. Fuel 2015, 146, 111–118. [Google Scholar] [CrossRef]
  31. Bai, F.T.; Sun, Y.H.; Liu, Y.M.; Liu, B.C.; Guo, M.Y.; Lü, X.S.; Guo, W.; Li, Q.; Hou, C.B.; Wang, Q.W. Kinetic Investigation on Partially Oxidized Huadian Oil Shale by Thermogravimetric Analysis. Oil Shale 2014, 31, 377–393. [Google Scholar] [CrossRef]
  32. Niu, M.T.; Wang, S.; Han, X.X.; Jiang, X.M. Yield and characteristics of shale oil from the retorting of oil shale and fine oil-shale ash mixtures. Appl. Energy 2013, 111, 234–239. [Google Scholar] [CrossRef]
  33. Yürüm, Y.; Dror, Y.; Levy, M. Effect of acid dissolution on the mineral matrix and organic matter of Zefa EFE oil shale. Fuel Process. Technol. 1985, 11, 71–86. [Google Scholar] [CrossRef]
  34. Yariv, S. Infrared Evidence for the Occurrence of SiO Groups with Double-Bond Character in Antigorite, Sepiolite and Palygorskite. Clay Miner. 1986, 21, 925–935. [Google Scholar] [CrossRef]
  35. Wu, L.M.; Tong, D.S.; Zhao, L.Z.; Yu, W.H.; Zhou, C.H.; Wang, H. Fourier transform infrared spectroscopy analysis for hydrothermal transformation of microcrystalline cellulose on montmorillonite. Appl. Clay Sci. 2014, 95, 74–82. [Google Scholar] [CrossRef]
  36. Madejová, J. FTIR techniques in clay mineral studies. Vib. Spectrosc. 2003, 31, 1–10. [Google Scholar] [CrossRef]
  37. Farmer, V.C. Transverse and longitudinal crystal modes associated with OH stretching vibrations in single crystals of kaolinite and dickite. Spectrochim. Acta Part A Mol. Biomol. Spectrosc. 2000, 56, 927–930. [Google Scholar] [CrossRef]
  38. Wang, Q.; Yan, Y.H.; Jia, C.X.; Zhu, Y.C. FTIR analysis and pyrolysis characteristics of oil shale from Gansu province. Chem. Ind. Eng. Prog. 2014, 33, 1730–1734. [Google Scholar]
  39. Wang, Z.J.; Deng, S.H.; Gu, Q.; Cui, X.J.; Zhang, Y.M.; Wang, H.Y. Subcritical Water Extraction of Huadian Oil Shale under Isothermal Condition and Pyrolysate Analysis. Energy Fuels 2014, 28, 2305–2313. [Google Scholar] [CrossRef]
  40. Wang, Q.; Hou, Y.C.; Yu, W.Z.; Ren, Z.; Liu, S.H.; Liu, Q.Y.; Liu, Z.Y. A study on the structure of Yilan oil shale kerogen based on its alkali-oxygen oxidation yields of benzene carboxylic acids, 13 C NMR and XPS. Fuel Process. Technol. 2017, 166, 30–40. [Google Scholar] [CrossRef]
  41. Palayangoda, S.S.; Nguyen, Q.P. An ATR-FTIR procedure for quantitative analysis of mineral constituents and kerogen in oil shale. Oil Shale 2012, 29, 344–356. [Google Scholar] [CrossRef]
  42. Xing, Q.Y.; Yang, M.; Yang, H.X.; Zu, E.D. Study on the Gemological Characteristics of Amber from Myanmar and Chinese Fushun. Key Eng. Mater. 2013, 544, 172–177. [Google Scholar] [CrossRef]
  43. Wang, Q.; Ye, J.B.; Yang, H.Y.; Liu, Q. Chemical composition and structural characteristics of oil shales and their kerogens using FTIR and solid-state 13C NMR. Energy Fuels 2016, 30, 6271–6280. [Google Scholar] [CrossRef]
  44. Wang, Q.; Xu, X.C.; Chi, M.S.; Zhang, H.X.; Cui, D.; Bai, J.R. FT-IR study on composition of oil shale kerogen and its pyrolysis oil generation characteristics. J. Fuel Chem. Technol. 2015, 43, 1158–1166. [Google Scholar]
  45. Painter, P.C.; Snyder, R.W.; Starsinic, M.; Coleman, M.M.; Kuehn, D.W.; Davis, A. Concerning the Application of FTIR to the Study of Coal: A Critical Assessment of Band Assignments and the Application of Spectral Analysis Programs. Appl. Spectrosc. 1981, 35, 475–485. [Google Scholar] [CrossRef]
  46. Lin, L.X.; Zhang, C.; Li, H.J.; Lai, D.G.; Xu, G.W. Pyrolysis in indirectly heated fixed bed with internals: The first application to oil shale. Fuel Process. Technol. 2015, 138, 147–155. [Google Scholar] [CrossRef]
  47. Tiwari, P.K.; Deo, M. Compositional and kinetic analysis of oil shale pyrolysis using TGA–MS. Fuel 2012, 94, 333–341. [Google Scholar] [CrossRef]
  48. Harfi, K.E.; Mokhlisse, A.; Chanâa, M.B. Yields and composition of oil obtained by isothermal pyrolysis of the Moroccan (Tarfaya) oil shales with steam or nitrogen as carrier gas. J. Anal. Appl. Pyrolysis 2000, 56, 207–218. [Google Scholar] [CrossRef]
  49. Al-Harahsheh, A.; Al-Ayed, O.; Al-Harahsheh, M.; Abu-El-Halawah, R. Heating rate effect on fractional yield and composition of oil retorted from El-lajjun oil shale. J. Anal. Appl. Pyrolysis 2010, 89, 239–243. [Google Scholar] [CrossRef]
Figure 1. (a) TG (Thermal Gravity) and (b) DTG (Differential Thermal Gravity) curves for different mass ratios of OS:SA.
Catalysts 09 00900 g001
Figure 2. Conversion curves of different mass ratios of OS and SA.
Catalysts 09 00900 g002
Figure 3. Thermogravimetric curves of OS under shale ash-based catalyst: (a,d,g) TG; (b,e,h) DTG; (c,f,i) conversion rate.
Catalysts 09 00900 g003aCatalysts 09 00900 g003b
Figure 4. Thermogravimetric curves of OS with SA loading 3 wt% of ZnCl2, NiCl2·6H2O and CuCl2·2H2O: (a) TG; (b) DTG; (c) conversion rate.
Catalysts 09 00900 g004
Figure 5. Effects of SA and its supported transition metal salts on the yield of OS pyrolysis products.
Catalysts 09 00900 g005
Figure 6. FTIR spectra of OS and SC (a) without catalyst and (b) with catalyst.
Catalysts 09 00900 g006
Figure 7. FTIR analysis of shale oil produced with and without catalysts.
Catalysts 09 00900 g007
Figure 8. Relative content of main components in shale oil.
Catalysts 09 00900 g008
Figure 9. Distribution of (a) n-paraffins and (b) n-olefins within shale oil.
Catalysts 09 00900 g009
Table 1. Industrial analysis and elemental analysis of oil shale (OS) and shale ash (SA).
Industrial Analysis, %Elemental Analysis, %
SampleMadAadVadFCad *CadHadNadOad *Sad
OS2.8877.1917.762.1710.861.890.746.160.28
SA0.5590.695.972.794.980.561.161.310.75
* subtraction method.
Table 2. Ash XRF (X–ray fluorescence) analysis of Fushun oil shale.
ConstituentSiO2Al2O3Fe2O3SO3K2OMgOTiO2P2O5CaOOther
Content, %58.1423.1910.271.511.441.421.361.271.070.33
Table 3. Thermal kinetic parameters of oil shale with and without catalyst.
SampleT (K)E (kJ/mol)A (min−1)R2
OS697–778116.041.9 × 1070.9962
OS–SA696–768104.963.1 × 1060.9957
OS–SA–Zn681–76193.344.8 × 1050.9986
OS–SA–Ni682–75891.614.2 × 1050.9985
OS–SA–Cu688–75383.209.9 × 1040.9987

