Article

Enhanced Performance of Electrospun Nanofibrous TiO2/g-C3N4 Photocatalyst in Photocatalytic Degradation of Methylene Blue

by
Feidias Bairamis
,
Ioannis Konstantinou
*,
Dimitrios Petrakis
and
Tiverios Vaimakis
*
Department of Chemistry, University of Ioannina, 45110 Ioannina, Greece
*
Authors to whom correspondence should be addressed.
Catalysts 2019, 9(11), 880; https://doi.org/10.3390/catal9110880
Submission received: 8 October 2019 / Accepted: 21 October 2019 / Published: 24 October 2019

Abstract

:
TiO2/g-C3N4 (GNT) fibers with 1%, 2.5% and 5% (wt%) ratios have been synthesized via one-step electrospinning using polyvinylpyrrolidone (PVP) polymer. Results showed mesoporous fibrous catalysts consisted of anatase (80.0–85.1%) and rutile phase (14.9–20.0%), with diameter between 200–300 nm and band gap lower than 3.0 eV confirming the absorption shift to visible-light region. The formation of OH radicals and methylene blue dye degradation increases as the g-C3N4 doping percent also increases, following the trend ΤiO2 < GNT1% ≈ GNT2.5% < GNT5%. A z-scheme mechanism is attributed to the photocatalytic performance confirming the potential for green chemistry and environmental technology applications.

1. Introduction

Heterogeneous photocatalysis is among the advanced oxidation processes (AOP’s) with growing applications in water and air treatment for the removal of various pollutants and disinfection. TiO2 is the most used photocatalyst because of its high chemical and photochemical stability, high photocatalytic activity and low cost. However, the photocatalytic activity of TiO2 is constrained by the relatively high recombination rate of electron-hole (e-h+) pairs and the low efficiency for solar light due to the band gap of 3.0–3.2 eV. Therefore, much effort has been devoted to design heterostructured photocatalysts of TiO2 with other semiconductors with narrower band gap and suitable conduction and valence band potential levels. The photocatalytic properties of composite materials/heterostructures presented significant advantages like the decrease in electron-hole (e-h+) pair recombination rate, the absorption extension to wavelengths in the visible light region and the increase of the reactant adsorption into the catalyst surface [1,2,3].
Graphitic carbon nitride (g-C3N4) is a promising organic semiconductor with the focus of recent studies on photocatalytic applications. It has relatively narrow band gap (2.7 eV) with two-dimensional (2D) nanostructure, high thermal (up to 600 °C in air) and chemical stability due to s-triazine ring structure, high resistance in acidic and basic solutions and insolubility in common solvents as ethanol and water [4,5,6]. Moreover, is non-toxic and can be synthesized easily with low cost precursor compounds like cyanamide, urea and melamine. The g-C3N4 exhibits also the potential for degrading organic pollutants under visible light irradiation. However, its photocatalytic efficiency is quite limited due to the fast recombination of photogenerated electron-holes pairs [7].
Presently, there are many works exploring the TiO2/g-C3N4 heterojunction structure via various methods such as in situ growth TiO2 on g-C3N4 sheets [8], single-pot micro emulsion [9], simple calcination of P25/urea mixtures [10], electrospinning process [11], arginine-enabled biomimetic preparation TiO2 with thermal oxidation etching of g-C3N4 [12], in-situ hydrothermal method [13] and so on.
Electrospinning technique offers a simple preparation method of composite nanofibers from various polymers in large scale. In general, the nanofibers (1D) presented large surface area to volume ratioand they can weaken the recombination of electron-hole (h+-e) better than spherical particles, thus, the photocatalytic activity of a material can improve. Alternatively, the electrospinning technique can be also used for the fabrication of spherical particles [14,15,16].
There are previous works about the fabrication of composite TiO2/g-C3N4 fibers with electrospinning technique, following different experimental approaches (polymers, solvents, electrospinning parameters, light sources) and different g-C3N4/TiO2 ratios [15,17,18,19]. Comparing with the previous studies, the present work deals with: (a) The synthesis of g-C3N4/TiO2 fibers with different ratios (up to 5 wt%) of g-C3N4 and process conditions using PVP polymer, (b) all the reagents and precursors participated simultaneously to one-step electrospinning process, (c) a combination of solid-state and liquid phase characterization and analysis techniques for studying the catalysts properties and their photocatalytic performance. As a result, the aims of the study were the preparation of g-C3N4/TiO2 composites using a new experimental approach, the detailed characterization of the catalysts and the assessment of the photocatalytic activity using methylene blue dye as a model organic pollutant.

2. Results and Discussion

2.1. Characterization of the Prepared Photocatalysts

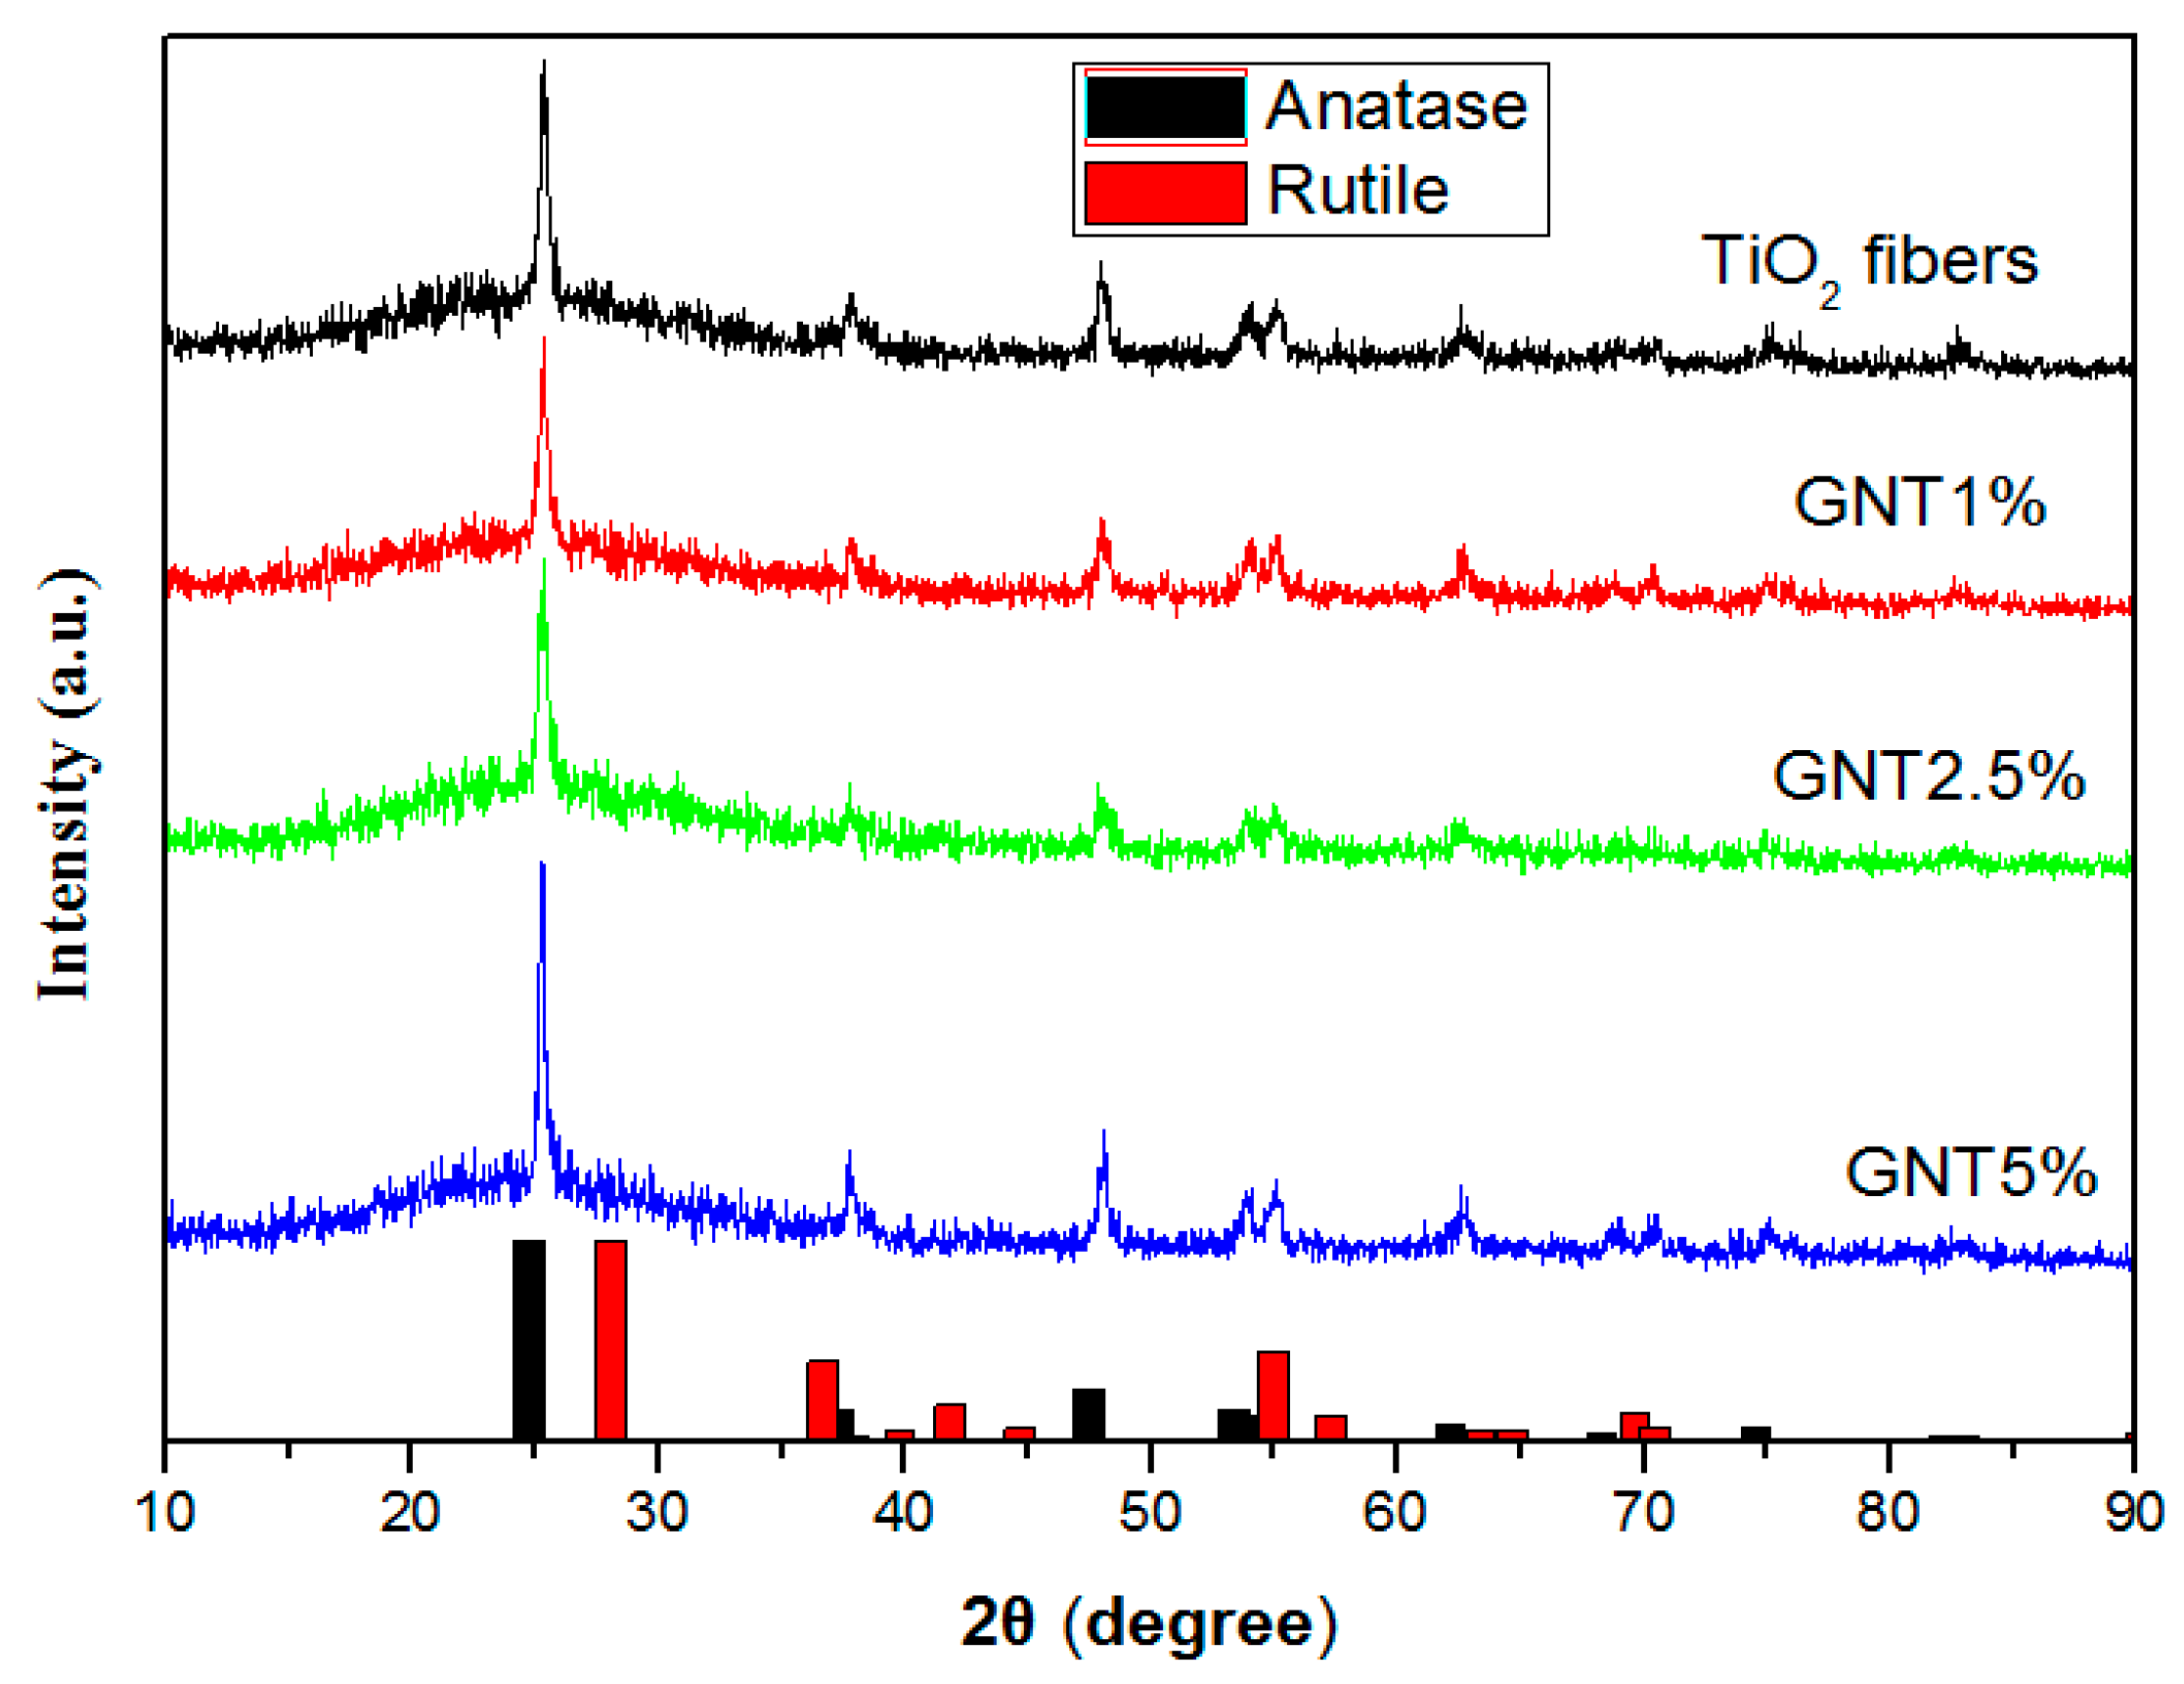
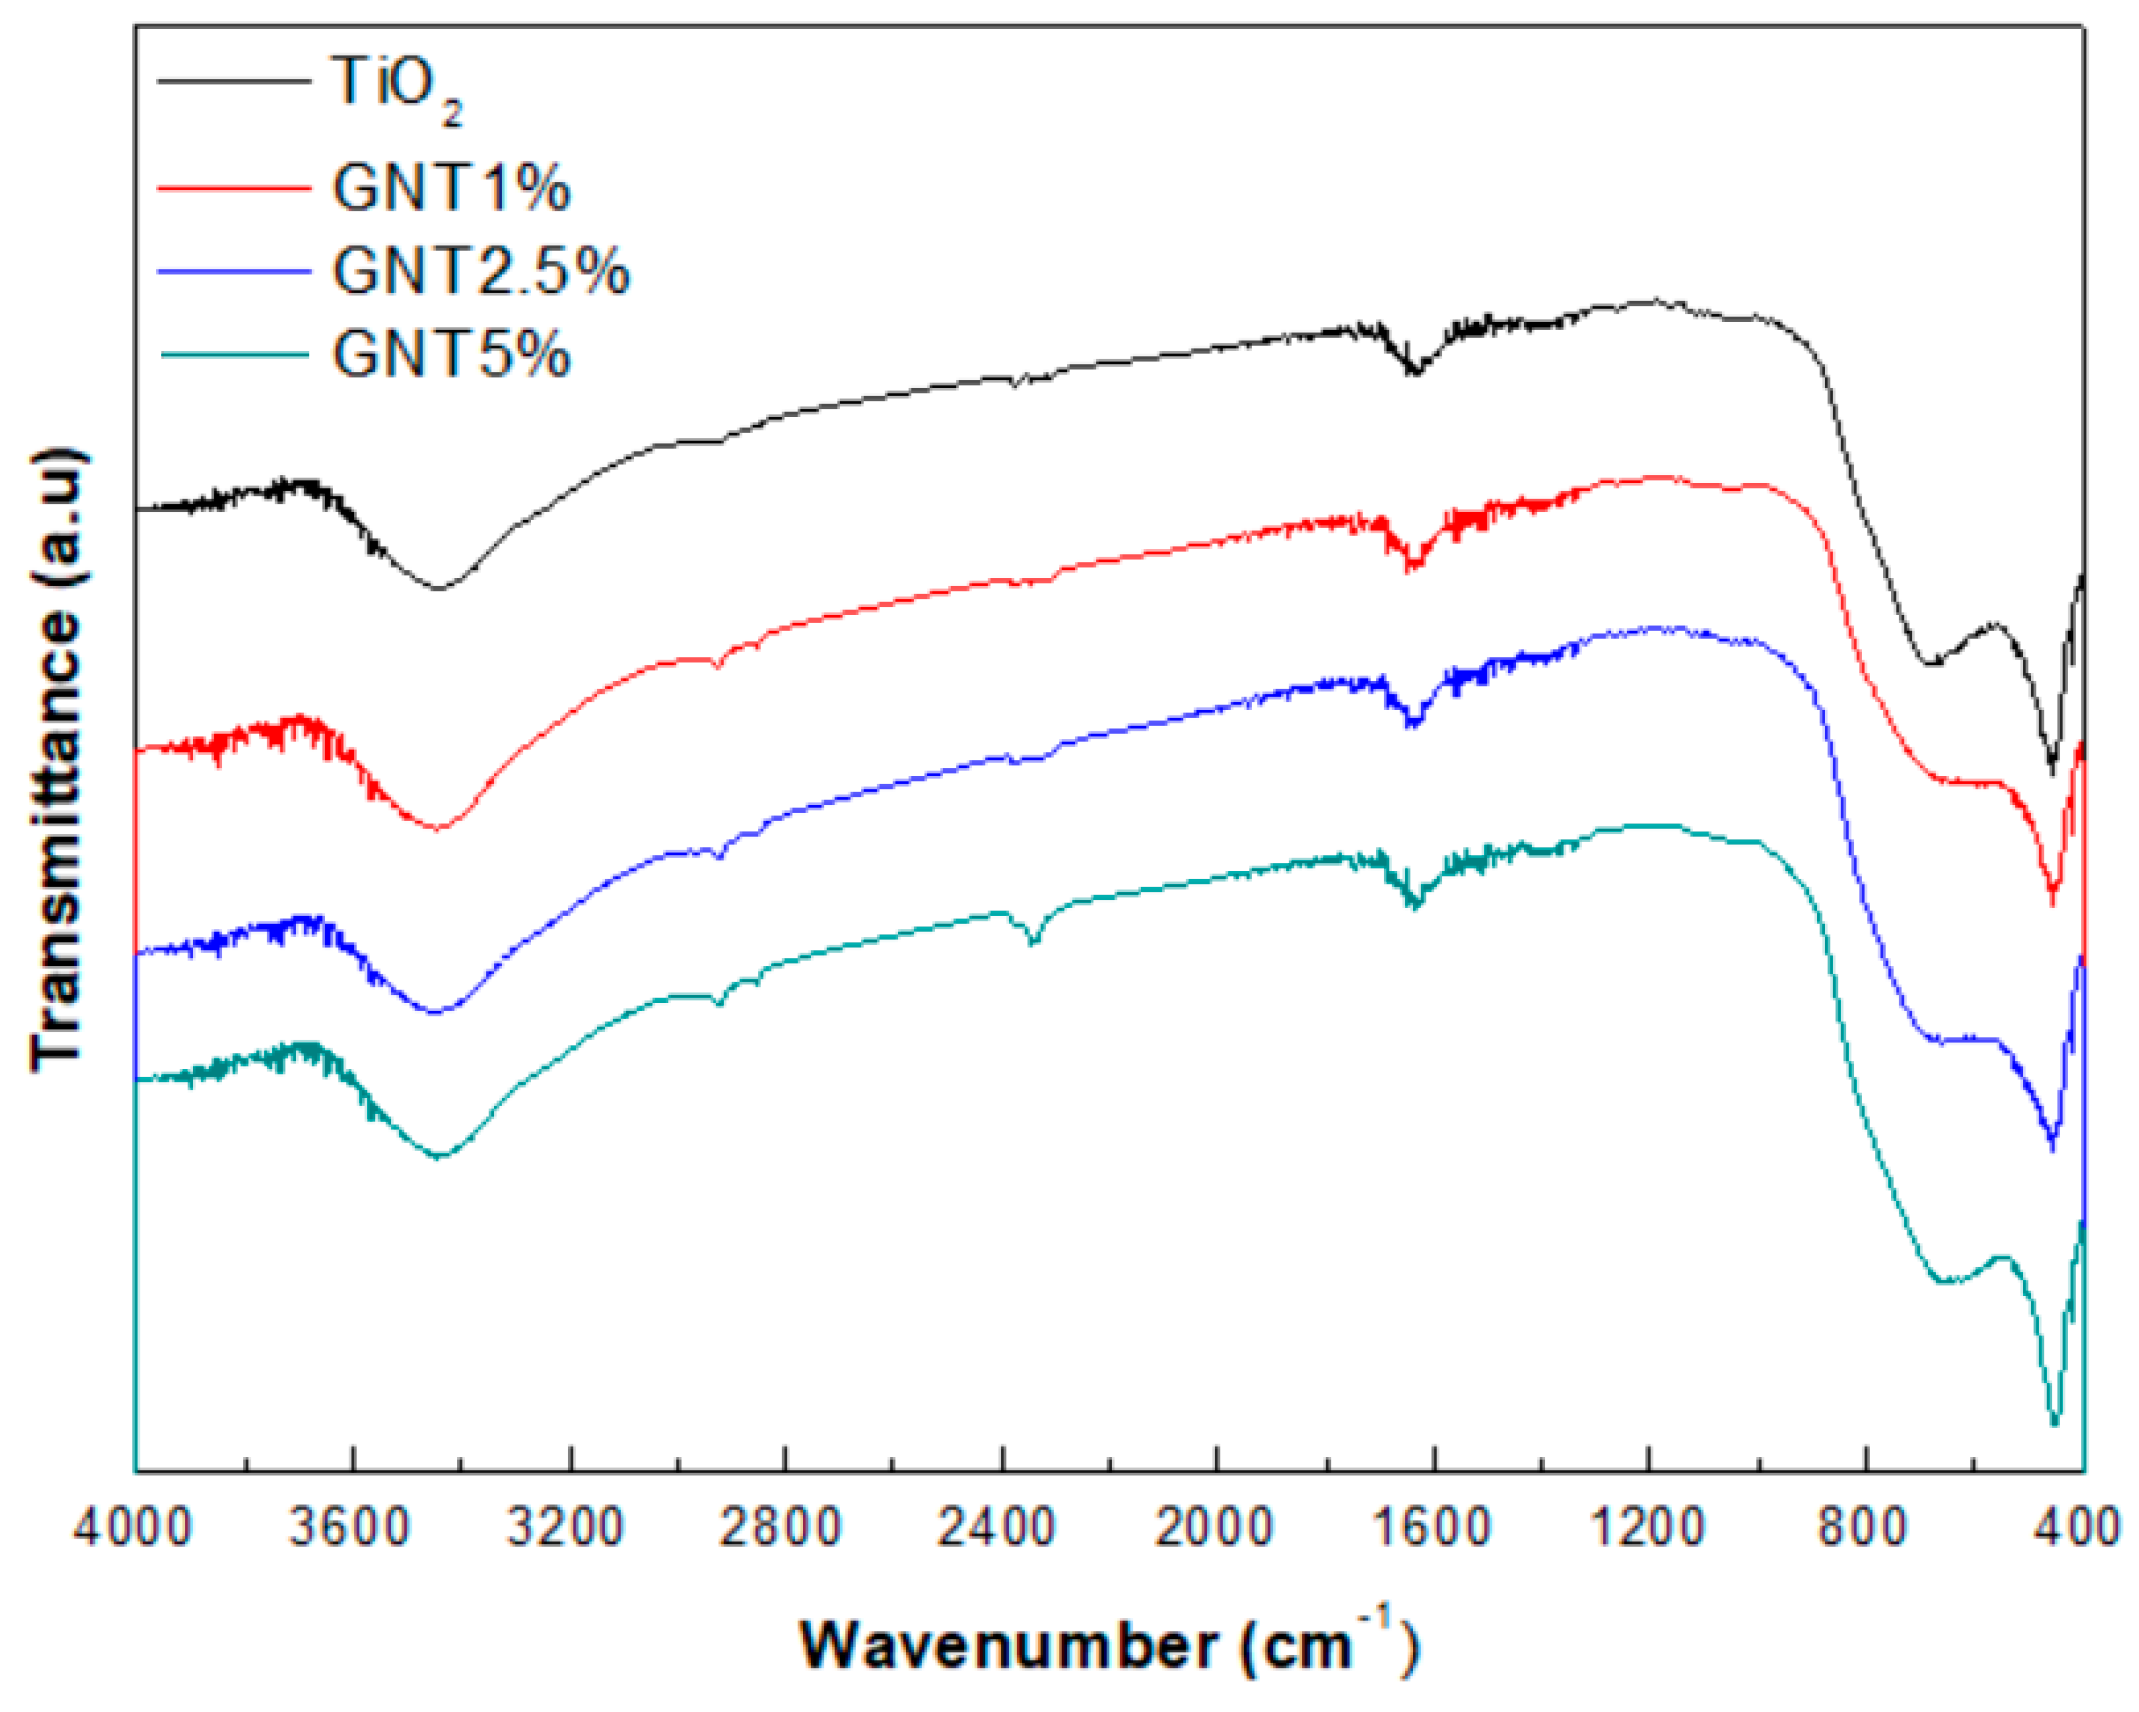
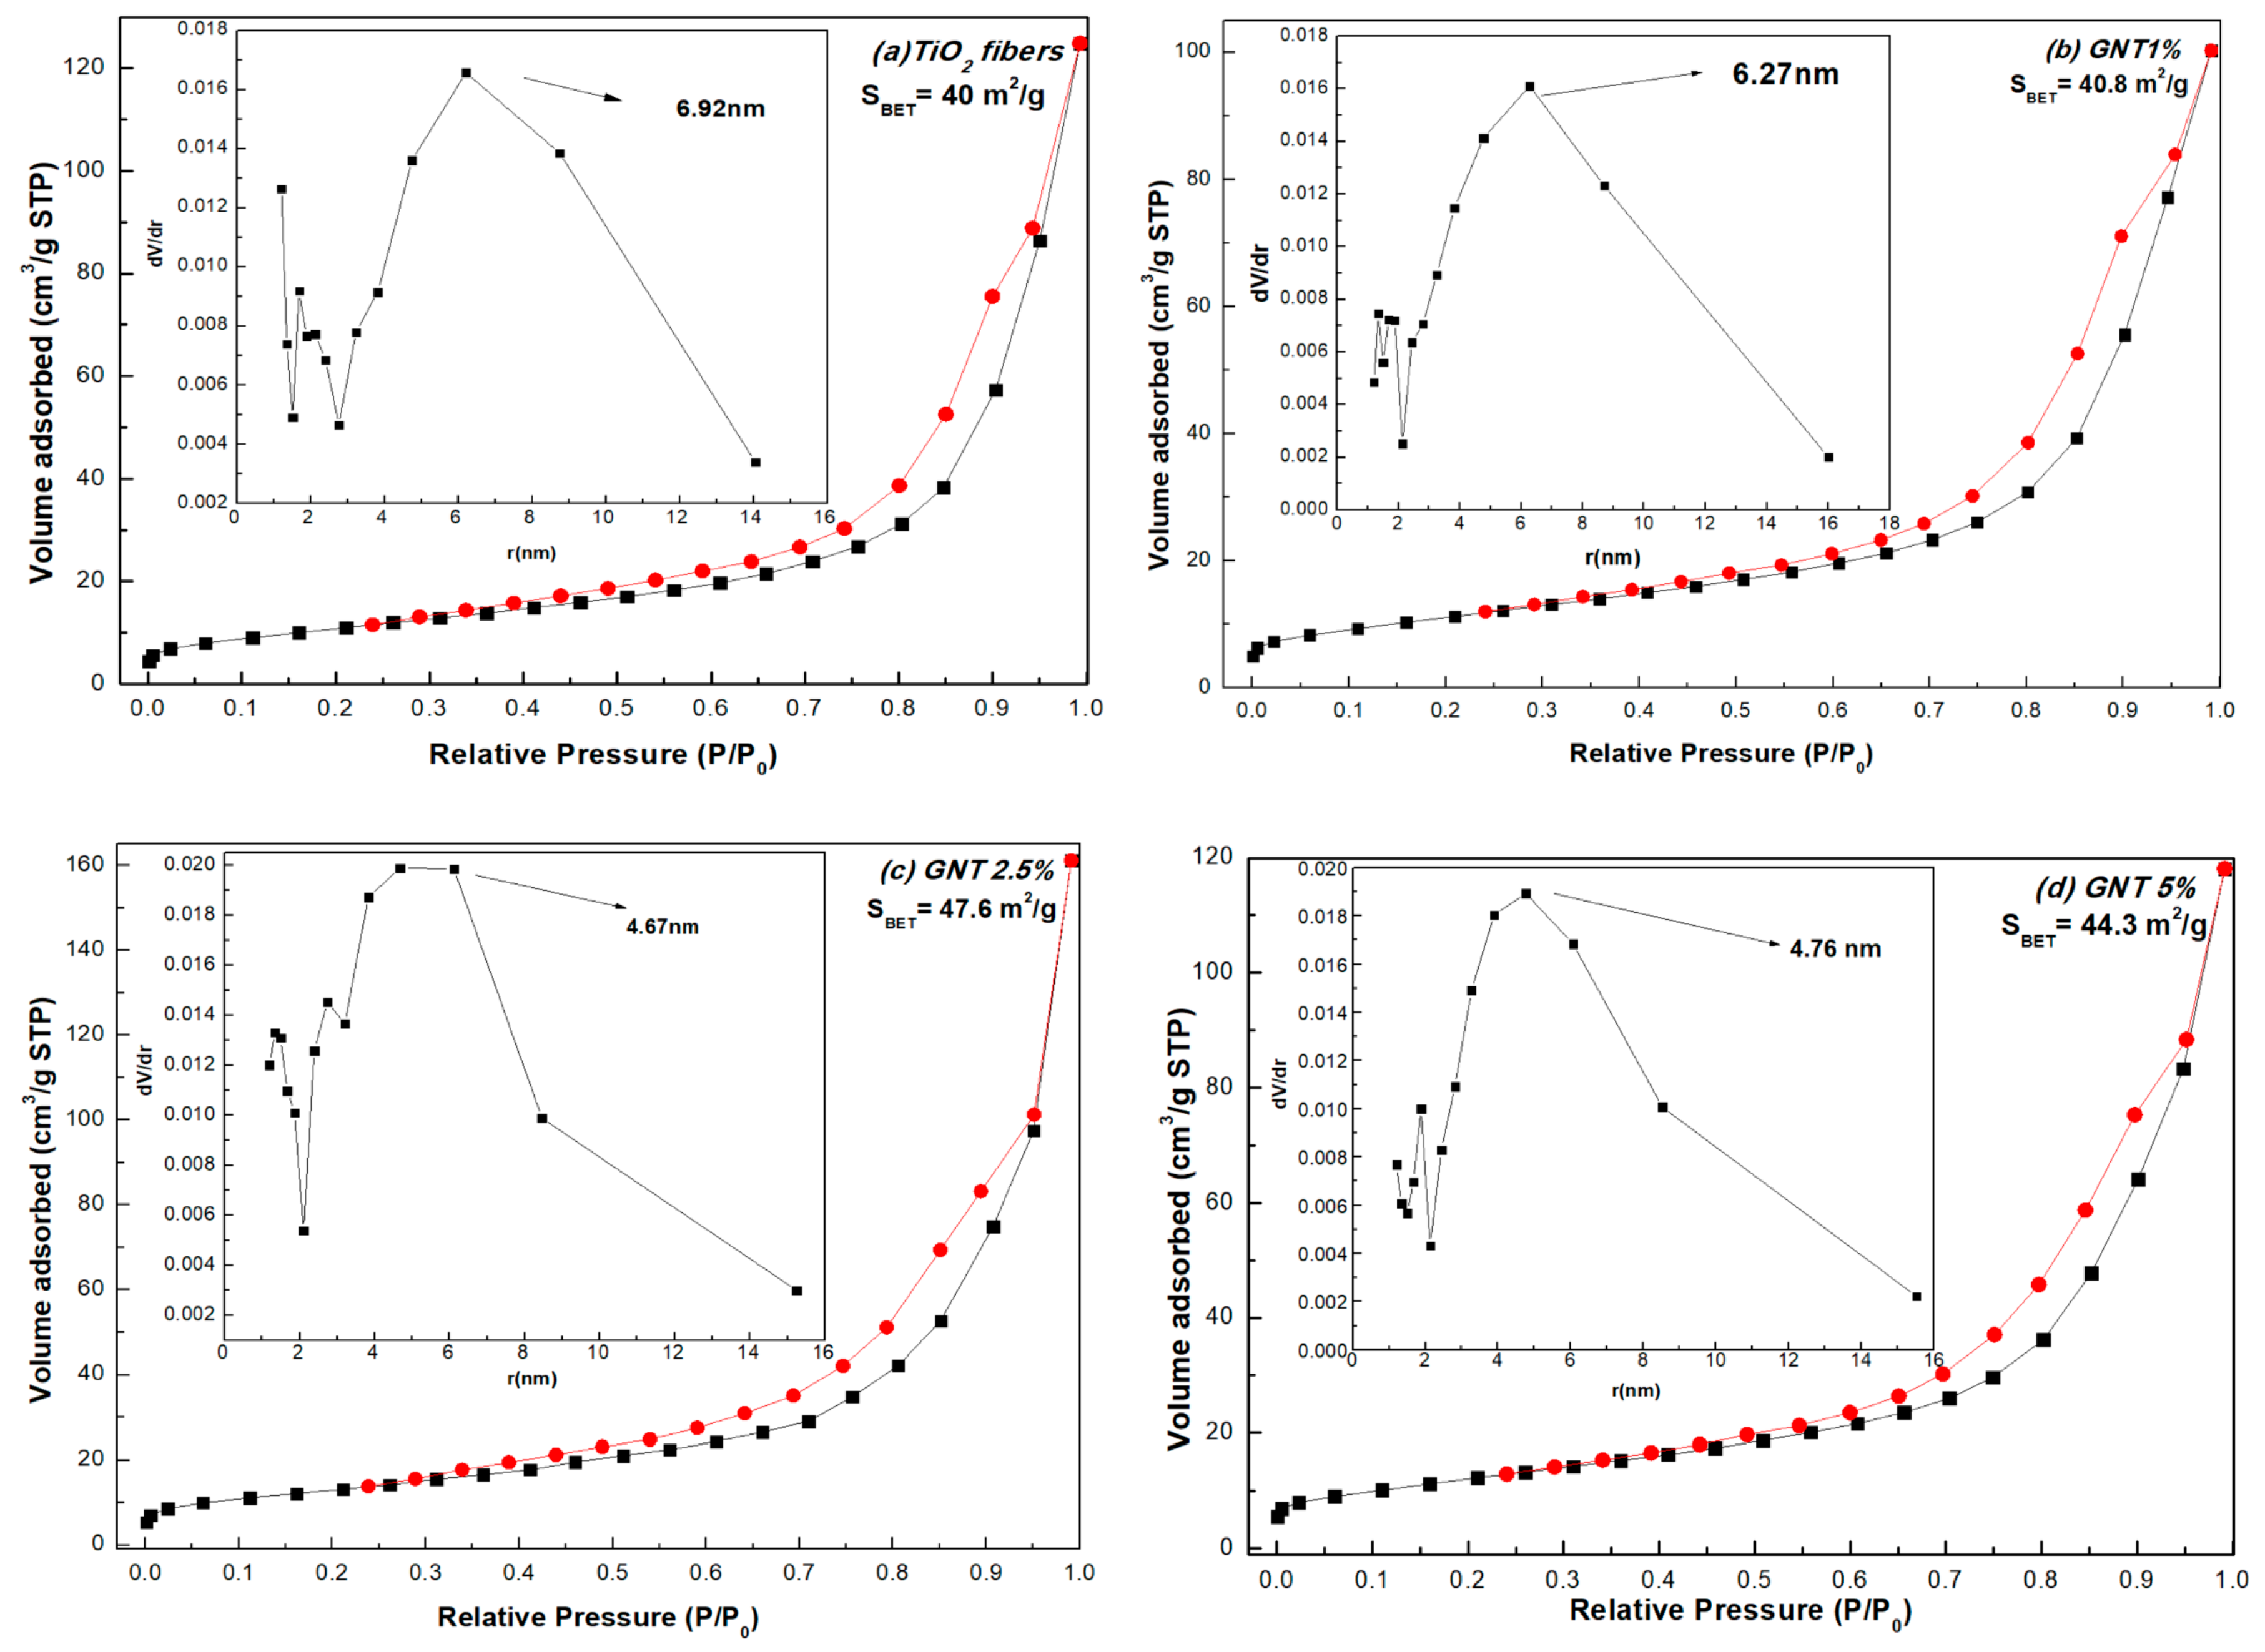
2.1.1. XRD Patterns and FT–IR Spectra

The XRD patterns for g-C3N4, TiO2 and g-C3N4/TiO2 composite fibers are shown in Figure S1 and Figure 1, respectively. For fibrous TiO2 and g-C3N4/TiO2 composites all the diffraction peaks are well matched to anatase TiO2 crystal phase using the Joint Committee on Powder Diffraction Standards (JCPDS no. 86-1157). Low amounts (<20%) of rutile (JCPDS no. 86-1157) phase were also observed. For g-C3N4 (JCPDS no. 87-1522) two characteristic intense peaks at 13.1° and 27.4° were observed. The peak at 2θ = 13.1° corresponds to the (100) plane of g-C3N4 and it is attributed to the in-plane repetitive and continuous heptazine network. The peak located at 2θ = 27.4° corresponds to the (002) plane of g-C3N4 and it is assigned to the stacking of the conjugated aromatic system [8,11,12,13]. Table 1 summarizes the percentages of anatase and rutile crystal phases and the crystal sizes of the prepared samples determined by the Scherrer equation [20]. The patterns (2θ° angles and peak shape) for g-C3N4/TiO2 did not significantly changed as regards to the reference TiO2 indicating that the coupling with g-C3N4 did not alter considerably the lattice structure of TiO2. The loading of g-C3N4 had no effect on the catalyst crystal size and the ratio of anatase to rutile crystal phases.
The FT-IR spectra of electrospun fibers of TiO2 and TiO2/g-C3N4 composite photocatalysts are presented in Figure 2. For all the fibers, the peaks at 680 and 450 cm−1 correspond to the Ti-O-Ti stretching vibration. Also, the peak at 3434 cm−1 corresponds to the stretching vibration mode O-H bonds of free water molecules and Ti-OH vibrations. Additionally, Figures S2 and S3 present the FT-IR spectra of PVP fibers and g-C3N4, respectively. The peaks of g-C3N4 can be observed at 1573, 1465, 1403, 1319 and 1241 cm−1 confirming the stretching vibration of C–N (–C)–C or C–NH–C heterocycles. The peaks between 3300 and 3000 cm−1 are related to the stretching vibration of N-H and the peak at 1637 cm−1 correspond to C=N bending vibration. The peak at 810 cm−1 is the most characteristic for g-C3N4 which is attributed to the out-of-plane bending vibration characteristic of heptazine rings [15,21]. Also, the characteristic peak of PVP fibers is the peak at 1657 cm−1, which confirms the presence of C=O bonds. The peaks at 3434 cm−1 and 2955 cm−1 correspond to O-H vibration and C-H asymmetric stretching vibration, respectively. In conclusion, the FT-IR spectra of the prepared catalysts presented the main characteristic peaks of both TiO2 and g-C3N4 suggesting the formation of composite heterostructures while some traces of PVP chemical functions (C=O bonds) still appeared suggesting the concurrent carbonaceous modification of TiO2.

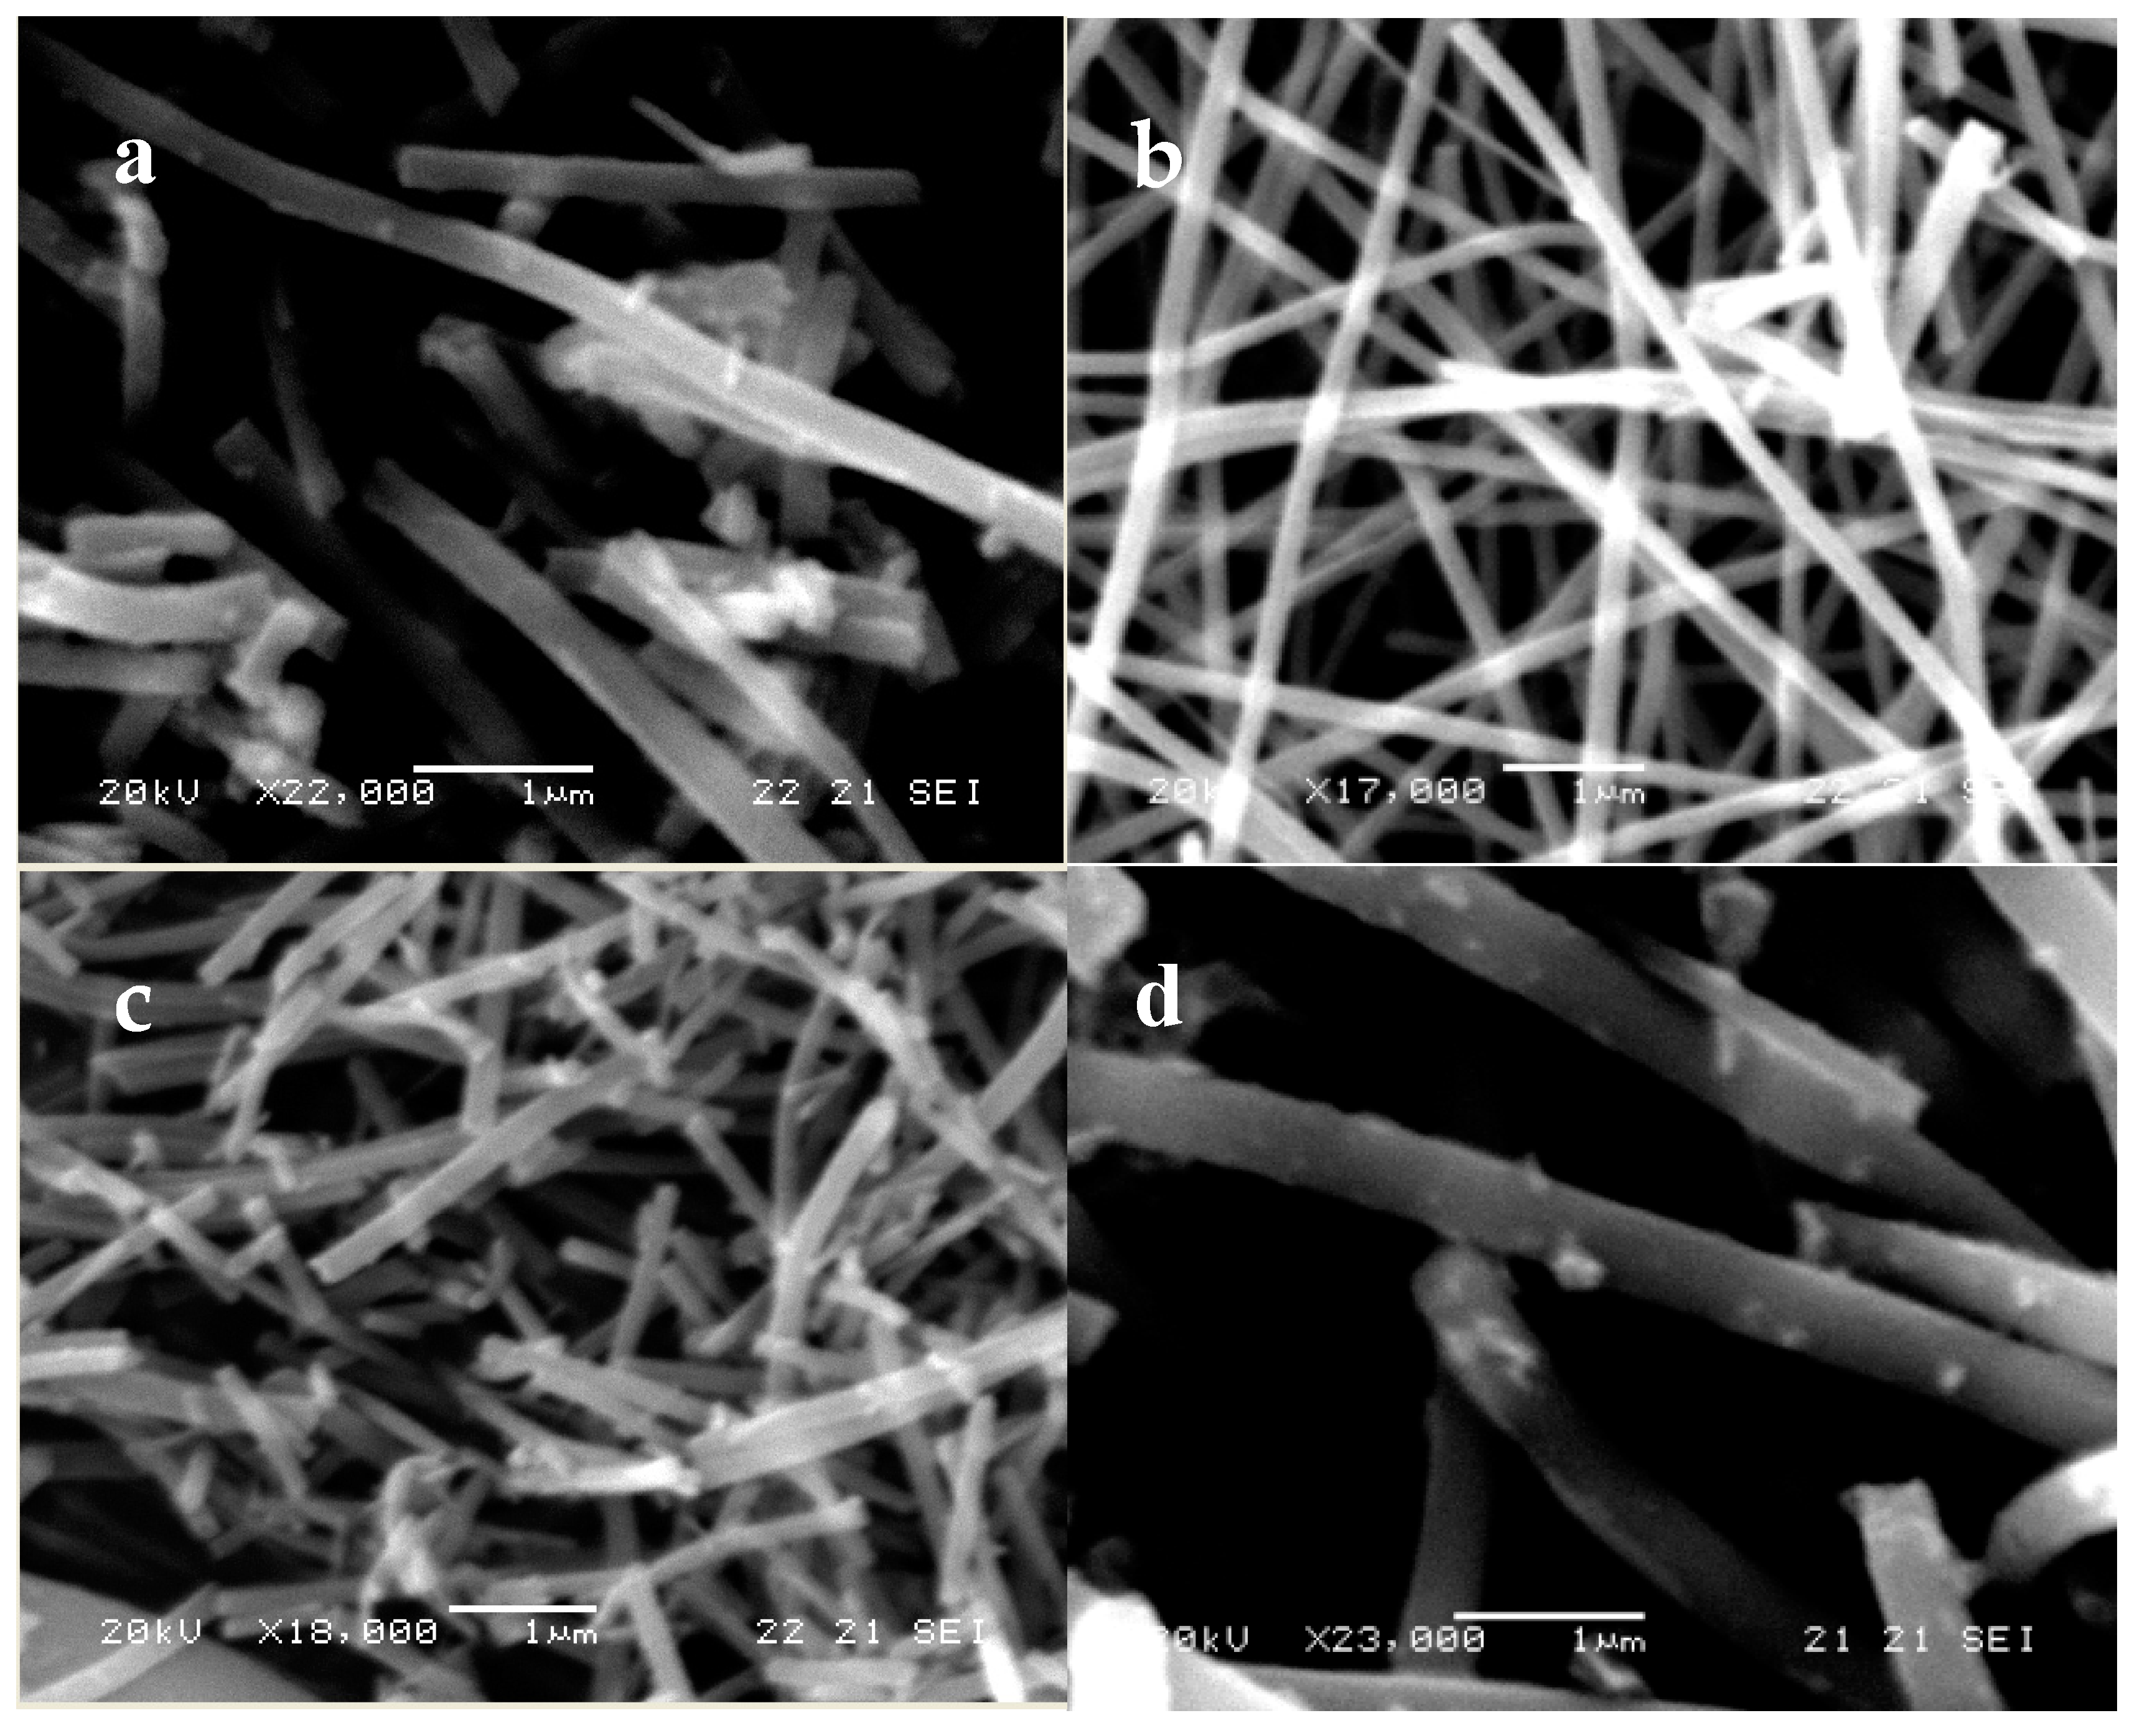
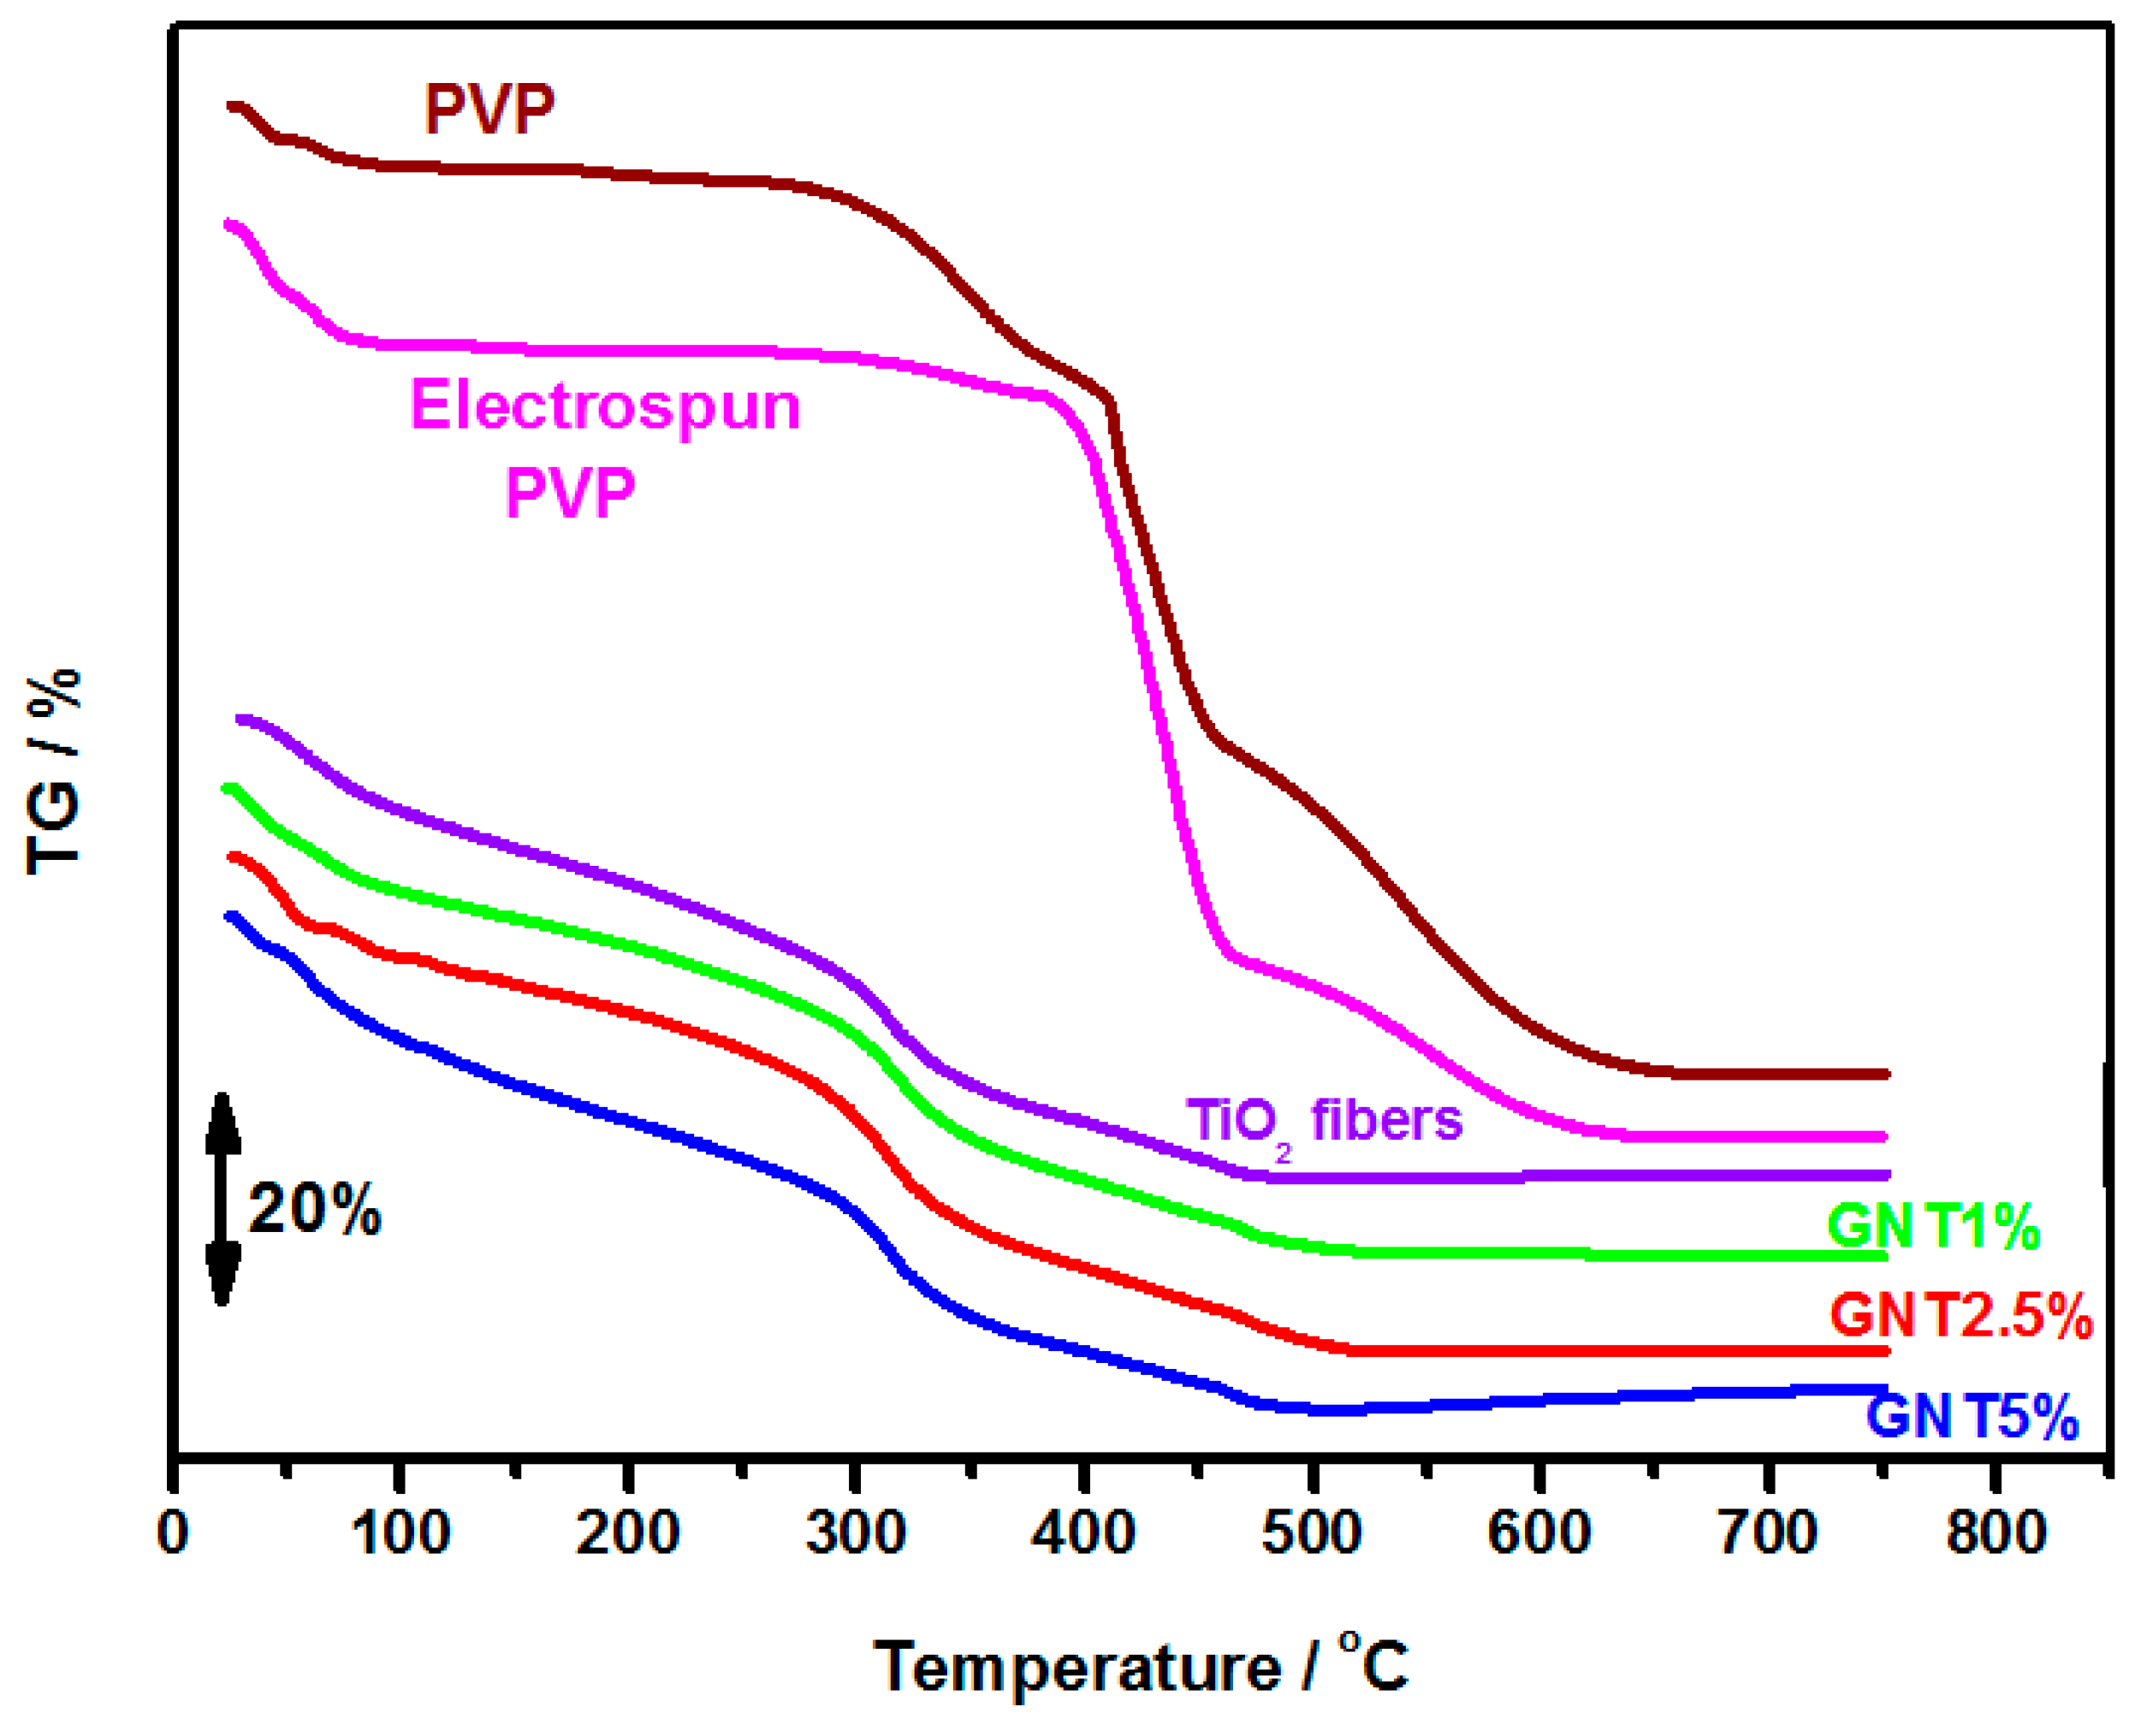
2.1.2. Morphology and Thermal Analysis

The nitrogen adsorption—desorption isotherms for the studied catalysts and g-C3N4 are displayed in Figure 3 and Figure S4, respectively. The synthesized fibers are typical mesoporous materials with type IVa adsorption isotherms with an H3 hysteresis loop type according to the IUPAC classification. BET specific surface area for g-C3N4/TiO2 composites ranged between 40 m2g−1 and 47 m2g−1. The pure g-C3N4 presented a specific surface of 35.2 m2g−1 and a narrow hysteresis that did not present the characteristics of mesoporous structure. The calculated surface area, pore diameter and total pore volume of the prepared catalysts are shown in Table 1.
The structural features of all catalysts were also studied by SEM. The as spun fibers and the fibers after calcinations appeared in Figure S5 and Figure 4, respectively. The diameter of as spun fibers varied between 300–350 nm and between 200–350 nm for the calcinated ones. Moreover, in Figure S6 it is shown the structure of bulk g-C3N4 consisting of stacking sheets.
In order to study the thermal degradation of the prepared electrospun precursors the thermal analyses were performed and presented in Figure 5 for thermal gravimetric analysis (TGA) curves and Figure S7 for differential scanning calorimetry (DSC) curves. Thermal analysis pattern of electrospun PVP shows degradation in three steps. The first endothermic step takes place up to temperature of 110 °C with a mass loss of about 13.3% and is attributed to the removal of remained solvent and adsorbed water. The second step is accompanied by two exothermic and one endothermic stage which could be attributed to the main decomposition of PVP. This step takes place at temperature range from about 300 to 475 °C, with a weight loss of about 67.8. The final step is attributed to combustion of the yielding organic matter as is denoted in DSC curve from one very broad exothermic peak up to temperature of about 665 °C. An exothermic peak at 197 °C, without mass loss, is takes place after the theoretical glass transition of PVP. With increase in molecular weight, PVP Tg increases to a limiting value of 180 °C [22]. The Tg response does not appear on the DSC curve due to the high moisture content, in both the electrospun sample and the commercial sample (the latter does not appear). Elishav et al. [23] studied the thermal shrinkage of electrospun PVP fibers and found that the shrinkage has a marked knee at 150–180 °C and this range coincides with the polymer glass transition temperature. They suggested that, as a result of a high rate fibers’ drying due to the intense solvents evaporation, an internal stress is applied which can relax during thermal treatment giving rise to non-uniform shrinkage that leads to shape loss.
The exothermic peak at 197 °C can be attributed to shrinkage phenomena. The fact that this exothermic peak does not appear in the commercial sample confirms this hypothesis.
The thermal behavior of all electrospun PVP/TTIP/g-C3N4 mixtures is similar. The decomposition of fibers takes place in three not well distinguished steps. The first endothermic step takes place up to a temperature of about 150 °C and is attributed to the removal of remained solvents. The other two steps were exothermic and are attributed to the degradation of PVP as well as to dehydration of titania gel. The exothermic crystallization peak of PVP at 197 °C is not observed which may suggest that significant covalent bonds existed between the titania gel and the polymer matrix, and therefore the shrinking process is not observed. On the other hand, the PVP degradation end is observed at about 560 °C, that is, 100 degree lower, indicating that titania catalyzes it.
The measured DLS median hydrodynamic particle size diameters of TiO2 fibers, GNT1%, GNT2.5% and GNT5% in aqueous suspensions after sonication for 10 min were 0.321, 0.239, 0.242 and 0.325 μm, respectively.

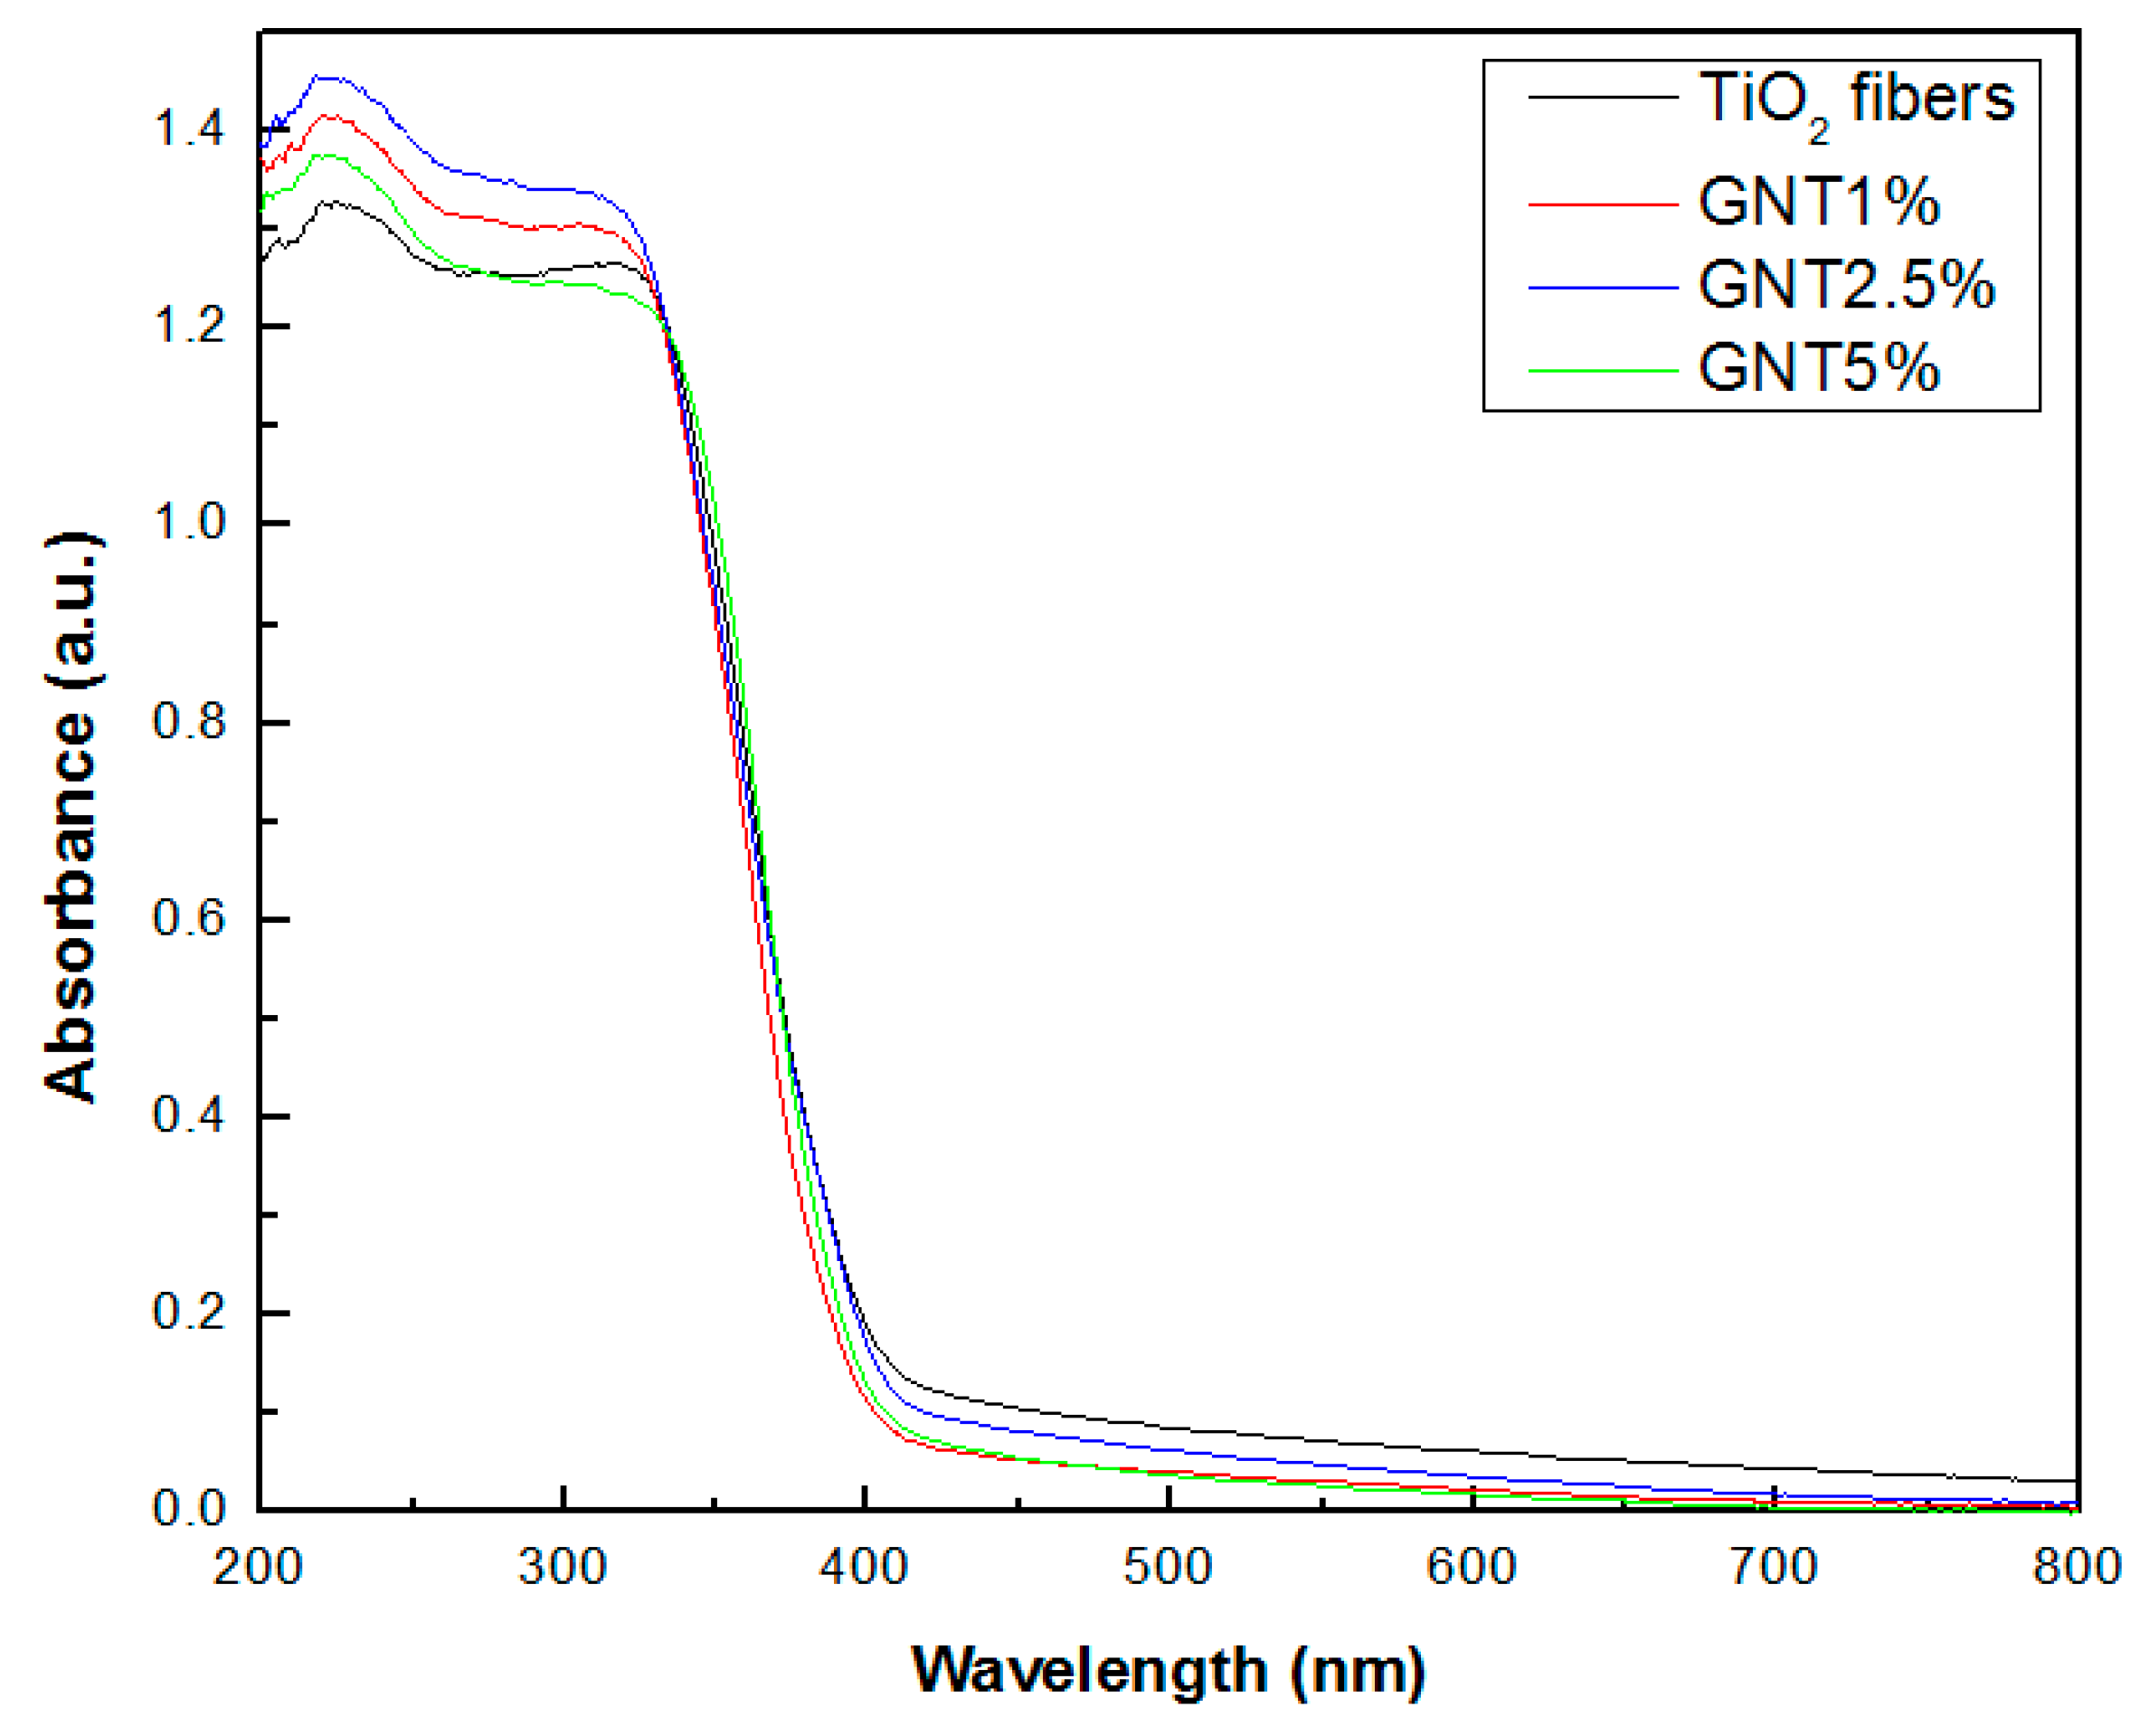
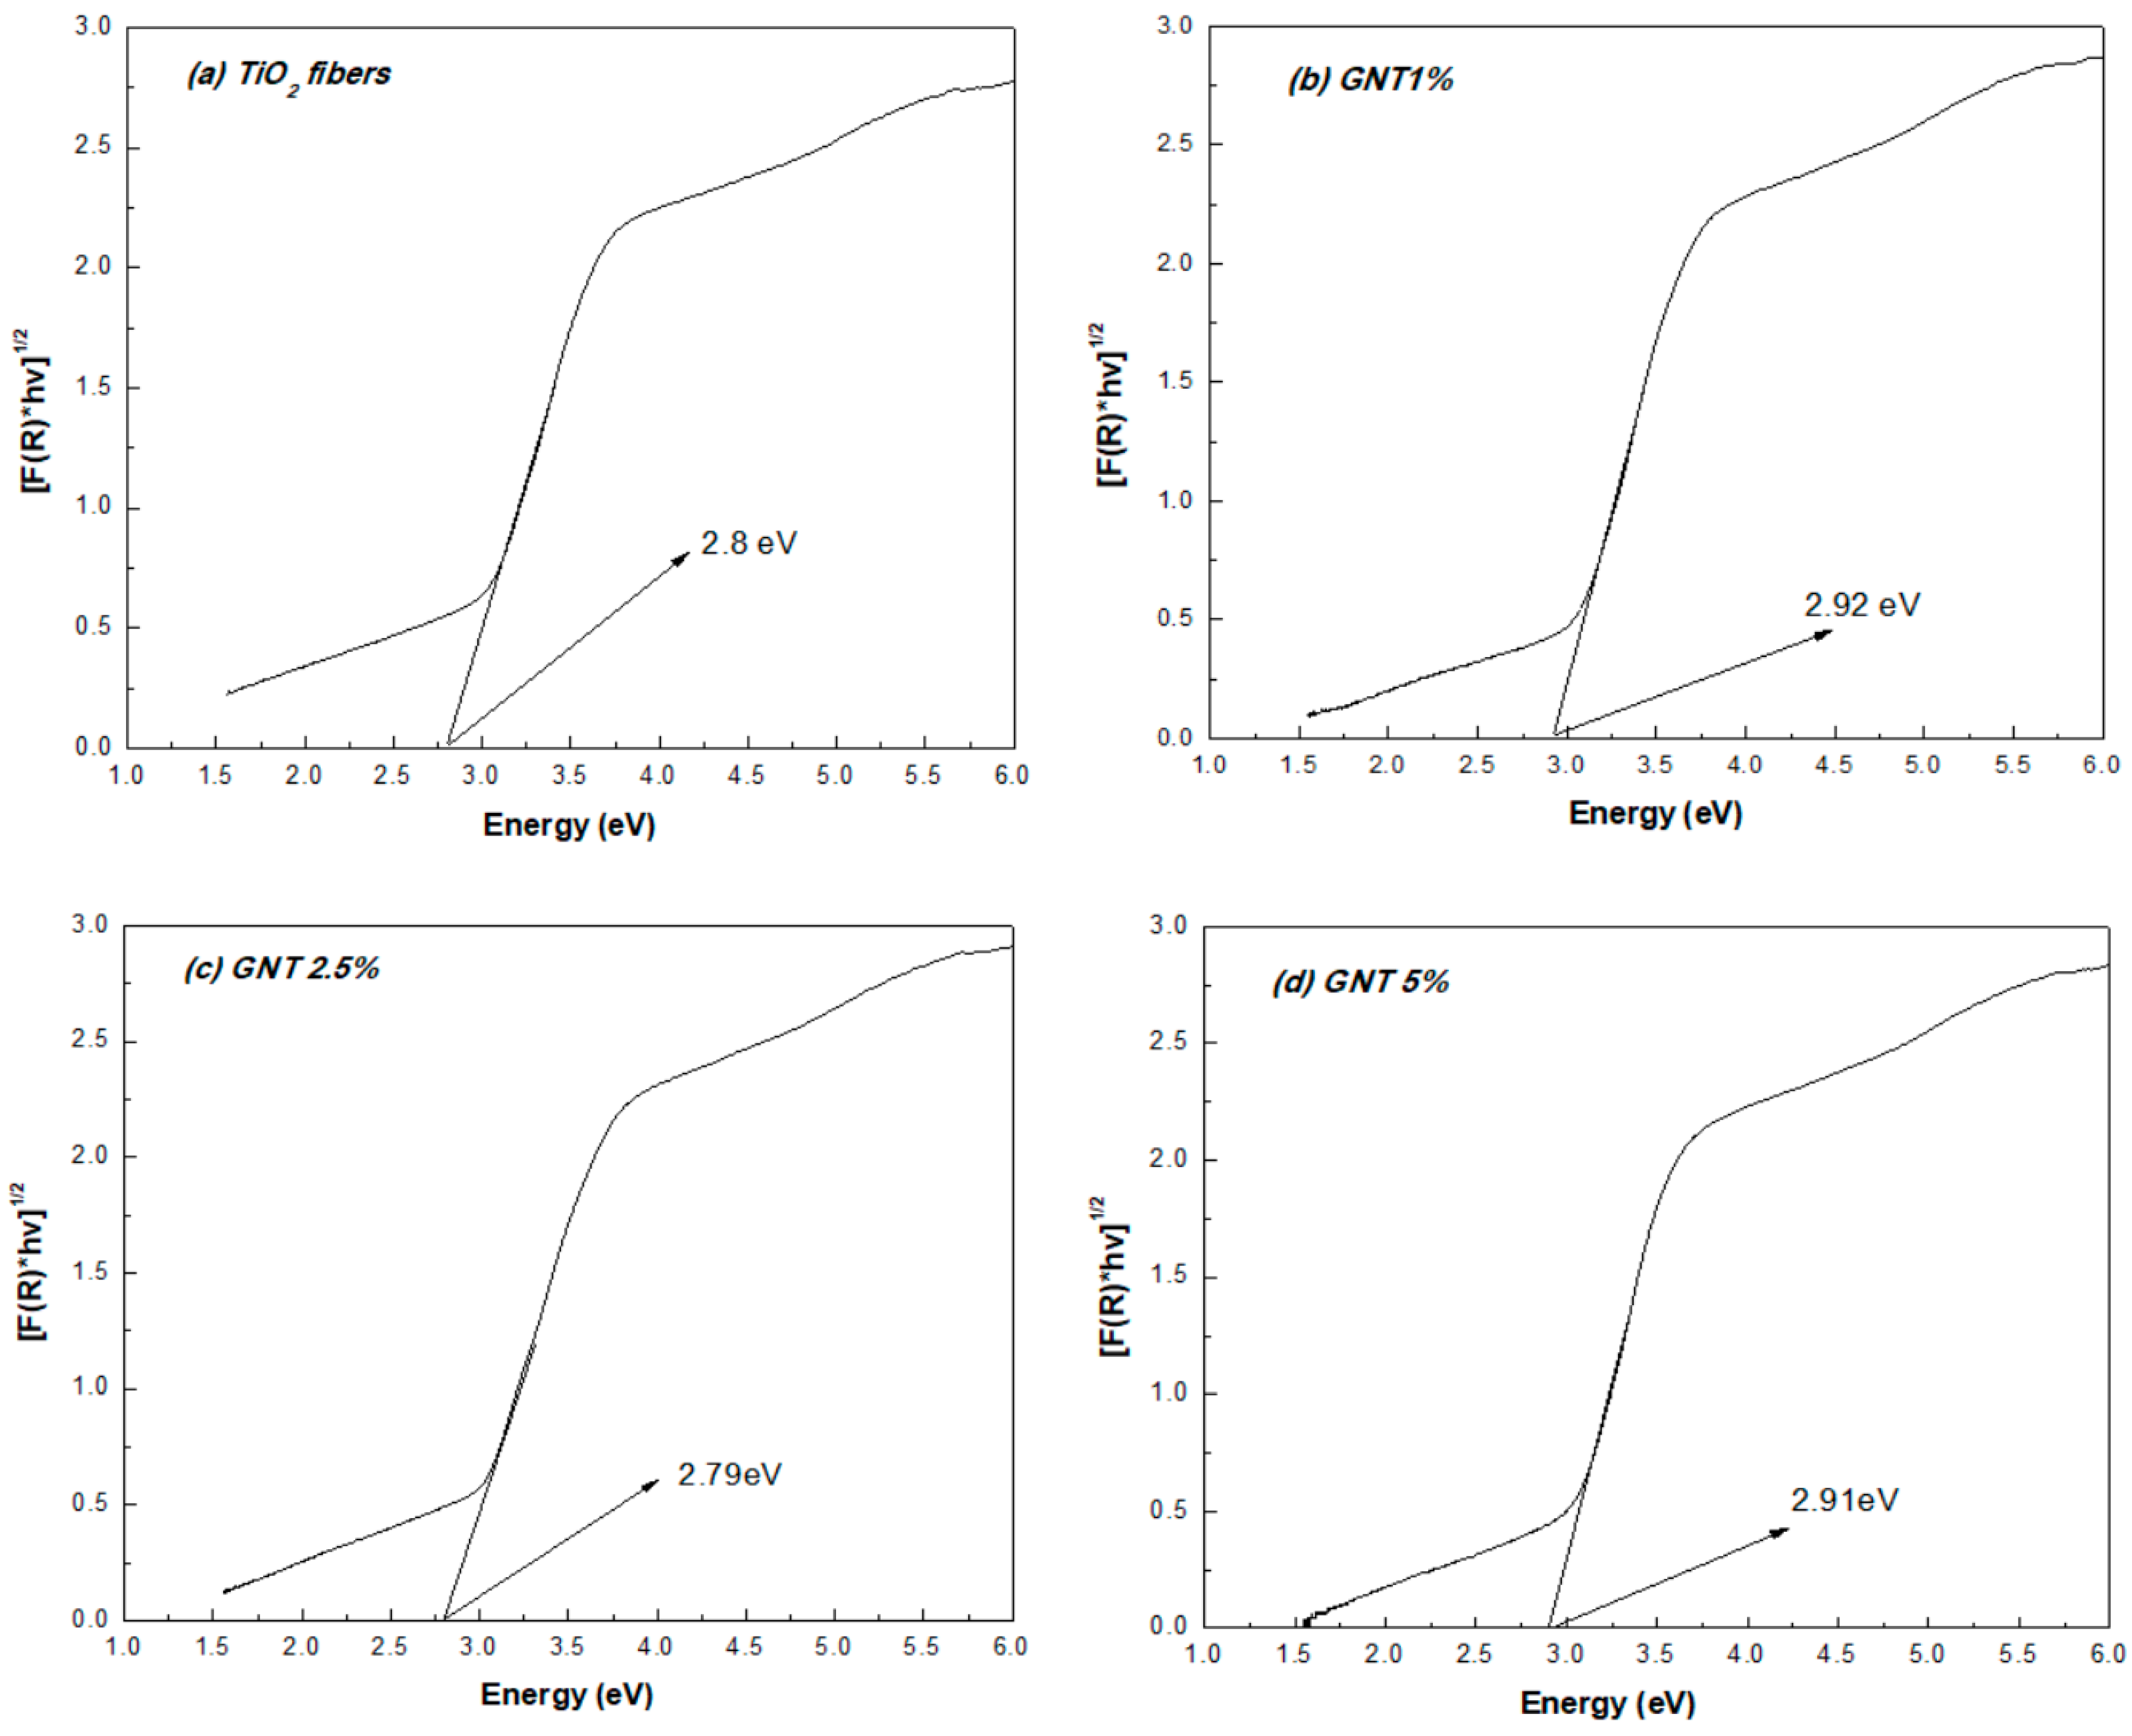
2.1.3. UV-Vis Diffuse Reflectance and Fluorescence Spectra

The optical properties of prepared composite catalysts were investigated by the UV-Vis diffuse reflection spectroscopy. Figure 6 displays the UV-Vis absorption spectra of fibrous materials and Figure 7 the determined energy band gaps (Eg) of each photocatalyst using the Kübelka–Münk function. The absorption edges of TiO2 fibers, GNT1%, GNT2.5% and GNT5% were determined at 442, 424, 444 and 426 nm, while the corresponding energy band gaps of TiO2 fibers, GNT1%, GNT2.5% and GNT5% were 2.8, 2.92, 2.8 and 2.91 eV, respectively. The presence of the red-shift in the reference TiO2 fibers could be attributed to residual carbon modification as revealed by FT-IR spectroscopy. The results indicate the improved response to visible light for all prepared fibrous catalysts.
The photocatalytic ability of composite catalysts to generate OH radicals was determined by fluorescence spectroscopy. The experimental results (Figure 8, Figure 9, Figure S8 and Table 2) showed that the kinetics of OH radicals formation followed the trend kGNT 5% > kGNT 2.5% ≈ kGNT 1% > kTiO2 fibers which is consistent with the trend of the fibrous kinetics for the degradation of methylene blue. The photogeneration rate of OH radicals for TiO2 fibers, GNT 1%, GNT 2.5% and GNT 5% were 0.288, 0.297, 0.298 and 0.348 μM min−1., respectively. As a result, the increase of g-C3N4 content in the composite fibers led to higher concentrations of generated OH radicals.

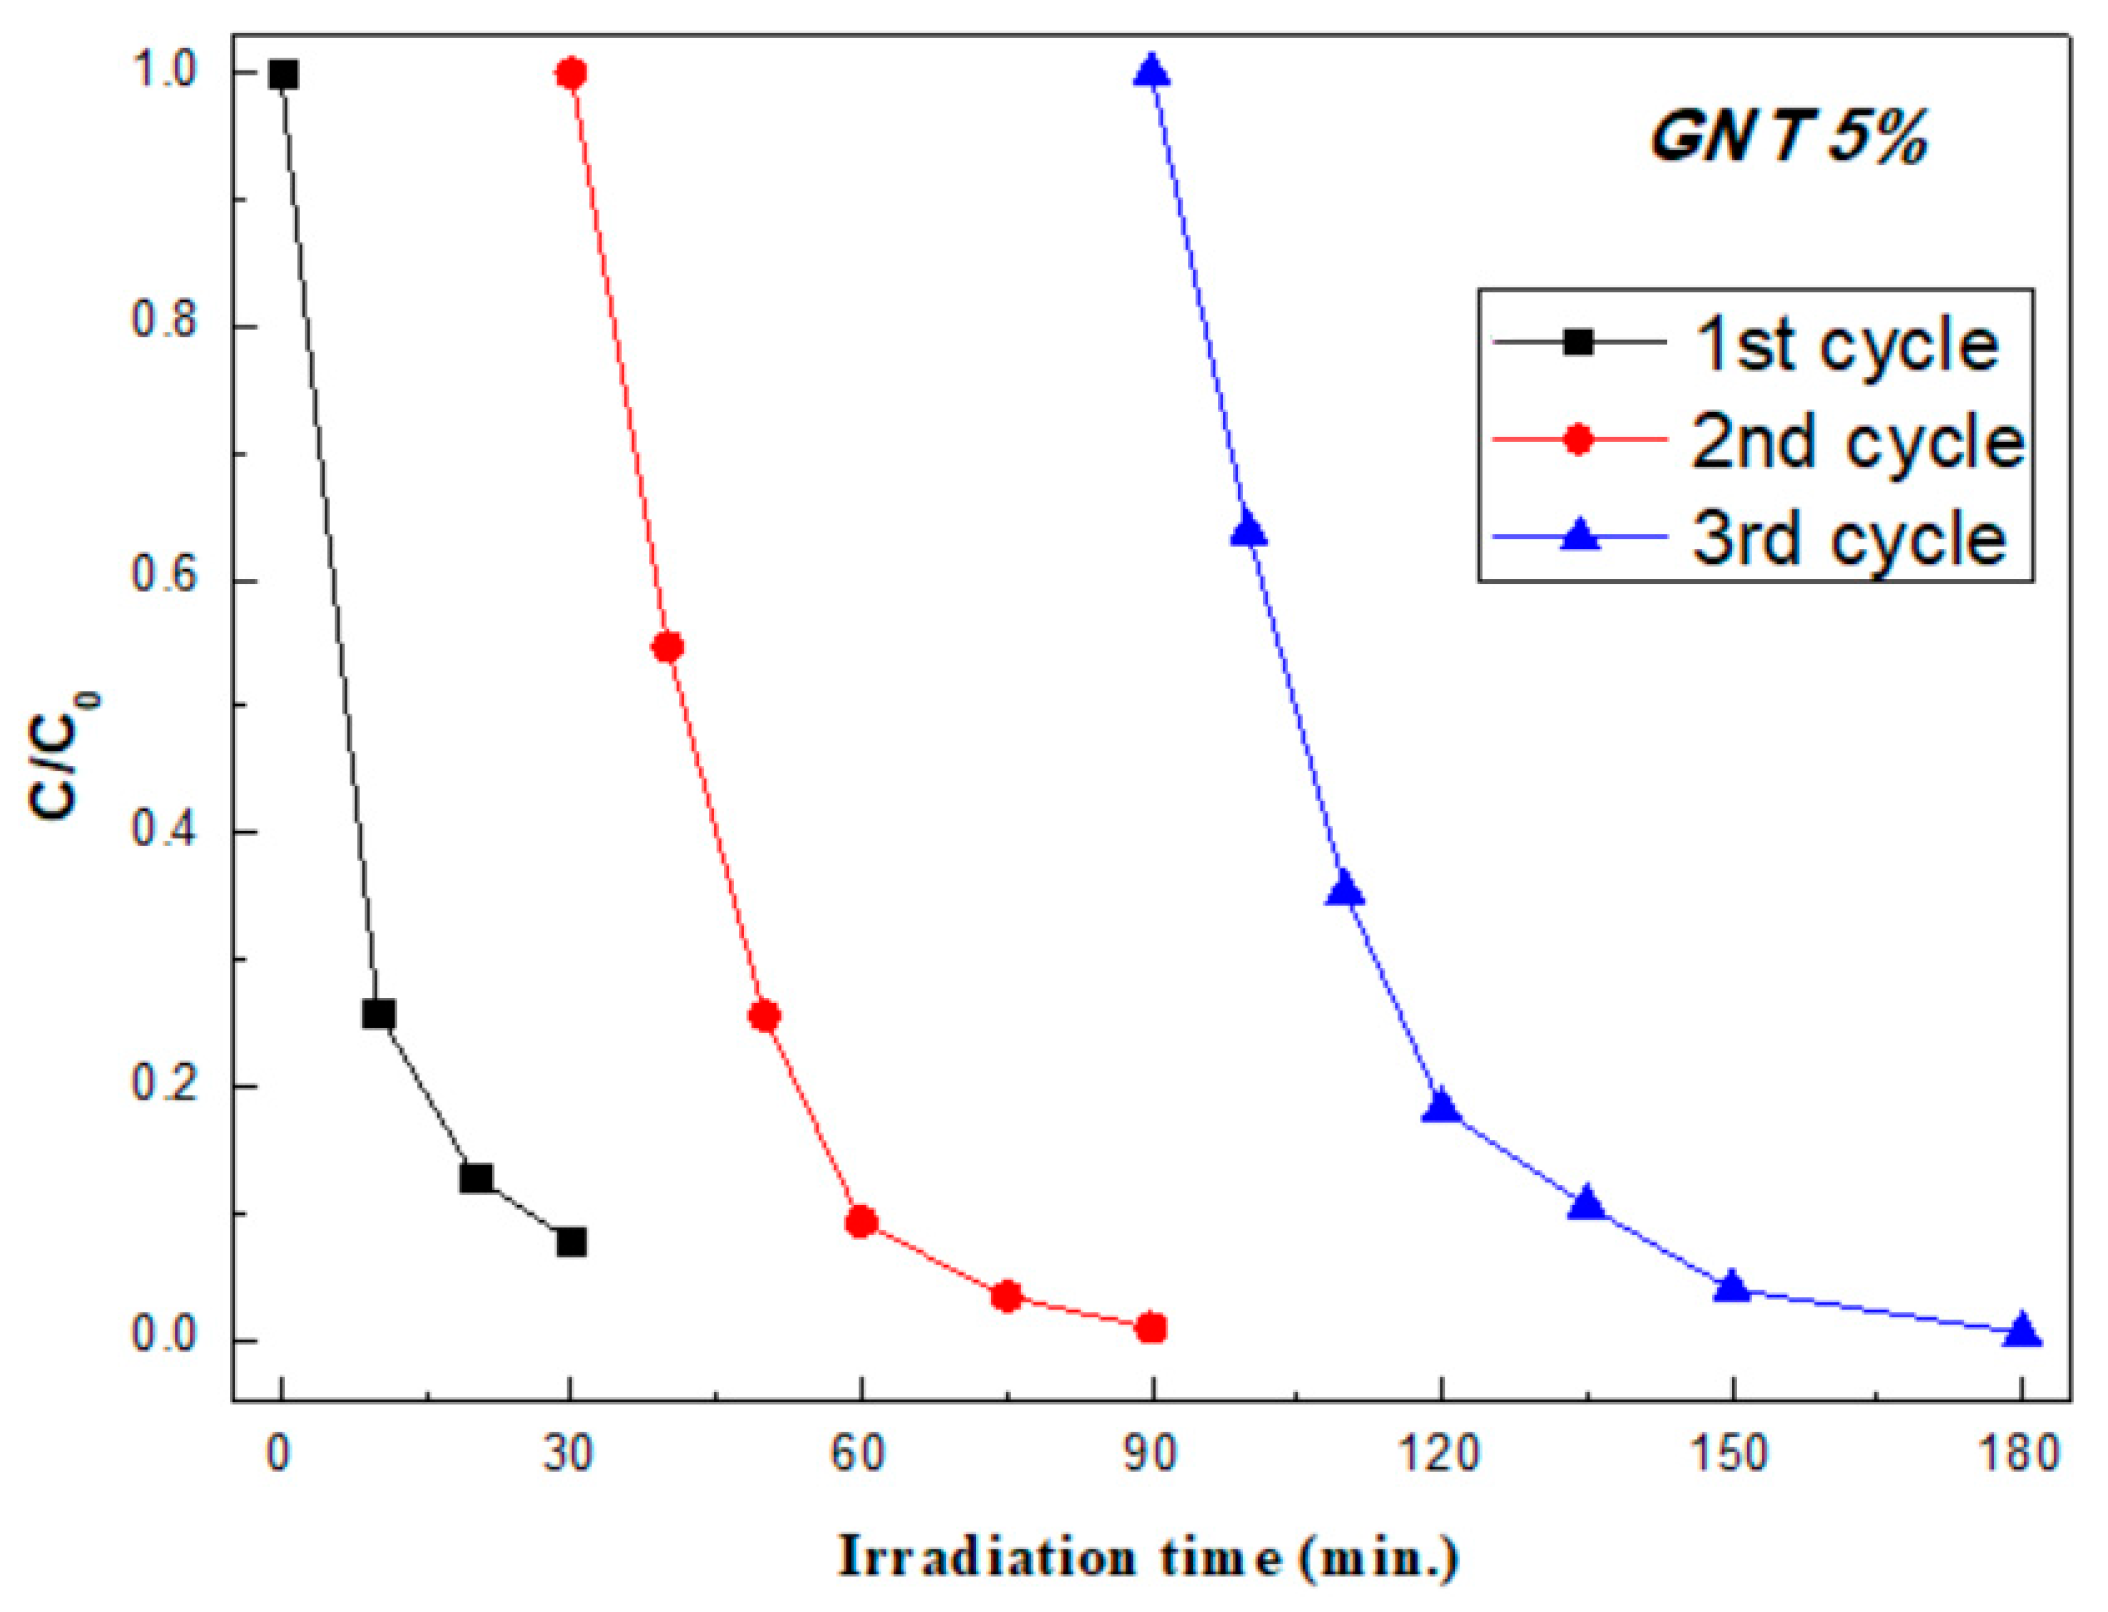
2.1.4. Photocatalytic Activity and Recyclability

The photocatalytic activity of the fibers was studied against the degradation of methylene blue dye under simulated sunlight irradiation and the results of photocatalytic experiments are shown in Figure 10 and Table 2. The first-order apparent reaction rates increase as the amount of g-C3N4 also increases according to the following trend kGNT 5% > kGNT 2.5% ≈ kGNT 1% > kTiO2 fibers. Taking into account the similar surface areas, crystal and hydrodynamic sizes and band gap energies of the different fibrous catalysts it can be concluded that interfacial transfer of carriers and the ability for OH radicals generation are the key-process for the observed photocatalytic performance. This is further supported by the fluorescence measurements that showed the same catalyst sequence with regard to their ability for OH radicals production.
In order to investigate the recyclability of the prepared photocatalysts, the photocatalytic degradation of MB using the most efficient photocatalyst GNT 5% was studied for three consecutive cycles. According to the experimental results (Figure 11 and Table 3) the apparent reaction constants determined for the first, second and third catalytic cycle, were 0.0836 min−1, 0.0797 min−1 and 0.0736 min−1, respectively. A loss of 12% of its catalytic performance was recorded after the third cycle suggesting a good stability of the catalyst taking also into account some losses during the catalyst recovery process.

2.1.5. Featured Photocatalytic Mechanism for the TiO2/g-C3N4 Composite Fibers

The conduction band (CB) and valence band (VB) potentials for g-C3N4 are −1.3 V and +1.4 V while the respective values for anatase TiO2 are −0.5 V and +2.7 V, respectively [24,25]. Considering firstly a type II heterojunction the excited electrons from the g-C3N4 CB will be transferred to the less negative TiO2 CB while the positive holes will be accumulated to the less positive VB of g-C3N4. However, taking into account the potentials for the oxidation for water (+2.34 V vs. NHE) or OH- (+1.99 V vs. NHE) to OH radicals it can be concluded that g-C3N4 VB holes cannot oxidize water or OH- ions to produce OH radicals. Hydroxy-terephthalic fluorescence measurements in the presence of g-C3N4 supported the above consideration revealing the low production of OH radicals that can be attributed to the reductive pathway of O2 following the sequence O2•−, HO2, H2O2. In addition, the composite fibers should present lower photocatalytic activity than the TiO2 fibers that was not the case [10,17,26]. As a result, type-II photocatalytic mechanism is not probable. On the contrary, the ability of the composite fibers to generation OH radicals is much greater compared to that of g-C3N4 and higher than that of reference TiO2 suggesting a Z-scheme mechanism (Figure 12). In such mechanism, when the electrospun g-C3N4/TiO2 fibers are irradiated by the simulated solar light, the photo-generated holes (h+) were maintained in the VB of TiO2 and the excited electrons (e-) in the CB of TiO2 are combined with the holes in the VB of g-C3N4 while electrons are accumulated in the CB of g-C3N4 scavenged by oxygen. As a result, the generated holes in theVB of TiO2 have the suitable oxidation potential for the generation of OH radicals while the trapping of e-(CBTiO2) by h+ (VBg-C3N4) induced a better charge separation, thus a higher photocatalytic efficiency.

3. Materials and Methods

3.1. Materials and Chemicals

Poly-(vinyl pyrrolidone) (PVP, MW: 1,300,000) and methylene blue (MB, MW: 373.9 gmol−1) were obtained from Sigma–Aldrich (St. Louis, MO, USA). Acetic acid (>99.7%) was supplied by Riedel–de Haën (Seelze, Germany). Titanium tetraisopropoxide (TTIP) (97%) was purchased by Alfa Aesar (Karlsruhe, Germany). Absolute ethanol (Merck, Darmstadt, Germany) was used as the polymer solvent and urea (99.5%, MW: 60.06), (Acrōs Organics, Geel, Belgium) was used as the precursor of graphitic carbon nitride (g-C3N4). Distilled water was used throughout the experimental procedures of the study.

3.2. Preparation of Electrospun Fibrous TiO2/g-C3N4 Heterojunction Photocatalysts

The TiO2/g-C3N4 fibers with different g-C3N4 contents were synthesized via the single-nozzle electrospinning technique, in a typical horizontal set up of electrospinning apparatus using a grounded collecting metal plate. Firstly, a PVP (0.125 g) solution in absolute ethanol (2.5 mL) was prepared followed by the addition of TTiP (1 mL) and acetic acid (1 mL) and subsequently stirred by vortex for 5 min to achieve a homogeneous solution. Thereafter, the g-C3N4 powder (1, 2.5 and 5% wt% in respect to the TTiP weight) was added to the solution and the mixture was subjected to bath sonication for 1 h to achieve a fine dispersion of g-C3N4. Afterward, this mixture was added immediately into a plastic syringe and placed in the syringe-pump (Holliston, MA, USA). Electrospinning was carried out at room conditions using the following parameters: applied voltage 25 kV, tip to collector distance 15 cm and solution feed rate of 1 mLh−1. Subsequently, the as spun-fibers were calcinated at 550 °C for 3 h. The as-prepared catalysts were named as GNT 1%, GNT 2.5% and GNT 5%, respectively to the % weight of g-C3N4. TiO2 fibers were also fabricated by using the similar method in the absence of g-C3N4 and used as a reference material. The g-C3N4 powder was synthesized by thermal condensation process using urea as a precursor compound. Urea was dried in 90 °C for 24 h and then was calcinated in air at 500 °C for 4 h in an aluminum crucible at the heating rate of 10 °C min−1 [4,27] and then, the furnace was cooled naturally to ambient temperature. The obtained yellow color solid was ground well into a powder in an agate mortar.

3.3. Characterization

The X–ray diffraction (XRD) patterns of the prepared catalysts were recorded using a Bruker Advance D8 instrument (Billerica, MA, USA) working with Cu–Ka (λ = 1.5418 Å) radiation. Diffractograms were scanned from 2θ 10° to 90° in steps of 0.02° and a rate 0.01 °θ sec−1. The patterns were assigned to crystal phases with the use of the International Center for Diffraction Data (ICCD).
Nitrogen adsorption—desorption isotherms were collected by porosimetry using a Quantachrome Autosorb—1 instrument (Bounton Beach, FL, USA) at 77 K. All the samples (≈0.1 g) were degassed at 423 K for 3 h. Brunauer-Emmet-Teller (BET) method was used at relative pressure between 0.05–0.3, in order to calculate the specific surface area (SSA) of each material. Adsorbed amount of nitrogen at relative pressure P/Po = 0.99 was used in order to calculate the total pore volume (VTOT). The BJH (Barrett, Joyner and Halenda) method was used to determine the pore size distribution (PSD) of the photocatalysts.
Fiber’s morphology and size were observed by scanning electron microscopy (SEM) using a JEOL JSM 5600 instrument (Tokyo, Japan) working at 20 kV. Thermogravimetric analysis (TGA) was performed by STA 449C Netzsch instrument (Selb, Germany) under air atmosphere with a heating rate of 10 °C min−1 from 25 to 800 °C.
A Shimadzu SALD–2300 laser diffraction particle size analyser (Kyoto, Japan) working with dynamic light scattering (DLS) mode was used for catalyst particle size measurements. Suspensions of the nanofibrous photocatalysts were prepared by sonication with a Hielscher UP100H ultrasonic processor (Teltow, Germany) for 10 min.

3.4. Fourier Transform Infrared Spectroscopic (FT–IR) Analysis

Fourier transform infrared spectroscopic (FT–IR) analysis was carried out by a Perkin Elmer Spectrum BX instrument (Watham, ΜA, USA). The as prepared photocatalysts were ground with KBr (≥ 99%, Acrōs Organics) in 1:5 ratios. The pellet was scanned in the range 4000–400 cm−1.

3.5. UV–Vis–DRS Measurements
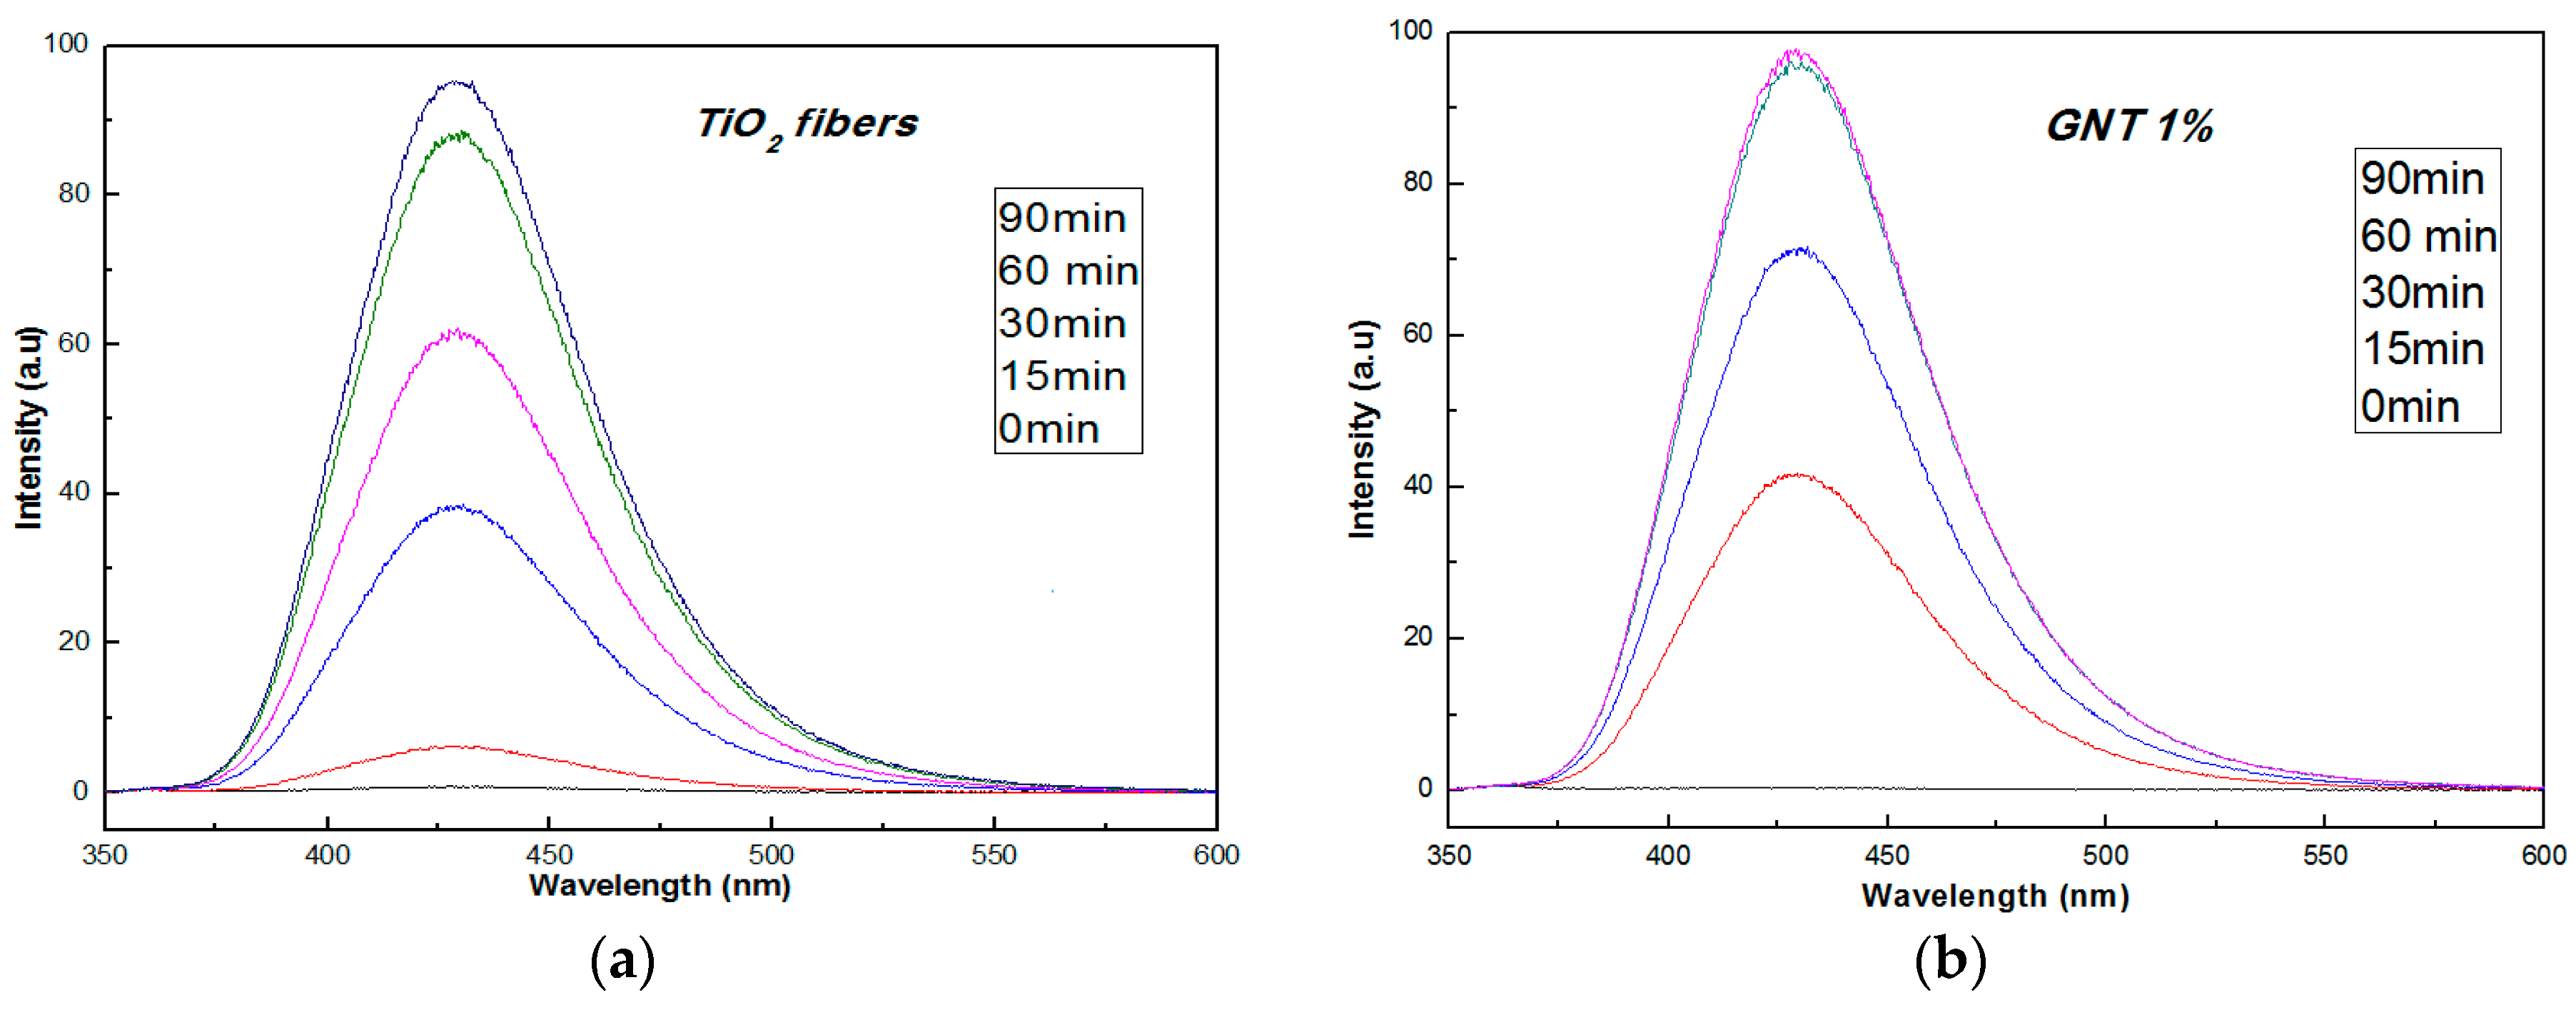
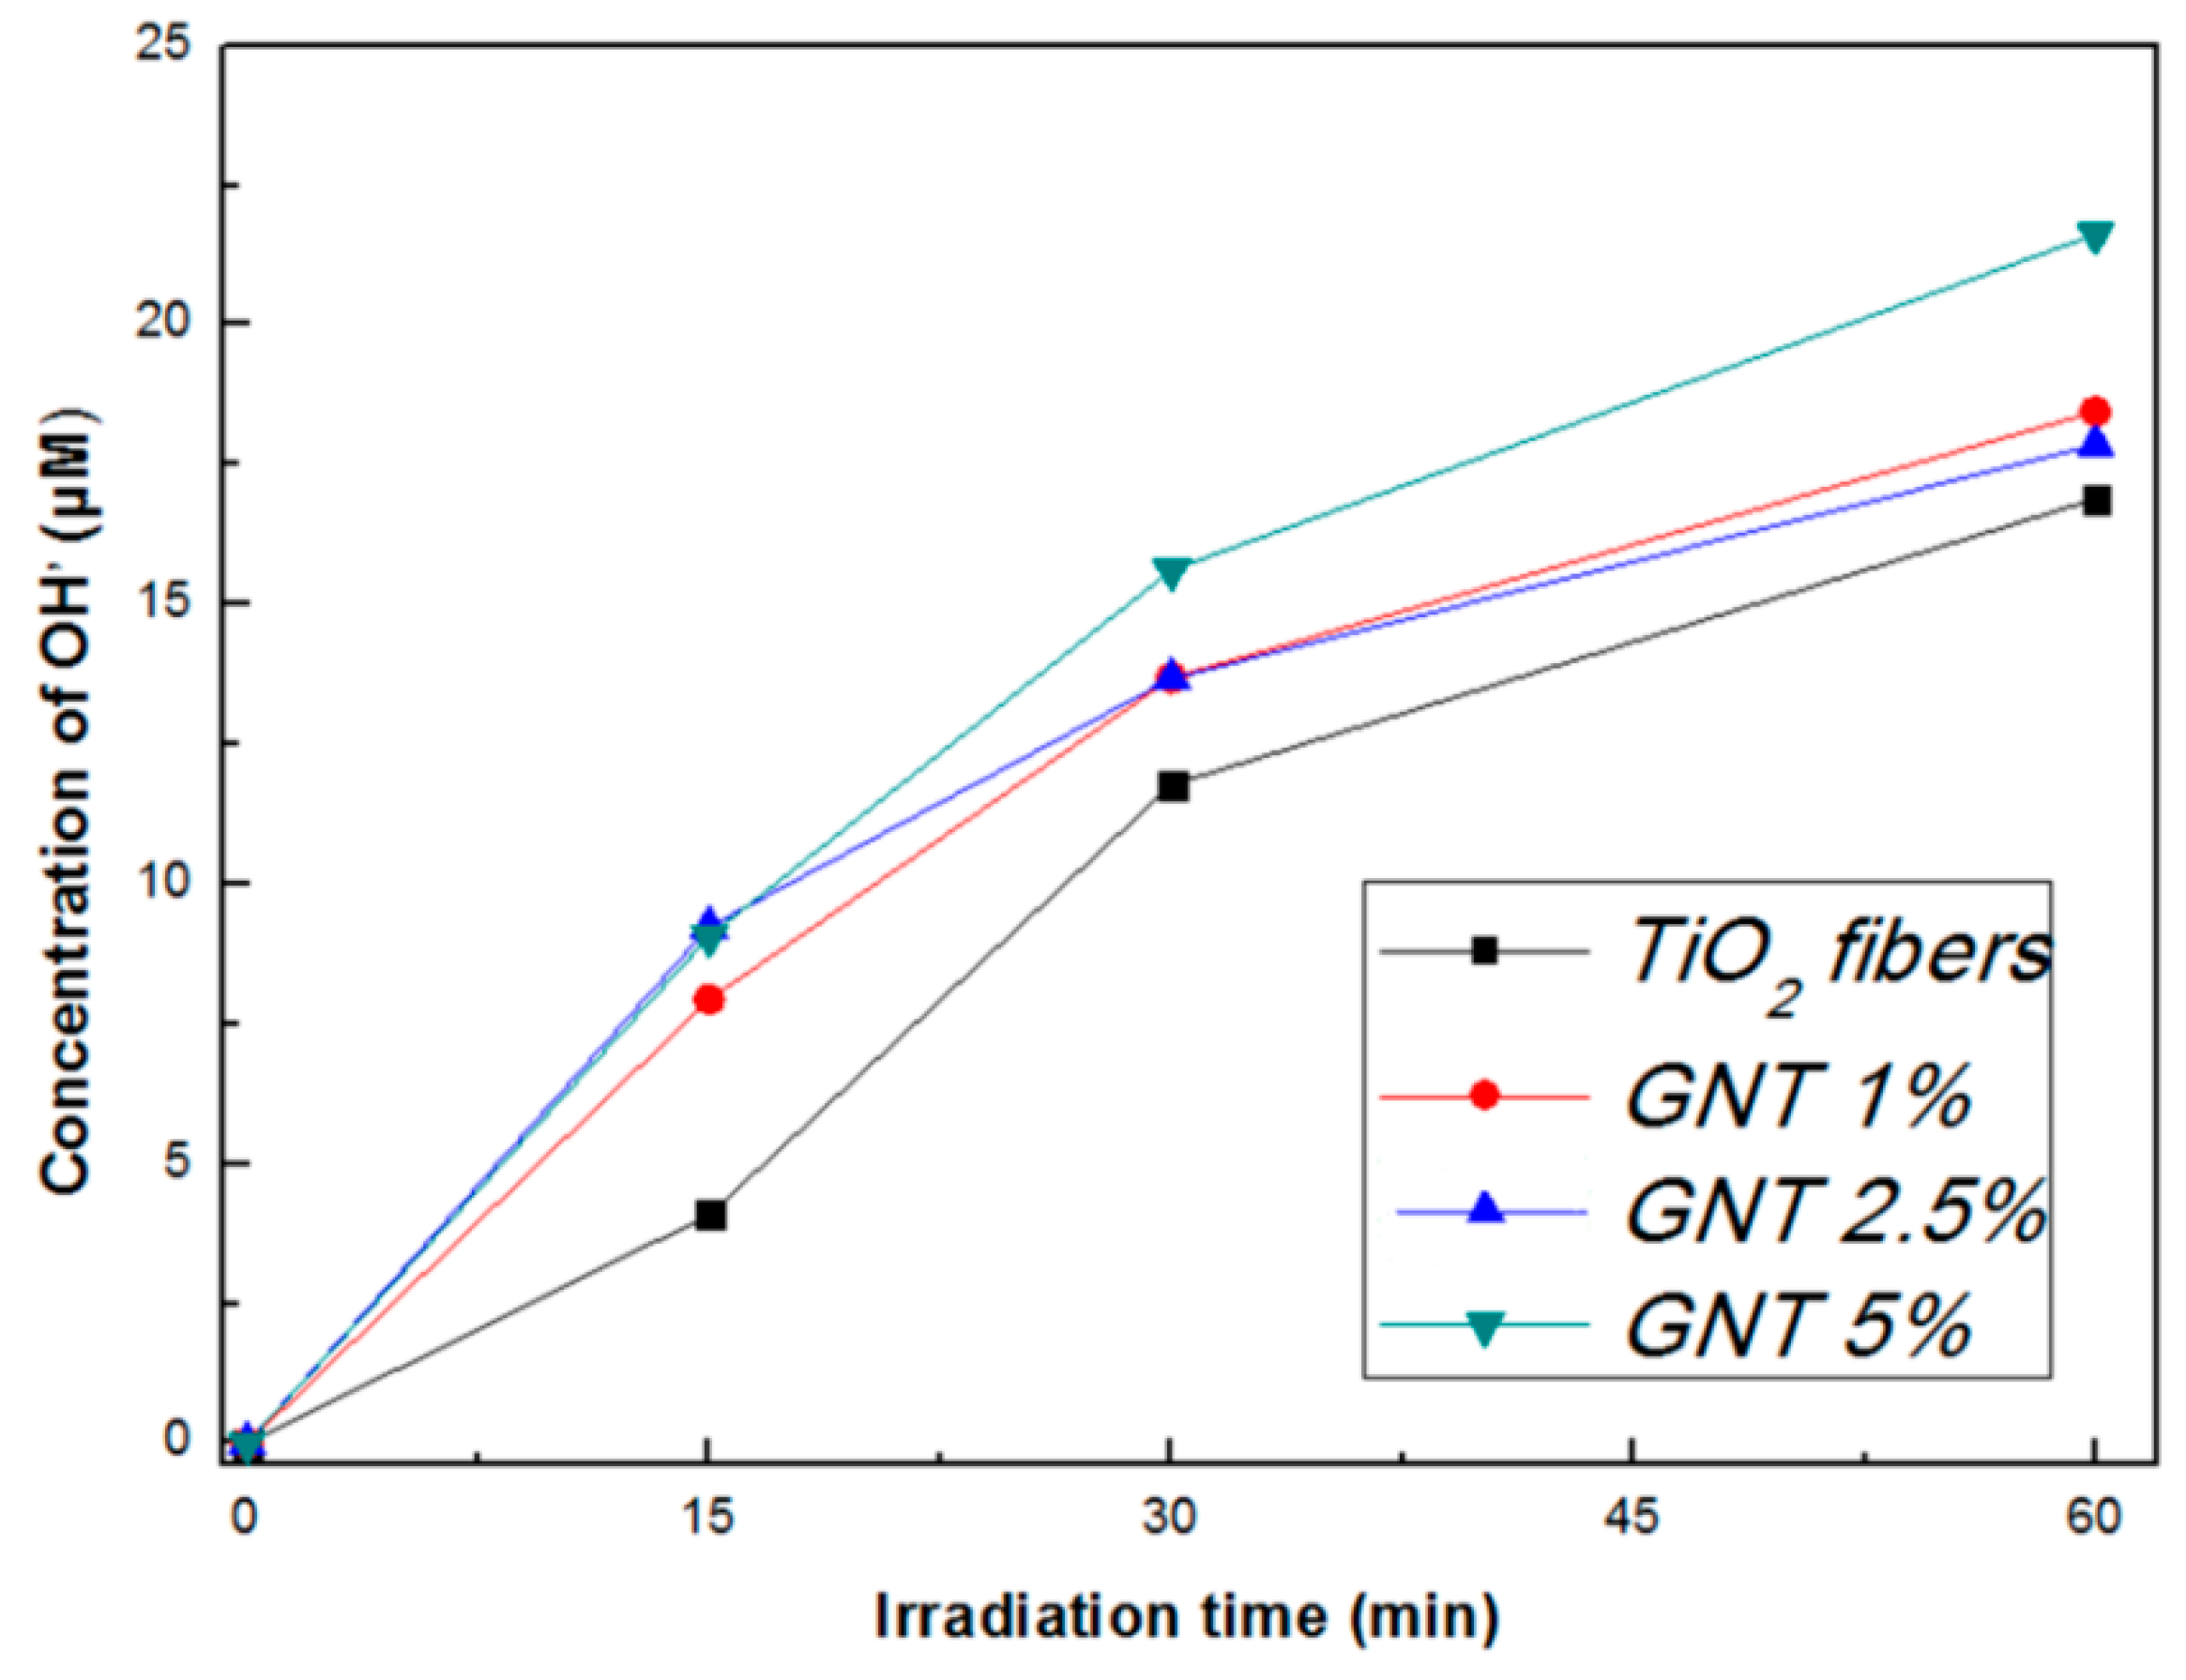
Diffuse reflectance spectra of the prepared fibrous catalysts were carried out on a Shimadzu 2600 spectrophotometer bearing an IRS–2600 integrating sphere (Kyoto, Japan) in the wavelength range of 200–800 nm at room temperature using BaSO4 (Nacalai Tesque, extra pure reagent, Kyoto, Japan), as a reference sample.

3.6. Determination of OH Radicals by Fluorescence Measurements

The formation of hydroxyl radicals was studied using terephthalic acid (TA) (98%, Sigma–Aldrich, St. Louis, MO, USA) method. An aqueous solution of NaOH (2 × 10⁻³ M, 99% Riedel–de Haën, Seelze, Germany) and TA (5 × 10⁻⁴ M) was prepared and then 20 mg of each photocatalyst powder was added in the photocatalytic reactor and dispersed by sonication for 10 min [28]. Then, the suspensions were irradiated under the same experimental conditions used for the photocatalytic experiments. Aliquots of 4 mL were taken out at different time periods and were centrifuged for 30 min (4400 rpm) to separate the photocatalyst. The intensity of the fluorescence peak at 425 nm (using 310 nm excitation wavelength), which is attributed to 2-hydroxyterephthalic acid (TAOH), was measured by a fluorescence spectrophotometer (Shimadzu RF-5301PC, Kyoto, Japan). It is known, that the amount of generated OH radicals is proportional to the produced 2-hydroxyterephthalic acid (TAOH). The concentration of OH was measured by a calibration curve plotting the fluorescence intensity of standard TAOH (TCI, >98%) solutions.

3.7. Evaluation of Photocatalytic Performance

The solar simulator apparatus Suntest XLS+ (Atlas, Germany) disposing a xenon lamp (2.2 kW) jacked with special 290 nm cut-off glass filter was used for the photocatalytic experiments. The irradiation intensity was maintained at 500 Wm−2 during the experiments. The photocatalytic activity was evaluated towards the degradation of methylene blue (MB) dye. The photocatalysts (200 mg L1) were sonicated for 10 min in an aqueous solution to obtain a fine suspension. For the photocatalytic experiments 100 mL of MB (5 mg L1) solution were loaded in appropriate Pyrex glass reactor (250 mL) thermostated at ambient conditions (23 ± 1 °C), by water circuit flowing in the double-skin of the reactor and air-flow, under continuous stirring. Before illumination the suspension was magnetically stirred for 30 min to ensure the establishment of adsorption-desorption equilibrium onto the catalyst surface. Samples (5 mL) were withdrawn regularly from the reactor and centrifuged at 4400 rpm (Thermo Scientific, Heraus Megafuge 8, Suzhou, China) immediately for 30 min in order to separate the catalyst particles. The supernatant transparent solution was analysed by UV-Vis spectroscopy (Jasco-V630, Tokyo, Japan) measuring the absorbance at the characteristic wavelength 665 nm using a calibration curve. Relative errors lower than 4.3% were obtained in all cases. For the experiments of catalyst recycling, the materials were recovered by centrifugation, washed twice with distilled water (20 mL) in a vortex, centrifuged again and dried at 383 K for 4 h, finally re-suspended and irradiated using the same experimental conditions.

4. Conclusions

In summary, g-C3N4/TiO2 composite photocatalysts (up to 5% wt of g-C3N4) have been successfully prepared with one-step electrospinning process. All the electrospun composite fibers presented mainly anatase crystal phase with small particle sizes, mesoporosity, a response to visible light irradiation and an increased ability to generate OH radicals. The photocatalytic activity for methylene blue degradation increases as increasing the amount of g-C3N4 coinciding with the trend followed for the OH radicals generation rate. The composite with 5% wt of g-C3N4 was found as the most efficient photocatalyst with a sufficient stability after three consecutive cycles. A Z-scheme photocatalytic mechanism was proposed for the composite materials.

Supplementary Materials

The following are available online at https://www.mdpi.com/2073-4344/9/11/880/s1, Figure S1: XRD patterns of bulk g-C3N4., Figure S2: FT-IR spectrum of PVP fibers, Figure S3: FT-IR spectrum of g-C3N4, Figure S4: Nitrogen adsorption-desorption isotherms and pore size distributions for g-C3N4, Figure S5: SEM images of electrospun fibers before calcination (a) TiO2, (b) GNT1%, (c) GNT2.5%, (d) GNT5%, Figure S6: SEM images of prepared bulk g-C3N4, Figure S7: DSC curves of PVP and prepared photocatalyst fibers before calcination, Figure S8: Fluorescence spectra of hydroxyl- terephthalic (OHTA) formation of g-C3N4.

Author Contributions

Conceptualization and methodology, I.K., T.V.; formal analysis, F.B., I.K., T.V.; investigation, F.B., I.K., D.P., T.V.; data curation, F.B.; writing—original draft preparation, F.B., I.K., T.V.; writing—review and editing, F.B., I.K., T.V.; validation and visualization, F.B.; supervision, I.K., T.V.

Funding

This research received no external funding.

Conflicts of Interest

The authors declare no conflict of interest.

References

  1. Konstantinou, I.K.; Albanis, T. Photocatalytic transformation of pesticides in aqueous titanium dioxide suspensions using artificial and solar light: Intermediates and degradation pathways. Appl. Catal. B Environ. 2003, 42, 319–335. [Google Scholar] [CrossRef]
  2. Malato, S.; Fernández-Ibáñez, P.; Maldonato, M.I.; Blanco, J.; Gernjak, W. Decontamination and disinfection of water by solar photocatalysis: Recent overview and trends. Catal. Today 2009, 147, 1–59. [Google Scholar] [CrossRef]
  3. Pelaez, M.; Nolan, T.N.; Pillai, C.S.; Seery, K.M.; Falaras, P.; Kontos, G.A.; Dunlop, S.M.P.; Hamilton, W.J.J.; Byrne, J.A.; O’Shea, K.; et al. A review on the visible light active titanium dioxide photocatalysts for environmental applications. Appl. Catal. B Environ. 2012, 125, 331–349. [Google Scholar] [CrossRef] [Green Version]
  4. Mamba, G.M.; Mishra, A.K.M. Graphitic carbon nitride (g-C3N4) nanocomposites: A new and exciting generation of visible light driven photocatalysts for environmental pollution remediation. Appl. Catal. B Environ. 2016, 198, 347–377. [Google Scholar] [CrossRef]
  5. Wang, Y.W.; Wang, X.W.; Antonietti, M.A. Polymeric Graphitic Carbon Nitride as a Heterogeneous Organocatalyst: From Photochemistry to Multipurpose Catalysis to Sustainable Chemistry. Angew. Chem. Int. Ed. 2012, 51, 68–89. [Google Scholar] [CrossRef] [PubMed]
  6. Zhao, Z.Z.; Sun, Y.S.; Dong, F.D. Graphitic carbon nitride based nanocomposites: A review. Nanoscale 2015, 7, 15–37. [Google Scholar] [CrossRef]
  7. Zhou, J.Z.; Zhang, M.Z.; Zhu, Y.Z. Photocatalytic enhancement of hybrid C3N4/TiO2 prepared via ball milling method. Phys. Chem. Chem. Phys. 2015, 17, 3647–3652. [Google Scholar] [CrossRef]
  8. Zhang, G.Z.; Zhang, T.Z.; Li, B.L.; Jiang, S.J.; Zhang, X.Z.; Hai, L.H.; Chen, X.C.; Wu, W.W. An ingenious strategy of preparing TiO2/g-C3N4 heterojunction photocatalyst: In situ growth of TiO2 nanocrystals on g-C3N4 nanosheets via impregnation-calcination method. Appl. Surf. Sci. 2018, 433, 963–974. [Google Scholar] [CrossRef]
  9. Muňoz-Batista, M.J.M.B.; Kubacka, A.K.; Fernández-Garcia, M.F.G. Effect of g-C3N4 loading on TiO2—Based photocatalysts: UV and visible degradation of toluene. Catal. Sci. Technol. 2014, 4, 2006–2015. [Google Scholar] [CrossRef]
  10. Yu, J.Y.; Wang, S.W.; Low, J.L.; Xiao, W.X. Enhanced photocatalytic performance of direct Z-scheme g-C3N4-TiO2 photocatalysts for the decomposition of formaldehyde in air. Phys. Chem. Chem. Phys. 2013, 15, 16883–16890. [Google Scholar] [CrossRef]
  11. Wang, C.W.; Hu, L.H.; Chai, B.C.; Yan, J.Y.; Li, J.L. Enhanced photocatalytic activity of electrospun nanofibrous TiO2/g-C3N4 heterojunction photocatalyst under simulated solar light. Appl. Surf. Sci. 2018, 430, 243–252. [Google Scholar] [CrossRef]
  12. Tong, Z.W.T.; Yang, D.Y.; Xian, T.X.X.; Tian, Y.T.; Jiang, Z.Y.J. Biomimetic fabrication of g-C3N4/TiO2nanosheets with enhanced photocatalytic activity toward organic pollutant degradation. Chem. Eng. J. 2015, 260, 117–125. [Google Scholar] [CrossRef]
  13. Hao, R.H.; Wang, G.W.; Jiang, C.J.; Tang, H.T.; Xu, Q.X. In situ hydrothermal synthesis of g-C3N4/TiO2 heterojunction photocatalysts with high specific surface area for Rhodamine B degradation. Appl. Surf. Sci. 2017, 411, 400–410. [Google Scholar] [CrossRef]
  14. Bhardwaj, N.B.; Kundu, S.C.K. Electrospinning: A fascinating fiber fabrication technique. Biotechnol. Adv. 2010, 28, 325–347. [Google Scholar] [CrossRef] [PubMed]
  15. Wang, M.W.; Liu, Z.L.; Fang, M.F.; Tang, C.T.; Huang, Z.H.; Liu, Y.L.; Wu, X.W.; Mao, Y.M. Enhancement in the photocatalytic activity of TiO2 nanofibers hybridized with g-C3N4 via electrospinning. Sol. Stat. Sci. 2016, 55, 1–7. [Google Scholar] [CrossRef]
  16. Liu, B.L.; Nakata, K.N.; Sakai, M.S.; Saito, H.S.; Ochiai, T.O.; Murakami, T.M.; Takagi, K.T.; Fujishima, A.F. Mesoporous TiO2 Core-Shell Spheres Composed of Nanocrystals with Exposed High-Energy Facets: Facile Synthesis and Formation Mechanism. Langmuir 2011, 27, 8500–8508. [Google Scholar] [CrossRef]
  17. Tang, Q.T.; Meng, X.M.; Wang, Z.W.; Zhou, J.Z.; Tang, H.T. One-step electrospinning synthesis of TiO2/g-C3N4 nanofibers with enhanced photocatalytic properties. Appl. Surf. Sci. 2018, 430, 253–262. [Google Scholar] [CrossRef]
  18. Adhikari, S.P.A.; Awasthi, G.P.A.; Kim, H.J.K.; Park, C.H.P.; Kim, C.S.K. Electrospinning Directly Synthesized Porous TiO2 Nanofibers Modified by Graphitic Carbon Nitride Sheets for Enhanced Photocatalytic Degradation Activity under Solar Light Irradiation. Langmuir 2016, 32, 6163–6175. [Google Scholar] [CrossRef]
  19. Wei, X.W.; Shao, C.S.; Li, X.L.; Lu, N.L.; Wang, K.W.; Zhang, Z.Z.; Liu, Y.L. Facile in situ synthesis of plasmonic nanoparticles-decorated g-C3N4/TiO2 heterojunction nanofibers and comparison study of their photosynergistic effects for efficient photocatalytic H2 evolution. Nanoscale 2016, 8, 11034–11043. [Google Scholar] [CrossRef]
  20. Rietveld, H.M. Line profiles of neutron powder-diffraction peaks for structure refinement. Acta Crystallogr. 1967, 22, 151–152. [Google Scholar] [CrossRef]
  21. Chen, X.C.; Li, H.L.; Wu, Y.W.; Wu, H.W.; Wu, L.W.; Tan, P.T.; Pan, J.P.; Xiong, X.X. Facile fabrication of novel porous graphitic carbon nitride/copper sulfide nanocomposites with enhanced visible light driven photocatalytic performance. J. Colloid Interface Sci. 2016, 476, 132–143. [Google Scholar] [CrossRef] [PubMed] [Green Version]
  22. Turner, D.T.T.; Schwartz, A.S. The glass transition temperature of poly (N-vinyl pyrrolidone) by differential scanning calorimetry. Polymer 1985, 26, 757–762. [Google Scholar] [CrossRef]
  23. Elishav, O.E.; Beilin, V.B.; Rozent, O.R.; Shter, G.E.S.; Grader, G.S.G. Thermal shrinkage of electrospun PVP nanofibers. J. Polym. Sci. B Polym. Phys. 2018, 56, 248–254. [Google Scholar] [CrossRef]
  24. Wen, J.W.; Xie, J.X.; Chen, X.C.; Li, X.L. A review on g-C3N4-based photocatalysts. Appl. Surf. Sci. 2017, 391, 72–133. [Google Scholar] [CrossRef]
  25. Shen, L.S.; Xing, Z.X.; Zou, J.Z.; Li, Z.L.; Wu, X.W.; Zhang, Y.Z.; Zhu, Q.Z.; Yang, S.Y.; Zhou, W.Z. Black TiO2 nanoblets/g-C3N4 nanosheets Laminated Heterojunctions with Efficient Visible Light-Driven Photocatalytic Performance. Sci. Rep. 2017, 7, 41978. [Google Scholar] [CrossRef]
  26. Low, J.L.; Jiang, C.J.; Cheng, B.C.; Wageh, S.W.; Al-Ghamdi, A.A.A.G.; Yu, J.Y. A Review of Direct Z-Scheme Photocatalysts. Small Methods 2017, 170080, 1–21. [Google Scholar] [CrossRef]
  27. Tao, B.T.; Yan, Z.Y. In-situ synthesis of highly efficient visible light driven stannic oxide/graphitic carbon nitride heterostructured photocatalysts. J. Colloid Interface Sci. 2016, 480, 118–125. [Google Scholar] [CrossRef]
  28. Yang, Y.Y.; Zhang, T.Z.; Le, L.L.; Ruan, X.R.; Fang, P.F.; Pan, C.P.; Xiong, R.X.; Shi, J.S.; Wei, L.W. Quick and Facile Preparation of Visible light-Driven TiO2 Photocatalyst with High Photocatalytic Activity. Sci. Rep. 2014, 4, 7045. [Google Scholar] [CrossRef]
Figure 1. XRD patterns of calcinated TiO2 fibers and composite TiO2/g-C3N4 fibers.
Catalysts 09 00880 g001
Figure 2. Spectra of TiO2/g-C3N4 fibers after calcination.
Catalysts 09 00880 g002
Figure 3. Nitrogen adsorption-desorption isotherms and pore size distributions for the prepared catalysts (a) TiO2, (b) GNT 1%, (c) GNT 2.5%, (d) GNT 5%.
Catalysts 09 00880 g003
Figure 4. SEM images of electrospun fibers after calcination (a) TiO2, (b) GNT1%, (c) GNT2.5%, (d) GNT5%.
Catalysts 09 00880 g004
Figure 5. TGA curves of PVP, PVP fibers and prepared photocatalyst fibers before calcination.
Catalysts 09 00880 g005
Figure 6. UV-vis absorption spectra of calcinated TiO2 and TiO2/g-C3N4 fibers.
Catalysts 09 00880 g006
Figure 7. Kübelka-Münk plots for calcinated TiO2 and TiO2/g-C3N4 fibers. (a) TiO2 (b) GNT1%; (c) GNT2.5%; (d) GNT5%.
Catalysts 09 00880 g007
Figure 8. Fluorescence spectra of hydroxy-terephthalic (OHTA) formation of prepared fibers (a) TiO2, (b) GNT 1%, (c) GNT 2.5%, (d) GNT 5%.
Catalysts 09 00880 g008aCatalysts 09 00880 g008b
Figure 9. Evolution of hydroxyl radicals (OH) as determined by fluorescence against irradiation time for TiO2, and GNT 1%, GNT 2.5% and GNT 5% composite photocatalysts.
Catalysts 09 00880 g009
Figure 10. Photocatalytic degradation kinetics of methylene blue (MB) in the presence of TiO2 and TiO2/g-C3N4 fibers under solar light irradiation.
Catalysts 09 00880 g010
Figure 11. Of GNT 5% fibers for three catalytic cycles.
Catalysts 09 00880 g011
Figure 12. Illustration of Z-scheme photocatalytic mechanism for the g-C3N4.
Catalysts 09 00880 g012
Table 1. Physicochemical properties of calcinated g-C3N4/TiO2 and g-C3N4.
Sample% Anatase% RutileCrystal Size (nm)SBET (m2/g)Average Pore Diameter (nm)VTOT (cm3/g)Energy Band Gap (eV)
TiO284.115.915.240.013.840.15892.80
GNT 1%80.020.015.240.812.540.12772.92
GNT 2.5%85.114.915.247.69.340.24992.79
GNT 5%84.315.715.144.39.520.18312.91
g-C3N4--27.035.2--2.82
Table 2. Formation rate of OH radicals after 60 min of irradiation and correlation coefficient for linear model as well as the photocatalytic degradation of methylene blue for the prepared fibrous catalysts.
Sample (Fibers)Formation Rate of OH Radicals (μΜ/min)R2K (min−1)t1/2 (min)R2
TiO20.2880.9510.062811.10.9712
GNT 1%0.2970.9170.07529.20.9869
GNT 2.5%0.2980.9040.07818.870.9837
GNT 5%0.3480.9290.11136.220.9789
Table 3. Reusability performance of GNT5% catalyst.
Sample GNT 5%k (min−1)t1/2 (min)R2
1st cycle0.08368.30.9484
2nd cycle0.07978.70.9965
3rd cycle0.07369.40.9829

