Abstract
The performance of plasma-modified Pt/CeO2 for toluene catalytic oxidation was investigated. Pt/CeO2 nanorods were prepared by wet impregnation and were modified by thermal (PC-T), plasma (PC-P), and combined (PC-TP and PC-PT) treatments. The modified catalysts were characterized by TEM (transmission electron microscope), BET (Brunauer-Emmett-Teller), H2-TPR, O2-TPD, XPS, UV-Raman, and OSC tests. The significant variation of the surface morphologies and surface oxygen defects could have contributed to the modification of the Pt/CeO2 catalysts via the plasma treatment. It was found that plasma could promote the surface interaction between Pt and CeO2, resulting in the thermal stability of the catalyst. The Pt-Ce interaction was also conducive to an increase in the number of oxygen vacancies. Furthermore, PC-PT and PC-TP showed a significant difference in oxygen vacancy concentrations and catalytic activities, which illustrated that the treatment sequence (plasma and thermal treatment) affected the performance of Pt/CeO2. The PC-PT sample showed the highest catalytic activity with T100 at 205 °C. This work thus demonstrates that plasma in combined treatment sequences could assist surface interactions of catalysts for enhanced toluene catalytic oxidation.
1. Introduction
Volatile organic compounds (VOCs) are high-risk contaminants, which can cause a significant threat to the nervous system and the environment [1,2]. Toluene is a representative VOC, which is of high toxicity and very difficult to naturally degrade. In the past few years, the use of noble metals (Pt, Au, Pd) and redox supports (CeO2, Co3O4, ZrO2) [3,4,5,6] to improve toluene oxidation has been prevalent. In particular, Pt-based materials have been widely adopted for toluene oxidation because of their excellent toluene dissociative adsorption abilities [7]. Meanwhile, the CeO2 redox support has attracted considerable attention due to its high oxygen storage ability. During the traditional preparation of these catalysts, calcination is employed to activate the catalyst, but they are at risk of sintering at high temperatures. To avoid this risk during Pt/CeO2 activation, non-thermal plasma has been proposed as an alternative technique.
Non-thermal plasma (NTP) is a promising technology for catalyst surface treatment, which could alter the morphology and chemical states of a catalyst, create more defects on the catalyst surface, and activate the catalyst in facile reaction conditions (fast response at room temperature). It could also improve the activity and thermal stability of the catalyst [8,9]. Di et al. [10] reported that the Pd/P25 catalyst reducing by plasma treatment had a smaller Pd particle size and showed a better activity for CO oxidation. Gulyaev et al. [11] prepared Pd/CeOx by plasma synthesis and found an increase of Pd dispersion and turnover frequency (TOF) after discharge. Notably, previous discussions of catalyst modification during discharge mainly concentrated on the surface morphology changes, dispersion of active metals, and the reduction extent of the catalysts, but its effect on surface defects such as oxygen vacancies should not be neglected. Ye et al. [12] introduced plasma and thermal annealing to create various defects on MoS2 to promote the hydrogen evolution reaction. Xu et al. [13] employed plasma to engrave Co3O4 nanosheets, which produced more oxygen vacancies on the Co3O4 surface after discharge, and the activity improvement was attributed to a larger number of exposed active defects. Although plasma-induced catalyst surface defects have gained research attention, there have been few studies on the effect of plasma on CeO2 surfaces. Furthermore, the more efficient use of plasma should be studied. Qi et al. [14] used a single plasma to reduce Pd species on activated carbon at low temperatures to avoid sintering, but the reduction of PdOx was insufficient. Lee et al. [15] claimed that sintering is an issue for catalysts at high temperatures. Hence, single methods (plasma or thermal) have not met the demands for catalyst modification. Thus, a combination of plasma and thermal methods may address these issues. Laura et al. [16] attempted to modify Pt catalysts by using a combination of plasma and thermal reduction and suggested that catalysts prepared via this method exhibited higher activities in the water-gas shift reaction than catalysts treated by only single plasma or calcination. Thus, the combination of plasma and thermal treatment is prominent for active catalyst modification. Currently, the synergetic effect of combining plasma and thermal treatment is still unclear, and the role of plasma in combined treatment also should be clarified.
In this study, Pt loaded on CeO2 nanorods was employed as a catalyst, and the catalytic performances of Pt/CeO2 with plasma and/or thermal treatments were compared. To investigate the effects of plasma on physical/chemical changes of the catalyst, X-ray diffraction (XRD), high-resolution transmission electron microscopy (HRTEM), X-ray photoelectron spectroscopy (XPS), UV-Raman, H2-temperature programmed reduction (H2-TPR), O2-temperature programmed desorption (O2-TPD), and oxygen storage capacity (OSC) tests were used. Furthermore, the TOFs based on Pt particles and oxygen vacancies were calculated. Through these characterizations, the effect of combining catalyst treatments in various sequences was uncovered.
2. Results
The catalytic oxidation of toluene was evaluated. As shown in Figure 1, the catalytic activities of the samples were in the following order: PC-PT > PC-TP > PC-P >PC-T > PC-U. Compared to pure CeO2 whose T100 had reached 328 °C, the catalytic activities of Pt/CeO2 was improved. The lowest T100 and T50 were found for PC-PT at 205 °C and 167 °C, respectively, while the T100 of PC-TP was 236 °C, 30 °C higher than that of PC-PT. Therefore, the treatment sequence in combined treatment could affect the catalytic activity. Moreover, Arrhenius plots were used to further compare the chemical kinetic activities of the samples, as shown in Figure 2 and Table 1. The Arrhenius plots were obtained when the toluene oxidation conversion was below 10%, and a linear correlation was found. As shown in Table 1, the activation energy (Ea) values for PC-PT, PC-TP, PC-P, PC-T, and PC-U are 74.5, 83.1, 89.2, 102.6, and 116.8 kJ mol−1. The Ea values of PC-PT and PC-TP are lower, indicating an easier activation of toluene oxidation.
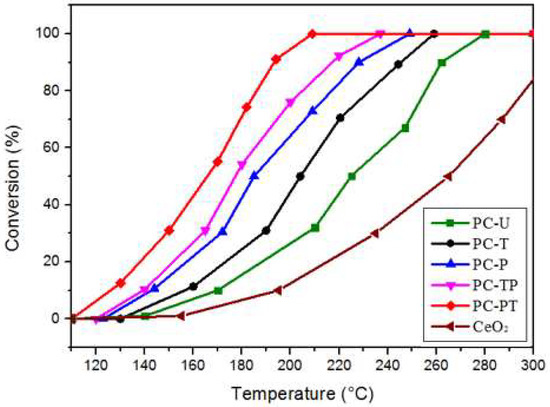
Figure 1.
Conversion of toluene over catalysts with various treatment.
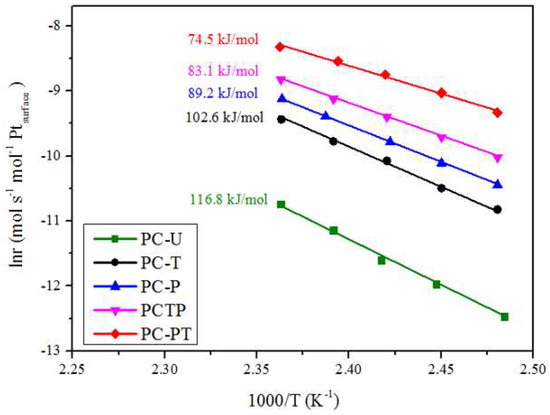
Figure 2.
Arrhenius plots for the oxidation of toluene over different Pt/CeO2 catalysts.

Table 1.
Catalytic performances of various samples.
Catalyst amount: 200 mg; Toluene concentration: 200 ppm; gas flow: 100 ml min−1.
Evidently, the catalysts treated with plasma and thermal processes exhibited better catalytic activities, which deserves further discussion. Generally, a Pt particle is regarded as an active site of Pt-based materials. Greater Pt dispersion can expose more Pt atoms, which is associated with active toluene oxidation due to the excellent toluene adsorption [17]. To investigate this effect, TOFPt values based on Pt dispersion were calculated. As listed in Table 1, the TOFPt values were 7.9 × 10⁻³, 7.4 × 10⁻³, 6.2 × 10⁻³, 6.1 × 10⁻³, and 3.1 × 10⁻³ s−1 for PC-PT, PC-TP, PC-P, PC-T, and PC-U, respectively. Compared to the samples without plasma modification (PC-T and PC-U), the catalytic activities of the plasma-treated samples (PC-PT and PC-TP) and TOFPt values increased. Since TOFPt was the turnover frequencies based on the Pt particles, and a positive correlation exists between the TOFPt value and the catalytic activity, it was inferred that Pt particles were active sites. In addition, Asgari et al. [18] reported that oxygen vacancies played a vital role in the catalytic oxidation by controlling the consumption and supplementation of surface activated oxygen. TOFov values were also calculated (Table 1) as follows: PC-PT (3.6 × 10⁻⁴ s−1), PC-TP (3.4 × 10⁻⁴ s−1), PC-P (2.8 × 10⁻⁴ s−1), PC-T (2.6 × 10⁻⁴ s−1), and PC-U (2.0 × 10⁻⁴ s−1). The similar trends between the catalytic activities and TOFov values confirmed that oxygen vacancies were also crucial active sites that determined the performances of the samples.
The specific surface areas (SBET) of the samples are shown in Table 2. The SBET of PC-PT was increased by nearly 10 m2 g−1 as compared to that of PC-T, which indicated that catalysts’ morphologies were modified by the plasma. This might be ascribed to the fact that plasma-excited species etched the catalyst surface [19] and some of the CeO2 nanorods were cracked and became shorter, exposing more of the catalysts’ surface area. The decrease of SBET was attributed to sintering of the catalysts at high temperatures. However, the slight decreases of SBET from PC-P to PC-PT/PC-TP suggested that plasma treatment was conducive to inhibiting the sintering of catalyst. The Pt loading amounts of the samples ranged from 0.79–0.81 wt %, as shown in Table 2.
Table 2.
Structural parameters of various samples.
TEM images of the catalysts are presented in Figure 3. The images of the samples showed the spacing of 0.32 nm for the (111) crystal planes of CeO2 and identical Pt lattices with a Pt (111) interplanar distance of 0.23 nm. Samples were rod-shaped, as expected, but partial cracking occurred on the CeO2 nanorods modified by plasma. Thus, the plasma treatment yielded shorter CeO2 nanorods. The Pt particle sizes were determined from the images, and the results are listed in Table 1. For PC-P, PC-TP, and PC-PT, the mean Pt particle sizes were 2.3 nm, 2.4 nm, and 2.5 nm, respectively, but the size of PC-T was 3.2 nm. Compared to the Pt particle size of PC-T, PC-P showed a decreased Pt particle size, and the particle sizes of PC-TP and PC-PT were also obviously smaller than that of PC-T. This was attributed to the etching effect of the plasma: Pt particles that aggregated into clusters were split by the plasma in the discharge area and dispersed uniformly on the catalyst surface. The Pt particle sizes estimated by CO-chemisorption were as follows: PC-T (3.6 nm), PC-P (2.6 nm), PC-TP (2.8 nm), and PC-PT (2.7 nm). These calculated sizes were larger than those determined from the TEM images, which is consistent with previous reports [20,21]. The small differences between the Pt particle sizes obtained by TEM and CO-chemisorption proved the accuracy of the TEM test. The corresponding platinum particle dispersions are also listed in Table 2. The Pt dispersion for PC-PT was 46.9%, followed by PC-TP (45.0%). Notably, the PC-PT and PC-TP samples had similar Pt dispersions, indicating that the different treatment sequences had little effect on the particle size. The variety of catalytic activities between PC-PT and PC-TP should not only be attributed to Pt dispersion.
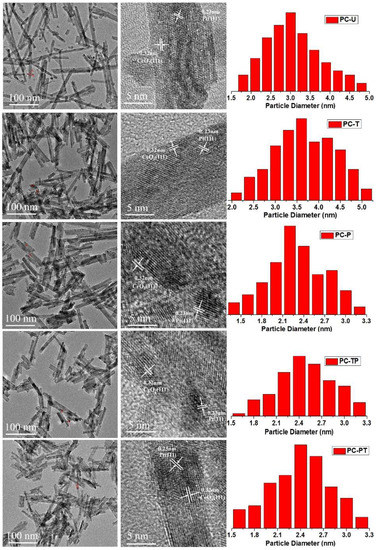
Figure 3.
TEM image images of samples and size distribution of Pt particles on CeO2 support.
The XRD patterns of the five samples are shown in Figure 4. The diffraction patterns of all the samples exhibited face-centered cubic fluorite structures (JCPDS card No. 34-0394) [22]. The deficiency of the diffraction peak of Pt metal (39.8°) was due to the high dispersion or low loading of Pt. The average crystallite size of each material was calculated from the Scherrer equation based on the full width at half maximum (FWHM) of the CeO2 (111) plane, and the results are displayed in Table 2. PC-P showed a decrease of the mean crystal size compared to that of PC-U, suggesting that the plasma discharge had a shrinkage effect on the catalyst morphology. Some studies found that as the crystal size decreased with a lower Ce–O symmetry, the number of surface oxygen sites/oxygen vacancies in the CeO2 sample increased [23]. In addition, thermal treatment at high temperatures could induce catalyst sintering [24], as is evidenced by the difference in the crystal sizes between PC-U and PC-T. However, compared to the remarkable increase of the crystal size from PC-U to PC-T, the slight change from PC-U to PC-PT suggested that the plasma might inhibit the catalyst sintering [25,26]. Moreover, Farmer et al. [27] suggested that sintering was strongly affected by the metal-support interactions. Yang et al. [28] proved that plasma could enhance the interface reaction between the support and metal, and stabilize the plasma-activated Pt catalyst in sintering tests. Therefore, the sintering inhibition of PC-PT was likely due to Pt-Ce interface reactions, as Pt was inserted into CeO2, and made the crystal structure more stable at high temperatures [15]. The crystal sizes of PC-TP (8.0 nm) and PC-PT (7.3 nm) indicated that different treatment sequences could result in changes of the catalyst structure, and thus, the thermal stability varied.
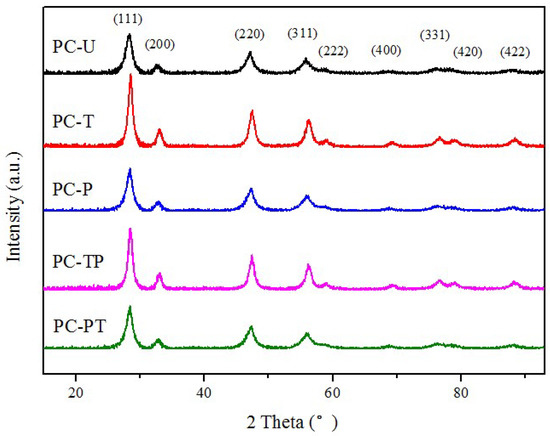
Figure 4.
XRD pattern of different Pt/CeO2 samples.
XPS analysis was employed to estimate the surface composition of the catalysts, and the results are shown in Figure 5 and Table 3. Figure 5A shows the spectra of the Ce species, which were fit with eight peaks, corresponding to the pairs of spin-orbit doublets. Ce 3d5/2 and Ce 3d3/2 spin–orbit components were denoted as U and V, respectively. Based on previous reports, three pairs of peaks, V (881.9 eV), U (899.3 eV); V” (888.5 eV), U” (905.9 eV); and V”’ (897.6 eV), U”’ (915.0 eV), were ascribed to Ce4+ [29]. The peaks V’ (884.2 eV) and U’ (901.6 eV) were assigned to Ce3+. The data in Table 3 shows that the Ce3+ ratios of the combined-treated sample PC-TP (27.07%) and PC-PT (30.30%) were higher than that of the single-treated samples PC-T (22.35%). Since the relative contents of Ce3+ were regarded as an indicators of oxygen vacancies on the CeO2 surfaces, it was inferred that the samples modified by combined treatments obtained a greater number of oxygen vacancies than those modified by a single method. Moreover, when PC-U was compared with PC-P, the Ce3+ ratio increased from 20.44% to 26.44%, and the Ce3+ ratio of PC-PT had a further increase to 30.30%. The increased Ce3+ ratio indicated that the catalyst oxygen vacancies increased stepwise due to the plasma plus thermal treatments.
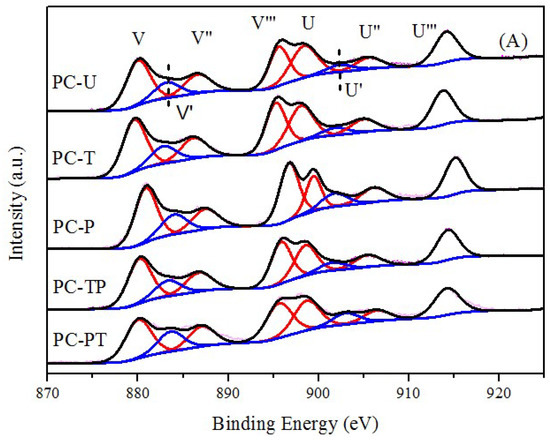
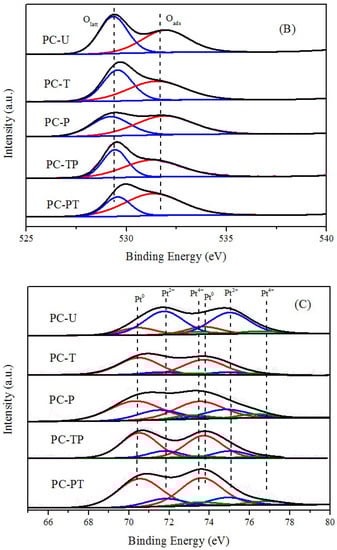
Figure 5.
XPS spectra for different Pt/CeO2 samples: (A) Ce 3d, (B) O 1s, (C) Pt 4f.
Table 3.
XPS data of various samples.
The O1s spectra are shown in Figure 5B. The O1s spectra were deconvoluted into two peaks: peaks in the 532.1–532.4 eV range were assigned to surface oxygen (Oads), and peaks in the 529.6–529.9 eV range were assigned to lattice oxygen (Olatt) [30]. The relative proportions of Oads could reflect the concentration of surface oxygen species over the catalyst. As shown in Table 3, Oads ratio increased in the following order: PC-U, 51.07%; PC-T, 53.69%; PC-P, 63.78%; PC-TP, 64.20%; PC-PT, 70.11%. The relative ratios of Oads for plasma-treated samples ranged from 63.78% to 70.11% when the ratios of PC-T and PC-U were less than 55%. Hence, the concentration of surface active oxygen was increased through plasma treatment. Furthermore, the Oads proportion increased from 63.78% (PC-P) to 70.11% (PC-PT) due to the combined treatment, which might explain the better catalytic activity of PC-PT than PC-P, because more surface-active oxygen species on the catalyst would enhance its catalytic performance for toluene oxidation [31].
The Pt 4f spectra, comprising Pt 4f7/2 and Pt 4f5/2, are shown in Figure 5C. Pt was present mainly in metallic states Pt0 and platinum oxide Ptδ+ (Pt2+, Pt4+). The peaks of the Pt0 species appeared at 70.6 and 73.9 eV, the peaks of Pt2+ appeared at 72.0 and 75.2 eV, and the peaks of Pt4+ appeared at 73.7 eV and 77.0 eV. The content of Pt0 in PC-T, PC-TP, and PC-PT were greater than 75%, while it was only 62.5% in PC-P. It was confirmed that Pt species of the PC-P sample contained lower amounts of Pt0. Hence, it was necessary to employ a combined modification method to activate the catalyst, combining thermal treatment with H2 as a supplement to plasma reduction. The relative surface platinum concentrations of the various catalysts might imply the inward diffusion of Pt [32]. The low Pt/Ce ratios shown in Table 3 for PC-PT, PC-TP, and PC-P were attributed to the incorporation of Pt into the CeO2 surface layer, which enhanced the interaction between Pt and CeO2. However, the significantly lower ratio in PC-T was due to Pt incorporation into the CeO2 bulk lattice as a result of catalyst sintering [33]. Therefore, when the Pt/Ce ratios of PC-PT and PC-TP were compared with that of PC-T, it was indicated that the plasma in combined treatments likely inhibited sintering and promoted metal-support interactions.
H2-TPR was employed to analyze the reducibilities of the samples with various treatments. As shown in Figure 6, the profile of CeO2 only consisted of one wide peak, and the peak temperature ranged from 250 °C to 500 °C, which was assigned to the reduction of oxygen species on the surface and subsurface of CeO2. After the impregnation of Pt on CeO2, two reduction peaks appeared at around 100 and 400 °C. The first peak indicated the reduction of PtOx or ceria oxygen adjacent to Pt species, and the second peak is assigned to ceria oxygen far from the Pt [34]. Compared to PC-U, the peak positions of the samples with plasma treatment shifted to lower temperatures significantly, with the peak temperatures of PC-P, PC-TP, and PC-PT shifted from 138 °C (PC-U) to 103, 101, and 94 °C, respectively. Higher temperature peaks of around 400 °C showed similar shifts. It was reported that Pt species could spill over H2 to the neighboring Ce–O bond [35,36], which caused the reduction peaks of CeO2 to appear at lower temperatures. To further compare the low-temperature reducibilities, we calculated the total H2 consumption of the samples, as summarized in Table 4. The H2 consumption below 200 °C showed a sharp rise for PC-P, PC-TP, and PC-PT to 128, 135, and 182 μmol g−1, respectively, while the values of H2 uptake for the PC-U and PC-T samples were around 50 μmol g−1. Note that the nominal value of H2 consumed by loaded Pt species should be 28 μmol g−1. Thus, the excess H2 uptake of the samples was ascribed to the spillover effect, causing the reduction of Ce4+ ions that were adjacent to Pt species. Hence, the first peak should be not only assigned to the reaction of PtOx with H2 at low temperatures but also the reduction of active oxygen species derived from ceria that interacted with Pt [37]. Therefore, the increased H2 consumption of PC-PT compared to that of PC-T may indicate that the Pt-Ce interaction was enhanced due to the plasma treatment. The differences of the reduction temperature and H2 consumptions of PC-PT and PC-TP were attributed to their different reducibilities caused by the various treatment sequences, and the combined treatment with a certain sequence could facilitate the reduction of surface oxygen on the Pt/CeO2 catalyst.
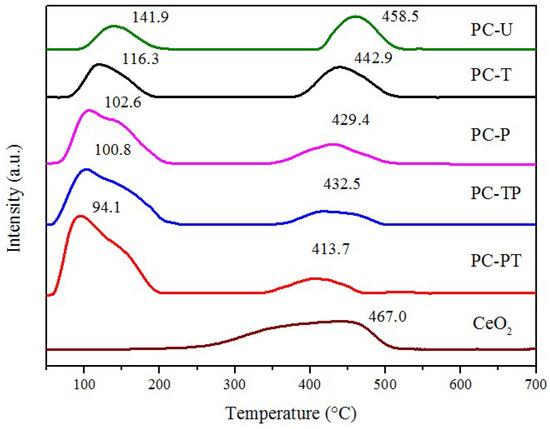
Figure 6.
H2-TPR profiles of different Pt/CeO2 samples.
Table 4.
H2-TPR, O2-TPD, Raman and OSC data of various samples.
To further investigate the redox properties of the samples, the O2-TPD profiles are shown in Figure 7. There are three peaks in the traces of the samples. The peaks of PC-PT appeared at 104, 254, and 436 °C. The peak temperatures of the other samples were higher compared to that of PC-PT, and the lower peak position indicated that oxygen is more likely to migrate over the catalyst. In general, the oxygen adsorbed by the catalyst underwent the following process: O2 (ad) → O2− (ad) → O− (sur) → O2− (lat) [38]. The peaks were assigned as follows: the peak below 200 °C was related to O2− (ad), the peak in the 200–400 °C range was related to chemically adsorbed oxygen O− (sur), and the peak above 400 °C was related to O2− (lat). The amounts of O2− (ad) and O− (sur) are listed in Table 4. As shown, the intensity of the O2− (ad) peak showed significant variations among the samples. The total O2− (ad)/O− (sur) can be used as an index to compare the oxygen utilization ability of the catalysts [39]. As calculated from Table 4, the O2− (ad)/O− (sur) value of PC-PT was highest at 2.0 and followed by PC-TP at 1.7, while the O2− (ad) ratio of PC-T was 1.5, which indicated that the combined treatment could enhance the catalysts’ oxygen utilization ability to various extents. It was consistent with XPS results that PC-PT showed a higher Oads ratios than PC-TP. Moreover, oxygen vacancy was regarded as oxygen adsorbed and desorbed center, which acted a bridge to adsorb active gaseous oxygen [40]. Thus, the O2 adsorption of each sample could be related to various oxygen vacancies, which might influence the catalytic performance.
Figure 7.
O2-TPD profiles of different Pt/CeO2 samples.
To study the role of oxygen vacancies for the catalysts and investigate the crystallinities of the samples, UV-Raman was performed, and the results are shown in Figure 8. Three typical peaks appeared in the Raman spectra at 457, 588, and 1174 cm−1. Generally, the first peak corresponded to the F2g mode, due to the symmetrical stretching vibrations of Ce–O in fluorite CeO2 [41]. The second peak was attributed to a defect-induced mode (D), which was related to oxygen vacancies caused by Ce3+ defects. The third peak was distinguished as a second-order longitudinal optical (2LO) mode [42]. To identify the samples’ relative oxygen vacancy concentrations, the ratios of the F2g and defect-induced modes (ID/IF2g) were determined, and the values were in the following order: PC-U (1.55) < PC-T (1.73) < PC-P (2.49) < PC-TP (2.52) < PC-PT (2.82). As shown in Table 4, the ID/IF2g ratios of plasma-treated samples increased sharply, as compared to those of samples without plasma modification. For example, the ID/IF2g ratio of PC-P was 2.49 but the ID/IF2g of PC-T was only 1.73. The results was in accord with the Ce3+ ratio estimated from the XPS test. Since the ID/IF2g ratio could also reflect the relative concentration of oxygen vacancies, it was therefore evident that plasma could induce the formation of more oxygen vacancies.
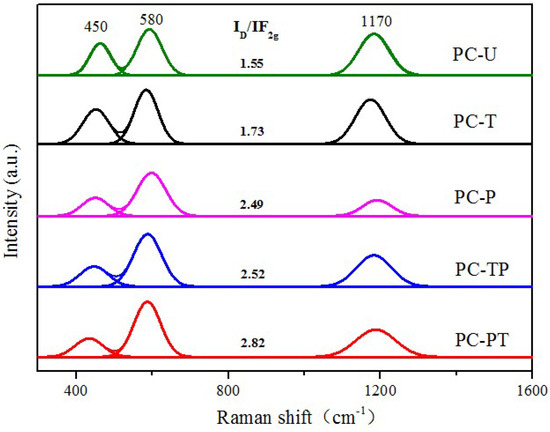
Figure 8.
Raman spectra of different Pt/CeO2 samples.
The OSC test was used to quantify the oxygen vacancies, the OSCsurface values were determined and are summarized in Table 4. The calculated values were as follows: PC-U (40.1 μmol O g−1), PC-T (58.2 μmol O g−1), PC-P (99.3 μmol O g−1), PC-TP (102.9 μmol O g−1), and PC-PT (125.1 μmol O g−1), which agreed with the Raman data. Thus, thermal or plasma treatment could enhance the catalyst oxygen vacancies, and a greater number of oxygen vacancies were present in the plasma-modified samples, while the effect of sole thermal treatment was slight. PC-PT, which underwent thermal treatment after plasma treatment, exhibited the greatest number of oxygen vacancy sites. This indicates that the combined treatment of Pt/CeO2 was conducive to the formation of oxygen vacancies. However, different results between PC-PT and PC-TP implied that various treatment sequences could also affect the oxygen vacancies.
3. Discussion
From the results of XRD, XPS and H2-TPR, it was concluded that plasma played a vital role in promoting the surface interaction. It was reported that promoted surface interaction could enhance catalyst’s thermal stability and increase the number of oxygen vacancies over catalyst surface [26,33]. The effects of plasma on surface interaction were also clarified. The energetic species in discharge stroke and etched the catalyst surfaces, scattered Pt particles from agglomerated Pt, and produced small particles. Laura et al. [16] proposed that the plasma might generate electron-enriched Pt particles, which could interact with the ceria support strongly. Highly dispersed Pt particles were conducive to interactions with active supports. The plasma probably promoted the Pt atom to enter into CeO2 surface layer and enhanced the interaction between Pt and CeO2. Through the plasma-assisted interaction, catalysts’ thermal stability enhanced, as the XRD and BET results proved.
Moreover, the plasma affected the generation of oxygen vacancies. Excited species with various energy levels were likely to break their molecular bond. When excited species with high energies approached the catalyst surface, they could transmit energy to the Ce–O asymmetrical bond through collision dissociation [43]. Subsequently, the Ce–O bonds were broken, and Ce- defects formed when the excited O* possibly escaped from the surface directly or reacted with H2 species. The inference was proven by a significant increase in the oxygen vacancies amount of PC-P, as compared with that of PC-U. In addition, the bombardment of excited species could promote the Pt-Ce interaction and resulted in electronic enrichment of the catalyst surface. Electron-enriched Pt would interact with the adjacent Ce–O bonds, causing the relaxation of Ce–O, which made it vulnerable to reaction with H2 and decreased the energy barrier for the formation of oxygen vacancies. Wang et al. [44] confirmed that the interaction between the metal and support affected the oxygen vacancy formation energy and played a vital role in oxygen vacancy generation. Alayoglu et al. [45] also reported that the oxygen species of CeO2 that had interacted with platinum were consumed by H2 and formed new oxygen vacancies. Thus, when the subsequent H2/N2 thermal condition was added to plasma-excited catalyst, the H2 species that were activated by the thermal condition would react with the Pt-interacted Ce–O bonds and generate more Ce-defects. As a result, PC-PT contained more oxygen vacancies than PC-P and PC-TP, which did not receive subsequent thermal treatment. The details are shown in Figure 9. It was clear that the plasma could enhance the generation of oxygen vacancies and surface interaction between precious metal and supports.
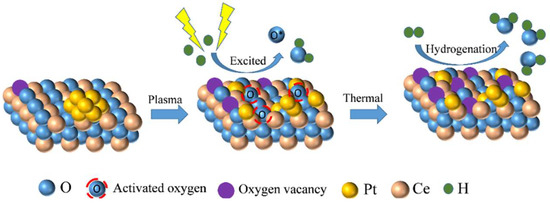
Figure 9.
Modification mechanism of PC-PT.
According to Mars-van Krevelen reaction mechanism, toluene oxidation on Pt/CeO2 is followed by the activation of adsorbed toluene and dissociative O2. Combining TEM, OSC test and activity evaluation, it was found that PC-PT with small particle sizes could expose more Pt atoms and increase the amount of toluene molecules adsorbed by the catalyst, and a large number of oxygen vacancies over PC-PT could facilitate the dissociative O2 adsorption and activation. Hence, PC-PT showed the best catalytic activity. Moreover, PC- PT and PC-TP underwent plasma and thermal treatment, but their different treatment sequences caused their variety in characterization. From the TEM results, PC-PT and PC-TP had similar Pt particle sizes, but the data from the OSC tests confirmed that they contained different numbers of oxygen vacancies, which explains why the PC-PT exhibited a better catalytic activity than PC-TP. Evidently, the treatment sequence of the combined treatment could deeply affect toluene catalytic oxidation of Pt/CeO2 and the role of plasma in combined treatment sequences determined catalysts’ performances.
4. Materials and Methods
4.1. Catalysts Preparation
The CeO2 nanorod supports were prepared as follows. First, 1.586 g of cerium acetate (5 mmol) was dissolved in deionized water, after which 55 ml NaOH solution (7 mol L−1) was added. The mixed translucent solution was stirred for 0.5 h at room temperature, and then transferred to a 100 ml autoclave for hydrothermal treatment for 5 h at 130 °C. After the hydrothermal treatment was completed, the obtained precipitate was washed with deionized water and ethanol until the pH reached 7 and dried at 100 °C for 5 h. Next, Pt/CeO2 was synthesized through an incipient-wetness impregnation method as follows. The previously synthesized CeO2 was impregnated in a solution of Pt(NO3)2 at a concentration to yield a final loading content of 0.8 wt %. The impregnated Pt/CeO2 catalysts were calcined at 300 °C for 3 h in dry air, and the obtained catalyst was denoted as PC-U. PC-U that was subsequently plasma-treated for 3 h was denoted as PC-P. The PC-P and PC-U samples that were thermally treated at 300 °C for 3 h in 20% H2/N2 (MESSER, Foshan, China) were respectively denoted as PC-PT and PC-T. Finally, PC-T was then treated by plasma to obtain a sample denoted as PC-TP.
All the chemicals were purchased from Aladdin, Shanghai, China.
4.2. Experimental Setup
A schematic of the overall experimental setup is shown in Figure 10. The plasma treatment occurred in a dielectric barrier discharge (DBD) reactor (CTP-2000K, Suman, Nanjin, China) due to its facile operation requirements (room temperature and atmospheric pressure). A constant AC (Alternating Current) power of 4.8 W (frequency of 1.77 kHz) was supplied to power the DBD reactor. A stainless-steel high-voltage electrode (2 mm diameter) was set in the center of the quartz tube (6 mm diameter) as the inner electrode, and copper foil was wrapped around the tube as the outer electrode. The discharge gap between high-voltage electrode and quartz was maintained at 2 mm, and the length of the discharge area was 50 mm. During the discharge, 0.5 g catalyst was introduced to the discharge zone, and a reducing gas (20% H2/N2 with 100 ml min−1 flow rate) was used as the carrier gas in the plasma reactor to intensify the electron collisions on the catalyst. The exhaust gas was monitored by gas chromatography (GC-2014C, SHIMADZU, Kyoto, Japan) equipped with a flame ionization detector (FID). The toluene concentration and flow rate were controlled at 200 ppm and 100 ml min−1, respectively, by mass flow controllers (MFCs).
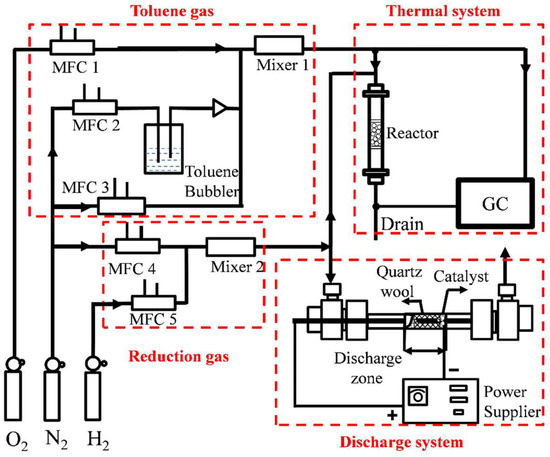
Figure 10.
Schematic diagram of the experimental setup. The discharge condition was set for 3h with 4.8 W of input power, 1.77 kHz AC frequency, catalyst amount was fixed at 0.5 g.
4.3. Catalysts Characterization
The amount of loaded Pt was measured by inductively coupled plasma/optical emission spectroscopy (ICP-OES, Perkin-Elmer plasma 8000, Norwalk, CT, USA). XRD analysis of the catalysts was performed using a Bruker D8-ADVANCE X-ray diffractometer (Bruker, Karlsruhe, Germany) equipped with Cu Kα radiation (40 kV and 40 mA, scanning step = 0.02). Nitrogen adsorption and desorption isotherms were tested on a Micromeritics ASAP 2020 system (Micromeritics, Atlanta, GA, USA) to calculate the specific surfaces area (SBET).
XPS analyses of the catalysts were conducted using a Thermo ESCALAB250 (Waltham, MA, USA). The binding energies were determined relative to that of adventitious carbon (C1s), whose binding energy is 284.6 eV. UV-Raman spectra were measured using a LabRAM HR Evolution Laser Raman Spectrometer (HYJ, France) with a 325 nm laser excitation source and a spectrometer with 2400 grooves mm−1.
HRTEM images were obtained using a Tecnai G2 F20 S-TWIN (Hillsboro, OR, USA). The average diameters of Pt particles (d1Pt) and their dispersion (D1Pt) were calculated based on the HRTEM images of the catalyst using the following formulas:
where ni represents the number of particles of diameter di (nm), MPt represents the molar mass of Pt (195.08 g mol−1), ρPt denotes the density of Pt (21.45 g cm−3), aPt is the cross-sectional area of a Pt atom (8.06 × 10⁻²⁰ m2 atom−1), and NA is the Avogadro constant (6.019 × 10²³ atom mol−1).
CO-chemisorption, H2-TPR, O2-TPD, and OSC tests were performed using a chemisorption analyzer (Micromeritics Chemisorb 2920II, Mircomeritics, Norcross, GA, USA). For CO-chemisorption, a 50 mg sample was deposited in a U-shaped quartz tube and exposed to Ar flow (30 ml min−1) at 300 °C for 1 h. After the sample was cooled to ambient temperature, a 10% CO/Ar (30 ml min−1) stream was periodically injected into the tube until the catalyst achieved adsorption saturation. For H2-TPR, a 50 mg sample was pretreated at 300 °C with 5% O2/He (30 ml min−1) mixed gas for 1 h, after which it was cooled to 50 °C by Ar (30 ml min−1). Subsequently, the gas flow into the tube was changed to 10% H2/Ar (30 ml min−1) and the samples were heated to 700 °C. For O2-TPD, a 50 mg of sample was pretreated in He flow (30 ml min−1) at 300 °C for 1 h. Subsequently, the sample was cooled to 60 °C and allowed to adsorb 5% O2/He (30 ml min−1) mixed gas at 60 °C for 1 h, and then heated up to 700°C with He purging (30 ml min−1). For OSC, about a 50 mg sample was first pretreated by He flow (30 ml min−1) for 1 h at 300 °C, after which it was cooled to ambient temperature, followed by the periodic injection of 5% O2/He (30 ml min−1) until saturation was achieved.
The diameter (d2Pt) of a Pt particle and corresponding dispersion (D2Pt) based on the CO-chemisorption were calculated as follows:
where XPt denotes the Pt loading and SPt represents for Pt relative surface area obtained by the CO chemisorption (m2 g−1). The stoichiometric ratio between the Pt atoms and CO was defined to be 1:1.
The number of surface oxygen vacancies (OSCsurface) was obtained from the following equations:
where OSCcatalyst represents the consumption of oxygen by catalyst, and it was calculated by the OSC test; OSCPt represents the oxygen consumption for Pt alone, and MPt is the molar mass of Pt (195.08 g mol−1). The stoichiometric ratio of Pt and oxygen atoms was defined to be 1:2.
4.4. Catalytic Evaluation
Before catalytic evaluation, the samples (100 mg, 40–60 mesh) diluted with 400 mg of silicon (40–60 mesh) were packed in the bed of the quartz reaction tube (8 nm internal diameter and 50 cm length). Subsequently, 200 ppm toluene carried by 100 ml min−1 of air (20% O2/N2) was sent into the tube to evaluate the catalytic activity. The activation energies (Ea) were calculated at 125–145 °C, at which the toluene conversion is less than 10%. T50 and T100 were regarded as indices of catalytic evaluation, which respectively denote the temperature of toluene conversions of 50% and 100%. The conversion (η) of toluene by oxidation was calculated by the formula:
where Cin denotes the inlet toluene concentration (ppm) and Cout denotes the outlet toluene concentration (ppm).
The turnover frequencies (TOFs) were calculated using the following formulas:
where TOFPt and TOFov are the turnover frequencies based on the Pt particles and oxygen, respectively, η is the toluene conversion at 150 °C, Ftoluene is the toluene velocity (mol s−1), and mCat is the mass of the catalyst (g).
Activation energies (Ea) were based on the “mol-Pt-surface”, and the formula was as follows:
where r represents for reaction rate (mol s−1); Ea represents for activation energy (kJ mol−1); R is the universal gas constant (kJ mol−1 K−1); T is the temperature of reaction (K).
5. Conclusions
Plasma-assisted treatments influenced the size of Pt particles, the number of surface oxygen defects on CeO2, and the interface reaction between Pt and CeO2. Plasma modification improved catalysts’ thermal stability and inhibited the sintering of the catalysts in high temperature, resulting in greater exposure of active sites. Compared to catalysts without plasma treatment, the Pt particle sizes of catalysts treated by plasma decreased and high dispersion was obtained. The greater number of oxygen vacancies produced was ascribed to Pt-Ce interactions promoted by the combination of plasma and thermal treatments. Catalysts modified by different treatment sequences contained different concentrations of oxygen vacancies, which resulted in various activation energies for toluene oxidation. Moreover, the PC-PT sample exhibited the best catalytic activity, with T50 = 167 °C and T100 = 205 °C. Therefore, plasma modification followed by thermal treatment has great potential for future catalyst preparation.
Author Contributions
B.C. planned and designed the experiments; B.C., B.W. and Y.S. performed the experimental work; J.W., X.W. and M.F. contributed to the data analysis; B.C. wrote the manuscript; L.C. and Y.T. revised the manuscript; D.Y. supervised the project and revised the manuscript; all authors discussed the results and approved of the final version of the manuscript.
Funding
This research was funded by the General Program of National Natural Foundation of China (No. E080405), the Fundamental Research Funds for the Central Universities, Natural Science Foundation of Guangdong Province, China (No.2015B020236002), the Guangzhou Science and Technology Program key projects (No.201510010164), the National Natural Science Foundation of China (No. 51578245) and the Natural Science Foundation of Guangdong Province, China (No. 2016A030311003).
Conflicts of Interest
The authors declare no conflict of interest.
References
- Riedel, T.P.; Demarini, D.M.; Zavala, J.; Warren, S.H.; Corse, E.W.; Offenberg, J.H.; Kleindienst, T.E.; Lewandowski, M. Mutagenic atmospheres resulting from the photooxidation of aromatic hydrocarbon and NOx mixtures. Atmos. Environ. 2018, 178, 164–172. [Google Scholar] [CrossRef]
- Wang, B.; Xu, X.; Xu, W.; Wang, N.; Xiao, H.; Sun, Y.; Huang, H.; Yu, L.; Fu, M.; Wu, J.; et al. The Mechanism of Non-thermal Plasma Catalysis on Volatile Organic Compounds Removal. Catal. Surv. Asia 2018, 22, 73–94. [Google Scholar] [CrossRef]
- Ren, Q.; Mo, S.; Peng, R.; Feng, Z.; Zhang, M.; Chen, L.; Fu, M.; Wu, J.; Ye, D. Controllable synthesis of 3D hierarchical Co3O4 nanocatalysts with various morphologies for the catalytic oxidation of toluene. J. Mater. Chem. A 2018, 6, 498–509. [Google Scholar] [CrossRef]
- Torrentemurciano, L.; Solsona, B.; Agouram, S.; Sanchis, R.; López, J.M.; Garcia, T.; Zanella, R. Low temperature total oxidation of toluene by bimetallic Au–Ir catalysts. Catal. Sci. Technol. 2017, 7, 2886–2896. [Google Scholar] [CrossRef]
- Yang, H.; Deng, J.; Liu, Y.; Xie, S.; Wu, Z.; Dai, H. Preparation and catalytic performance of Ag, Au, Pd or Pt nanoparticles supported on 3DOM CeO2–Al2O3 for toluene oxidation. J. Mol. Catal. A-Chem. 2016, 414, 9–18. [Google Scholar] [CrossRef]
- Zhao, S.; Li, K.; Jiang, S.; Li, J. Pd–Co based spinel oxides derived from pd nanoparticles immobilized on layered double hydroxides for toluene combustion. Appl. Catal. B Environ. 2016, 181, 236–248. [Google Scholar] [CrossRef]
- Peng, R.; Sun, X.; Li, S.; Chen, L.; Fu, M.; Wu, J.; Ye, D. Shape effect of Pt/CeO2 catalysts on the catalytic oxidation of toluene. Chem. Eng. J. 2016, 306, 1234–1246. [Google Scholar] [CrossRef]
- Ju, Y.; Lefkowitz, J.K.; Reuter, C.B.; Sang, H.W.; Yang, X.; Suo, Y.; Sun, W.; Jiang, Z.; Qi, C. Plasma Assisted Low Temperature Combustion. Plasma Chem. Plasma Process. 2016, 36, 85–105. [Google Scholar] [CrossRef]
- Rahmani, F.; Haghighi, M.; Estifaee, P. Synthesis and characterization of Pt/Al2O3–CeO2 nanocatalyst used for toluene abatement from waste gas streams at low temperature: Conventional vs. plasma–ultrasound hybrid synthesis methods. Micropor. Mesopor. Mat. 2014, 185, 213–223. [Google Scholar] [CrossRef]
- Di, L.; Li, Z.; Lee, B.; Park, D.-W. An alternative atmospheric-pressure cold plasma method for synthesizing Pd/P25 catalysts with the assistance of ethanol. Int. J. Hydrogen Energy 2017, 42, 11372–11378. [Google Scholar] [CrossRef]
- Gulyaev, R.V.; Slavinskaya, E.M.; Novopashin, S.A.; Smovzh, D.V.; Zaikovskii, A.V.; Osadchii, D.Y.; Bulavchenko, O.A.; Korenev, S.V.; Boronin, A.I. Highly active PdCeOx composite catalysts for low-temperature CO oxidation, prepared by plasma-arc synthesis. Appl. Catal. B Environ. 2014, 147, 132–143. [Google Scholar] [CrossRef]
- Ye, G.; Gong, Y.; Lin, J.; Li, B.; He, Y.; Pantelides, S.T.; Zhou, W.; Vajtai, R.; Ajayan, P.M. Defects Engineered Monolayer MoS2 for Improved Hydrogen Evolution Reaction. Nano Lett. 2016, 16, 1097–1103. [Google Scholar] [CrossRef] [PubMed]
- Xu, L.; Jiang, Q.; Xiao, Z.; Li, X.; Huo, J.; Wang, S.; Dai, L. Plasma-Engraved Co3O4 Nanosheets with Oxygen Vacancies and High Surface Area for the Oxygen Evolution Reaction. Angew. Chem. Int. Ed. 2016, 55, 5277–5281. [Google Scholar] [CrossRef] [PubMed]
- Qi, B.; Di, L.; Xu, W.; Zhang, X. Dry plasma reduction to prepare a high performance Pd/C catalyst at atmospheric pressure for CO oxidation. J. Mater. Chem. A 2014, 2, 11885–11890. [Google Scholar] [CrossRef]
- Lee, J.; Ryou, Y.; Chan, X.; Kim, T.J.; Kim, D.H. How Pt Interacts with CeO2 under the Reducing and Oxidizing Environments at Elevated Temperature: The Origin of Improved Thermal Stability of Pt/CeO2 Compared to CeO2. J. Phys. Chem. 2016, 120, 25870–25879. [Google Scholar] [CrossRef]
- Pastor-Perez, L.; Belda-Alcazar, V.; Marini, C.; Pastor-Blas, M.M.; Sepulveda-Escribano, A.; Ramos-Fernandez, E.V. Effect of cold Ar plasma treatment on the catalytic performance of Pt/CeO2 in water-gas shift reaction (WGS). Appl. Catal. B Environ. 2018, 225, 121–127. [Google Scholar] [CrossRef]
- Chen, C.; Zhu, J.; Chen, F.; Meng, X.; Zheng, X.; Gao, X.; Xiao, F.-S. Enhanced performance in catalytic combustion of toluene over mesoporous Beta zeolite-supported platinum catalyst. Appl. Catal. B Environ. 2013, 140, 199–205. [Google Scholar] [CrossRef]
- Jamalzadeh, S.; Haghighi, M.; Asgari, N. Synthesis and physicochemical characterizations of nanostructured Pd/carbon-clinoptilolite-CeO2 catalyst for abatement of xylene from waste gas streams at low temperature. J. Ind. Eng. Chem. 2014, 20, 2735–2744. [Google Scholar] [CrossRef]
- Wang, Z.; Zhang, Y.; Neyts, E.C.; Cao, X.; Zhang, X.; Jang, B.W.L.; Liu, C. Catalyst Preparation with Plasmas: How Does It Work? ACS Catal. 2018, 8, 2093–2110. [Google Scholar] [CrossRef]
- Wang, B.; Chen, B.; Sun, Y.; Xiao, H.; Xu, X.; Fu, M.; Wu, J.; Chen, L.; Ye, D. Effects of dielectric barrier discharge plasma on the catalytic activity of Pt/CeO2 catalysts. Appl. Catal. B Environ. 2018, 238, 328–338. [Google Scholar] [CrossRef]
- Beck, A.; Horvath, A.; Szucs, A.; Schay, Z.; Horvath, Z.E.; Zsoldos, Z.; Dekany, I.; Guczi, L. Pd nanoparticles prepared by “controlled colloidal synthesis” in solid/liquid interfacial layer on silica. I. Particle size regulation by reduction time. Catal. Lett. 2000, 65, 33–42. [Google Scholar]
- Aslam, M.; Qamar, M.T.; Soomro, M.T.; Ismail, I.M.I.; Salah, N.; Almeelbi, T.; Gondal, M.A.; Hameed, A. The effect of sunlight induced surface defects on the photocatalytic activity of nanosized CeO2 for the degradation of phenol and its derivatives. Appl. Catal. B Environ. 2016, 180, 391–402. [Google Scholar] [CrossRef]
- Meher, S.K.; Cargnello, M.; Troiani, H.; Montini, T.; Rao, G.R.; Fornasiero, P. Alcohol induced ultra-fine dispersion of Pt on tuned morphologies of CeO2 for CO oxidation. Appl. Catal. B Environ. 2013, 130–131, 121–131. [Google Scholar] [CrossRef]
- Castkova, K.; Matousek, A.; Bartonickova, E.; Cihlar Jr., J.; Vanysek, P.; Cihlar, J. Sintering of Ce, Sm, and Pr Oxide Nanorods. J. Am. Ceram. Soc. 2016, 99, 1155–1163. [Google Scholar] [CrossRef]
- Mistry, H.; Varela, A.S.; Bonifacio, C.S.; Zegkinoglou, I.; Sinev, I.; Choi, Y.-W.; Kisslinger, K.; Stach, E.A.; Yang, J.C.; Strasser, P.; et al. Highly selective plasma-activated copper catalysts for carbon dioxide reduction to ethylene. Nat. Commun. 2016, 7, 12123. [Google Scholar] [CrossRef]
- Roldan Cuenya, B. Metal Nanoparticle Catalysts Beginning to Shape-up. Acc. Chem. Res. 2013, 46, 1682–1691. [Google Scholar] [CrossRef]
- Farmer, J.A.; Campbell, C.T. Strong Metal-Support Bonding. Science 2010, 329, 933–936. [Google Scholar] [CrossRef]
- Li, Y.; Yang, R.T.; Liu, C.; Wang, J. Hydrogen Storage on Carbon Doped with Platinum Nanoparticles Using Plasma Reduction. Ind. Eng. Chem. Res. 2007, 46, 8277–8281. [Google Scholar] [CrossRef]
- Murugan, R.; Vijayaprasath, G.; Mahalingam, T.; Ravi, G. Enhancement of room temperature ferromagnetic behavior of rf sputtered Ni-CeO2 thin films. Appl. Surf. Sci. 2016, 390, 583–590. [Google Scholar] [CrossRef]
- Si, W.; Wang, Y.; Zhao, S.; Hu, F.; Li, J. A Facile Method for in Situ Preparation of the MnO2/LaMnO3 Catalyst for the Removal of Toluene. Environ. Sci.Technol. 2016, 50, 4572–4578. [Google Scholar] [CrossRef]
- Damyanova, S.; Pawelec, B.; Palcheva, R.; Karakirova, Y.; Capel Sanchez, M.C.; Tyuliev, G.; Gaigneaux, E.; Fierro, J.L.G. Structure and surface properties of ceria-modified Ni-based catalysts for hydrogen production. Appl. Catal. B Environ. 2018, 225, 340–353. [Google Scholar] [CrossRef]
- Liotta, L.F.; Longo, A.; Macaluso, A.; Martorana, A.; Pantaleo, G.; Venezia, A.M.; Deganello, G. Influence of the SMSI effect on the catalytic activity of a Pt(1%)/Ce0.6Zr0.4O2 catalyst: SAXS, XRD, XPS and TPR investigations. Appl. Catal. B Environ. 2004, 48, 133–149. [Google Scholar] [CrossRef]
- Zhang, Q.; Luan, H.; Li, T.; Wu, Y.; Ni, Y. Study on Pt-structured anodic alumina catalysts for catalytic combustion of toluene: Effects of competitive adsorbents and competitive impregnation methods. Appl. Surf. Sci. 2016, 360, 1066–1074. [Google Scholar] [CrossRef]
- Lopez, J.M.; Gilbank, A.L.; Garcia, T.; Solsona, B.; Agouram, S.; Torrente-Murciano, L. The prevalence of surface oxygen vacancies over the mobility of bulk oxygen in nanostructured ceria for the total toluene oxidation. Appl. Catal. B Environ. 2015, 174, 403–412. [Google Scholar] [CrossRef]
- Li, S.; Zhu, H.; Qin, Z.; Wang, G.; Zhang, Y.; Wu, Z.; Li, Z.; Chen, G.; Dong, W.; Wu, Z.; et al. Morphologic effects of nano CeO2–TiO2 on the performance of Au/CeO2–TiO2 catalysts in low-temperature CO oxidation. Appl. Catal. B Environ. 2014, 144, 498–506. [Google Scholar] [CrossRef]
- Huang, H.; Dai, Q.; Wang, X. Morphology effect of Ru/CeO2 catalysts for the catalytic combustion of chlorobenzene. Appl. Catal. B Environ. 2014, 158, 96–105. [Google Scholar] [CrossRef]
- Nie, L.; Mei, D.; Xiong, H.; Peng, B.; Ren, Z.; Hernandez, X.I.; Delariva, A.; Wang, M.; Engelhard, M.H.; Kovarik, L.; et al. Activation of surface lattice oxygen in single-atom Pt/CeO2 for low-temperature CO oxidation. Science 2017, 358, 1419–1423. [Google Scholar] [CrossRef] [PubMed]
- Wang, Z.; Wang, W.; Zhang, L.; Jiang, D. Surface oxygen vacancies on Co3O4 mediated catalytic formaldehyde oxidation at room temperature. Catal. Sci. Technol. 2016, 6, 3845–3853. [Google Scholar] [CrossRef]
- Wang, B.; Chi, C.; Xu, M.; Wang, C.; Meng, D. Plasma-catalytic removal of toluene over CeO2-MnOx catalysts in an atmosphere dielectric barrier discharge. Chem. Eng. J. 2017, 322, 679–692. [Google Scholar] [CrossRef]
- Zhou, G.; Lan, H.; Gao, T.; Xie, H. Influence of Ce/Cu ratio on the performance of ordered mesoporous CeCu composite oxide catalysts. Chem. Eng. J. 2014, 246, 53–63. [Google Scholar] [CrossRef]
- Chang, S.; Li, M.; Hua, Q.; Zhang, L.; Ma, Y.; Ye, B.; Huang, X. Shape-dependent interplay between oxygen vacancies and Ag–CeO2 interaction in Ag/CeO2 catalysts and their influence on the catalytic activity. J. Catal. 2012, 293, 195–204. [Google Scholar] [CrossRef]
- Wu, Z.; Li, M.; Howe, J.; Meyer, H.M., III; Overbury, S.H. Probing Defect Sites on CeO2 Nanocrystals with Well-Defined Surface Planes by Raman Spectroscopy and O2 Adsorption. Langmuir 2010, 26, 16595–16606. [Google Scholar] [CrossRef] [PubMed]
- Tu, X.; Gallon, H.J.; Whitehead, J.C. Plasma-assisted reduction of a NiO/Al2O3 catalyst in atmospheric pressure H2/Ar dielectric barrier discharge. Catal. Today 2013, 211, 120–125. [Google Scholar] [CrossRef]
- Wang, F.; Li, C.; Zhang, X.; Wei, M.; Evans, D.G.; Duan, X. Catalytic behavior of supported Ru nanoparticles on the {1 0 0}, {1 1 0}, and {1 1 1} facet of CeO2. J. Catal. 2015, 329, 177–186. [Google Scholar] [CrossRef]
- Alayoglu, S.; An, K.; Melaet, G.; Chen, S.; Bernardi, F.; Wang, L.W.; Lindeman, A.E.; Musselwhite, N.; Guo, J.; Liu, Z.; et al. Pt-Mediated Reversible Reduction and Expansion of CeO2 in Pt Nanoparticle/Mesoporous CeO2 Catalyst: In Situ X-ray Spectroscopy and Diffraction Studies under Redox (H2 and O2) Atmospheres. J. Phys. Chem. 2013, 117, 26608–26616. [Google Scholar] [CrossRef]


© 2018 by the authors. Licensee MDPI, Basel, Switzerland. This article is an open access article distributed under the terms and conditions of the Creative Commons Attribution (CC BY) license (http://creativecommons.org/licenses/by/4.0/).