1. Introduction
The steel industry is one of the mayor contributors to CO
2 emissions and, in consequence, to greenhouse gas effect. The World Steel Association published that in 2015, on average, 1.8 tons of CO
2 were emitted for every tone of steel produced, which corresponds to approximately 9% of the world’s CO
2 emissions [
1,
2]. Reducing coke and carbon consumption is the main way to minimize CO
2 emissions from steelmaking, and one alternative to such fossil feedstock is biomass-derived charcoal. Charcoal has some advantages over the traditional carbonaceous raw materials, such as higher porosity and reactivity, and less ashes, sulfur and phosphorus in its composition [
3,
4,
5], but amongst all, the neutral CO
2 balance (“closed carbon loop”) is its most regarded characteristic.
Charcoal, alongside bio-oil and gases, is the product of biomass pyrolysis reaction, which consists of the thermal breakdown of organic matter under the action of heat and in the absence of an oxidizing medium. The amount and quality of the three different fractions obtained during the pyrolysis of biomass depends on the raw materials [
6,
7,
8] as well as the pyrolysis operating parameters, such as presence of catalyst [
9,
10], heating rate [
11], peak temperature [
12,
13,
14], residence time [
13,
15,
16], pressure [
17,
18,
19], and so forth [
20,
21]. Nonetheless, the production of charcoal through pyrolysis technology is not very widespread due to economic constraints, and is only substantially utilized in countries which combine a reliable biomass supply and a steelmaking industrial fabric, such as Brazil [
22].
Aiming to make the process of obtaining charcoal from biomass more sustainable and profitable, an essential aspect to investigate is the use of the derivate co-products, gas and liquids [
23,
24,
25]. If charcoal production is carried out at very high temperatures (700–1000 °C) and slow heating rates (carbonization), the process yields more gas than liquid fraction, and the properties of the gas are more promising than those of the liquid fraction, which is mainly composed of tars and water [
26]. Therefore, the objective of optimization of charcoal production must focus on maximizing the production of gas together with the reduction of the generated tars and water, in order to obtain a large quantity of clean gas with high added value, as it happens in gasification.
Many studies [
27,
28,
29] indicate that achieving complete removal of the tars only by heat treatment is very difficult; however, elimination of tars in biomass gasification processes through the use of catalysts at high temperatures is a widespread accepted technique. Therefore, the alternative that is intended to investigate in this paper is the combination of thermal and catalytic treatment, called catalytic cracking. As thermal cracking, catalytic cracking requires high temperatures; however, catalytic cracking is performed by an ionic mechanism (heterolytic breakdown), which allows to work at a lower temperature than conventional thermal cracking would require.
Nickel-based catalysts are the most frequently used catalysts in the majority of the applications concerning biomass thermo-chemical processing [
17,
30,
31,
32]. There are many bibliographic references which demonstrate that Ni-catalysts promote tar cracking [
33,
34,
35,
36], improve the hydrogen gas yield [
17,
37] and present deoxygenation activity [
38]. Consequently, this kind of catalyst has been used to enhance the properties of bio-oil [
39], to eliminate pyrolysis tars [
40] and in the reforming of pyrolysis vapors by using steam [
41]. Previous experiments performed by the authors also showed the efficiency of Ni-catalysts to reduce tars and improve gas properties in batch carbonization [
42]. Concerning supports, alumina is one of the most widespread supporting carrier of active metals [
43] and it has been found that Ni/Al
2O
3 has greater activities than Ni over other supports [
44,
45,
46].
In the present paper, carbonization of forestry wood waste has been carried out in a continuous auger reactor, and the influence of different nickel containing commercial catalysts (placed on a secondary tubular reactor to treat vapors) on the yield and the quality of liquid and gas products has been studied. As far as the authors are concerned, there is no publication dedicated to the optimization of the vapors generated in the processes of carbonization of residual biomass. Therefore, the goal of this work is to use catalysts to promote the yield and quality of carbonization gases by means of increasing the content of hydrogen, CO and methane, while reducing the share of pyrolysis liquids.
2. Results and Discussion
2.1. Catalyst Characterization
The catalyst used in the present work and all the relative information about the preparation of the experiments are described in
Section 3.2. The textural characterization and metal content of all the fresh catalysts are presented in
Table 1.
It can be observed that the pre-reduced 44Ni catalyst had clearly the highest surface area (99.3 m2 g−1), followed by the 16NiO catalyst (29.0 m2 g−1), while the 18NiO catalyst had a significantly lower surface area (11.5 m2 g−1). Concerning pore volume, 44Ni, 16NiO and 18NiO catalysts showed a tendency similar to that observed in the BET surface values, whilst the opposite tendency was regarding average pore diameter. The 18NiO catalyst presented low pore volume with big size pores, while the 44Ni had higher quantity of pores and of smaller size (at average). In addition to nickel, the 18NiO catalyst presents a small amount of potassium oxide (1.8 wt. % K2O) and both 18NiO and 16NiO present very small quantities of SiO2 and SO3, whereas 44Ni has a significant amount of SiO2 (4.7 wt. %) and a small amount of Cr2O3 (1.7 wt. %). All the catalysts used in the experiments are supported over alumina modified with calcium oxide.
As a general rule, the greater the surface area the higher the catalyst activity might be expected. However, since large molecules are normally generated from pyrolysis primary reactions, the blockage of small pores could take place, having a negative effect in the activity. However, the catalyst used in this work, though they present different average pore diameter, the difference does not seem big enough to be considered a very influential parameter. On the other hand, considering that the surface area of the 16NiO catalyst is almost three times the area of the 18NiO catalyst, a conclusion that can be reached is the lower dispersion of the metal particles on the surface of the 18NiO catalyst, which will arguably affect the performance of the catalyst. The 44Ni catalyst presents a much higher nickel metal particles load, nevertheless its very high surface area ensures a higher particle dispersion over the surface of the support.
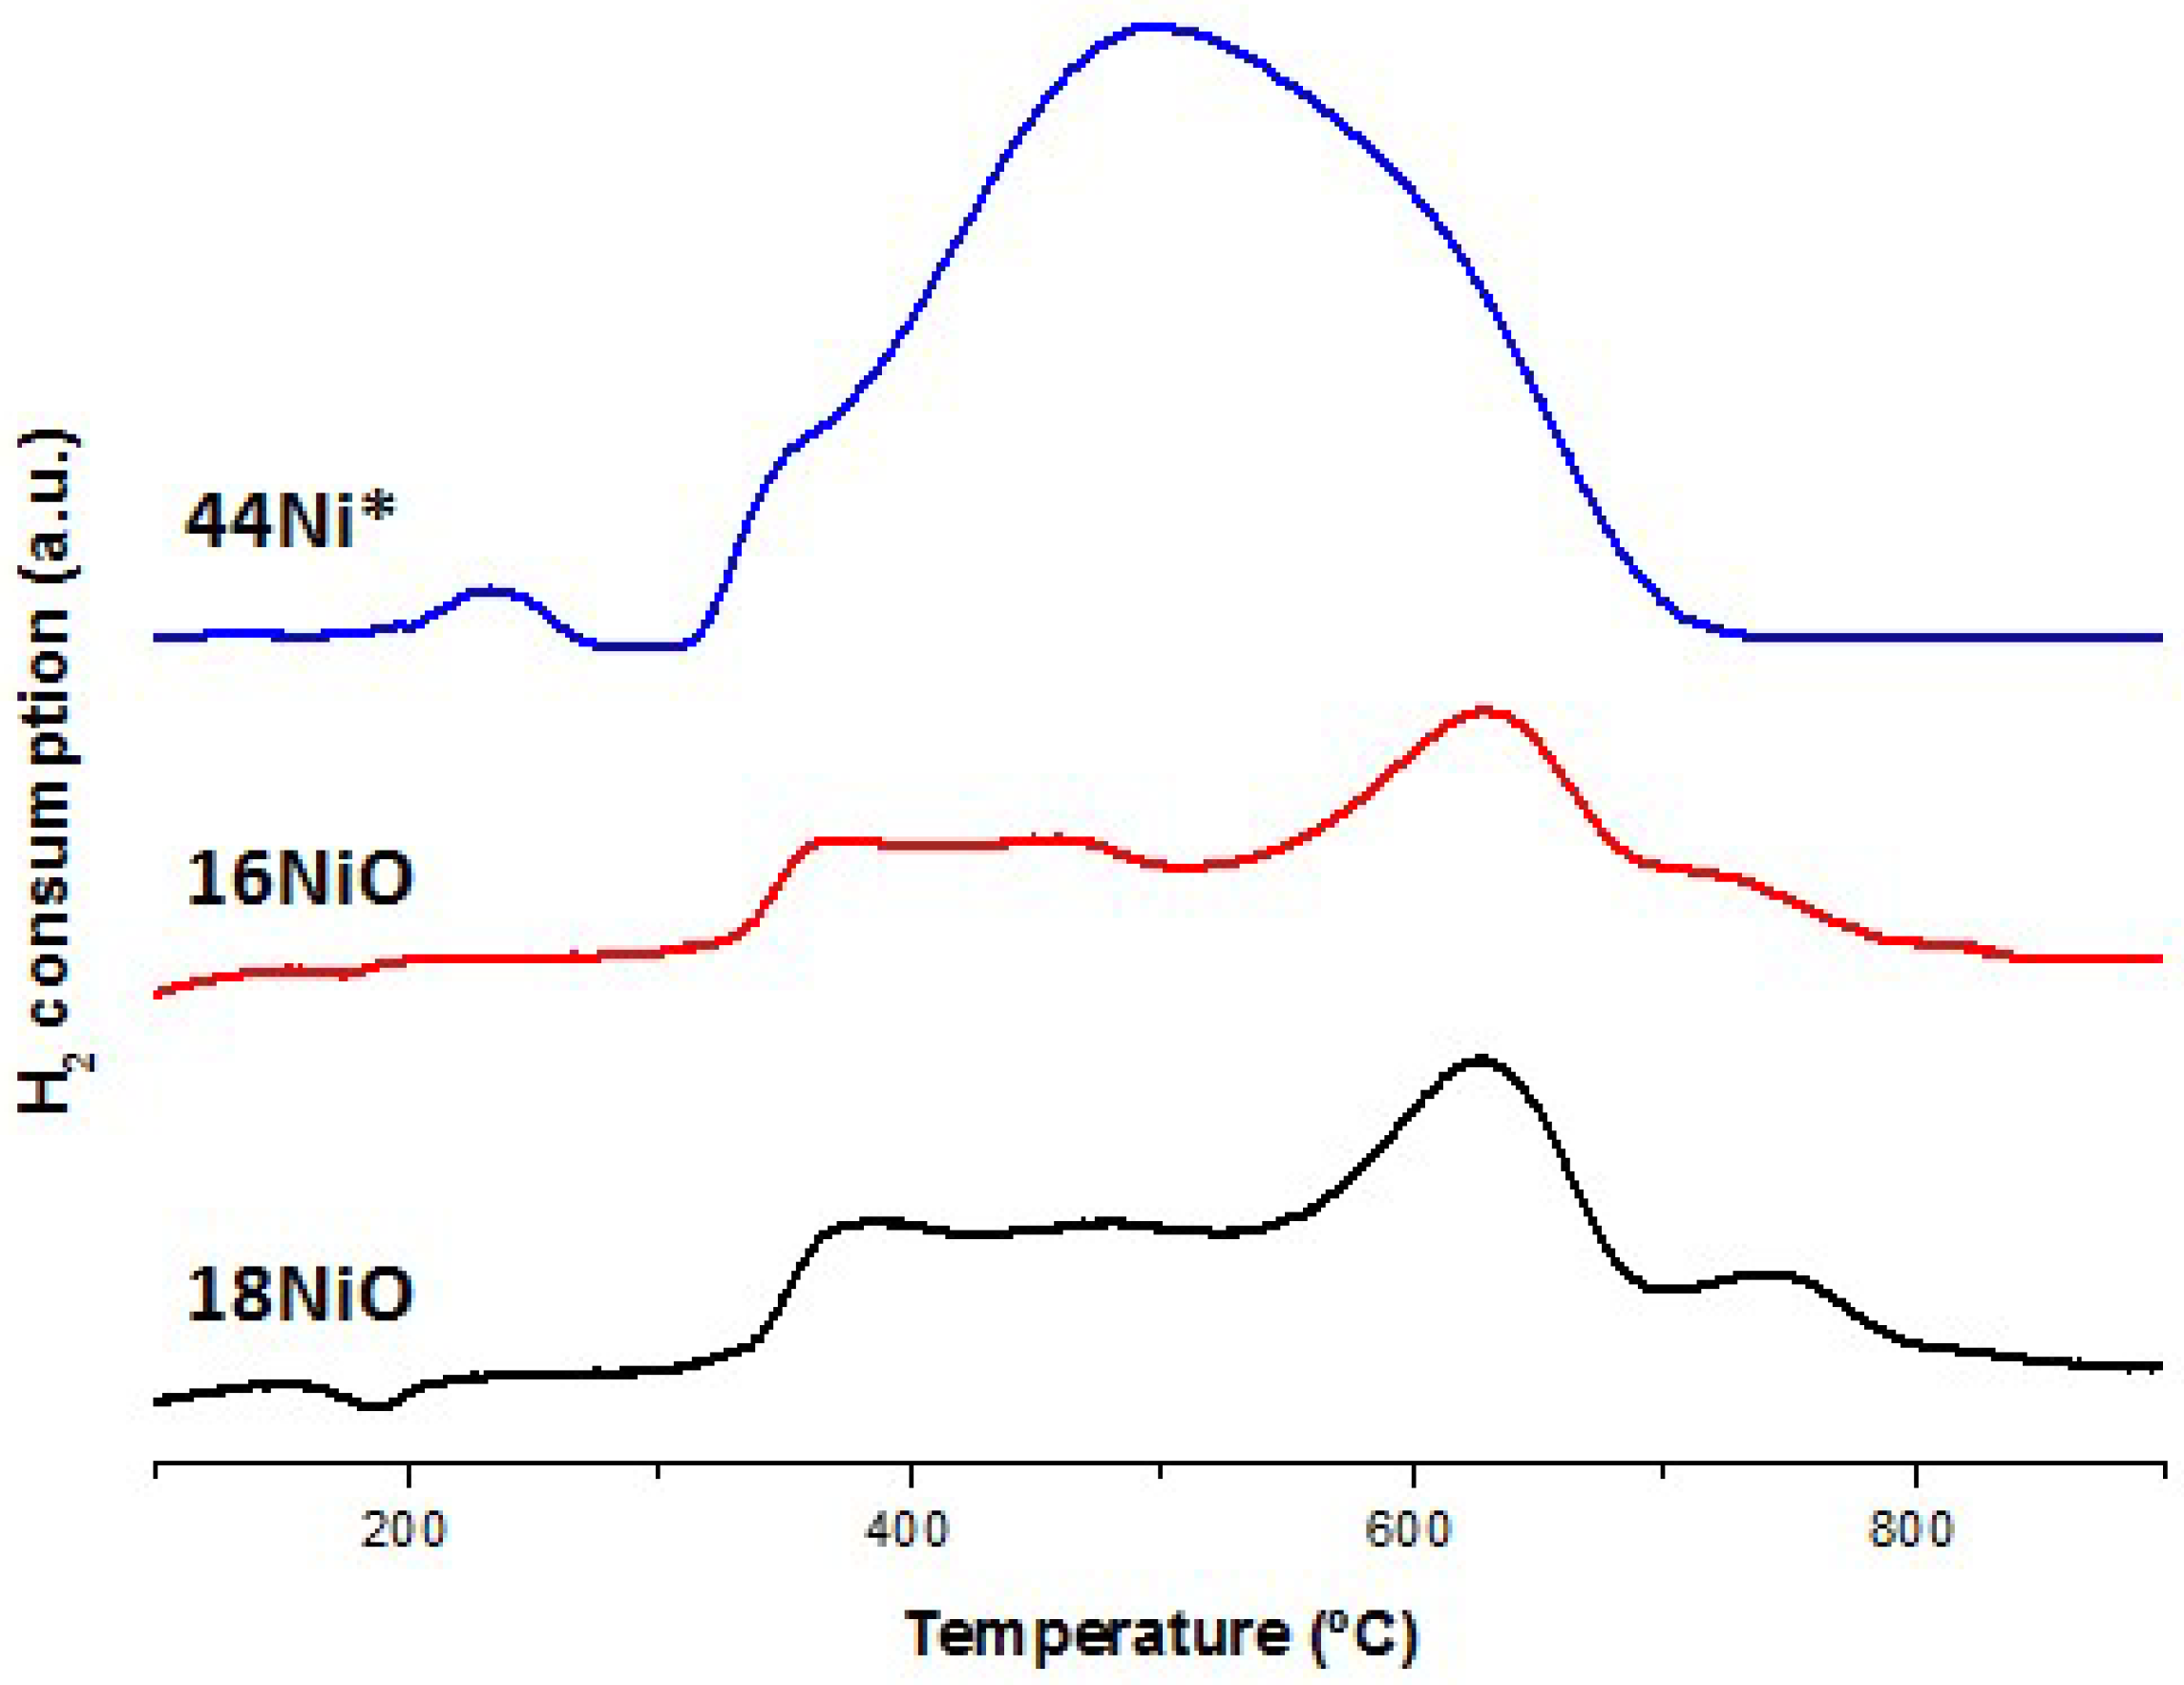
In order to analyze the reduction properties of the catalysts, temperature programmed reduction (TPR) measurements were carried out. The obtained profiles of 16NiO, 18NiO and the 44Ni (in its non-pre-reduced state called 44Ni*) are shown in
Figure 1.
Due to their similar composition (
Table 1), 16NiO and 18NiO present the same reduction peaks at the same temperatures. When comparing them a lower intensity reduction peaks can be observed in the 16NiO catalyst, especially in the three mayor peaks at 360–370 °C, 500 °C and 620–630 °C. Reduction peaks at higher temperatures usually indicate a stronger interaction between the metal particles and the support [
47]. The fact that the peaks in the 16NiO catalyst are smaller to those of 18NiO means that both catalyst have nickel metal particles interacting with strong bonds and weaker bonds with the support, mainly the first type, according the intensity of the peak, but the number of particles in the former catalyst is lower (as expected from the composition). The peak at 360–370 °C corresponds to bulk nickel while the peak at 500 °C corresponds to the weak bond interaction nickel.
According to Zhang et al. [
48] up to around 30 wt. % nickel addition, the metal particles take up closest position to the support establishing strong interactions, while from that amount the particles accumulate on the surface without forming strong bonds. That is the reason why the 44Ni* catalyst shows such a high peak at that temperature whereas in the case of 18NiO and 16NiO that peak is very small.
In all three cases, it can be seen that the reduction process is fully completed at 800 °C, which cannot be said for lower temperatures such as 700 °C. That is the reason why the temperature for the 16NiO and 18NiO catalysts activation process in the tubular reactor was established at 800 °C.
2.2. Effect of the Different Catalysts on Pyrolysis Vapors
2.2.1. Pyrolysis Yield
The pyrolysis solid and liquid yields obtained were determined by comparing the initial sample weight with the weight of the charcoal produced and the bio-oil trapped in the tared thimbles in every experiment. The pyrolysis gas yield was calculated by difference to one hundred.
Table 2 shows the effect of the utilization of each catalyst on the yield of liquids and gases on the secondary vapor treatment step. As it can be seen, the solid yield is not affected by the type of catalyst because, as is stated in
Section 3, the catalysts are placed in the secondary reactor, hence they do not interact with the solid at all. However, both liquid and gas yields are very dependent on the catalyst used.
Considering that the goal in this paper is the reduction of the liquid yield share in favor of gases, all the catalyst present positive effects. Compared to the non-catalyst experiment, 18NiO reduced the liquid yield from 30.5 wt. % to 22.2 wt. % (which means a 27% reduction), 16NiO reduced them to 19.1 wt. % (37% reduction) and 44Ni achieved a drastic reduction to 14.2 wt. % (53% reduction), while using the activated charcoal instead of the catalyst also reduced liquid to 19.6 wt. %. Logically, the gas yield increases just as much as the liquid yield is reduced.
In addition to other previously mentioned effects, the use of nickel containing catalysts with bio-oil reforming purposes has been extensively described in the literature [
9,
42,
46], hence the promotion of gas yield over liquid yield is an expected consequence of the addition of such catalyst. Pyrolysis charcoal, biochar or, as it is the current case, activated charcoal have also been proved as effective catalyst in tar model compound (such as toluene) removal from a vapor stream in the form of lighter molecules [
49].
The differences between the results obtained for 16NiO and 18NiO experiments can be regarded as a consequence of their textural properties, despite their nickel content is similar, 16NiO catalyst´s surface area is almost three times larger than the latter and the total pore volume is twice as big. A higher surface promotes the kinetic of the transfer of molecules from the gas phase to the catalyst surface; it may also positively affects the dispersion of the active centers in the catalyst, which eases the interaction between the reagents and the catalyst. In any case, the effect of the nickel content is far more remarkable when these two catalysts are compared with the 44Ni catalyst.
Therefore, it can be concluded that as regards product yield, even if all the catalysts present positive results, 16NiO and activated charcoal present similar effects, 18NiO is the least influential and 44Ni is the most interesting one.
2.2.2. Pyrolysis Liquids
The composition of the pyrolysis liquids after the thermo-catalytic treatment of the vapors is shown in
Table 3. Only those compounds with a percentage area greater than 3% have been included in
Table 3; those that did not fit this parameter are quantified as minor compounds. Under the name “Not identified” are included the compounds with a match quality lower than 85%, provided by the Mass Spectrometry Detector (MS) search engine.
As can be observed, the liquids are composed of water (7–19% area) and several aromatic compounds (67–78% area) along with a small proportion of minor compounds and non-identified compounds. The organic products that can be seen in
Table 3 are the remnant compounds that have not been transformed into lighter products (gases) due to cracking reactions in neither of both reactors. According to Aigner et al. [
50], these compounds can be classified depending on the amount of aromatic rings: phenolic compounds and butylated hydroxytoluene are called heterocyclic aromatics and possess just one ring (though the latter is heavier than most aromatic compounds in the table); indene, naphthalenic compounds and biphenylene have two; fluorene and anthracene three rings and pyrene four. Two and three ring aromatics are considered light PAH (polycyclic aromatic hydrocarbons) compounds while larger than three ring compounds are called heavy PAH compounds.
The effect produced in the composition of liquids by the addition of catalyst is not very important for all catalysts except for the 44Ni. In general, the use of catalyst reduces the share of water in the mixture; in the case of 44Ni that reduction goes from 19.2% area to 14.6% area while the rest of the catalysts reduce the water content below 10% area. Water is an important reagent in reforming reactions, hence the consumption of water is expected in the process. A low water content in the liquids is not necessarily interesting since that would mean that the organic matter remains in liquid state instead of participating of the gases. In conclusion, at first sight, 18NiO would cause the less interesting effect in composition and 44Ni would be the catalyst with the best results.
Regarding the organic aromatic molecules, activated charcoal performs similar liquids to the no catalyst experiment, achieving a few more monocyclic aromatic compounds. Similar behavior can be attributed to 16NiO, though in this case two and three ringed compounds are reduced in favor of a bigger variety of minor compounds. 18NiO, on the other hand, presents the lowest water content (7.3% area) and the biggest monocyclic aromatic content (39.4% area). Finally, 44Ni test produces a high amount of single ringed aromatics (37.3% area), especially the heavy butylated hydroxytoluene (7.7% area), and three ringed molecules (13.2% area) at the same time, while also being the only experiment achieving a four-ringed compound in very low quantities (3.0% area). Being the production of hydrogen the main goal in catalytic reforming, the removal of the hydrogen (dehydrogenation) from the organic molecules of the vapors generally causes the aromatization of the hydrocarbons and the condensation of aromatic molecules into complex polyaromatic compounds that are very stable. In order to crack and degrade these molecules more severe reaction conditions would be needed. Attending to the product yields and the composition of the liquids, it can be said that the 44Ni catalyst presents the highest activity between the studied catalysts. Anyway, the biomass derived liquids are mainly composed of several heavy and viscous mono and polycyclic aromatic organic compounds (tars) in addition to liquid water, which makes them a “difficult to handle” poor fuels and chemical source byproduct.
2.2.3. Pyrolysis Gas
Table 4 shows the composition and Higher Heating Value (HHV) of the pyrolysis gases obtained in the catalytic experiments. Since the gas chromatograph analyzed the composition of the gases continuously, the presented results consist of the mean values obtained during the experiment. H
2, CO and CO
2 are the main components in all cases, but there is also methane and very low quantities of ethylene and ethane in the mixture.
As it can be seen from
Table 4, depending on the catalyst used the composition of gases changes to a greater or lesser extent. 18NiO and activated charcoal present similar results, compared to the no catalyst test, they both severely increase CO
2 content while reducing CO, methane and ethylene. The 16NiO test shows the same trends, but the intensity of the changes is lower and it can even be said that it is the catalyst that least affects the composition of gases. Compared to the no catalyst test, the 44Ni catalyst reduces methane to a great extent (13 vol. %) and practically reduces ethane and ethylene to zero. It also reduces CO
2 (4 vol. %), increases CO (4 vol. %) and, more importantly, drastically enhances hydrogen content in a 17 vol. % increase, yielding more than 50 vol. % hydrogen.
As it has been explained, in addition to CO and (to a lesser extent) CO2, hydrogen is the main product and goal of reforming reactions. Hydrogen is a high added value gas in industry as well as a clean fuel that has been claimed to be the energy vector of the future, hence, in that regard, the 44Ni experiment obtains the best results. The rest of the catalyst show very poor results due to the high share of CO2 they produce, which could indicate the promotion of cracking reactions of the oxygenated organic compounds in the vapors, especially when considering the reduction of liquid yield that they achieve.
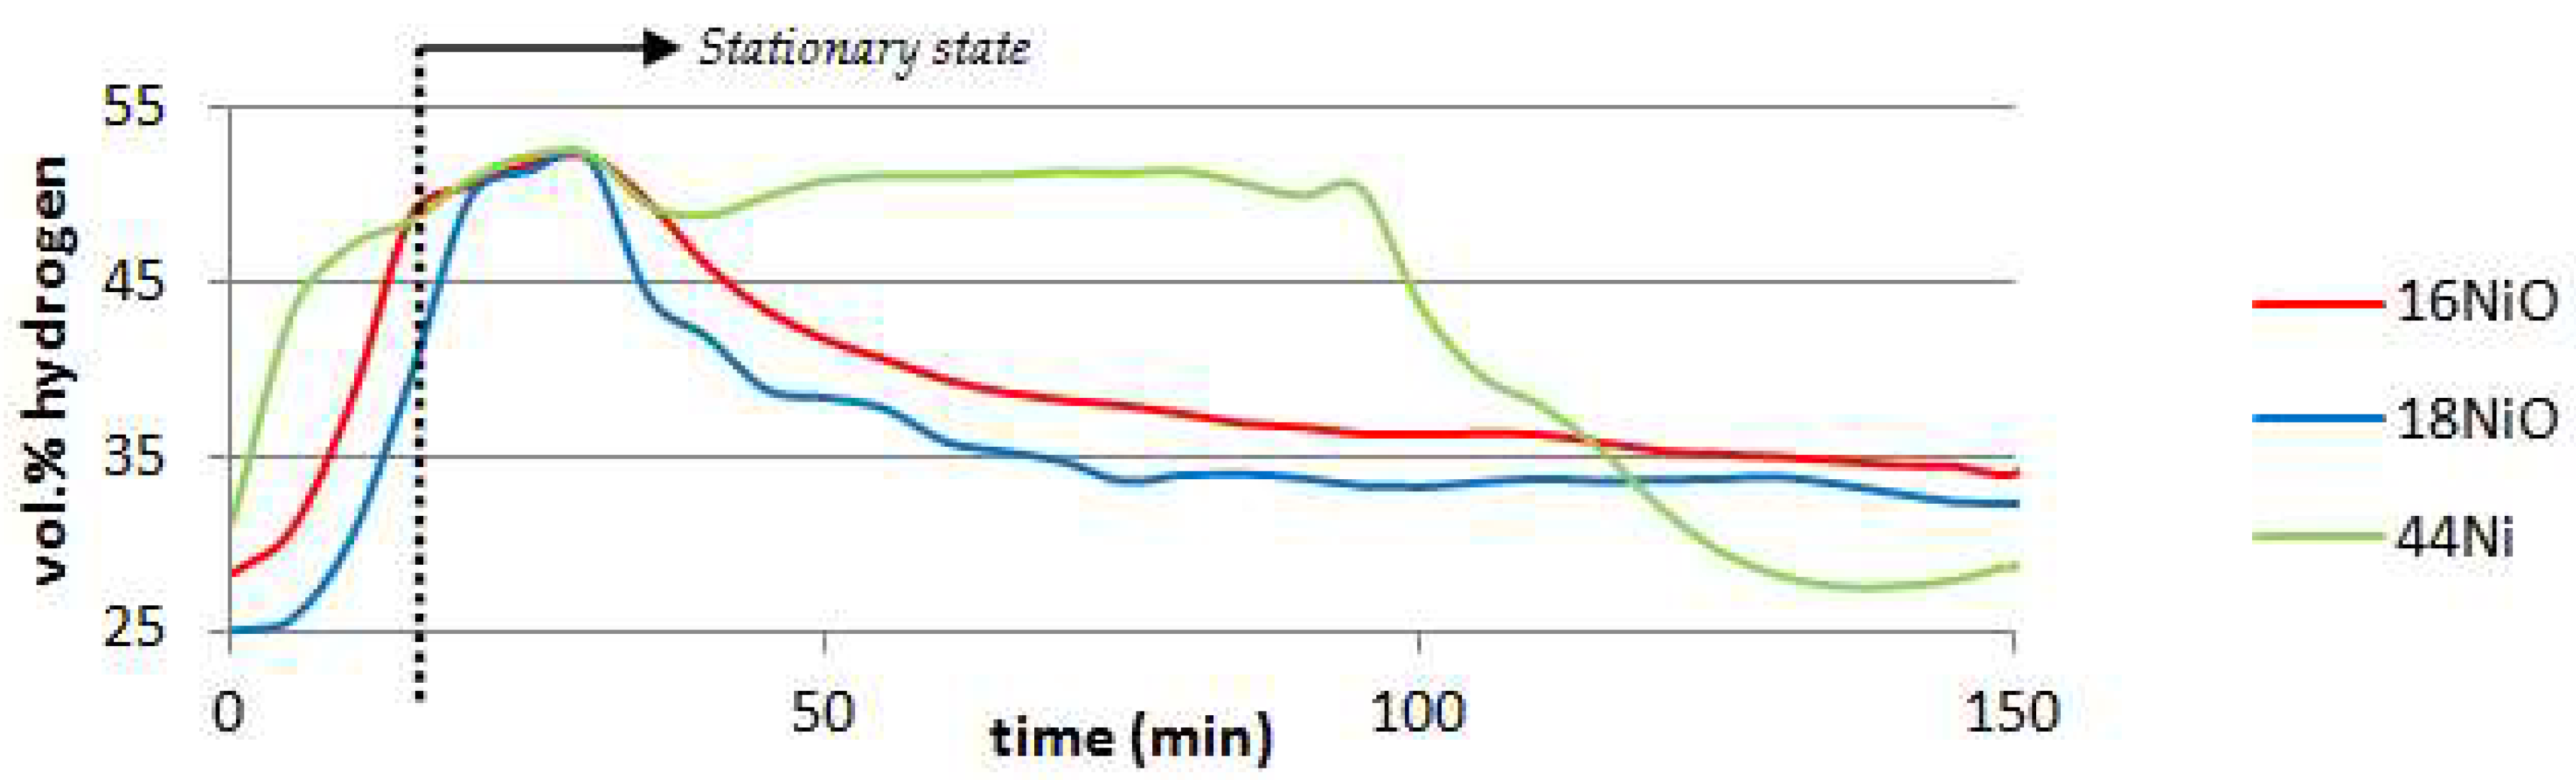
The main reason why the reforming effect is negligible in the 16NiO and 18NiO experiments is the quick deactivation of the metal particles [
51].
Figure 2. shows how the content of hydrogen changes with time despite the stationary state of the operation, which highlights the loss of selectivity of the catalyst, hence its deactivation. Both NiO catalyst´s activity start declining almost as soon as the stationary state begins, which is understandable since these catalysts presented a very low BET surface as well as pore volume compared to 44Ni after all. The deactivation is mainly caused by the deposition of coke over the metal catalyst or blocking the entrance of the pores [
52]; in fact, after some thermogravimetric analysis it is observed that there is indeed between a 5–10 wt. % coke deposition on the surface of the catalyst. These results were somewhat predictable because 16NiO and 18NiO are catalyst designed to treat light hydrocarbon mixtures and not heavy tarry organic vapors; for that purpose a higher load of nickel in the catalyst is required [
42]. In the case of activated charcoal, its main effect is similar to that of NiO catalysts, which is tar removal through cracking [
53].
Regarding the calorific value of gases, in all cases, the addition of catalyst clearly reduces the HHV of the pyrolysis gases. In terms of energy per unit of volume the 44Ni results are the lowest (11.22 MJ Nm
−3) followed by 18NiO and activated charcoal (13.23 and 14.00 MJ Nm
−3 respectively. These results can be explained due to two main reasons, first is the low density of the hydrogen molecule, and the second reason is the presence of CO
2, which does not contribute to the HHV but instead absorbs energy when heated. Either way, even in the case of no catalyst, the results are rather low compared to natural gas (approx. 37 MJ Nm
−3), and somewhat lower than town gas (approx. 18 MJ Nm
−3) [
54].
From all the data recorded in this section (
Section 2.2) and considering the objective of this paper, it can be clearly stated that 44Ni is the catalyst that produces the more positive effects.
2.3. Effect of the Temperature Profile on the Pyrolysis Process
2.3.1. Pyrolysis Yield
The results of the pyrolysis products yields are shown in
Table 5. As it can be seen, the results describe different pyrolysis temperature profiles followed by a vapor treatment that can be only thermal or thermo-catalytical in the presence of the 44Ni, which, as stated in
Section 2.2.3, has resulted to be the best performing catalyst.
By observing the results of the no catalyst experiments (i.e., the thermal study), it can be concluded that the increase in pyrolysis peak temperature has a big influence on the proportion of the products. As the pyrolysis temperature rises and the process of degradation of biomass intensifies the yield of solid decreases from the raw state (i.e., 100 wt. % solid fresh biomass) to 32.8 wt. % at 500 °C (almost 70% of conversion) and finally to 22.5 wt. % at 900 °C. The gas fraction behavior is the opposite to the one observed for solids; the yield at 500 °C is 26.4 wt. %, but increasing the temperature up to 900 °C more than doubles that yield. On the other hand, pyrolysis liquid yield declines from 40.8 wt. % at 500 °C down to 21 wt. % at 900 °C. The degradation of the solid biomass is caused by thermal cracking, which means that first the constituents of biomass (cellulose, hemicellulose and lignin) are broken into lighter molecules that primarily form the vapors; those vapors are at the same time further degraded by temperature, which produces the appearance of gases amongst them. At high temperatures, such as 700 and 900 °C, there is not much further vapor production; however, the existing vapors keep cracking, resulting in lighter molecules and therefore fewer liquids in the final products.
These results are in agreement with several publications [
14,
55,
56]. According to Pereira et al. [
57] tar production reaches its maximum at 500 °C due to cellulose, hemicellulose and lignin mayor degradation. Aysu et al. [
14] asserted that the reason of the reduction of liquid products into gaseous products at higher pyrolysis temperatures is thought to be the formation of secondary cracking reactions of the organic molecules that form the pyrolysis vapors. The same authors observed in a former publication that the reduction of solid yield in favor of gas yield at 900 °C can be explained by Boudouard (C + CO
2 = 2 CO) and water-gas reactions (H
2O + C = H
2 + CO), occurring in the pores and on the surface of the solid between the charcoal and the vapor phase [
13].
Compared to their thermal counterparts, most of the catalytic tests show several changes in the product yields, with the only exception being the 500 °C operation where the catalyst has no influence on the conversion of liquids into gases (at least from the product yield point of view). There is a little but persistent increase of solid yield in the case of catalytic experiments, and that increase is larger the higher the temperature. The reason why this phenomenon could be happening is the higher pressure in the reactor due to the higher vapors yield. A higher pressure causes a closer interaction between the flowing solid and the molecules on the vapors [
58,
59], and it has been stated that secondary reactions occurring or even catalyzed by the surface of the solid result in more solid.
As in the thermal study, in the catalyst experiments liquid yields are lower the higher the temperature is, while the gases show the opposite trend. At 700 °C there is a drastic decrease of liquid yield in favor of gases, liquids are reduced by more than a half (from 30.5 to 14.2 wt. %) when 44Ni catalyst is introduced, gases increase from 43.4 to 57.9 wt. %. Further decrease of liquids can be observed at 900 °C, where liquids decrease from 20.9 to 13.4 wt. % causing an increase on gases of 4.6%. Therefore, though the catalyst has still influence on the process, its effect is less intensive than at 700 °C, which is probably caused by the composition of the vapors themselves (at 900 °C the composition of liquids is very different from the liquids at 700 °C, as it will be shown in
Table 6). At high temperatures heavier and more stable molecules that are less susceptible of interacting with the metals in the catalyst surface (and thus react) are preferentially formed.
The results obtained in the experiment PR700 44Ni are more promising than those obtained at PR900 No Cat, at least in terms of liquid and gas yields. It could even be argued that they are also more promising than PR900 44Ni from the point of view of the optimization of the process, since working at lower temperatures in the presence of catalyst would mean significant energy saving and a more efficient overall process. Even if eventually PR900 44Ni are superior to the former, the little changes achieved in products yield may not excuse the higher temperatures.
2.3.2. Pyrolysis Liquids
The composition of the pyrolysis liquids at different temperature profiles with and without thermo-catalytic treatment of the vapors is shown in
Table 6. The details of how the table works have been thoughtfully explained in
Section 2.2.2.
Just as in the catalytic test in
Section 2.2.2, the liquids consist in water (11.8–33.2% area) and several aromatic compounds (53.8–78.4% area) along with a little proportion of minor compounds and non-identified compounds. The components present in liquids are a result of hydrolysis, dehydration, dehydrogenation, retro-condensation, isomerization and aromatization reactions of cellulose, hemicellulose, and lignin [
60]. Though at first sight the composition of the liquids may seem rather arbitrary, some clear tendencies can be established. Comparing the different temperature profiles, it can be seen that water content is somewhat stable regardless the final temperature (17.4–19.4% area). It can also be concluded that the higher the pyrolysis temperature the heavier (more aromatic rings) the organic compounds in the bio-oil. Similar conclusion can be found in experiments performed in a different auger reactor; Puy et al. [
61] stated that temperature is the most important operational parameter in regards of bio-oil yield and composition, increasing the temperature results in a higher amount of polycyclic compounds. High temperatures degrade unstable oxygenated molecules whereas it supports the formation of the stable molecules. This behavior could be due to cracking reactions [
62,
63] along with dehydrogenation/aromatization reactions that can eventually lead to larger and more stable polycyclic aromatic hydrocarbons [
64].
In the case of the thermo-catalytic tests, temperature also determines the composition of the organic compounds. The amount of monocyclic aromatic compounds is reduced by the increase of temperature (from 53.8% area in PR500 44Ni to 4.3% area in PR900 44Ni); which, at the same time, promotes the production of two and three ringed aromatic molecules (none at 500 °C to 44.4 & 27.1% area respectively at 900 °C). Water content is also reduced by the increase of temperature, especially from 500 °C (33.2% area) to 700 °C (14.6% area) and then it stabilizes. Finally, when comparing the no catalyst experiments with their 44Ni counterparts several differences can be found. In the case of PR500 the change of composition is very evident since the introduction of catalyst cause any aromatic compound but the monocyclic ones to disappear, the content of the latter more than doubles from 22.9 to 48.7% area. The organic composition of the PR700 and PR900 experiments remains somewhat stable, though at 700 °C less two ringed and more three ringed compounds are produced (heavier liquids) while at 900 °C it is the other way around; either way, these changes are not noteworthy. Finally, water content increases when catalyst is introduced at 500 °C, which may be caused by the consumption of the polycyclic aromatic organic compounds and deoxygenating reactions [
38] on the vapors at 500 °C; the catalyst reduces water content in the rest of the cases due to the consumption of water in steam reforming reactions at higher temperatures.
In conclusion, the biomass derived liquids obtained both in the catalytic tests of
Section 2.2 and in this section can be considered uninteresting byproducts. Its complexity makes them unworthy as a secondary chemicals source and the water content invalidates them as proper fuels unless further separation steps are implemented in the pyrolysis process.
2.3.3. Pyrolysis Gas
Table 7 shows the composition and HHV of the pyrolysis gases obtained in the thermo-catalytic experiments. H
2, CO and CO
2 are the main components in all cases, but there is also methane and very low quantities of ethylene and ethane in the mixture.
The thermal study shows that the hydrogen and CO content is favored considerably by the increase of temperature while the content of CO2 decreases, the rest of the compounds stay stable except for the methane, which reaches its maximum content at 700 °C and then decreases again at higher temperature. The biggest difference in composition can be observed between 500 °C and 700 °C; in the case of hydrogen its content in the pyrolysis gas increases from 20.1 vol. % to 33.8 vol. %, the content of CO also increases from 14.0 vol. % to 25.2 vol. %; in the case of CO2 the decrease goes from 48.5 vol. % to 18.3 vol. %. In all cases, between 700 °C and 900 °C the composition of gases remains somewhat stable.
Attending to the thermo-catalytic experiments, the conclusions are rather different. The hydrogen presents a maximum at PR700 44Ni (50.6 vol. %) to descend later to a 41.4 vol. % at 900 °C. The CO content decreases with temperature in a stable rate of approximately 3 vol. % per every 100 °C, on the contrary, methane share increases with the temperature, especially from 700 °C on. The CO
2 content remains stable between PR500 44Ni and PR700 44Ni (15 vol. %) but further increasing the temperature increases its content to 20.1 vol. %. The changes in ethane are almost negligible and the same can be said for ethylene except that there is a little increase at high temperature. As it was seen in
Section 2.3.1, this trend is caused by the composition of the vapors entering the secondary reactor. At 700 °C the vapors are not as heavy and cracked as at 900 °C, which means they are less stable and prompt to react, thereby producing lighter molecules, such as the ones present in the gases.
The influence of the introduction of the catalyst can be studied by comparing the thermo-catalytic experiments with their no catalyst counterparts. The biggest changes can be observed at 500 °C, where the catalyst achieves an increase of the hydrogen and CO content of 27.1 and 19.8 vol. % respectively. In opposition to that, CO2, methane and ethylene suffer a decrease of 33.2, 11.0 and 2.4% respectively. At 700 °C hydrogen and CO content increases again, in this case 16.8 and 4.6 vol. % respectively, while CO2 and methane decrease 3.7 and 13.1 vol. % each.
It is noteworthy that the addition of catalyst at 700 °C peak temperature operations practically eliminates ethane and ethylene from the gases, even if in the no catalyst experiments their share in the composition was very low. Nevertheless, the PR900 experiments show that at this temperature the catalyst is not very useful because it almost does not alter gas composition at all. In fact, the hydrogen content profiles over time during the stationary state for the PR900 No Cat. and 44Ni are almost identical, no sign of catalyst activity can be observed, not even a deactivation process. Thermogravimetric tests also show coke deposition over the surface of the catalyst in these experiments, however the coke in this case is not a hinder to the catalyst activity because, as it has been stated, no sign of initial activity can even be seen. This induces to think that there is almost no reforming influence of the catalyst at 900 °C. Regarding the calorific value of gases, in terms of energy per unit of volume, the introduction of 44Ni reduces the calorific value only at 700 °C (in about 5 MJ Nm
−3), since at 500 °C the changes are negligible. The explanation for these changes has been exposed on
Section 2.2.3. Of course, in the case of 900 °C, no changes are expected due to the similarities in gas composition.
As it was concluded in
Section 2.3.1, the results obtained for gas composition in the experiment PR700 44Ni are more promising than those obtained at PR900 no cat, which is clear because of the higher content of hydrogen and CO, regardless the low methane content. The optimization of the process working at lower temperatures in the presence of 44Ni catalyst would mean significant energy saving and a more efficient overall process.
2.3.4. Pyrolysis Solids
Table 8 shows the proximate and elemental analysis, the reactivity and the HHV of the charcoal obtained in the pyrolysis experiments. Since the composition of the solids is not supposed to be affected by the utilization of catalysts, the charcoals on the table are the ones obtained in the no-catalyst experiments.
Table 8 shows that increasing the temperature increases the fixed carbon and reduces the volatiles and moisture content. The charcoals obtained present varied fixed carbon content ranging from 68.1 wt. % at 500 °C to 90.6 wt. % at high temperature (900 °C). The content of volatiles goes from 24.8 wt. % in PR500 down to 10.5 wt. % in PR700 and 5.4 wt. % in PR900. Ash content is very low for all the charcoals and stable at around 3 wt. %. Moisture content is also rather low in all cases (<5 wt. %). Similar results have been reported by Agirre et al. [
20], who stated that charcoals suitable for metallurgical use should present volatile matter lower than 10 wt. %. Griessacher et al. [
65] also concluded that fixed carbon contents should be greater than 80–85 wt. %. At very high temperatures (900 °C) the pyrolysis process is near to complete and the solid product presents no big differences with the charcoal obtained at 700 °C in terms of fixed carbon (7 wt. %) and volatile content (5 wt. %).
Regarding the elemental composition, the pyrolysis solids consists mainly of carbon (>90 wt. %) with very low contents of hydrogen (<1.8 wt. %), oxygen (the majority content of the “others”) and virtually no nitrogen. The CO
2 reactivity results are similar to those obtained by Agirre et al. [
20]. The reactivity of the charcoal decreases along with the increase of its fixed carbon content and the loss of volatiles, which occurs at the highest temperatures. Overall, the charcoal obtained in the present study is a good fuel due to the higher heating value (HHV) that exceeds 32 MJ kg
−1 (at 700 and 900 °C), thus being even higher than that of conventional coals (15–27 MJ kg
−1) [
54].
3. Materials and Methods
3.1. Preparation of the Samples
The sample pyrolyzed was Pinus radiata (insignis pine) chips coming from forest thinning carried out in Biscay (43°06′ N, 2°45′ W), in the north of Spain. The harvested pine trunks were stripped from their bark and chipped down to an appropriate size to be used as fuel for boilers and separated into different fractions. The biomass waste used in the experiments consisted in a rejected fraction that was too small for boilers (<6 cm). To prepare the samples for the experiments, a portion of the rejected biomass was first taken by the quartering method in order to obtain homogenous and representative samples, spread out on a clean surface and dried under room conditions for several days until equilibrium moisture was reached. Before feeding it to the reactor, the biomass was sieved again in order to obtain a sample of homogenous size particles (0.5–2 mm, which represented around 50 wt. % of the dried biomass).
Table 9 shows the results from proximate and elemental analysis of the biomass sample, along with the higher heating value (HHV) and the constituents’ analysis. It can be seen that most of the sample consist on volatiles (70.7 wt. %), the moisture content is about 10.6 wt. % and the ash content is quite low (0.6 wt. %). Regarding the elemental composition, carbon (47.6 wt. % daf), hydrogen (7.6 wt. % daf) and oxygen (most of the “others” fraction [
61,
64]) are the main elements. It has been reported that the main constituents of woody biomass are cellulose (mainly glucanes), hemicellulose (xylanes and arabinanes), lignin and the extractives, which consist in primary metabolites (sugar, fats, amino acids and carboxylic acids) and more complex secondary metabolites [
66]. These molecules are primarily constituted by hydrogen, carbon and oxygen, just as it can be seen in the elemental analysis of
Table 9. The composition of the sample presented in this paper is in agreement with this statement and is quite similar to that reported by other authors for pine [
64,
67]. The higher heating value (HHV) of the sample is relatively low, as is usual in fresh biomass due to its high oxygen and moisture content.
3.2. Pyrolysis Experiments
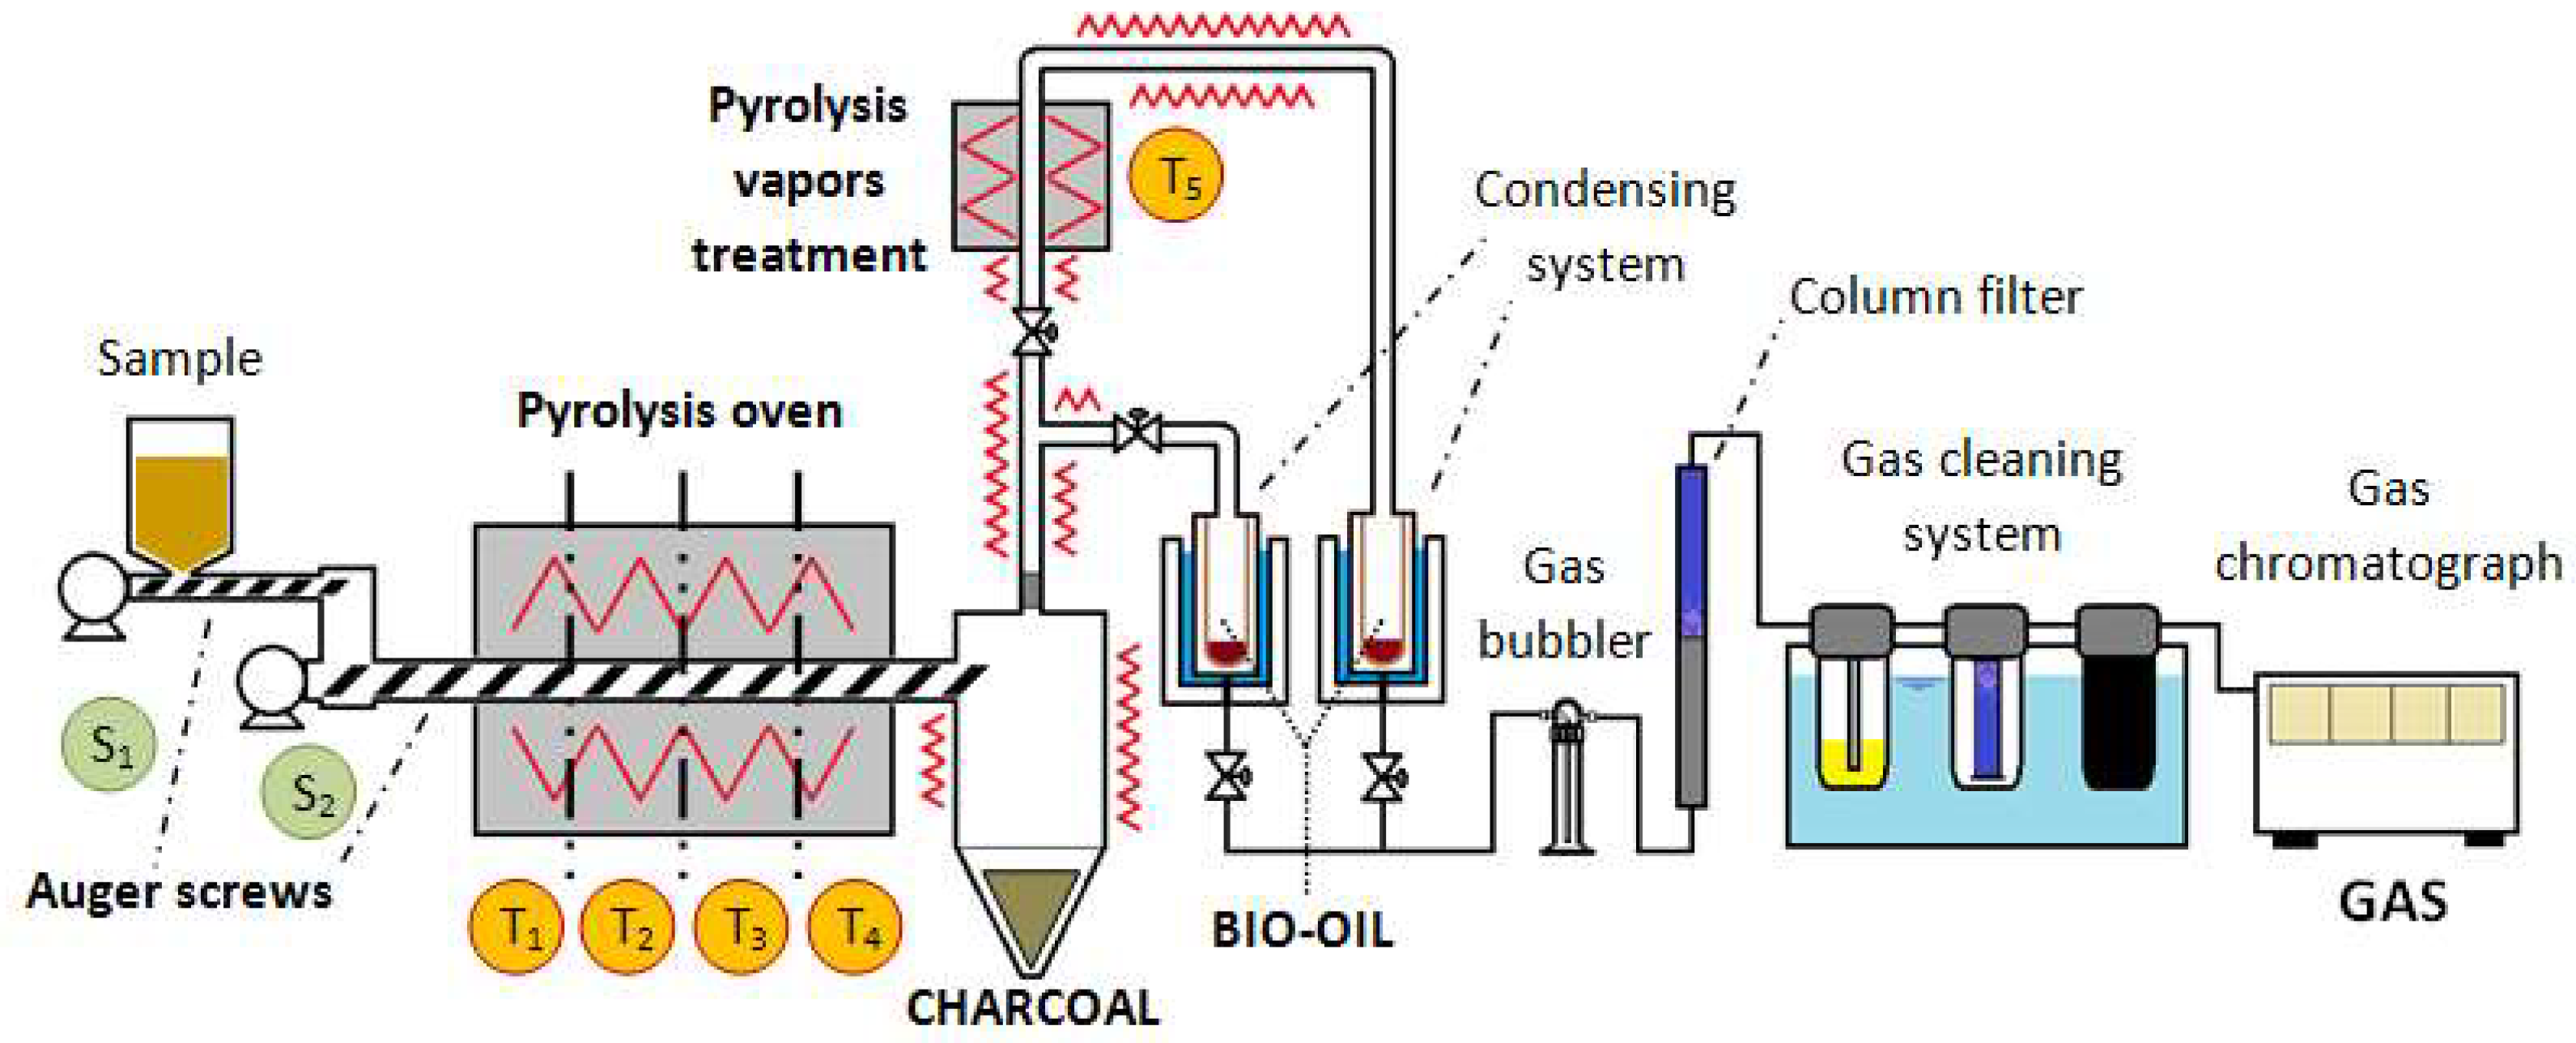
The pyrolysis experiments were carried out with a practical approach, using a laboratory scale continuous pyrolysis plant located in the laboratories of the University of the Basque Country (UPV/EHU). The pyrolysis plant consists of two reactors connected in series: a continuous auger reactor and a tubular reactor for vapors treatment. The schematic drawing of the experimental unit with its main components is shown in
Figure 3. A detailed description of the reactors used for this study is shown in a previous work published by the authors [
13].
All the experiments were performed with a feeding rate of biomass of 90 g min
−1 and they can be separated in two series: (1) Experiments dedicated to the study of the influence of the catalyst and selection of the one that performs better attending to the gas yield and composition. These experiments were all carried out using the same temperature profile (T
1–T
2–T
3–T
4–T
5), which was 300–500–700–700 °C for a fixed residence time of 30 min inside the pyrolysis reactor and a thermal vapor treatment (T
5) of 800 °C. In order to study the influence of the catalyst, three different commercial Ni-catalysts were selected. They are nickel oxide catalysts (NiO 16 wt. %, NiO 18 wt. %) and a pre-reduced nickel catalyst (Ni 44 wt. %), the three of them on a calcium aluminate support (CaO/Al
2O
3). These catalysts are usually utilized in industry for steam reforming of natural gas, other light hydrocarbons and hydrogen rich streams. Additionally, commercial activated charcoal (PANREAC No. 1 QP 211238) was also used, with the aim of studying the potential use of pyrolysis charcoal both as a cheap catalyst and catalyst support for the reduction of product tars [
49,
68,
69]. The catalysts are referred through the text as follows: C. Act., 16NiO, 18NiO & 44Ni, and No Cat. for the blank case with no catalyst.
(2) Experiments dedicated to the evaluation of the best performing catalyst in different operating conditions. In these series, three different temperature profiles in the pyrolysis reactor (T1–T2–T3–T4) were studied: 300–500–500–500 °C, 300–500–700–700 °C & 300–500–700–900 °C, for a fixed residence time of 30 min inside the pyrolysis reactor and a thermal vapors treatment (T5) of 80 0 °C in the presence of the catalyst that offered the best results in the first catalytic study.
3.3. Catalyst Arrangement and Pre-Treatment
The catalysts selected for the pyrolysis experiments were placed in the secondary reactor located after the pyrolysis reactor and used in vapor phase contact. Therefore, they interacted only with the pyrolysis gases and vapors and did not participate in the pyrolysis process itself. Catalyst particle size was set between 0.5 and 0.425 mm. In order to get such particle size, commercial catalyst pellets were crushed with the help of an ATLAS 15T Manual Hydraulic Press and a mortar.
Once enough catalyst had been prepared, the catalytic reactor was filled attending to the following steps. First, a 1 mm mesh size wire net supporting some glass wool was used as a base. Then, a column of 10 mm of silicon carbide was placed, followed by a mixture of 3.2 g of silicon carbide and 2.5 g of the catalyst (to avoid potential heat sinks). Finally, another 5 mm of silicon carbide were added to prevent the catalyst to be swept along by the vapor current. In the activated charcoal experiment, 4.2 g of this material were placed on top of the wire net and glass wool.
The oxidized catalysts (i.e., 16NiO and 18NiO) had to be reduced first to perform in order to be active. For this purpose, the catalysts in the tubular reactor were heated with a heating rate of 10 °C min−1 up to 800 °C and then kept at this temperature for an hour before the stationary phase of the process started. During this process an activating gas stream composed of 5 vol. % H2 and rest argon was passed through the reactor from top to bottom. These temperature and time were selected based on the temperature programmed reduction (TPR) test of the catalysts.
3.4. Analytical Techniques
Pyrolysis solid, liquids and gases were characterized. Pyrolysis solid and the initial biomass sample characterization was performed by proximate analysis determined by thermogravimetric analysis (LECO TGA-500, St. Joseph, MI, USA) following the D3173-85 and D3174-82 ASTM standards, elemental composition (LECO TruSpec CHNS, St. Joseph, MI, USA) and higher heating value (LECO AC-500 automatic calorimetric bomb). The chemical analyses of the pine waste chips were carried out according to the standards described in a previous paper by the authors [
13]. The liquids samples were first prepared by Soxhlet extraction of the condensates from the retention thimbles with tetrahydrofuran and then the analysis was performed by gas chromatography coupled to mass detector (GC/MS, Agilent 6890 and Agilent, 5973N, Santa Clara, CA, USA). Chromatography of the pyrolysis gases was carried out with an AGILENT 490 Micro GC online gas chromatograph equipped with two independent 10 m column modules: MS5A (Molsieve) and PPU. The calibration pattern used for gas chromatography consisted of a mixture of 44 vol. % H
2, 25 vol. % CO, 15 vol. % CO
2, 10 vol. % CH
4, 2 vol. % C
2H
4, 1 vol. % C
2H
6 and the rest N
2. The higher heating value of the gases was calculated based on the composition and HHV of the individual components of the gases.
Reactivity of charcoal was determined by thermogravimetric analysis (Mettler Toledo TGA/SDTA851
e analyzer). The reactivity predicts how a metallurgical reducer would behave in CO
2 atmosphere and how much carbon would be consumed by the Boudouard reaction. The tests were performed as described in a previous paper by the authors [
13]. In addition to reactivity tests, the thermogravimetric analyzer was also used for coke deposition measurements. For this purpose, 10 mg of used catalyst were first heated at a 20 °C min
−1 rate up to 105 °C and kept at this temperature for 15 min under a N
2 atmosphere (100 mL min
−1 flow), then the atmosphere was changed to O
2 (20 mL min
−1) and the sample heated at a 10 °C min
−1 rate up to 1000 ° and kept at this temperature for 5 min. The coke deposited on the surface of the catalyst corresponds to the mass loss between 105 and 1000 °C.
The Brunauer–Emmett–Teller (BET) surface area, total pore and micropore volume, and average pore diameter of the catalysts were determined by N2 adsorption/desorption using an Autosorb-1C (Quantachrome, Boynton Beach, FL, USA) automatic instrument. Before the characterization, the catalysts were degassed for 12 h at 150 °C. The specific surface area was calculated using the BET method. Total pore volume and average pore diameter were estimated using the Barrett–Joyner–Halenda (BJH) method (desorption data), while micropore volume was estimated using the Dubinin–Radushkevich (DR) method.
The reduction temperature was determined by temperature-programmed reduction (TPR). The measurements were conducted using an Autosorb 1C-TCD (Quantachrome, Boynton Beach, FL, USA) automatic apparatus, equipped with a thermal conductivity detector. A continuous flow of 5 vol. % H2/Ar (40 mL min−1) was passed over 500 mg of calcined catalyst powder. The temperature was increased from room temperature to 1000 °C at a rate of 10 °C min−1. The sample was previously outgassed at 300 °C during 30 min.
4. Conclusions
In this study, the influence of commercial Ni-containing catalysts and activated charcoal in the vapors produced by slow pyrolysis of Pinus radiata waste chips in a continuous auger reactor was evaluated. In addition, the best performing catalyst was then introduced in a series of pyrolysis thermal optimization experiments to define the parameters (temperature profile) that achieve the most efficient pyrolysis operation.
The utilization of activated charcoal and Ni-containing reforming catalysts on vapor phase contact promote the gas yield in detriment of the pyrolysis liquids. The 44Ni catalyst, apart from enhancing gas yield over the rest of the catalysts, also increases the content of hydrogen and CO in the gases, showing that, for such heavy and tarry streams as pyrolysis vapors are, high amount of nickel on the catalyst support is required. Activated charcoal and reforming catalysts with lower quantity of Ni than 44Ni do not yield such quality gases.
Pyrolysis temperature plays an important role both in yield and product composition. Increasing the temperature causes the degradation of the solid and induces cracking reactions on the produced vapors, reducing pyrolysis liquids yield. At 500 °C the introduction of 44Ni catalyst does not affect product yield but causes the biggest quality enhancement of the gases. Nonetheless the best results in gas composition is achieved in the PR700 44Ni experiment due to the combined CO+H2 content of 80 vol. %, which makes it very interesting from the industrial point of view.
Despite its high gas yield and overall good results, pyrolysis experiments performed at 900 °C with and without catalyst are very similar and the improvements over the operation at 700 °C may not justify the increase on energy consumption from the efficiency point of view. The charcoal obtained at high temperature (700–900 °C) present very high fixed carbon content and a low volatile content, resulting in appropriate product to be used in various industrial applications, such as metallurgy or heating.

 ,
, 

