Article

The Catalytic Hydrogenation of Maleic Anhydride on CeO2−δ-Supported Transition Metal Catalysts

1
Engineering Research Center of Ministry of Education for Fine Chemicals, School of Chemistry and Chemical Engineering, Shanxi University, Taiyuan 030006, China
2
Faculty of Engineering and the Environment, University of Southampton, Highfield, Southampton SO17 1BJ, UK
*
Authors to whom correspondence should be addressed.
Catalysts 2017, 7(9), 272; https://doi.org/10.3390/catal7090272
Submission received: 11 August 2017 / Revised: 3 September 2017 / Accepted: 8 September 2017 / Published: 14 September 2017

Abstract

:
The proper selection of transition metals and support is pivotal to the design of active and selective catalysts for maleic anhydride hydrogenation (MAH). Herein, the M/CeO2−δ (M = Co, Ni, Cu, respectively) catalysts with pre-optimised metal loading of 10 wt % were prepared via a wet impregnation method and well characterized to corroborate their MAH performance with the properties of metal, support and the M/CeO2−δ catalysts. The results revealed that the metal dispersion on the catalyst declines in the order of Ni/CeO2−δ > Co/CeO2−δ > Cu/CeO2−δ, similar to the apparent activity for maleic anhydride (MA) transformation to succinic anhydride (SA). The hydrogenolysis of SA to γ-butyrolactone (GBL) occurs on Ni/CeO2−δ and Co/CeO2−δ only when the MA → SA transformation completing. The Ni/CeO2−δ displays superior activity and selectivity to Co/CeO2−δ in both MA → SA and SA → GBL reactions, while the Cu/CeO2−δ and CeO2−δ are both inert for SA → GBL hydrogenolysis. The MA hydrogenation to SA follows the first order kinetic law on the Ni/CeO2−δ and Co/CeO2−δ catalysts yet a more complex kinetic characteristics observed on the Cu/CeO2−δ. The distinct catalytic hydrogenation behaviours of the M/CeO2−δ catalysts are assigned to the synergism of dispersion and electronic configuration of the transition metals and oxygen vacancies.

Graphical Abstract

1. Introduction

Catalytic hydrogenation of maleic anhydride (MA) is an essential route for the current industrial production of the succinic anhydride (SA), γ-butyrolactone (GBL) and tetrahydrofuran (THF), which are value-added intermediates for pharmaceuticals and bio-degradable polymers and highly-demanded solvents for various industrial processes [1,2,3]. However, the MA hydrogenation (MAH) is a rather complex process that requires deliberately selecting metal catalyst to avoid excessive hydrogenation and concomitance of ring-open side reaction [1].
Currently, the main catalysts widely applied in the MAH processes are noble metal catalysts (Pd, Ru and Au) [4] and transition metal copper chromite (Cu-Cr) catalysts [5], though they are either costly, less selective or toxic. For developing environmentally-friendly and low-cost alternative MAH catalysts, extensive efforts have been made on: (1) exploring various transition metal Ni [1,2,6], Co [3], Cu [7,8,9] and bimetallic catalysts [10] with controlled particle sizes and surface dispersion; (2) modifying the traditional porous Al2O3 [11], SiO2 [3], zeolite [2] and SiO2-Al2O3 composite oxide supports [8] using functional promoters (e.g., CeO2 [12], TiO2 [13] and ZrO2 [14], etc.) to moderate the surface acidity and redox properties [8,15,16]; and (3) employing new catalyst supports, for example the structure-defective TiO2 [17] and CeO2 [1] have emerged as excellent supports for metallic Ni catalysts and demonstrated exceptional selectivity in MAH. The previous research advances in MAH catalysts revealed that their activity and selectivity depend greatly on the proper selection of metal and support and on the corresponding metal-support interaction. However, the systematic and comparative studies of the influence of transition metals and their supports on the MAH performance have not been well documented in literature, in particular the emerging ceria and titania supports.
In our previous work, the superior activity and selectivity in MAH on the Ni/CeO2−δ catalyst to those on the Ni/Al2O3 catalyst was attributed to the synergism of the Ni-CeO2−δ interaction, the oxygen vacancies and developed porosity of the CeO2−δ support [1]. In theory, the electron-rich Ovac in CeO2−δ may modify the geometric and electronic structure of the active metal [18,19], as well as enforce the metal-support interaction [20]. It is thought that the Ovac defects could synergistically enhance the catalytic performance of M/CeO2−δ catalysts, through coordination with the oxygen-containing group in OH cleavage [21], NO2 reduction [22] and CO2 methanation [23]. Moreover, the ionic TM (Mδ+) species can diffuse into the CeO2 lattice and modulate the population of Ovac in mixed oxides with dependence of the ionic radius and the valence state of the M [24,25]. Although M/CeO2−δ catalysts have been examined in various catalytic reactions, there is very limited knowledge of the metal influences on the CeO2−δ supports, particularly for the activity and selectivity in MAH.
In this paper, various TMs (Co, Ni, Cu) supported on ceria were prepared by a simple wet impregnation method and employed in liquid phase hydrogenation of MA at 210 °C and 5 MPa. Through careful characterizations, the catalyst activity and product selectivity in MAH on the M/CeO2−δ were investigated and correlated to the properties of the materials.

2. Results and Discussion

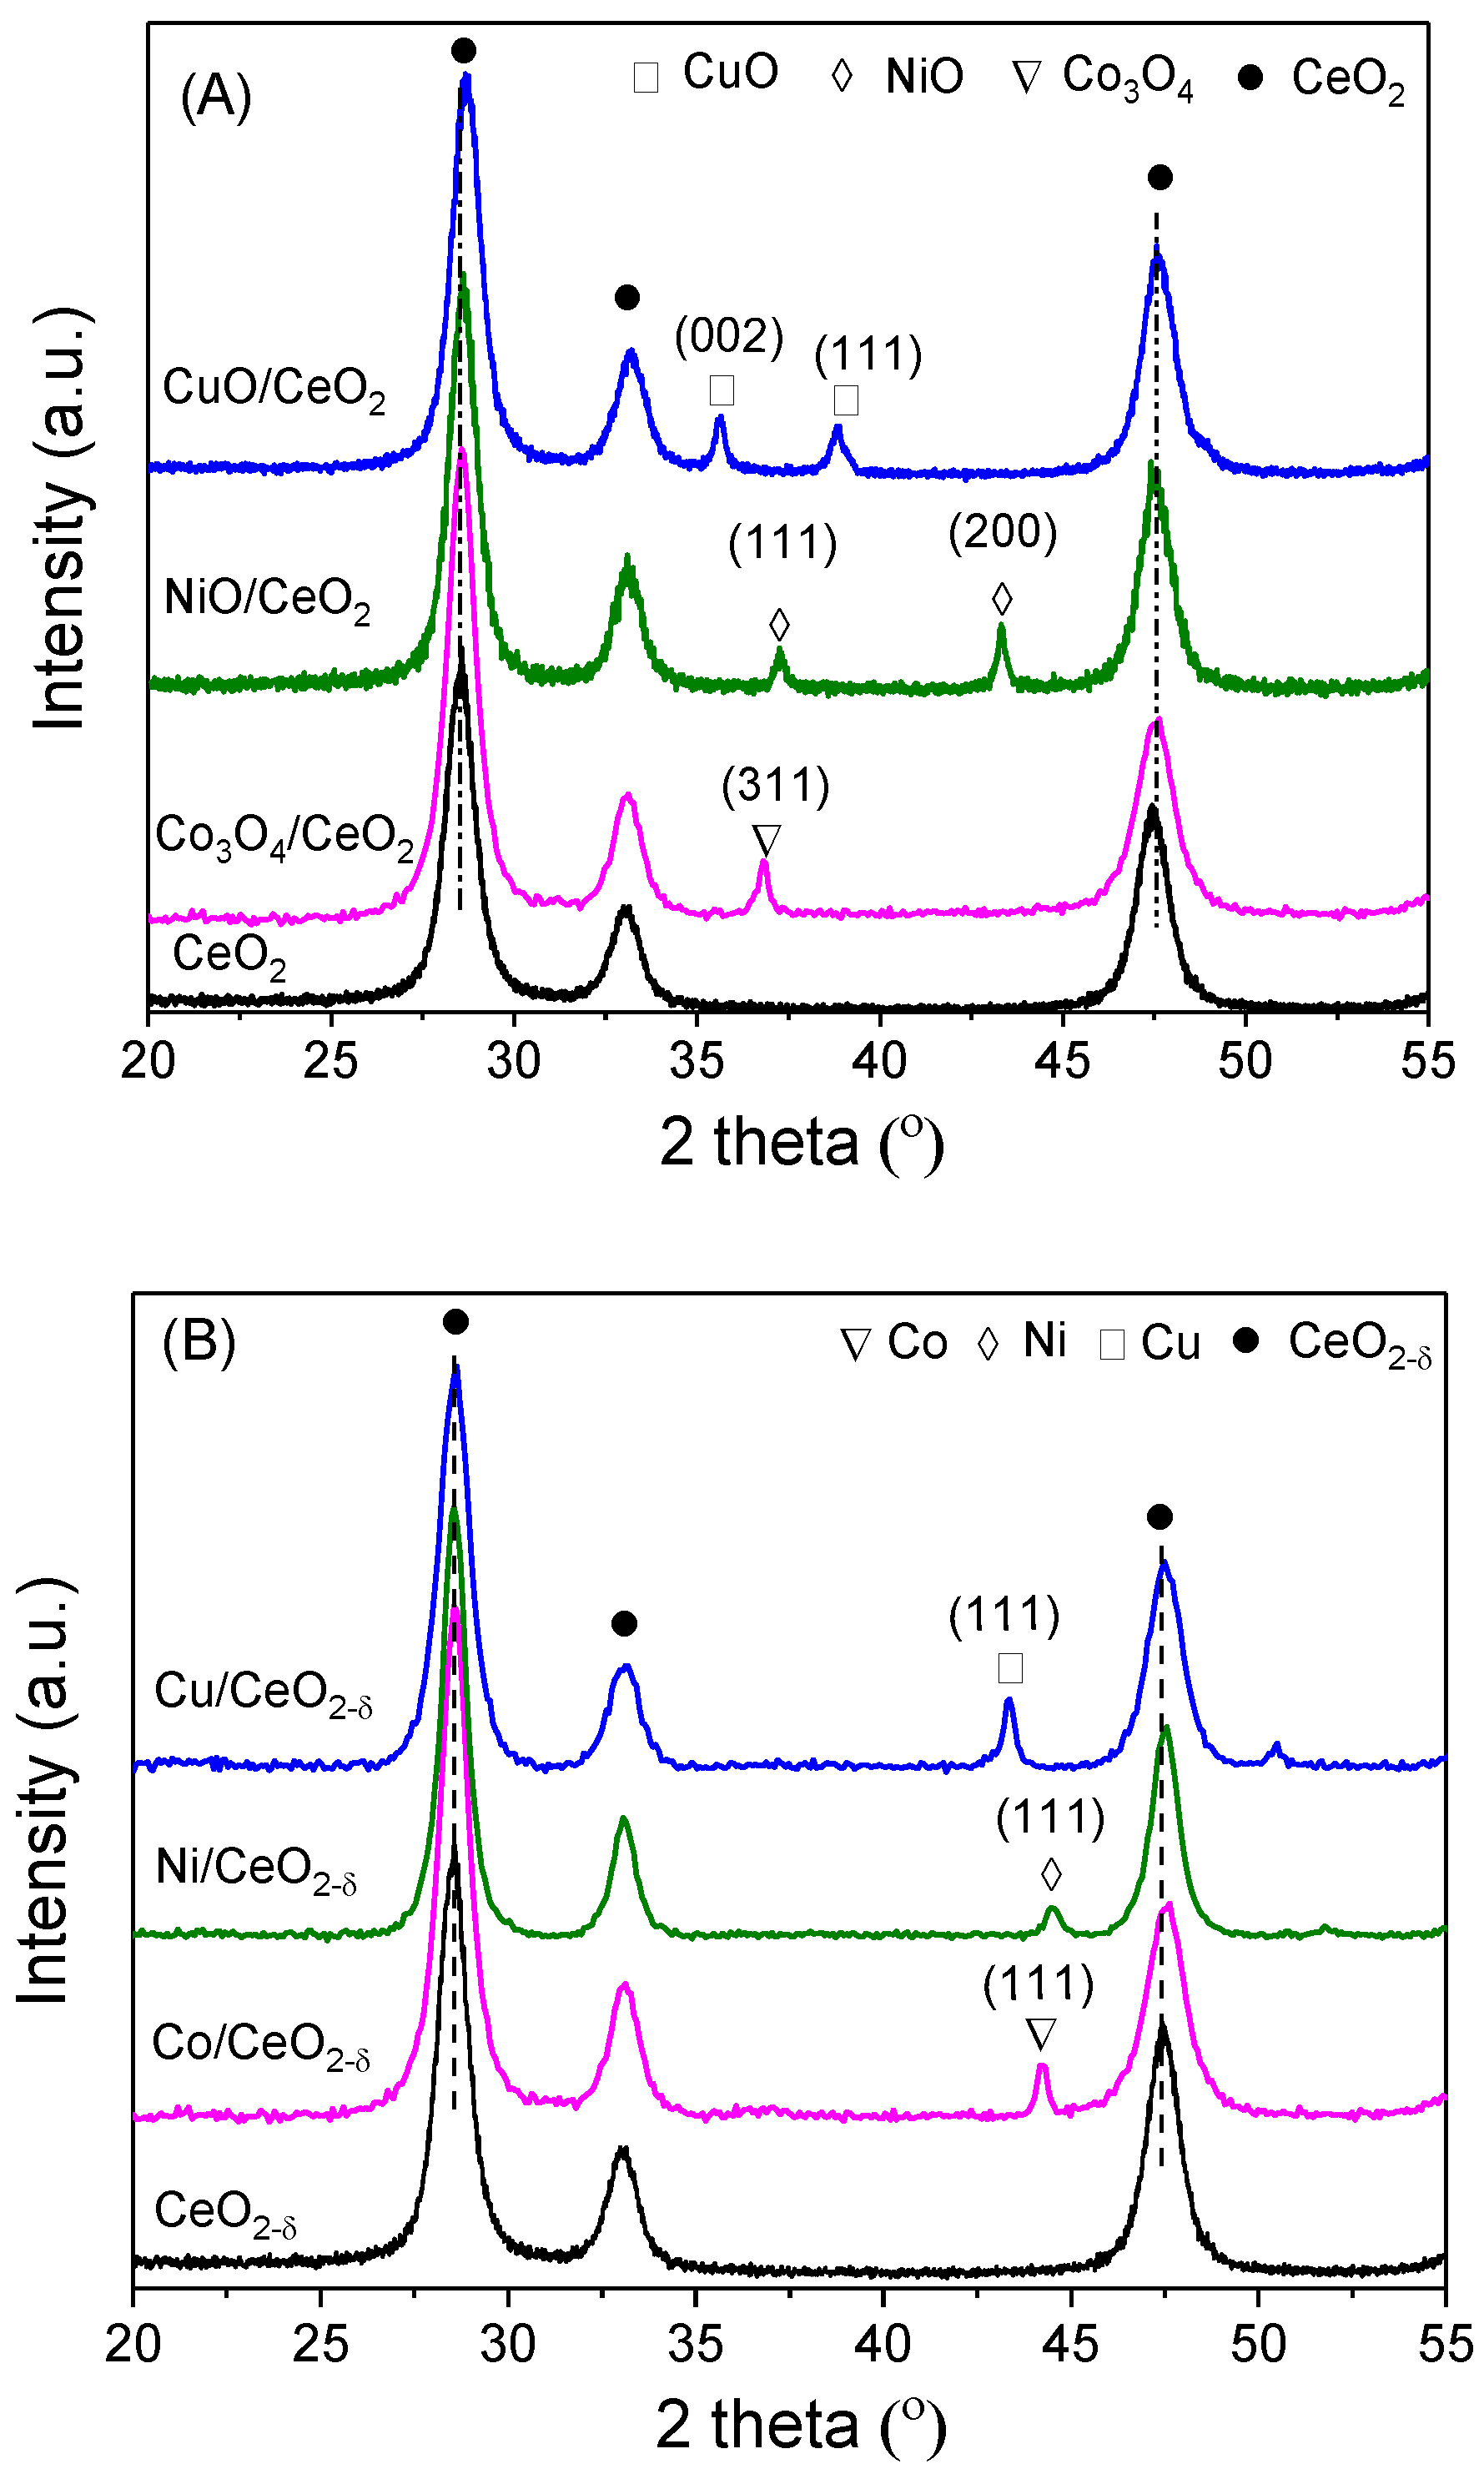
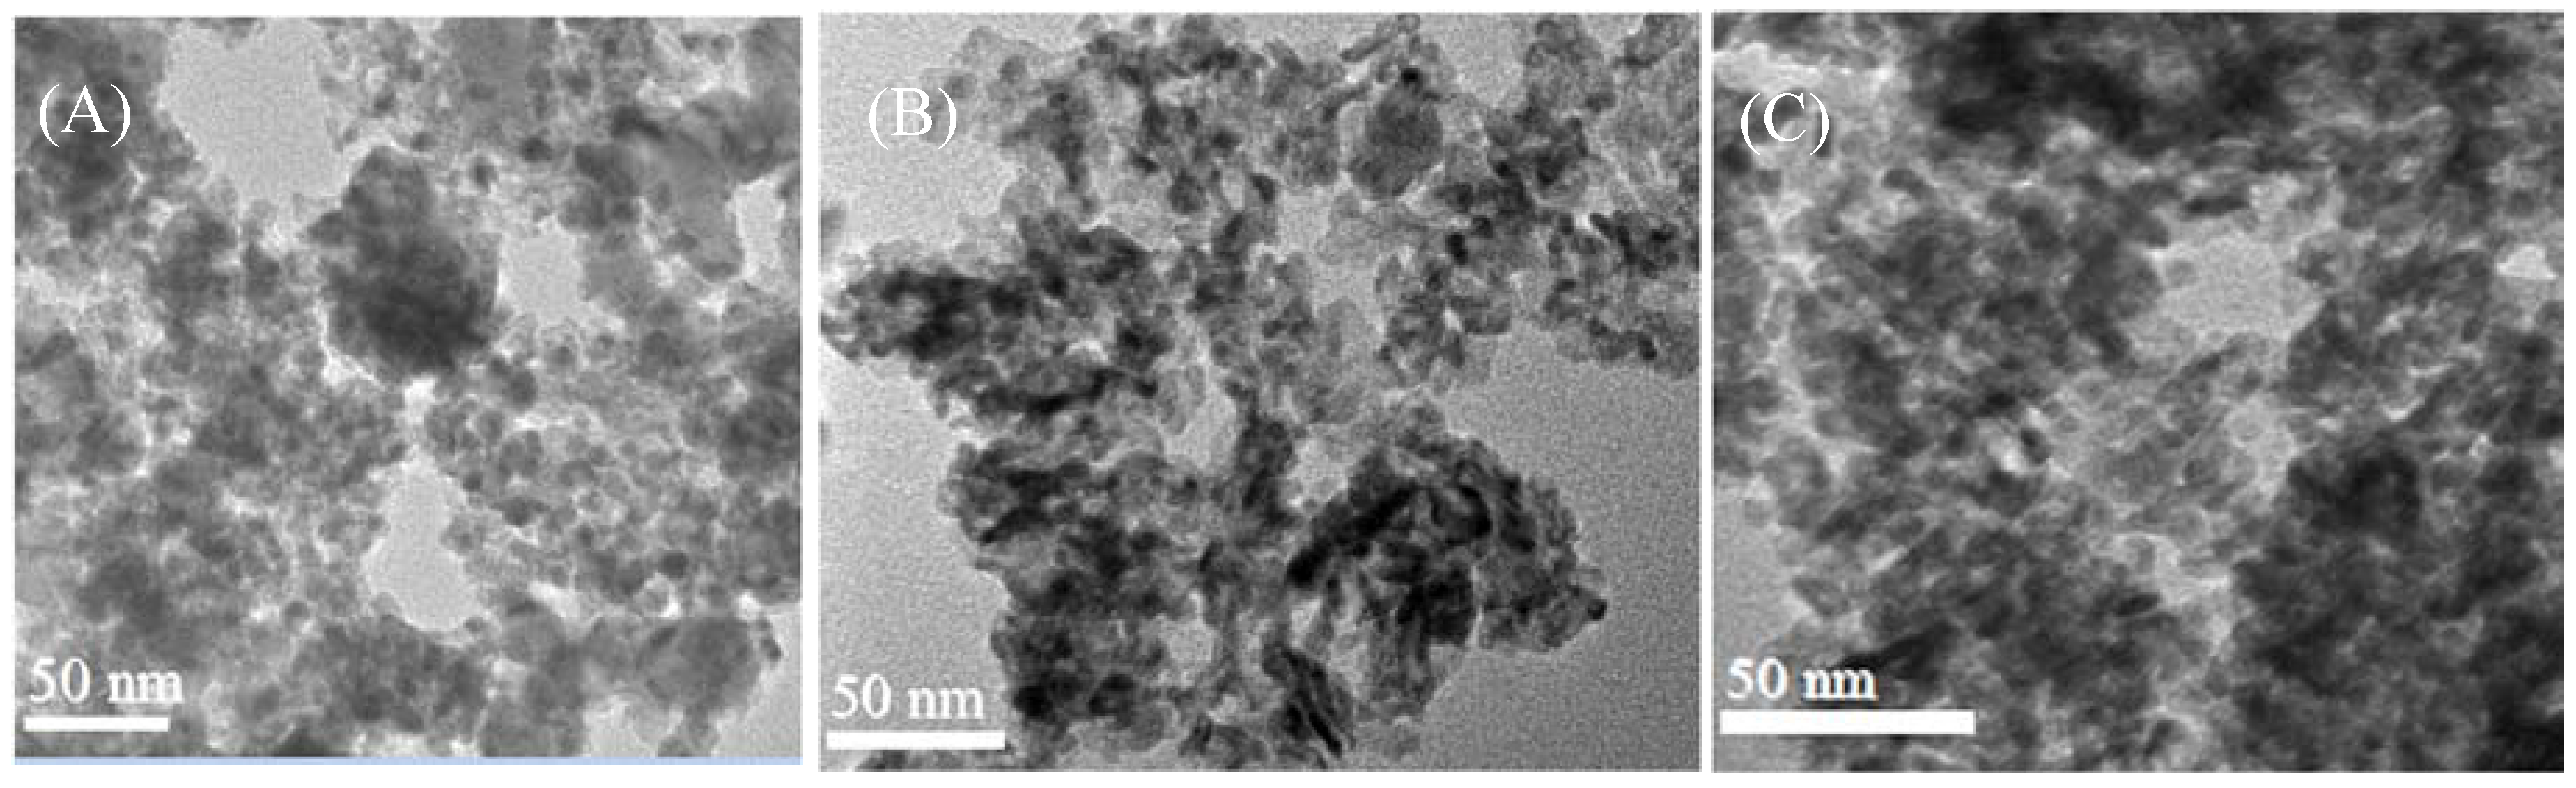
2.1. Structure and Morphology

Figure 1A shows the powder X-ray diffraction (XRD) data of CeO2 and MOx/CeO2 (M = Co, Ni, Cu, respectively) precursors. For the CeO2 and MOx/CeO2 samples, the major Bragg diffraction peaks at 28.5°, 33.1° and 47.5° are clearly resolved and attributed to the diffractions from the (111), (200) and (220) planes of the cubic fluorite-type ceria (JCPDS file 34-0394), respectively. The weak diffraction peaks are associated with isolated metal oxides and indexed to CuO (JCPDS file 48-1548), NiO (JCPDS file 78-0643) and Co3O4 (JCPDS file 43-1003) (Figure 1A). The diffraction peaks of CeO2 in the MOx/CeO2 catalysts slightly shift to greater 2θ angles than those of bare CeO2, revealing that small portions of the M ions in the loaded MOx have diffused into the ceria matrix and partially substituted cerium cations (radius of Ce4+ = 0.084 nm) [1,25,26]. Indeed, the metal doping induces lattice distortion and shrinkage of the CeO2 lattice to different levels (Table 1) due to the smaller radii of the doping cations (R(Co2+) = 0.074 nm and R(Co3+) = 0.063 nm, R(Ni2+) = 0.072 nm and R(Cu2+) = 0.073 nm), but the changes of lattice parameters of CeO2 for the samples are insignificant because of the low doping level.
The calculated mean crystalline sizes of Co3O4, NiO, CuO and CeO2 are listed in Table 1. It is found that NiO possesses the smallest crystallite size, while CuO the largest. The CeO2 supports exhibit different crystallite sizes even though the MOx are loaded at similar amounts. The varying crystallite sizes of MOx and CeO2 are due to their different MOx-CeO2 interaction and the induced lattice distortion.
After H2 reduction treatments, metal phases of Ni, Co and Cu emerge in the XRD patterns of the reduced M/CeO2−δ catalysts (Figure 1B), while the MOx diffraction peaks vanish since the crystalline MOx species are converted to corresponding metals. Compared to Co and Cu, the Ni species display relatively weaker diffraction, suggesting that Ni might be highly dispersed on the surface of CeO2−δ with a smaller crystallite size (Table 1). We suppose that the smaller crystallite sizes of metals relative to their metal oxides (Figure 2) are induced by the H2 reduction treatment because the M-CeO2−δ would inherit the strong interaction between MOx and the CeO2. The proportional reliance of metal crystallite sizes on their corresponding metal oxides is further confirmed by the crystallite size changes of Ni/CeO2−δ and NiO/CeO2 samples (Figure S1 in Supplementary Materials), where the strong dependence of the Ni0 crystallite sizes on their oxide precursors showed a linear correlation with the Ni loading up to 20 wt %.
As shown in Table 1, the lattice parameters of ceria in the M/CeO2−δ catalysts appear quite similar, but become larger than those of MOx/CeO2 samples. The increasing crystallite sizes of ceria in M/CeO2−δ catalysts may be induced by comprehensive factors, including a fraction of Ce4+ cations being reduced to Ce3+ of a larger ionic radius (RCe(III) = 0.102 nm [27]) that expands the ceria lattice parameter, the thermal sintering of ceria and the metal exiting from ceria matrices during the reduction process.
Figure 3 shows the transition electron microscopy (TEM) images of reduced the M/CeO2−δ catalysts. It is found that most CeO2 crystallites observed in the M/CeO2−δ samples are of spherical or irregular polyhedral morphologies, independent of the deposited metals. From the TEM images, it is difficult to distinguish the metal particles because the sizes of metals are quite similar to the CeO2 support (shown in Table 1) [25]. In addition, a larger CeO2−δ particle is seen in the Co/CeO2−δ catalyst compared with Ni/CeO2−δ and Cu/CeO2−δ, which is likely associated with the slight sintering of the ceria support during the reduction at higher temperature.

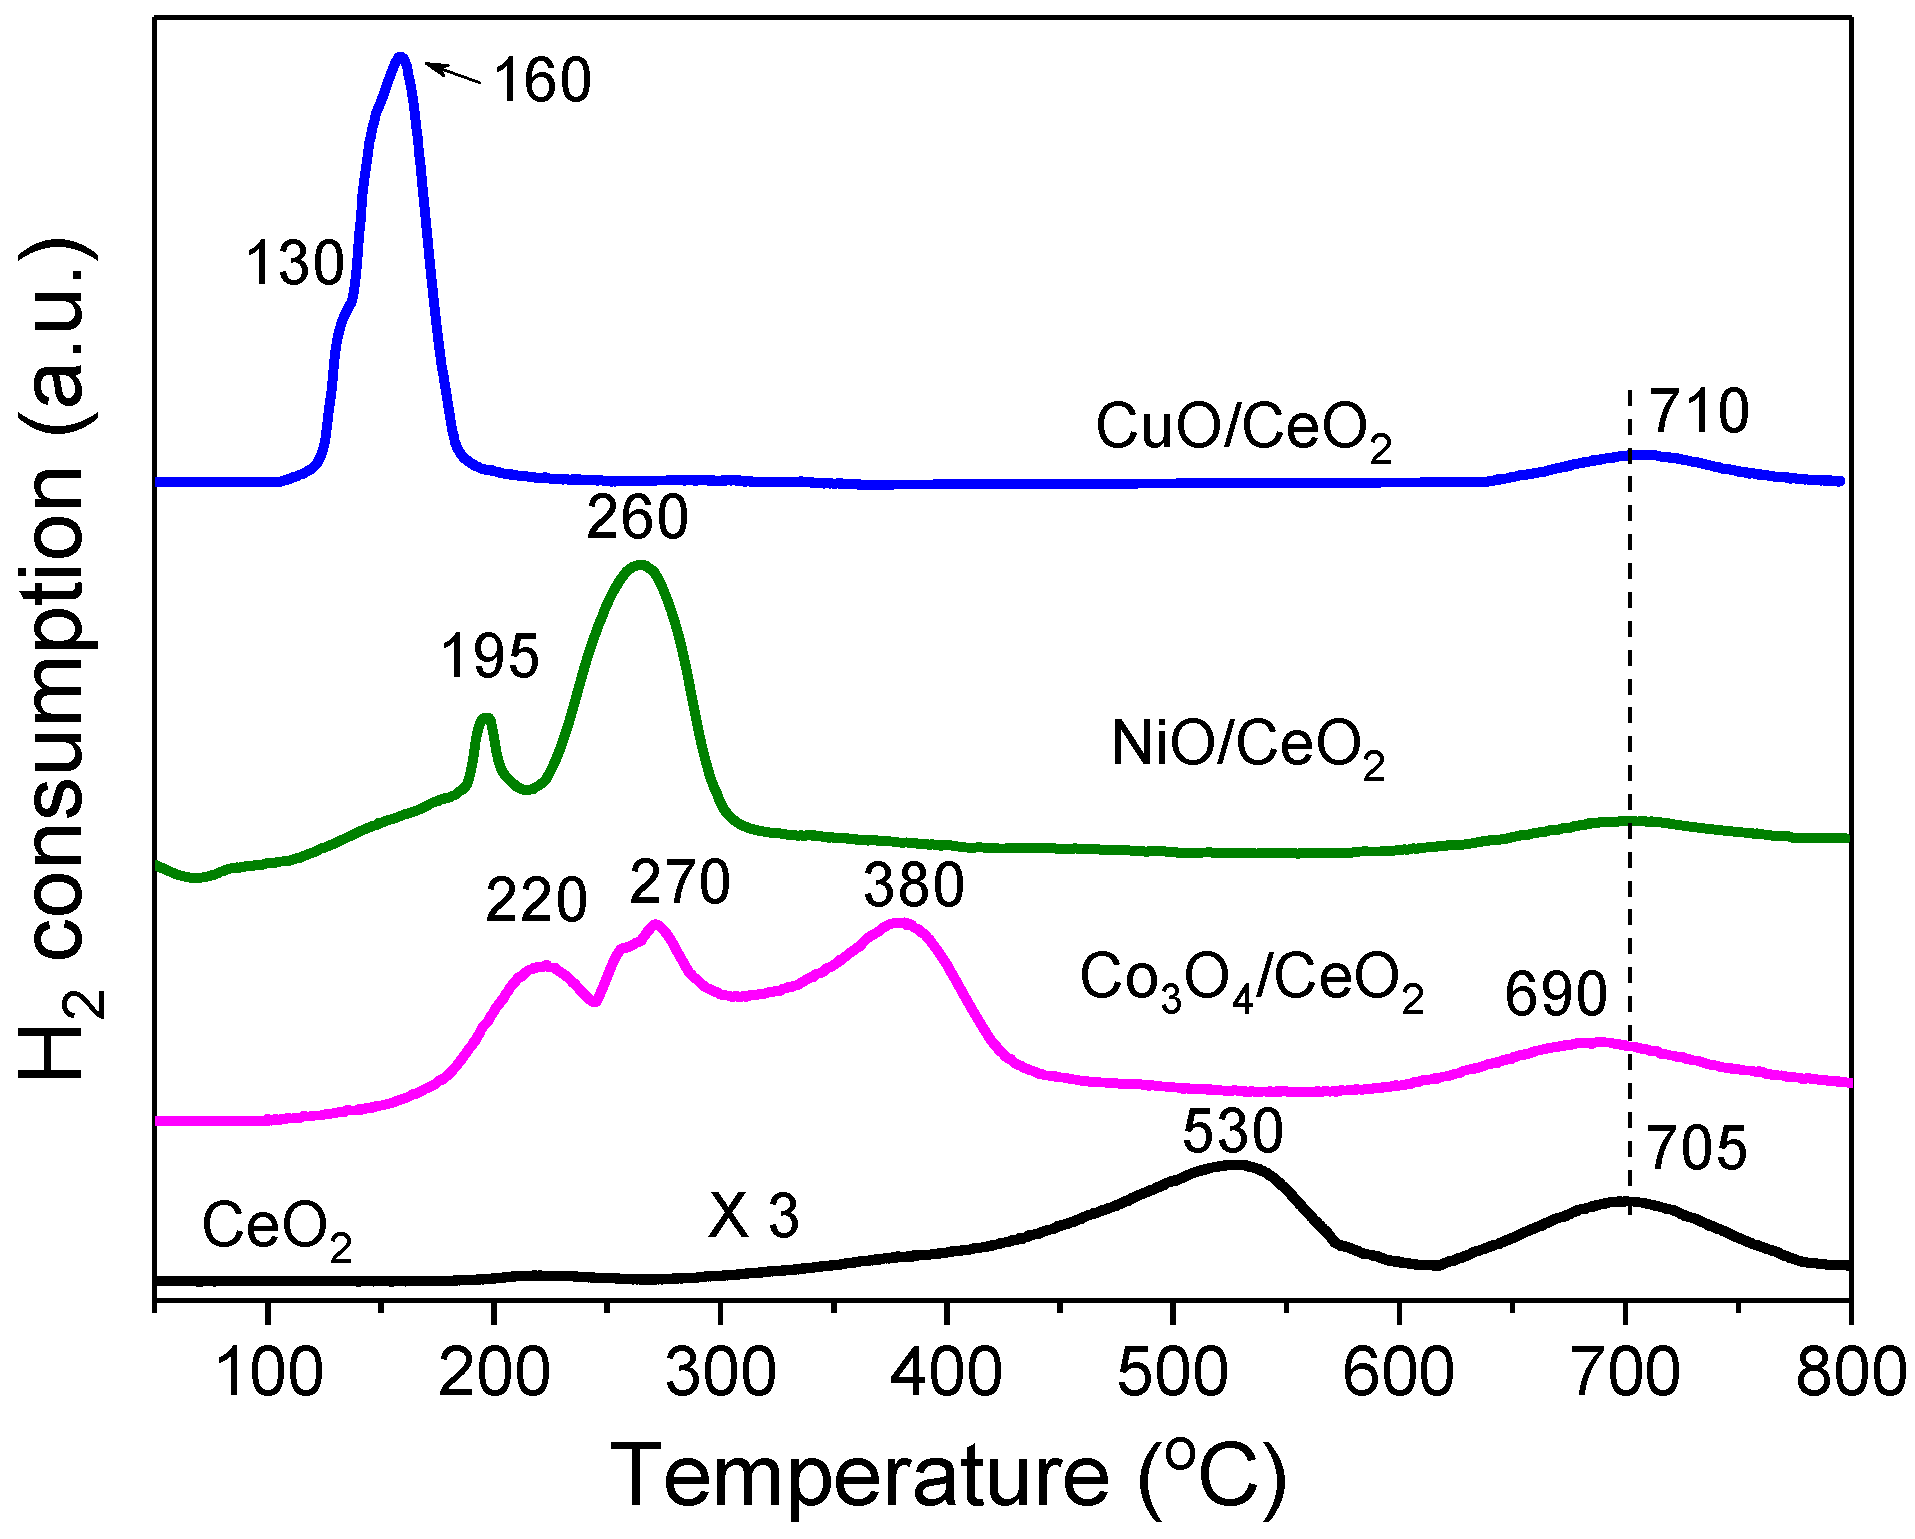
2.2. Reduction Behaviour of the MOx/CeO2 Catalyst Precursors

Figure 4 shows the hydrogen temperature-programmed reduction (H2-TPR) profiles of MO/CeO2 samples. The TPR profiles at the temperature below 400 °C are due to the reduction of supported MOx in the three MOx/CeO2 samples. For the CuO/CeO2 sample, the strong peak centred at 160 °C is attributed to the reduction of isolated CuO species with weak CuO-CeO2 interaction, while the shoulder peak located at 130 °C is due to the reduction of adsorbed O species on Ovac sites and the highly dispersed CuO with strong CuO-CeO2 interaction [26]. For the NiO/CeO2 sample, the reduction of surface adsorbed O species starts from an even lower temperature (~100 °C) [28] with a sharp reduction peak at 195 °C, which can be related to the reduction of highly dispersed NiO on CeO2 [28]. The main TPR peak at 260 °C is assigned to the reduction of NiO clusters aggregated on the CeO2 surface [1]. On the Co3O4/CeO2 sample, three distinct TPR peaks are observed, which could be ascribed to the reductions of Co3O4 → CoO (220 °C), CoO → Co (270 °C) [29,30] and isolated CoO species (380 °C), respectively [25]. It is worth noting that the CeO2 reduction occurs at a lower temperature for Co3O4/CeO2 relative to other samples, because CoOx can enhance H2 spillover from the reduced Co species towards CeO2, which decreases the CeO2 reduction temperature [31]. The different interaction between the MOx and CeO2, as indicated by their distinct reduction behaviours of the MOx/CeO2 samples, would determine the dispersion of the corresponding metals on CeO2−δ and thus affect their ability in hydrogen activation (see Section 2.4 for the H2-TPD analysis).
The two broad reduction peaks appearing at 530 and 705 °C for CeO2 are attributed to the respective reductions of surface oxygen species and the bulk lattice oxygen within ceria [32]. However, for the three MOx/CeO2 samples, their reduction peaks due to the removal of lattice oxygen from the CeO2 support are displayed in a similar temperature region (600~800 °C), suggesting that the involved MOx species slightly impact the reducibility of the lattice oxygen of CeO2. In contrast, the reduction of surface oxygen (~530 °C) is absent for the MOx/CeO2 since both the strong M-ceria interaction and the H2 spillover from metal onto the vicinity surface oxygen species can improve the surface oxygen removal from the CeO2 support [33]. In other words, the metal on the support can catalyse the ceria reduction.

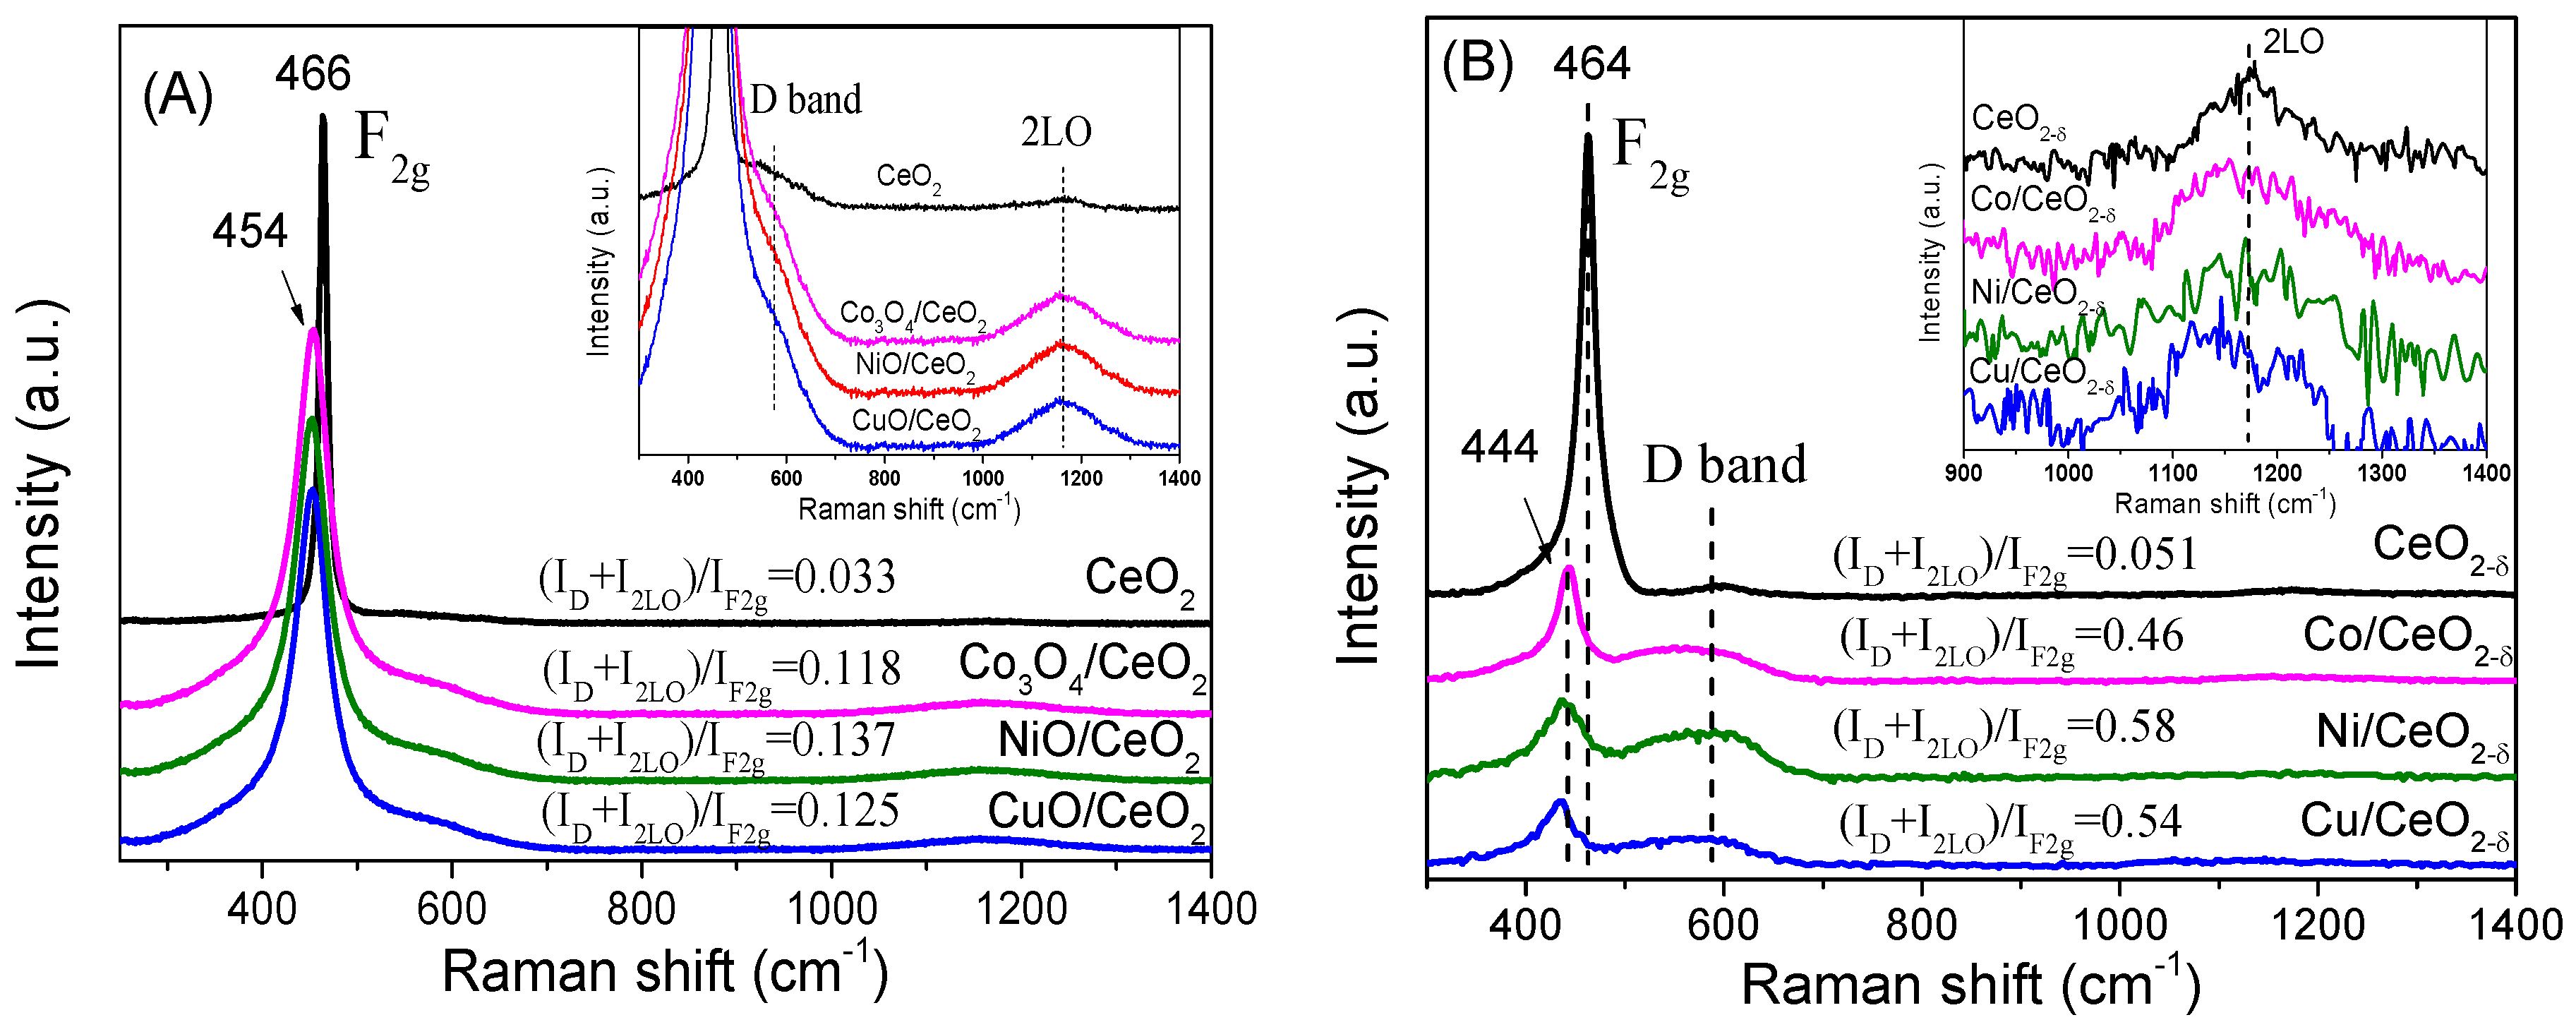
2.3. Surface Structural Analysis

Raman spectroscopy is employed to investigate the surface structure of the MOx/CeO2 precursors and the M/CeO2−δ catalysts. As shown in Figure 5A, the strong vibration mode (F2g, ~466 cm−1), due to the symmetrical stretching vibration of Ce-O bonds, dominates the Raman spectrum of CeO2 [34]. Upon metal loading, the F2g modes red shift to 454 cm−1 with peak broadening due to the strong interaction between MOx and CeO2 that gives rise to distortion of the CeO2−δ lattice and creates electron-rich Ovac for maintaining the system charge neutrality [34]. Besides the F2g band, two broadening bands within the 600~700 cm−1 and 1100~1250 cm−1 regions are observed on the MOx/CeO2 samples, which can be attributed to the Frenkel defect-induced modes (D band) and the second order longitudinal optical mode (2LO), respectively [35]. The D and 2LO bands are related to the Ovac that originated from reducing Ce4+ to Ce3+. Compared to CeO2, MOx/CeO2 samples show broader and stronger vibrations in the D bands and 2LO modes, suggesting that the loading of MOx species facilitates the creation of Ovac thanks to metal substitution of lattice Ce, which is in good agreement with the discussion of XRD results. The quasi density of Ovac in ceria due to metal incorporation is tentatively quantified through the relative ratio of (ID + I2LO)/IF2g, as inserted in Figure 5A. The (ID + I2LO)/IF2g in the MOx/CeO2 samples is more than three-fold that in bare CeO2, namely, the Ovac density descends in the order of NiO/CeO2 > CuO/CeO2 > Co3O4/CeO2 >> CeO2. The results clearly reflect that the Ovac concentration created by the MOx loading highly depends on the metal species, likely due to their different ionic radius and the oxidation state of the dopants [24].
The modes of F2g, D band and 2LO can be clearly identified in the reduced M/CeO2−δ catalysts and CeO2−δ (Figure 5B) but much weaker than those of the MOx/CeO2 precursors, in particular the Ovac-related D and 2LO bands. Moreover, the F2g modes of M/CeO2−δ catalysts further red shift from 454 cm−1 to 444 cm−1. The relative changes of Raman signals for the M/CeO2−δ catalysts to their precursors are the consequence of their decreased structure symmetry. However, the (ID + I2LO)/IF2g ratios of the M/CeO2−δ catalysts and CeO2−δ are much greater than those in their corresponding oxides (inserted in Figure 5A,B), suggesting that the H2 reduction significantly promotes Ovac density. It is worth noting that Ovac concentration of the metal-loaded catalysts is enhanced approximately nine- to ten-fold that of CeO2−δ, further confirming that metal loading can dramatically improve the Ovac formation. The results are in good accordance with the TPR characterization. We also note that the Ovac density variation of the M/CeO2−δ catalysts follows the descending order of Ni/CeO2−δ > Cu/CeO2−δ > Co/CeO2−δ >> CeO2−δ, which inherits the Ovac concentration order of their precursor oxides.

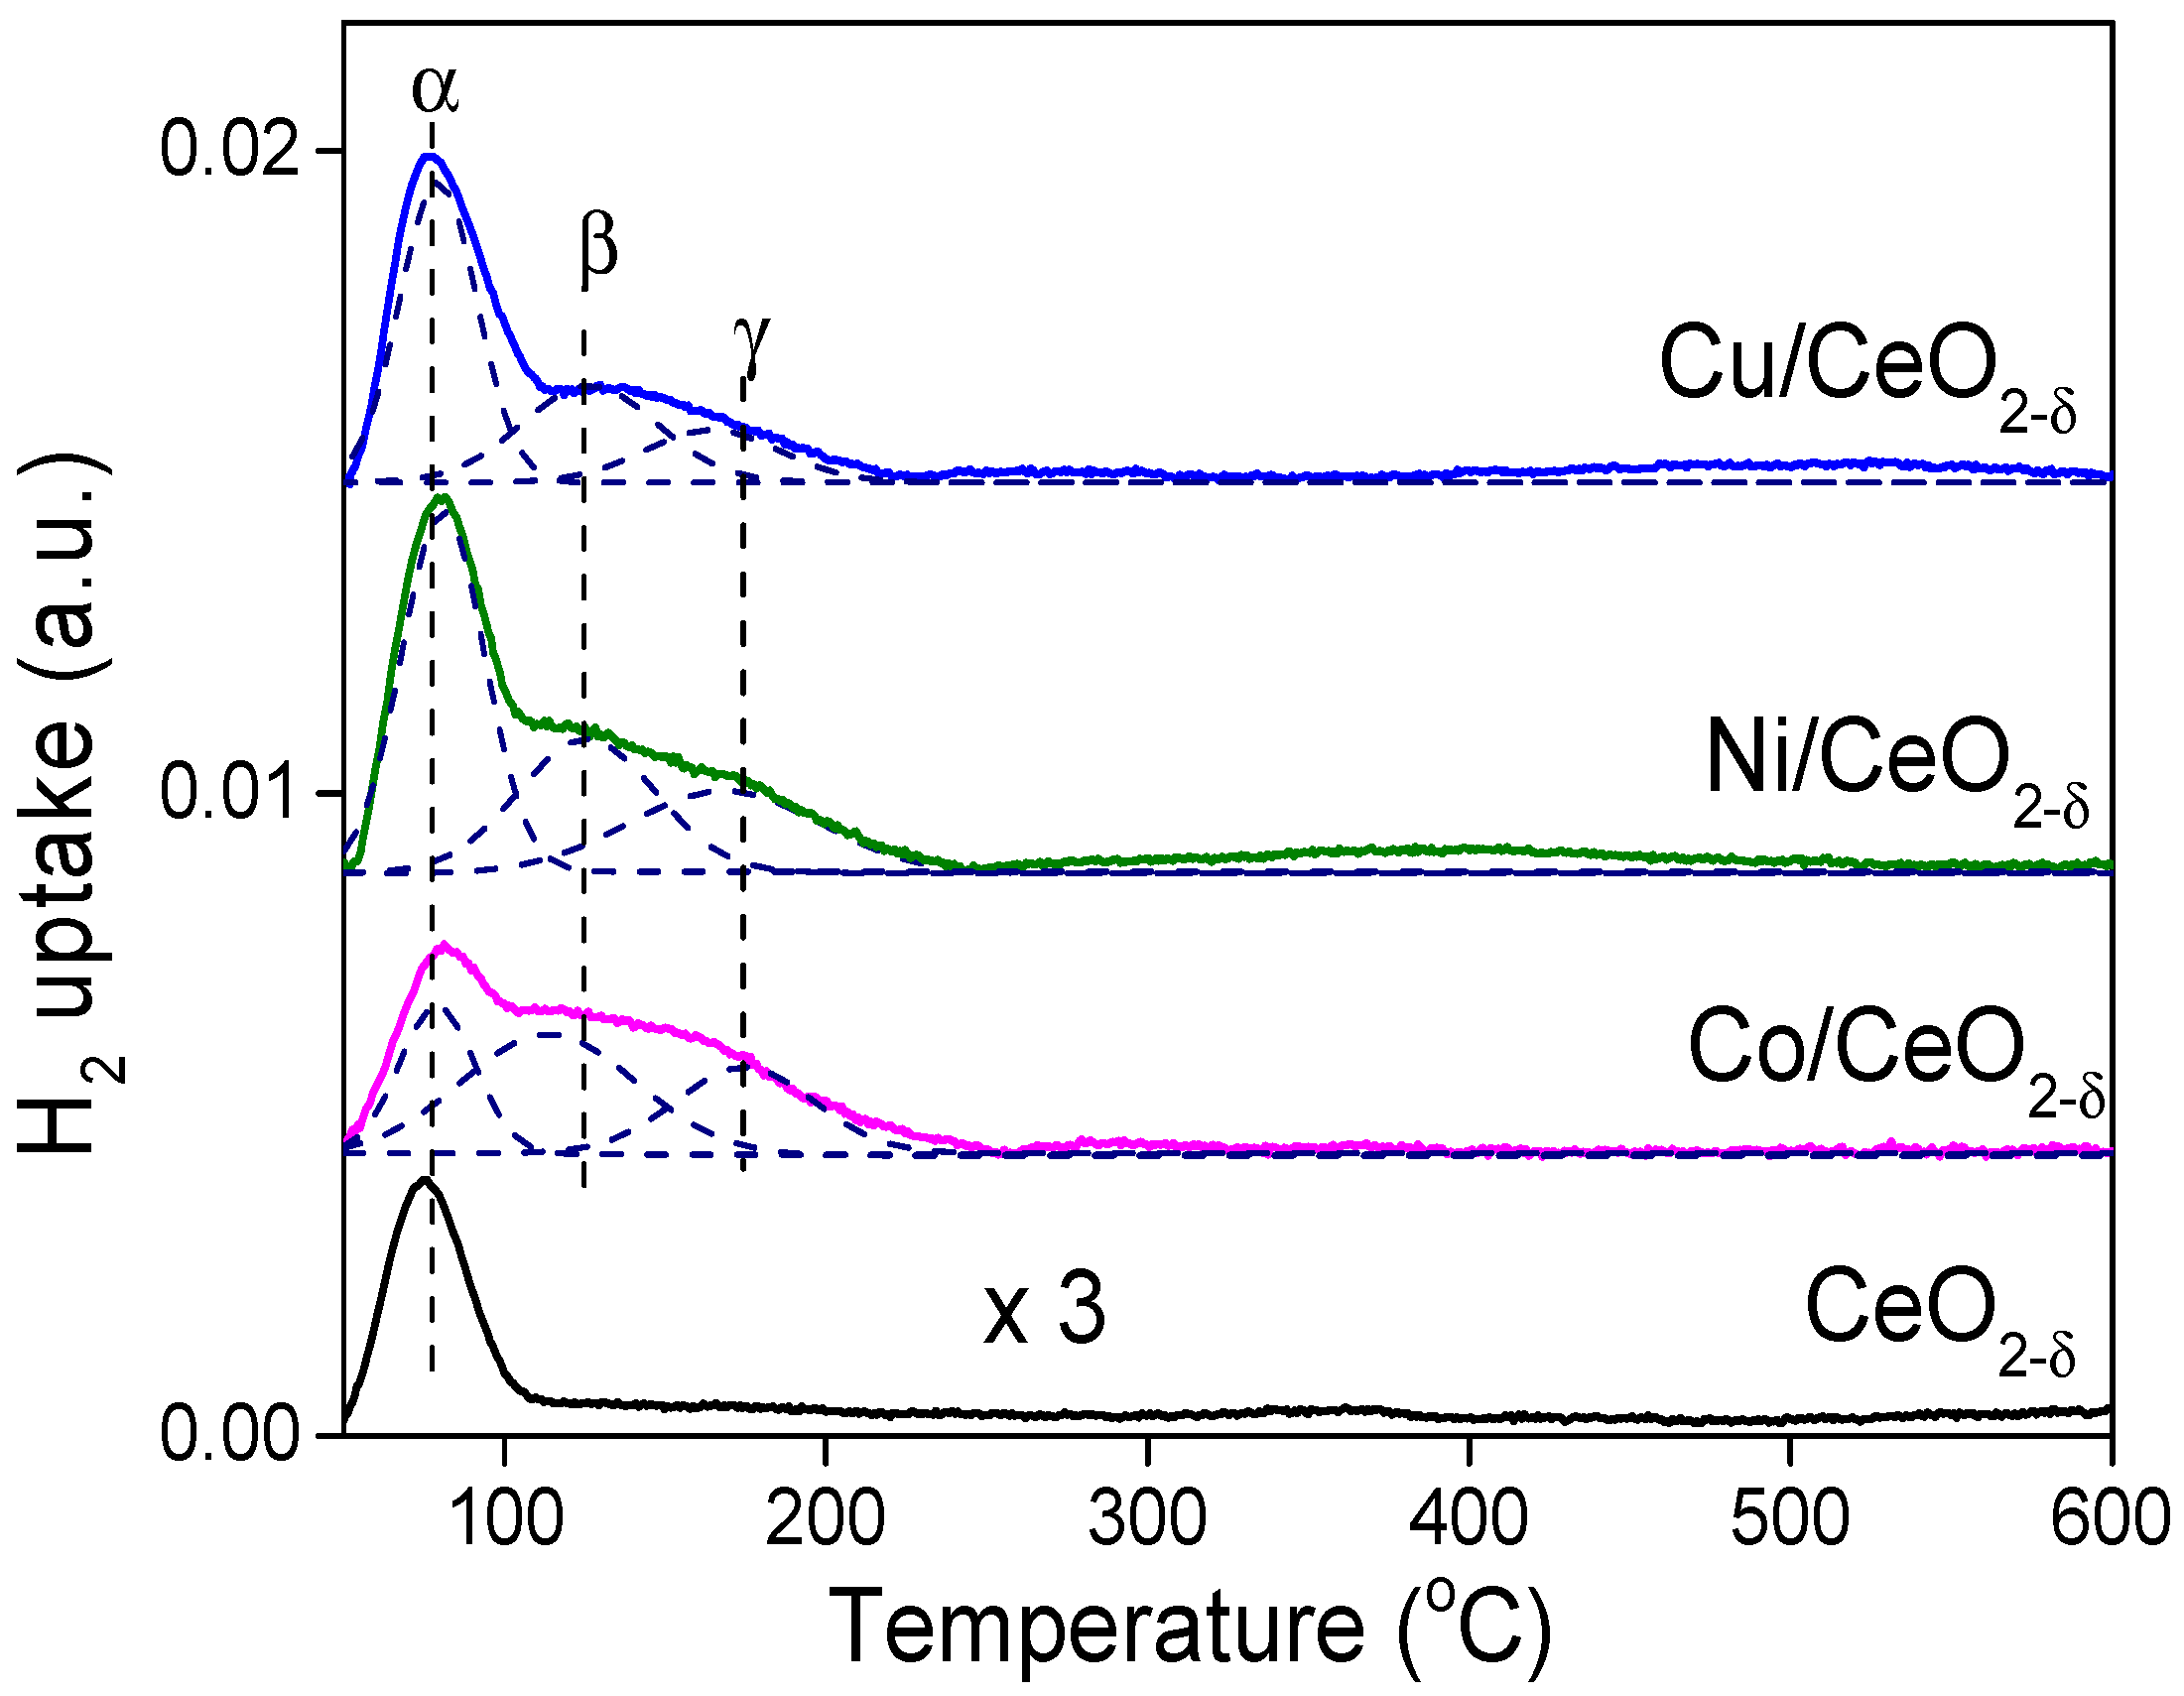
2.4. Hydrogen Activation on the M/CeO2−δ Catalysts

Hydrogen temperature programmed desorption (H2-TPD) is a powerful tool to gain insights into hydrogen activation and metal-support interaction on the catalysts. As shown in Figure 6, the H2-TPD profiles of the M/CeO2−δ are deconvoluted into three peaks. The α peaks for the M/CeO2−δ catalysts appear within a very similar temperature region, which is identical to the temperature range of the sole H2-TPD peak on CeO2−δ. Such α peaks are therefore assigned to the desorption of H2 up-taking surface Ovac sites in CeO2−δ [27]. The difference in the integrated areas (Table 2) reveals that the amount of Ovac of the M/CeO2−δ is dependent on the metallic species, and the Ni/CeO2−δ and Cu/CeO2−δ possess a similar amount of Ovac, but much larger than those of the Co/CeO2−δ and CeO2−δ supports. The results are consistent with the Raman and TPR analyses.
The β and γ peaks located in 100–250 °C are due to H2 desorption from the corresponding metal species. The β peaks can be ascribed to the dissociative H2 adsorbed on the highly dispersed metal species with a large density of surface defects, which can enhance the hydrogen diffusion and reduce the energy barrier for hydrogen dissociation [36]. The γ peaks are associated with chemisorbed hydrogen on isolated metal clusters [37]. The quantitative analyses of peak β and γ (Table 2) clearly show that Co/CeO2−δ and Ni/CeO2−δ catalysts possess comparable amounts of β-H2 and γ-H2, which are more than those of Cu/CeO2−δ. The low uptake of β and γ hydrogen on Cu/CeO2−δ may be due to the weak capability of Cu for hydrogen activation caused by its closed d10 orbitals [38].
According to the assignment of the H2-TPD peaks, the metal dispersion (DM) can be quantified using only the metal-related hydrogen activation (sum of the β- and γ-H2), which is different from the overall H2 activation amount of the catalysts. As listed in Table 2. The DM of the M/CeO2−δ catalysts is found to be decreasing in the order of Ni/CeO2−δ > Co/CeO2−δ > Cu/CeO2−δ.

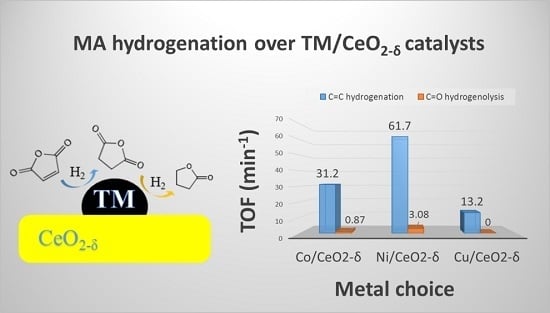
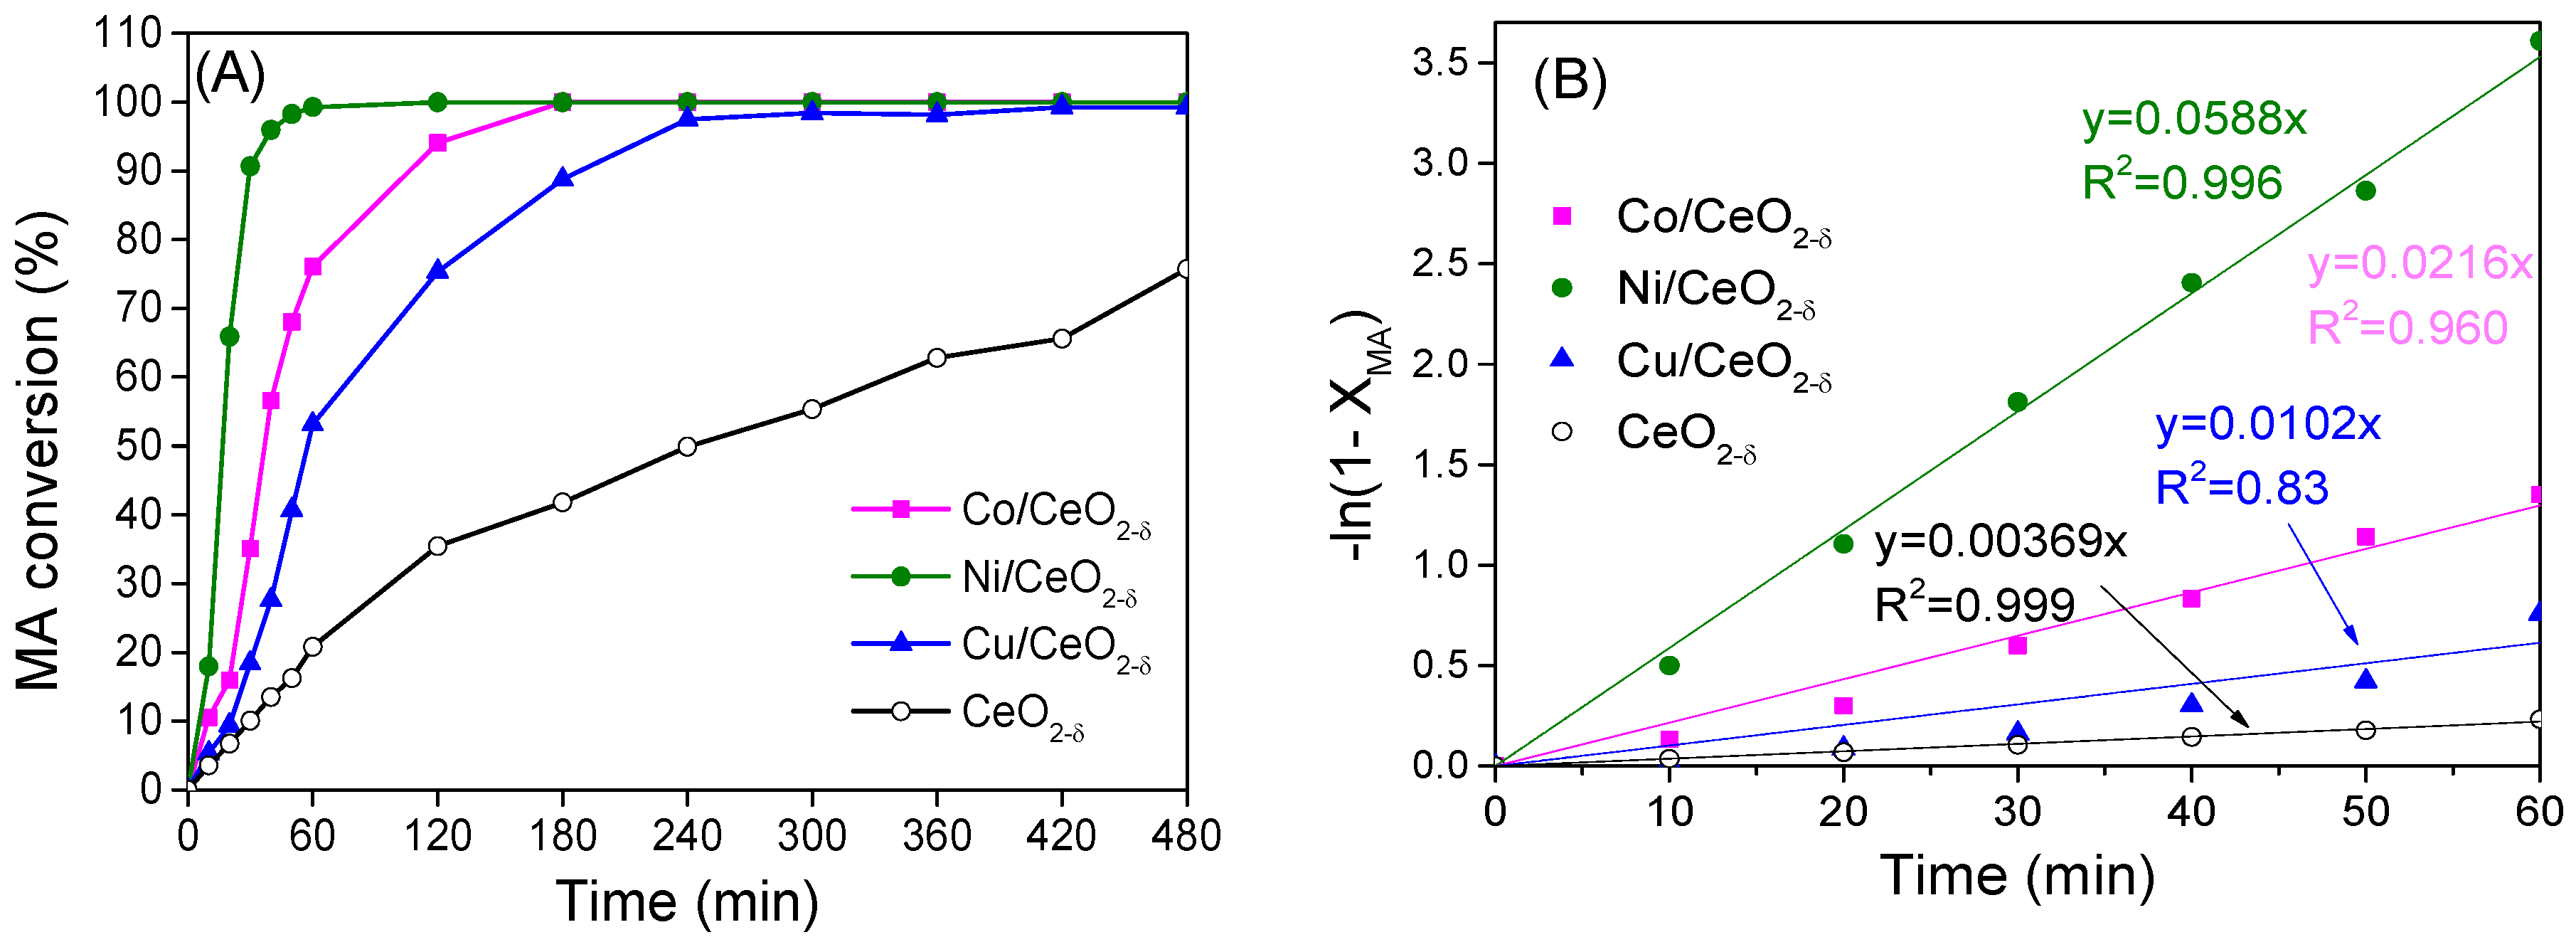
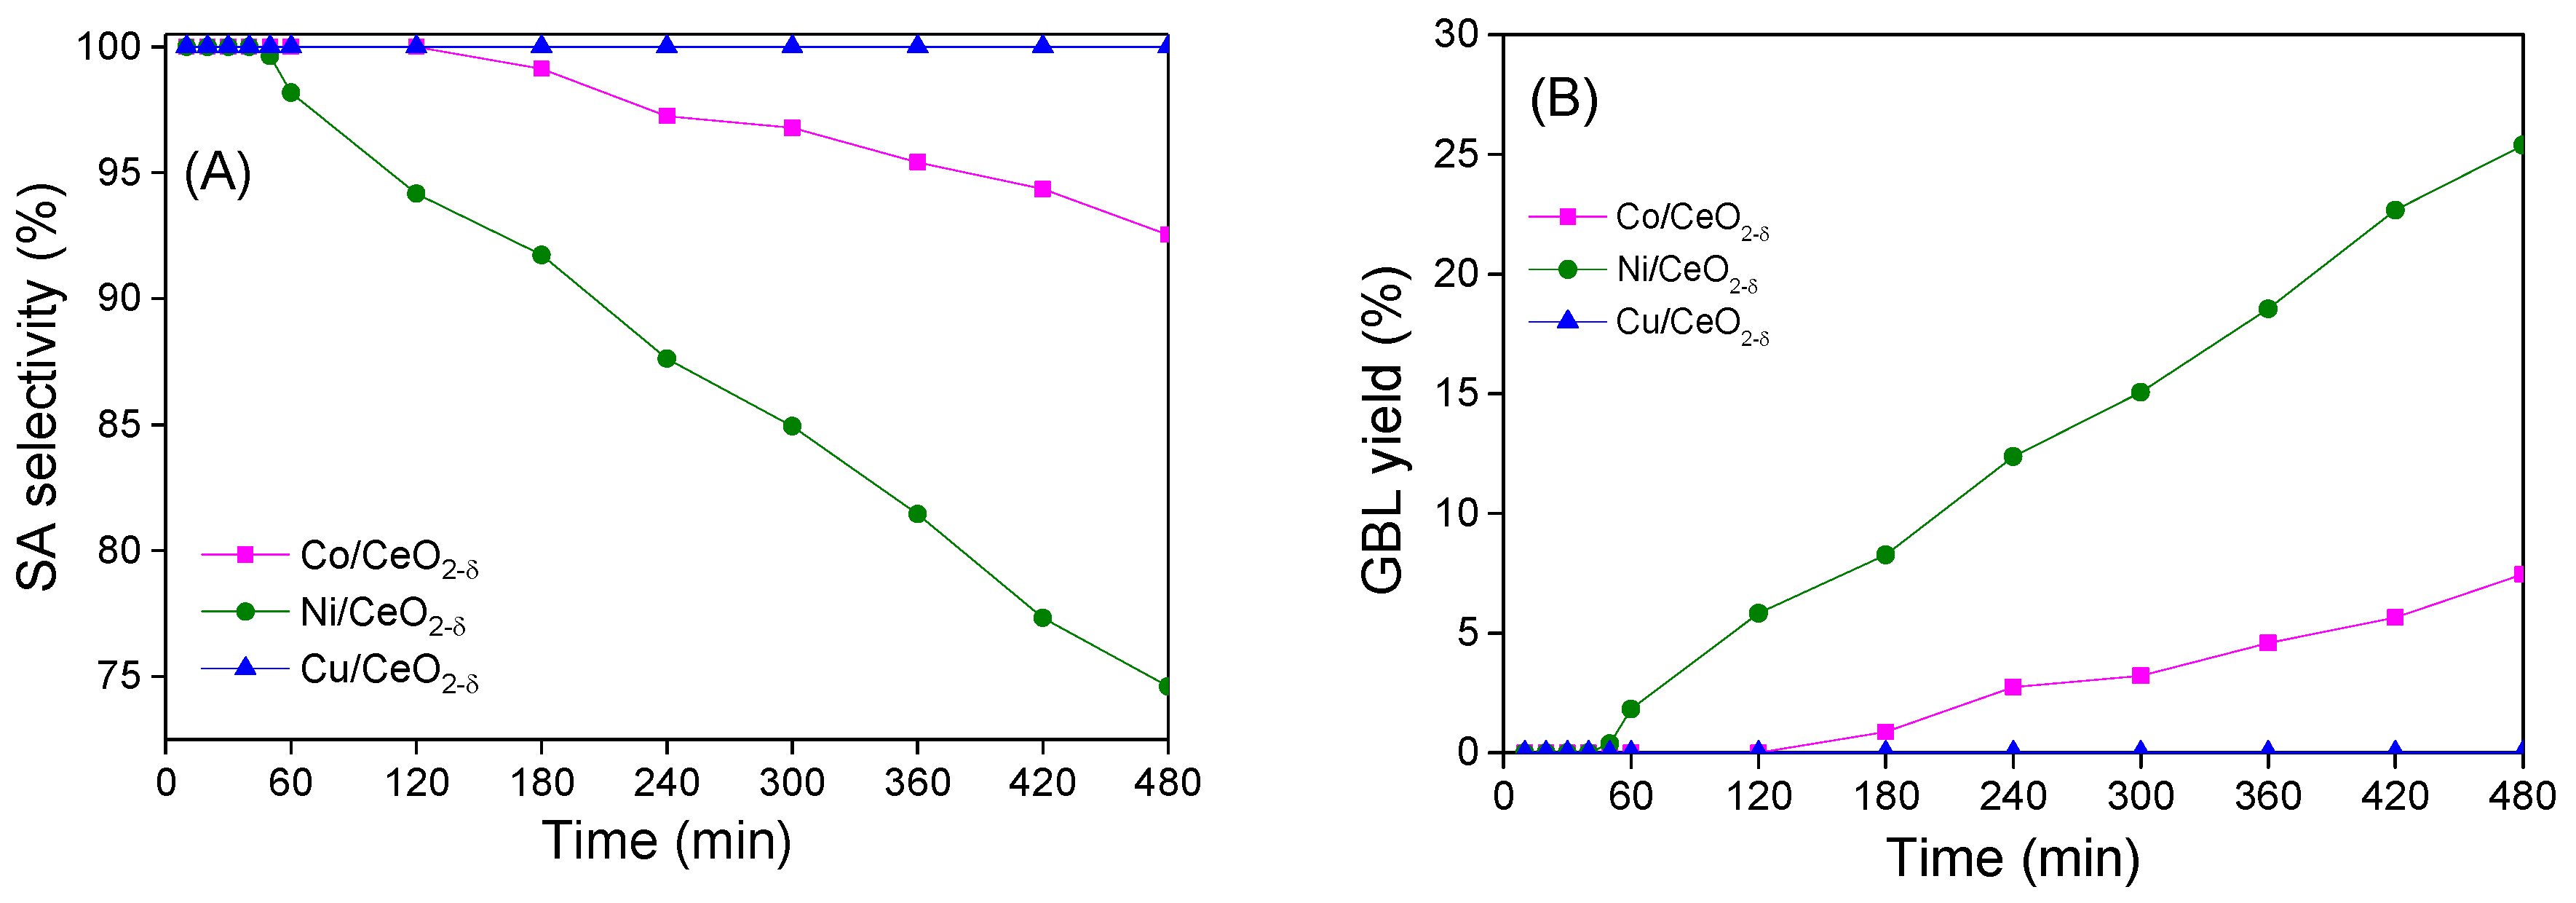
2.5. Catalytic Hydrogenation of Maleic Anhydride

Figure 7A presents the MA conversion (XMA) along the hydrogenation courses on M/CeO2−δ catalysts in a batch reactor at 210 °C and hydrogen pressure of 5.0 MPa. Among the examined catalysts, Ni/CeO2−δ is found to possess the highest activity of MA conversion, reaching ~100% MA conversion in 60 min. However, the MA conversion on Cu/CeO2−δ and Co/CeO2−δ in the same period only achieves 32% and 70%, respectively. The MA transformation completes in 3 h on Co/CeO2−δ and 4 h on Cu/CeO2−δ. Moreover, the turnover frequencies of MA transformed to SA (TOFMA→SA) over M/CeO2−δ catalysts are also estimated. The Ni/CeO2−δ catalyst records the highest TOFMA→SA of 61.7 min−1, nearly twice that of the Co/CeO2−δ catalyst (TOFMA→SA = 31.2 min−1) and five-fold that of Cu/CeO2−δ (TOFMA→SA = 13.2 min−1). The considerable difference of the MA conversion on the M/CeO2−δ catalysts cannot only be attributed to the particle size or metal dispersion effects because the activity difference is much more significant. We speculate that there exist other factors, such as the intrinsic properties (e.g., electronic configuration) of individual metals, M-support interaction and Ovac amount, to influence the catalytic performance synergistically.
Figure 7B presents the curves of −ln(1 − XMA) versus time within the first 60 min, which are fitted according to the first order kinetic law in terms of MA conversion on the metal-based catalysts [17]. The linear kinetic plots over Ni/CeO2−δ and Co/CeO2−δ catalysts suggest that the C=C hydrogenation follows the quasi-first order reaction in terms of MA conversion, while the nonlinear kinetic plot on Cu/CeO2−δ reflects that its initial hydrogenation follows a complicated kinetic mechanism. The MA hydrogenation rate coefficients (k1) on the Ni/CeO2−δ and Co/CeO2−δ catalysts are determined according to the gradients of their linear plots and summarised in Table 2. The k for Ni/CeO2−δ is much greater than that for Co/CeO2−δ, indicating that metallic Ni/CeO2−δ is more reactive than Co/CeO2−δ.
In principle, the electronic configurations of the active metals are profound in the activation of MA for the hydrogenation reaction. The previous DFT simulation demonstrated that the adsorption and activation of MA on the metal surface are primarily controlled by the back-donation of the electron from the metal onto the anti-bonding π* orbital of maleic anhydride [39]. Therefore, the metallic Cu with a full-filled 3d10 electronic configuration without the unpaired electron possesses weaker capability of electron-donation to the MA molecule. In contrast, the unpaired electrons of Co (3d7) and Ni (Ni 3d8) would favour the coordination and activation of MA, thus exhibit much higher activity.
Besides the intrinsic properties, the Ovac is regarded as another factor to enhance the C=C hydrogenation because the Ovac can enrich the electron density of active metals, which promotes the electron-donating ability and promotes H2 dissociation [1,40]. In our cases, the Ni/CeO2−δ catalyst has richer Ovac and, thus, may donate more electrons to metallic Ni in comparison to Co/CeO2−δ. Further, the smaller particle size of Ni (XRD section) also strengthens the short-range electron transferring from Ovac onto the adjacent metal clusters. Hence, the abundant Ovac and the direct or indirect Ovac → M electronic donation are responsible for the fact that Ni/CeO2−δ shows higher activity in MA hydrogenation than Co/CeO2−δ. However, it is noted that Ni/CeO2−δ and Cu/CeO2−δ catalysts have a similar Ovac amount, but different activity in MA hydrogenation, suggesting that the intrinsic electron structure of active metal dominates the MA hydrogenation.
Figure 8A shows the SA selectivity of the M/CeO2−δ catalysts in the prolonged MAH for 8 h. The Cu/CeO2−δ and CeO2−δ catalysts exhibit 100% selectivity to SA in the 8-h continuous MAH, without GBL observed in the products, indicating they are inert for SA hydrogenolysis to GBL. The TOFSA→GBL values over Ni/CeO2−δ, Co/CeO2−δ and Cu/CeO2−δ are 3.08 min−1, 0.87 min−1 and 0, respectively, indicating that Ni/CeO2−δ shows the highest activity in the SA → GBL transformation. It is worth noting that GBL was generated only if MA fully converts to SA on the Ni/CeO2−δ, as evidenced by the SA selectivity over Ni/CeO2−δ, which remains 100% in the initial 40 min MAH time-on-stream before declining due to the following GBL generation. The generation of GBL on Co/CeO2−δ also commences while the conversion of MA to SA is completing. GBL yields (Figure 8B) reach ~25% on Ni/CeO2−δ and ~5% on Co/CeO2−δ in 6 h, which are much slower than the MA → SA transformation. The results suggest that MAH on the M/CeO2−δ is a multiple-step process: MAH to SA occurs first and rapidly, while GBL generates from the hydrogenolysis of SA only if no MA exists in the system. A similar phenomenon has been observed on the TiO2-supported Ni-based catalysts by Torres et al. [17].
Owing to the complexity of the MAH reaction, its hydrogenation mechanism has not been explicated in the literature, in particular for the M/CeO2−δ systems, although the theoretical and experimental understanding of H2 adsorption, activation and cycling on CeO2 and noble metals was attempted for a variety of redox reactions [38,41]. Even fewer investigations of MA adsorption and hydrogenation over noble metals are openly accessible [39,42]. However, on the basis of our experimental characterization data and the reported fundamental data regarding MAH reaction thermodynamics and kinetics, we may explicitly rationalize the stepwise MAH with a distinct reaction rate and selectivity on the M/CeO2−δ catalyst systems.
The preferential hydrogenation of C=C bonds rather than C=O groups in the initial MAH stage can be implicitly interpreted from kinetics and thermodynamic perspectives. The possible reaction routes for MAH to SA and GBL can be written as:
MA + H2 = SA ΔHMA→SA = −133.8 kJ/mol
SA + 2H2 = GBL + H2O ΔHSA→GBL = −108.7 kJ/mol
MA + 3H2 = GBL + H2O ΔHMA→GBL = −241.7 kJ/mol
Here, the free enthalpy change data of ΔHMA→SA and ΔHSA→GBL are adopted from the literature [43], while the ΔHMA→GBL of Global Reaction (3) is calculated applying Hess’s law to Reactions (1) and (2). Since the molecule kinetic characteristics determine the rate and selectivity, the MA → SA transformation would be more favourable and faster than the SA → GBL and MA → GBL transformations that involve more H2 molecules than the former reaction. This interpretation is well evidenced by the fact that the GBL generation initiates only if complete MA → SA transformation on the M/CeO2−δ catalyst systems occurs, which also reveals that Reaction (3) is least viable on all of the catalysts investigated. Indeed, it was claimed that the C=C group is kinetically more active than the C=O group [44].
As for the distinct selectivity of the chosen M/CeO2−δ systems, we suppose that their different surface electron configurations of the catalysts, particularly the metal d orbitals, play essential roles, because the overall hydrogenation reaction is usually determined by H2 activation on the catalysts [42,45]. This argument is also evidenced by our TPD data (Figure 6 and Table 2) where the Cu/CeO2−δ displays a smaller amount of β and γ hydrogen, namely the weaker ability to activate hydrogen. For the transformation of SA → GBL, the adsorption of the C=O group was also considered to be of profound importance for the hydrogenolysis process [46]. The closed d10 shell of metal Cu is not beneficial to C=O hydrogenolysis due to its low interstitial electron density and weak energy for adsorption and activation of the C=O group [47]. In contrast, metallic Ni and Co with partially filled d-orbitals are prone to coordinate with the C=O groups of organic adsorbates and thus facilitate C=O hydrogenolysis [47].
The beneficial contributions of Ovac in C=O hydrogenolysis have been widely accepted [48,49]. The Ovac in the non-stoichiometric oxides, such as ZnO1−x [50] and CeO2−x [1], can polarise and activate the C=O group and thus reduce the energy barrier of C=O conversion to display reasonable hydrogenolysis selectivity. In this work, the amount of Ovac of the Ni/CeO2−δ catalyst is about 1.5-times that in the Co/CeO2−δ catalyst, suggesting that Ni/CeO2−δ catalyst can offer more active sites for C=O activation. However, the calculated TOFSA→GBL of Ni/CeO2−δ is nearly triple that of Co/CeO2−δ, which is larger than the relative Ovac ratio between the two catalysts. Therefore, the electronic configuration of the active metal is the key factor to determine the catalytic hydrogenolysis of SA to GBL, while Ovac can facilitate C=O conversion on Ni/CeO2−δ due to the electron-donating and selective adsorption effects.

3. Materials and Methods

All chemical reagents, Ce(NO3)3·6H2O, Ni(NO3)2·6H2O, Cu(NO3)2·3H2O, Co(NO3)2·6H2O and citric acid (CA). purchased from the Sinopharm Chemical Reagent Co., Ltd. (Shanghai, China), were analytic grade and used as-purchased without pre-purification.

3.1. Ceria Support Preparation

Ceria supports were prepared by the sol-gel process. First, 5.00 g Ce(NO3)3·6H2O were dissolved in 20 mL deionized water containing 6.56 g CA under rigorous stirring. The solution was heated in a water bath at 80 °C until a porous dry gel was obtained. During this process, the colourless solution became light yellow and finally brown. The obtained gel was then dried at 120 °C for 8 h to form a spongy material, which is subject to calcination for 3 h at 500 °C with a heating ramp of 3 °C/min. The resulting cerium oxide was used as the support to prepare the corresponding catalysts.

3.2. M/CeO2−δ (M = Co, Ni and Cu) Catalysts Preparation

The M/CeO2−δ (M = Co, Ni, Cu) catalysts (metal loading = 10 wt %) were prepared by an incipient wetness impregnation method as reported in our previous research paper [1]. For the preparation of the Ni/CeO2−δ catalyst, 1.01 g Ni(NO3)2·6H2O were dissolved in 10 mL of the ethanol/DI water (1:1 volumetric ratio) solution, and then, 2.00 g of CeO2 support were added into the mixed solution. The mixed solution was heated on a hotplate at 80 °C under rigorous stirring to evaporate the solvent before drying at 120 °C for 8 h in a convection oven. The obtained sample was calcined at 450 °C for 3 h in a muffle furnace with the heating ramp of 3 °C/min. The received oxide sample was reduced at 350 °C (heating ramp of 2 °C/min) in H2 flow for 3 h to obtain the Ni/CeO2−δ catalyst for MA hydrogenation. The Cu/CeO2−δ and Co/CeO2−δ catalysts were prepared using a similar procedure, but Cu/CeO2−δ and Co/CeO2−δ were reduced at 250 °C and 450 °C, respectively, which ensured that all of the transition metal species fully reduced at the optimum temperature as determined by H2-TPR.

3.3. Catalyst Characterizations

X-ray diffraction data were acquired by powder X-ray diffraction using a D8 Advance (Bruker, Billerica, MA, USA) (Cu Kα1 radiation, λ = 0.15418 nm) equipped with a Vantec detector and Ni filter. Data were collected between 10° and 80° 2θ degrees via a continuous scan mode with a scanning rate at 4°/min. The mean crystallite size oof the pertinent species were calculated employing the Scherrer equation: D = k λ / ( β cosθ), where k is 0.9, β is the full width of the diffraction line at half of the miximum intensity and θ is the diffraction angle. The Ni loading of the catalysts was carried out by means of inductively-coupled plasma (ICP) spectroscopy with the iCAP 7400 ICP-OES (Thermo Fisher Scientific, Waltham, MA, USA) equipment. The Raman spectrum was recorded on a LabRAM HR Evolution Raman microscope with a laser wavelength of 532 nm (HORIBA, Tokyo, Japan) for surface characterization. The morphology of the materials was visualized using a JEOL JEM-2010 transmission electron microscope (TEM) (JEOL, Tokyo, Japan) operated at 120.0 kV. The samples were dispersed in ethanol assisted by the ultrasonic technique.
Hydrogen-temperature programed reduction (H2-TPR) experiments were performed using the Micromeritics AutoChem II 2950 system (Norcross, GA, USA) equipped with a thermal conductivity detector (TCD). Typically, 30 mg of catalyst were first degassed at 300 °C for 1 h with argon flushing. After cooling down to ambient temperature in argon, H2/Ar (10 vol % H2) at a flow rate of 50 mL/min was passed through the catalysts, and the TPR profiles were recorded from 50 to 800 °C at a ramp of 10 °C/min. The output signal of the gas mixture was measured continuously using the TCD as a function of temperature.
Hydrogen temperature programmed desorption (H2-TPD) measurements were carried out on the same apparatus as TPR. In the H2-TPD test, 100 mg catalyst were first reduced in situ at 350 °C for 1 h in pure H2, followed by purging with Ar for 1 h at 360 °C to remove the excess hydrogen adsorbed on the surface and cooling down to 50 °C in Ar flow. Then, 10 vol % H2 in Ar was injected until saturation at 50 °C and then purged with Ar until the baseline was stable, prior to carrying out TPD up to 600 °C at a heating rate of 10 °C/min. Ag2O was taken as the standard material to correlate the peak areas to volume data.

3.4. Catalyst Test

Liquid-phase hydrogenation of MA was carried out over M/CeO2−δ catalysts in a batch reactor at 210 °C and 5 MPa. The reduced catalysts (0.1 g) and MA (4.9 g) were put in an autoclave (100 mL) containing THF (40 mL) solvent and purged five times with nitrogen to remove air before pressurizing up to 4.0 MPa using hydrogen. The diffusional limitation including internal and external diffusion were ruled out by performing experiments varying the particles size of the catalyst (0.425–0.250 mm) and adjusting the string rate of 500 rpm. Simultaneously, the hydrogen pressure was raised up to and maintained at 5.0 MPa. The reaction effluents were analysed using a 7890A gas chromatograph (Agilent, Santa Clara, CA, USA) equipped with an SE-52 (30 m × 0.32 mm × 1.0 μm) capillary column and a flame ionization detector (FID). The programmed temperature from 100 °C–120 °C with a ramp of 5 °C/min was used to ensure complete separation of individual components in the effluents. The temperatures of the injector and detector were set at 260 °C and 190 °C, respectively.
MA conversion and yield of the product were calculated according to the following equations:
XMA (%) = (CSA + CGBL)/(CMA + CSA + CGBL) × 100%
SMA (%) = (CSA + CGBL)/(CSA + CGBL) × 100%
YSA (%) = CSA/(CMA + CSA + CGBL) × 100%
YGBL (%) = CGBL/(CMA + CSA + CGBL) × 100%
where CMA, CSA and CGBL represent the percent content of the reactant and products in the reaction effluent, respectively. XMA, SSA, YSA and YGBL represent the MA conversion, SA selectivity and the SA and GBL yields.
The turnover frequency (TOF) of the MA hydrogenation to SA (in the first 10 min) and the subsequent hydrogenation of SA to GBL (in the following 60 min) were calculated using the following formulae:
TOFMA→SA = n(MAint.) × XMA/(t × n(Msurf.))
TOFSA−GBL = n(MAint.) × YGBL/(t × n(Msurf.))
where n(MAint.) denotes the initial amount of MA in mol, XMA the conversion of MA, YGBL the yield of GBL (%), t the reaction time (min) and n(Msurf.) the surface metallic M atom number on the corresponding catalyst.

4. Conclusions

Ni/CeO2−δ, Co/CeO2−δ and Cu/CeO2−δ catalysts for maleic anhydride hydrogenation were prepared via a simple wet impregnation synthesis and well characterised applying XRD, TEM, Raman, TPR and TPD techniques, in order to unravel the dependence of the MAH performance over the redox properties and their M-CeO2−δ interaction and, thus, guide the future design of robust and highly selective transition metal catalysts for MAH.
It was found that metal dispersion of M/CeO2−δ catalysts declines as Ni/CeO2−δ > Co/CeO2−δ > Cu/CeO2−δ, in opposition to the order of metal crystallite sizes. The small metal crystallite sizes of the M/CeO2−δ catalysts are found proportional to their oxide precursors, revealing that the strong MOx-CeO2 interaction plays a crucial role in governing the metal dispersion and particle sizes of the M/CeO2−δ catalysts.
The Ovac concentrations in the M/CeO2−δ catalysts are observed to be enhanced one magnitude relative to CeO2−δ, in the increasing sequence of Cu/CeO2−δ > Ni/CeO2−δ > Co/CeO2−δ >> CeO2−δ. The increased Ovac concentration in M/CeO2−δ is mainly due to the H2 spillover from the metals to ceria, which favours the creation of Ovac in the ceria matrices. The H2 reduction-induced metal exit from ceria matrices, sintering and Ovac is responsible for the increased crystallite size of the CeO2−δ support.
The CeO2−δ itself is evidenced an active support for SA generation since it shows notable activity in MAH to SA, yet is inert in SA hydrogenolysis to GBL. The metal loading greatly enhances the MAH activity and the SA selectivity on the M/CeO2−δ catalysts. The apparent activity and turn over frequencies of MAH to SA (TOFMA→SA) increase following the trend of Ni/CeO2−δ > Co/CeO2−δ > Cu/CeO2−δ >> CeO2−δ. Among the examined catalysts, the Ni/CeO2−δ displays the highest activity and selectivity to SA in the initial 40 min and the following SA hydrogenolysis to GBL. TOFMA→SA (61.7 min−1) on Ni/CeO2−δ is twice- and five-times those on Co/CeO2−δ (TOFMA→SA = 31.2 min−1) and Cu/CeO2−δ (TOFMA→SA = 13.2 min−1), respectively. Ni/CeO2−δ also possesses higher activity and selectivity than Co/CeO2−δ in SA → GBL. The SA hydrogenolysis to GBL occurs on Ni/CeO2−δ and Co/CeO2−δ catalysts only when the conversion to SA completes, though no SA hydrogenolysis is observed on the Cu/CeO2−δ and CeO2−δ catalysts.
The MAH to SA on the Ni/CeO2−δ, Co/CeO2−δ and CeO2−δ catalysts follows the first order kinetic law, but Cu/CeO2−δ displays a more complex kinetic mechanism. CeO2−δ may catalyse MAH to SA and favours the MAH on Ni/CeO2−δ, though Ovac is not a dominant factor for the enhanced MAH performance, as shown by the facts that both CeO2−δ and Cu/CeO2−δ are inert in SA hydrogenolysis and the Ovac-richest Cu/CeO2−δ is not robust in SA generation. The electronic configurations of the metals are supposed crucial for the activation of H2, MA and SA in the MAH. Therefore, the distinct catalytic hydrogenation behaviour on the catalysts arises from the synergistic contributions of the metal dispersion, Ovac concentration and the metal electronic configurations, which determine the activation of hydrogen and double bonds in MA and SA.

Supplementary Materials

The following are available online at www.mdpi.com/2073-4344/7/9/272/s1, Figure S1: The dependence of metal crystallite sizes on those of metal oxides in the xNi/CeO2−δ catalysts (x represents the loading amount (wt %) of Ni in the xNi/CeO2−δ catalysts).

Acknowledgments

This work was partially supported by the Natural Science Foundation of China (No. 21503124), the Key Coal Technologies R&D Program of Shanxi Province (No. MH2014-06), the Science and Technology Program of Shanxi Province (No. 20140321013-02) and the Royal Society International collaboration award. X.L. appreciates the Eustice studentship from Southampton University. We sincerely appreciate Dr Kevin Chung-che Huang (Optical Research Centre, University of Southampton) for his kind help in Raman characterization.

Author Contributions

The idea was conceived of by Y.Z. and Z.J. X.L. performed the experiments and drafted the paper under the supervision of Y.Z., Z.J. and M.H. L.Z. and Y.Z. helped to collect and analyse some characterization data. The manuscript was revised through the comments of all authors. All authors have given approval for the final version of the manuscript.

Conflicts of Interest

The authors declare no conflict of interest.

References

  1. Liao, X.; Zhang, Y.; Hill, M.; Xia, X.; Zhao, Y.; Jiang, Z. Highly efficient Ni/CeO2 catalyst for the liquid phase hydrogenation of maleic anhydride. Appl. Catal. A 2014, 488, 256–264. [Google Scholar] [CrossRef]
  2. Bertone, M.E.; Meyer, C.I.; Regenhardt, S.A.; Sebastian, V.; Garetto, T.F.; Marchi, A.J. Highly selective conversion of maleic anhydride to γ-butyrolactone over Ni-supported catalysts prepared by precipitation–deposition method. Appl. Catal. A Gen. 2015, 503, 135–146. [Google Scholar] [CrossRef]
  3. Meyer, C.I.; Regenhardt, S.A.; Marchi, A.J.; Garetto, T.F. Gas phase hydrogenation of maleic anhydride at low pressure over silica-supported cobalt and nickel catalysts. Appl. Catal. A 2012, 417–418, 59–65. [Google Scholar] [CrossRef]
  4. Delhomme, C.; Weuster-Botz, D.; Kühn, F.E. Succinic acid from renewable resources as a C4 building-block chemical—A review of the catalytic possibilities in aqueous media. Green Chem. 2009, 11, 13–26. [Google Scholar] [CrossRef]
  5. Castiglioni, G.; Vaccari, A.; Fierro, G.; Inversi, M.; Lojacono, M.; Minelli, G.; Pettiti, I.; Porta, P.; Gazzano, M. Structure and reactivity of copper-zinc-cadmium chromite catalysts. Appl. Catal. A 1995, 123, 123–144. [Google Scholar] [CrossRef]
  6. Regenhardt, S.A.; Meyer, C.I.; Garetto, T.F.; Marchi, A.J. Selective gas phase hydrogenation of maleic anhydride over Ni-supported catalysts: Effect of support on the catalytic performance. Appl. Catal. A 2012, 449, 81–87. [Google Scholar] [CrossRef]
  7. Castiglioni, G.L.; Ferrari, M.; Guercio, A.; Vaccari, A.; Lancia, R.; Fumagalli, C. Chromium-free catalysts for selective vapor phase hydrogenation of maleic anhydride to γ-butyrolactone. Catal. Today 1996, 27, 181–186. [Google Scholar] [CrossRef]
  8. Zhang, D.; Yin, H.; Xue, J.; Ge, C.; Jiang, T.; Yu, L.; Shen, Y. Selective hydrogenation of maleic anhydride to tetrahydrofuran over Cu–Zn–M (M = Al, Ti, Zr) catalysts using ethanol as a solvent. Ind. Eng. Chem. Res. 2009, 48, 11220–11224. [Google Scholar] [CrossRef]
  9. Meyer, C.I.; Marchi, A.J.; Monzon, A.; Garetto, T.F. Deactivation and regeneration of Cu/SiO2 catalyst in the hydrogenation of maleic anhydride. Kinetic modeling. Appl. Catal. A Gen. 2009, 367, 122–129. [Google Scholar] [CrossRef]
  10. Bertone, M.E.; Regenhardt, S.A.; Meyer, C.I.; Sebastian, V.; Garetto, T.F.; Marchi, A.J. Highly selective Cu-modified Ni/SiO2–Al2O3 catalysts for the conversion of maleic anhydride to γ-butyrolactone in gas phase. Top. Catal. 2015, 59, 159–167. [Google Scholar] [CrossRef]
  11. Li, J.; Qian, L.-P.; Hu, L.-Y.; Yue, B.; He, H.-Y. Low-temperature hydrogenation of maleic anhydride to succinic anhydride and γ-butyrolactone over pseudo-boehmite derived alumina supported metal (metal=Cu, Co and Ni) catalysts. Chin. Chem. Lett. 2016, 27, 1004–1008. [Google Scholar] [CrossRef]
  12. Yu, Y.; Guo, Y.; Zhan, W.; Guo, Y.; Wang, Y.; Wang, Y.; Zhang, Z.; Lu, G. Gas-phase hydrogenation of maleic anhydride to γ-butyrolactone at atmospheric pressure over Cu–CeO2–Al2O3 catalyst. J. Mol. Catal. A Chem. 2011, 337, 77–81. [Google Scholar] [CrossRef]
  13. Lu, W.; Lu, G.; Guo, Y.; Guo, Y.; Wang, Y. Gas-phase hydrogenation of maleic anhydride to butyric acid over Cu/TiO2/γ-Al2O3 catalyst promoted by Pd. Catal. Commun. 2003, 4, 177–181. [Google Scholar] [CrossRef]
  14. Gao, C.-G.; Zhao, Y.-X.; Zhang, Y.; Liu, D.-S. Synthesis characterization and catalytic evaluation of Ni/ZrO2/SiO2 aerogels catalysts. J. Sol-Gel Sci. Technol. 2007, 44, 145–151. [Google Scholar] [CrossRef]
  15. Zhang, D.; Yin, H.; Zhang, R.; Xue, J.; Jiang, T. Gas phase hydrogenation of maleic anhydride to γ-butyrolactone by cu–zn–ce catalyst in the presence of n-butanol. Catal. Lett. 2007, 122, 176–182. [Google Scholar] [CrossRef]
  16. Zhang, R.; Yin, H.; Zhang, D.; Qi, L.; Lu, H.; Shen, Y.; Jiang, T. Gas phase hydrogenation of maleic anhydride to tetrahydrofuran by Cu/ZnO/TiO2 catalysts in the presence of n-butanol. Chem. Eng. J. 2008, 140, 488–496. [Google Scholar] [CrossRef]
  17. Torres, C.C.; Alderete, J.B.; Mella, C.; Pawelec, B. Maleic anhydride hydrogenation to succinic anhydride over mesoporous Ni/TiO2 catalysts: Effects of Ni loading and temperature. J. Mol. Catal. A Chem. 2016, 423, 441–448. [Google Scholar] [CrossRef]
  18. Bruix, A.; Rodriguez, J.A.; Ramirez, P.J.; Senanayake, S.D.; Evans, J.; Park, J.B.; Stacchiola, D.; Liu, P.; Hrbek, J.; Illas, F. A new type of strong metal-support interaction and the production of H2 through the transformation of water on Pt/CeO2(111) and Pt/CeOx/TiO2(110) catalysts. J. Am. Chem. Soc. 2012, 134, 8968–8974. [Google Scholar] [CrossRef] [PubMed]
  19. Campbell, C.T. Catalyst-support interactions: Electronic perturbations. Nat. Chem. 2012, 4, 597–598. [Google Scholar] [CrossRef] [PubMed]
  20. Farmer, J.A.; Campbell, C.T. Ceria maintains smaller metal catalyst particles by strong metal-support bonding. Science 2010, 329, 933–936. [Google Scholar] [CrossRef] [PubMed]
  21. Carrasco, J.; Lopez-Duran, D.; Liu, Z.; Duchon, T.; Evans, J.; Senanayake, S.D.; Crumlin, E.J.; Matolin, V.; Rodriguez, J.A.; Ganduglia-Pirovano, M.V. In situ and theoretical studies for the dissociation of water on an active Ni/CeO2 catalyst: Importance of strong metal-support interactions for the cleavage of O-H bonds. Angew. Chem. Int. Ed. Engl. 2015, 54, 3917–3921. [Google Scholar] [CrossRef] [PubMed]
  22. Sakai, M.; Nagai, Y.; Aoki, Y.; Takahashi, N. Investigation into the catalytic reduction of NOx at copper–ceria interface active sites. Appl. Catal. A 2016, 510, 57–63. [Google Scholar] [CrossRef]
  23. Wang, F.; He, S.; Chen, H.; Wang, B.; Zheng, L.; Wei, M.; Evans, D.G.; Duan, X. Active site dependent reaction mechanism over Ru/CeO2 catalyst toward CO2 methanation. J. Am. Chem. Soc. 2016, 138, 6298–6305. [Google Scholar] [CrossRef] [PubMed]
  24. Kehoe, A.B.; Scanlon, D.O.; Watson, G.W. Role of lattice distortions in the oxygen storage capacity of divalently doped CeO2. Chem. Mater. 2011, 23, 4464–4468. [Google Scholar] [CrossRef]
  25. Liu, Y.; Murata, K.; Inaba, M. Steam reforming of bio-ethanol to produce hydrogen over Co/CeO2 catalysts derived from Ce1−xCoxO2−y precursors. Catalysts 2016, 6, 26. [Google Scholar] [CrossRef]
  26. Cui, Y.; Dai, W.-L. Support morphology and crystal plane effect of Cu/CeO2 nanomaterial on the physicochemical and catalytic properties for carbonate hydrogenation. Catal. Sci. Technol. 2016, 6, 7752–7762. [Google Scholar] [CrossRef]
  27. Sohlberg, K.; Pantelides, S.T.; Pennycook, S.J. Interactions of hydrogen with CeO2. J. Am. Chem. Soc. 2001, 123, 6609–6611. [Google Scholar] [CrossRef] [PubMed]
  28. Shan, W.; Shen, W.; Li, C. Structural characteristics and redox behaviors of Ce1−xCuxOy solid solutions. Chem. Mater. 2003, 15, 4761–4767. [Google Scholar] [CrossRef]
  29. Tang, K.; Liu, W.; Li, J.; Guo, J.; Zhang, J.; Wang, S.; Niu, S.; Yang, Y. The effect of exposed facets of ceria to the nickel species in nickel-ceria catalysts and their performance in a NO + CO reaction. ACS Appl. Mater. Interfaces 2015, 7, 26839–26849. [Google Scholar] [CrossRef] [PubMed]
  30. Greluk, M.; Rotko, M.; Machocki, A. Conversion of ethanol over Co/CeO2 and K-Co/CeO2 catalysts for hydrogen production. Catal. Lett. 2015, 146, 163–173. [Google Scholar] [CrossRef]
  31. De Lima, S.M.; da Silva, A.M.; da Costa, L.O.O.; Graham, U.M.; Jacobs, G.; Davis, B.H.; Mattos, L.V.; Noronha, F.B. Study of catalyst deactivation and reaction mechanism of steam reforming, partial oxidation, and oxidative steam reforming of ethanol over Co/CeO2 catalyst. J. Catal. 2009, 268, 268–281. [Google Scholar] [CrossRef]
  32. Tang, X.; Zhang, B.; Li, Y.; Xu, Y.; Xin, Q.; Shen, W. Carbon monoxide oxidation over CuO/CeO2 catalysts. Catal. Today 2004, 93–95, 191–198. [Google Scholar] [CrossRef]
  33. Matte, L.P.; Kilian, A.S.; Luza, L.; Alves, M.C.M.; Morais, J.; Baptista, D.L.; Dupont, J.; Bernardi, F. Influence of the CeO2 support on the reduction properties of Cu/CeO2 and Ni/CeO2 nanoparticles. J. Phys. Chem. C 2015, 119, 26459–26470. [Google Scholar] [CrossRef]
  34. Spanier, J.E.; Robinson, R.D.; Zhang, F.; Chan, S.-W.; Herman, I.P. Size-dependent properties of CeO2−y nanoparticles as studied by raman scattering. Phys. Rev. B 2001, 64, 245407. [Google Scholar] [CrossRef]
  35. Wu, Z.; Li, M.; Howe, J.; Meyer, H.M.; Overbury, S.H. Probing defect sites on CeO2 nanocrystals with well-defined surface planes by raman spectroscopy and O2 adsorption. Langmuir ACS J. Surf. Coll. 2010, 26, 16595–16606. [Google Scholar] [CrossRef] [PubMed]
  36. Liu, J.; Li, C.; Wang, F.; He, S.; Chen, H.; Zhao, Y.; Wei, M.; Evans, D.G.; Duan, X. Enhanced low-temperature activity of CO2 methanation over highly-dispersed Ni/TiO2 catalyst. Catal. Sci. Technol. 2013, 3, 2627. [Google Scholar] [CrossRef]
  37. Znak, L.; Zieliński, J. Effects of support on hydrogen adsorption/desorption on nickel. Appl. Catal. A 2008, 334, 268–276. [Google Scholar] [CrossRef]
  38. Hammer, B.; Nørskov, J.K. Electronic factors determining the reactivity of metal surfaces. Surf. Sci. 1995, 343, 211–220. [Google Scholar] [CrossRef]
  39. Pallassana, V.; Neurock, M.; Coulston, G.W. Theoretical density functional analysis of maleic anhydride chemisorption on Pd(111), Re(0001), and bimetallic PdML/Re(0001) and PdML/Mo(110) pseudomorphic overlayers. J. Phys. Chem. B 1999, 103, 8973–8983. [Google Scholar] [CrossRef]
  40. Zhang, S.; Li, J.; Xia, Z.; Wu, C.; Zhang, Z.; Ma, Y.; Qu, Y. Towards highly active Pd/CeO2 for alkene hydrogenation by tuning Pd dispersion and surface properties of the catalysts. Nanoscale 2017, 9, 3140–3149. [Google Scholar] [CrossRef] [PubMed]
  41. Wu, X.P.; Gong, X.Q.; Lu, G. Role of oxygen vacancies in the surface evolution of H at CeO2(111): A charge modification effect. Phys. Chem. Chem. Phys. 2015, 17, 3544–3549. [Google Scholar] [CrossRef] [PubMed]
  42. Pallassana, V.; Neurock, M. First-principles periodic density functional study of the hydrogenation of maleic anhydride to succinic anhydride over palladium(111). J. Phys. Chem. B 2000, 104, 9449–9459. [Google Scholar] [CrossRef]
  43. Pallassana, V.; Neurock, M.; Coulston, G. Towards understanding the mechanism for the selective hydrogenation of maleic anhydride to tetrahydrofuran over palladium. Catal. Today 1999, 50, 589–601. [Google Scholar] [CrossRef]
  44. Claus, P.; Brückner, A.; Mohr, C.; Hofmeister, H. Supported gold nanoparticles from quantum dot to mesoscopic size scale: Effect of electronic and structural properties on catalytic hydrogenation of conjugated functional groups. J. Am. Chem. Soc. 2000, 122, 11430–11439. [Google Scholar] [CrossRef]
  45. Vile, G.; Bridier, B.; Wichert, J.; Perez-Ramirez, J. Ceria in hydrogenation catalysis: High selectivity in the conversion of alkynes to olefins. Angew. Chem. Int. Ed. Engl. 2012, 51, 8620–8623. [Google Scholar] [CrossRef] [PubMed]
  46. Ponec, V. On the role of promoters in hydrogenations on metals; α,β-unsaturated aldehydes and ketones. Appl. Catal. A 1997, 149, 27–48. [Google Scholar] [CrossRef]
  47. Mäki-Arvela, P.; Hájek, J.; Salmi, T.; Murzin, D.Y. Chemoselective hydrogenation of carbonyl compounds over heterogeneous catalysts. Appl. Catal. A 2005, 292, 1–49. [Google Scholar] [CrossRef]
  48. Dandekar, A.; Vannice, M.A. Crotonaldehyde hydrogenation on Pt/TiO2 and Ni/TiO2 SMSI catalysts. J. Catal. 1999, 183, 344–354. [Google Scholar] [CrossRef]
  49. Herrmann, U.; Emig, G. Kinetics and mechanism in the liquid-phase hydrogenation of maleic anhydride and intermediates. Chem. Eng. Technol. 1998, 21, 285–295. [Google Scholar] [CrossRef]
  50. Gil Girol, S.; Strunskus, T.; Muhler, M.; Wöll, C. Reactivity of ZnO surfaces toward maleic anhydride. J. Phys. Chem. B 2004, 108, 13736–13745. [Google Scholar] [CrossRef]
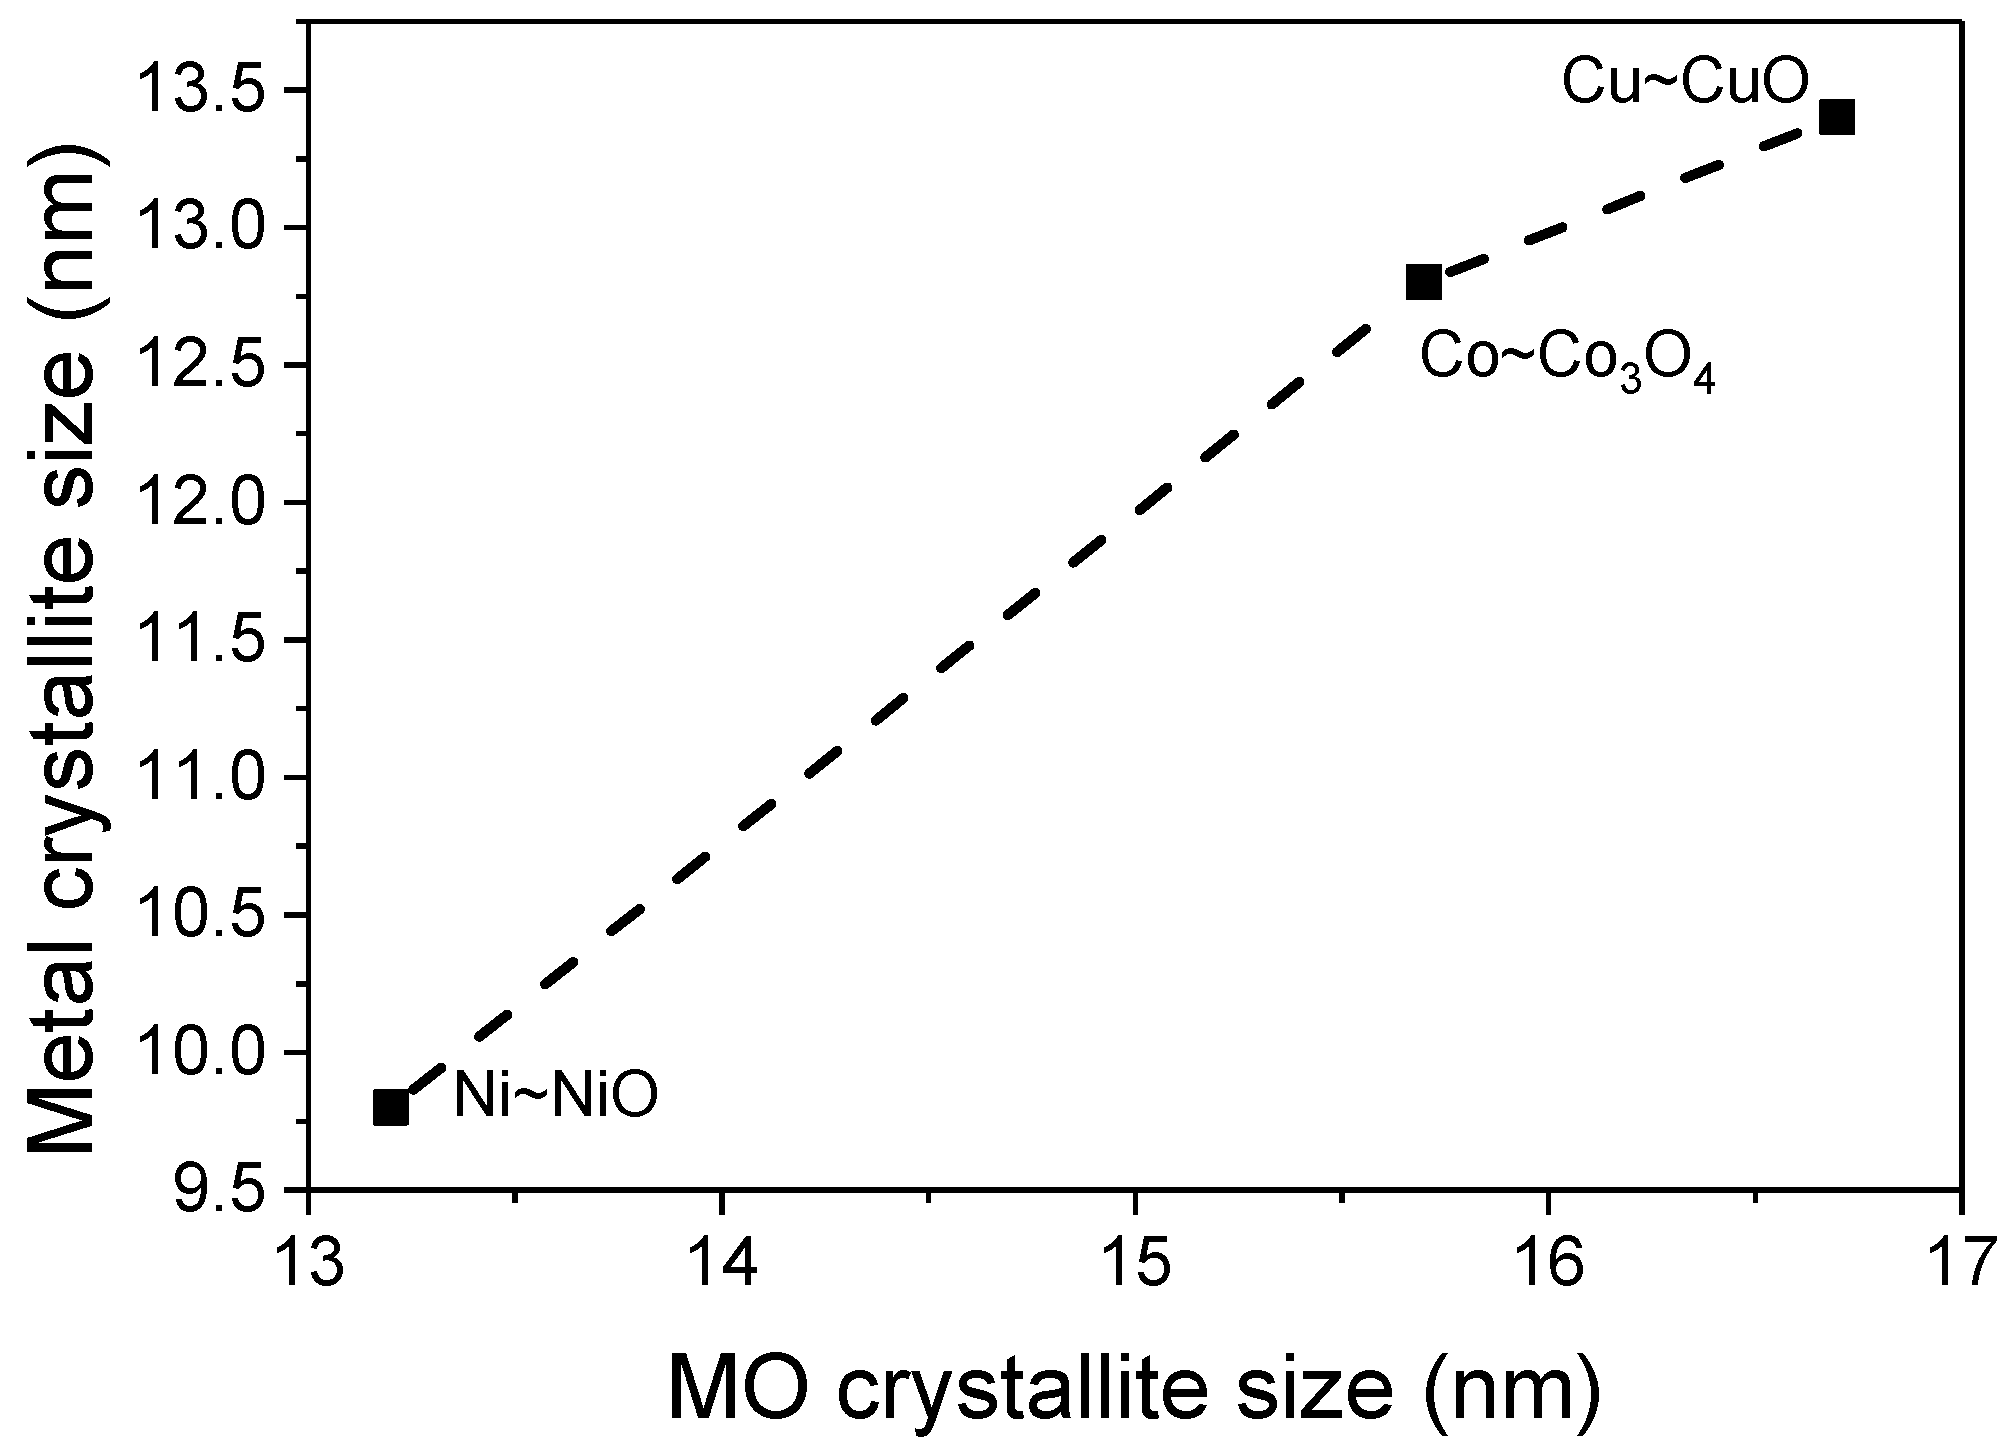
Figure 1. XRD pattern of (A) the MOx/CeO2 precursors and (B) the M/CeO2−δ catalysts (M = Co, Ni, Cu, respectively).
Catalysts 07 00272 g001
Figure 2. The dependence of metal crystallite sizes on those of metal oxides.
Catalysts 07 00272 g002
Figure 3. TEM images of M/CeO2−δ samples. (A) Co/CeO2−δ; (B) Ni/CeO2−δ and (C) Cu/CeO2−δ.
Catalysts 07 00272 g003
Figure 4. The H2-temperature-programmed reduction (TPR) profiles of MOx/CeO2 samples.
Catalysts 07 00272 g004
Figure 5. Raman spectra of the MOx/CeO2 precursors (A) and the reduced M/CeO2−δ catalysts (B). The inserted zoom-in figures underline the existence of 2LO bands.
Catalysts 07 00272 g005
Figure 6. H2 temperature programmed desorption (TPD) profiles of CeO2−δ and M/CeO2−δ catalysts.
Catalysts 07 00272 g006
Figure 7. (A) The conversion of maleic anhydride (MA) and (B) the kinetic curves of the M/CeO2−δ catalysts.
Catalysts 07 00272 g007
Figure 8. (A) The selectivity of succinic anhydride (SA) and (B) the yield of γ-butyrolactone (GBL) over M/CeO2−δ catalysts in the 8 h time.
Catalysts 07 00272 g008
Table 1. The properties of the MOx/CeO2 precursors and corresponding M/CeO2−δ catalysts.
Samplea(CeO2) (nm)a(CeO2−δ) (nm)Loading (wt %)Crystallite Size (nm)
D(CeO2)D(CeO2−δ)D(MOx)D(M)
CeO20.54380.5438-12.512.9--
Co/CeO2−δ0.54300.544210.314.315.215.712.8
Ni/CeO2−δ0.54240.54419.812.516.513.29.8
Cu/CeO2−δ0.54130.54429.713.215.716.713.4
Note: a(CeO2) and a(CeO2−δ) denote the lattice parameter of CeO2 in the MOx/CeO2 and reduced M/CeO2−δ, respectively, calculated using interplanar distance (d) and Miller indices (h k l) in the equation a = d × h 2 + k 2 + l 2 . Metal loading amount was determined by ICP-OES. D(CeO2) and D(CeO2−δ) are the crystalline size of CeO2 in the MOx/CeO2 and M/CeO2−δ; D(MOx) and D(M) denote the crystallite size of metal oxide and metal calculated using the Scherrer equation.
Table 2. H2 uptake, metal dispersion and hydrogenation rate constants on the M/CeO2−δ catalyst.
SampleHα (μmol/g)Hβ (μmol/g)Hγ (μmol/g)Σ(Hβ + Hγ) (μmol/g)ΣH (μmol/g)DM (%)Rate Coefficient, k (min−1)
Co/CeO2−δ17.2824.0411.8435.953.163.90.0588
Ni/CeO2−δ28.3522.614.637.265.554.40.0216
Cu/CeO2−δ28.7414.28.222.452.142.9-
CeO2−δ7.87///7.87/0.0037
Note: DM denotes the metal dispersion, calculated via DM = (Msurf/Mtotal), where Msurf and Mtotal are the amount of surface-exposed metal and total metal loading, respectively. Assuming H/M = 1 and Msurf = 2 × (H2 desorption from metal surface), Msurf can be calculated from the amount of hydrogen (β and γ peaks) uptaken on the metal [1].

