Article

Influence of the Nanostructure of Gallium Oxide Catalysts on Conversion in the Green Synthesis of Carbamates

1
Chemical Engineering Department, University of Tulsa, 800 South Tucker Drive, Tulsa, OK 74104-9700, USA
2
Lalit, Gulmohar Park, Pune 411007, India
*
Author to whom correspondence should be addressed.
Catalysts 2017, 7(12), 372; https://doi.org/10.3390/catal7120372
Submission received: 17 October 2017 / Revised: 22 November 2017 / Accepted: 27 November 2017 / Published: 1 December 2017

Abstract

:
The nanostructure of β-gallium oxide crystals influences the conversion to carbamates; specifically, for the synthesis of alkyl carbamates (like propyl N-octylcarbamate) from CO2 and n-propanol in the absence of phosgene. The nanostructures with variable aspect ratios (length (L)/width (D); from 2 to 18) were prepared by the controlled addition of neutral and cationic surfactants during gallium oxide synthesis. These catalysts displayed selectivities to the corresponding carbamates as high as ~70%, superior to non-nanostructured Ga2O3 catalysts. The conversion was found to be inversely proportional to the square of the relative crystallinity. The catalysts retained their structure and catalytic performance upon recycling.

1. Introduction

Gallium oxide (Ga2O3), displaying basic and acidic sites on its surface [1,2], has been widely used in a number of varied applications. Ga2O3 has been used as ceramic material due to its high melting point of 1900 °C [2]. It behaves as an insulator below 800 °C. At higher temperatures, it exhibits semiconductor properties. The wide bandgap of 4.8 eV has led to its application in various optoelectrical devices [3] such as transparent semiconductors in ultraviolet light-emitting diodes (UV-LEDs) [4], thin-film transistors [5] and gas sensors [6]. Ga2O3 has been widely used as a precursor in the gallium nitride (GaN) synthesis via chemical vapour deposition [7,8]. It has also been used as a catalyst for reduction of nitrogen oxides (NOX) using alkanes [9,10,11], benzene decomposition [12], dehydrogenation of hydrocarbons in the presence of CO2 [13,14,15], and catalytic isomerization and dehydrogenation of fatty acid esters [16]. The amphoteric nature of Ga2O3 has been explored by Fourier-transform infrared spectroscopy (FTIR) and temperature program desorption studies. It was inferred that the acidic sites are more predominant. The adsorption of ammonia on supported Ga2O3 is 10 times higher than that of CO2 [17,18]. The formation of both mono- and bidentate bicarbonate species are formed on coordinatively unsaturated Ga3+ cations during adsorption of CO2 on gallium oxide surfaces [19]. Ga2O3 nanostructures have a high surface area-to-volume ratio. There are several synthetic approaches to prepare these nanostructures such as laser ablation [20,21], molecular beam epitaxy [22], chemical vapor deposition [23,24,25], hydrothermal treatment [26,27,28,29] and plasma-assisted growth methods [30]. Ga2O3 synthesis, in the liquid phase, is usually preceded by GaOOH formation that leads, finally, to Ga2O3 crystals. Different calcination temperatures yield various polymorphs of Ga2O3, amongst which the β-form is the most stable [31]. α-Ga2O3 exists at temperatures below 300 °C while γ-Ga2O3 is stable at temperatures between 300 °C and 800 °C. Above 800 °C, only the β-form is found. All other polymorphs of Ga2O3 get converted to the β-form above 800 °C [28]. The β-Ga2O3 has a monoclinic structure and belongs to the C2/m space group. The lattice parameters a, b, c and β are 1.223 nm, 0.304 nm, 0.58 nm and 103.7°, respectively. The unit cell comprises a total of four Ga2O3 molecules, containing 20 atoms (eight gallium atoms and twelve oxygen atoms). The gallium and oxygen atoms are nonequivalent, with their valences being Ga (I), Ga (II), O (I), O (II) and O (III), which are located at position 4i (x, 0, z) in a symmetry plane [32,33].
Efficient transformation of CO2 to useful chemicals, like carbamates, is of current interest. Carbamates are used in a variety of applications, including polyurethanes, pesticides, fungicides, medicinal drugs and synthetic intermediates. At present, carbamates are commercially manufactured with the use of toxic phosgene and isocyanate intermediates. Alternative, non-phosgene routes to carbamates, like reductive carbonylation (with expensive Pt-group metals), oxidative carbonylation and methoxycarbonylation of amines, all have significant limitations [34]. The reaction of primary amines, CO2 and alkyl halides/alcohols is a benign route to carbamates. Srinivas et al. [34] have already shown that CO2 activation and synthesis of carbamates over solid catalysts are facilitated by the presence of both surface Lewis acid sites and basic sites for CO2 adsorption and activation.
Gallium oxide nanomaterials have potential as catalysts for CO2 conversion to carbamates due to: (1) the presence of Lewis acid sites (Ga3+ ions), 14 in their frameworks; and (2) their moderate CO2 uptake [19]. The surface Lewis acidity of gallium oxide has been related mainly to the presence of coordinatively unsaturated Ga3+ ions [35,36,37] located both at regular surfaces of the metal oxide particles and on defective surface sites (e.g., at edges and corners of small crystals) [38]. CO2 adsorption on Ga3+ surface cations has shown the formation of carbonate and hydrogen–carbonate species [39]. The formation of hydrogen–carbonate species has been explained by a nucleophilic attack of an oxygen atom from an OH group to the carbon atom of a coordinated CO2 species on a neighboring site [40,41,42]. The CO2 uptake has been reported to be 9.1 μmol per gram of Ga2O3 at an equilibrium pressure of around 2.5 kPa [19].
In this paper, we present our results on the hydrothermal synthesis of nanostructured Ga2O3 with varying, controlled aspect ratios by employing cationic and triblock copolymer surfactants. The resultant Ga2O3 catalysts were evaluated as catalysts for the green synthesis of propyl N-octylcarbamate from n-octylamine, CO2 and n-propanol without using the toxic phosgene.

2. Results and Discussion

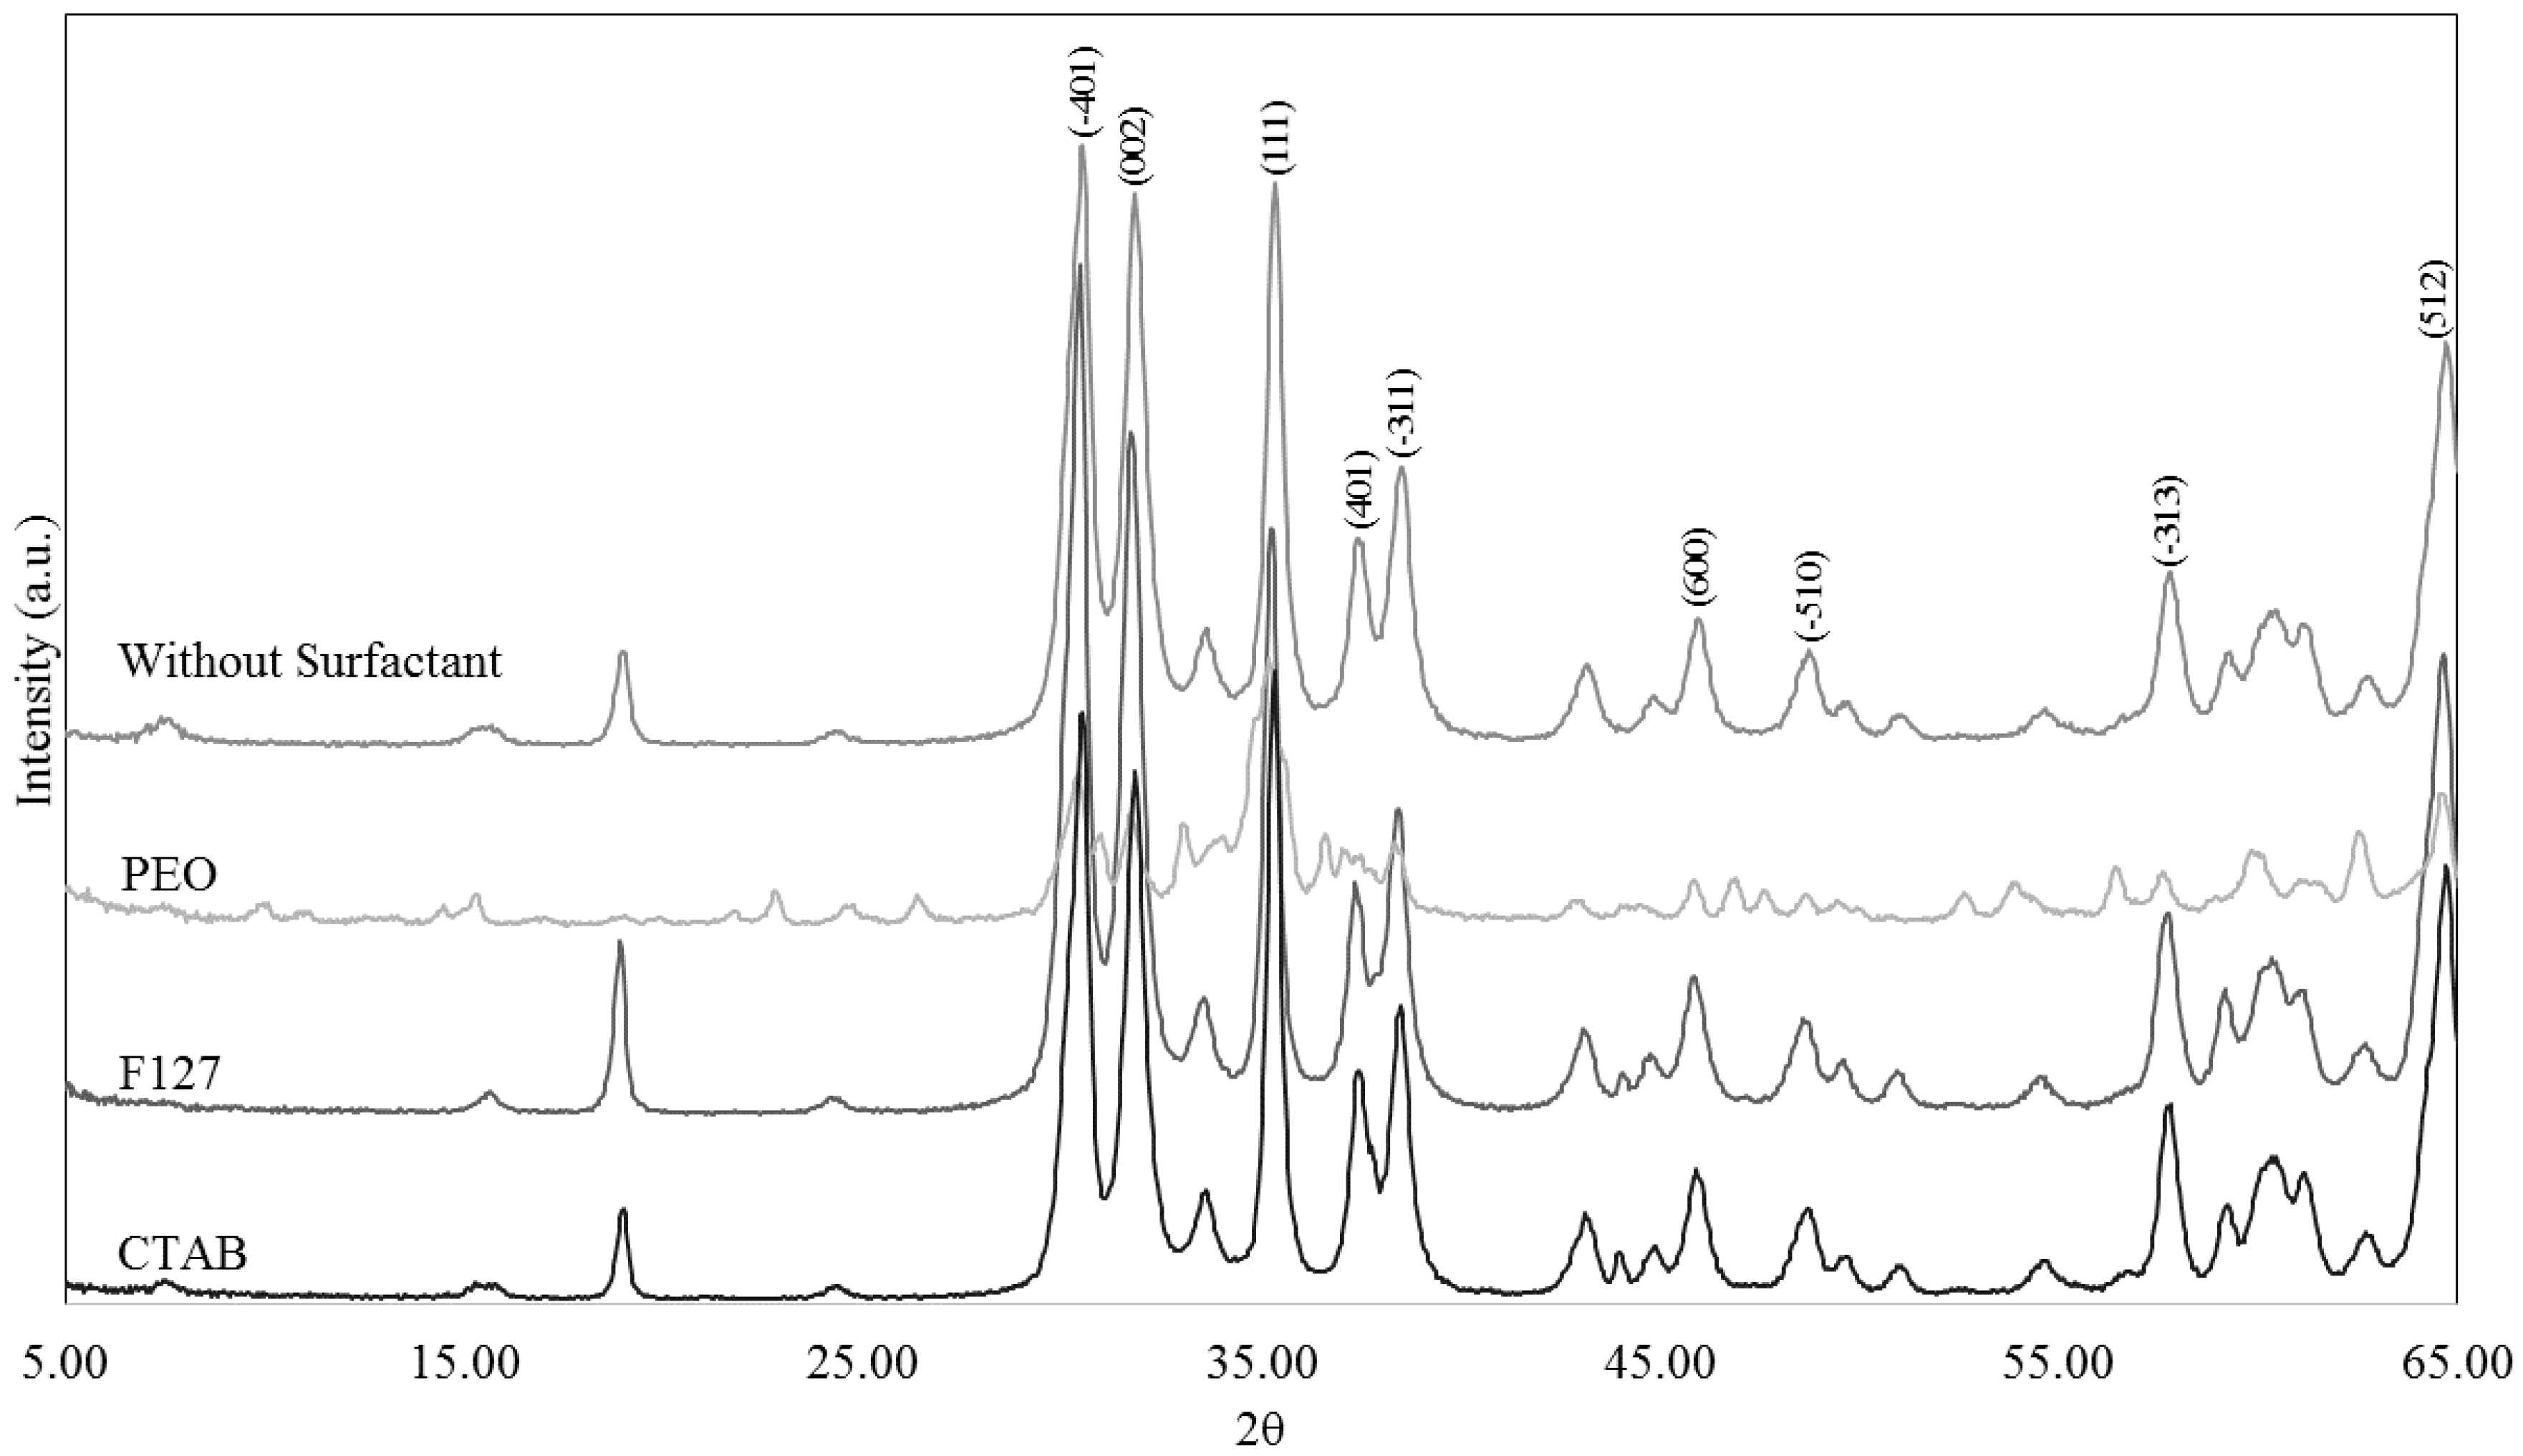
2.1. Catalyst Preparation and Characterization

The pH plays an important role in the formation of the Ga2O3 nanostructures. Gallium oxyhydroxide crystals are obtained only when the pH is maintained between 9 and 10.5 [27]. If the pH is not maintained within this range, the yield of nanostructured Ga2O3 is very low. At pH higher than 10.5, Ga3+ ions are converted to Ga(OH)3, which is water soluble. If the pH is less than 9, the Ga3+ ions are converted to sub-nitrates such as Ga(OH)(NO3)3 and Ga(OH)2NO3, which are also water soluble [27]. We observed an experimental maximum yield of precipitate within a pH range of 8–10.5. We observed an experimental maximum yield of precipitate within a pH range of 9–10.5 irrespective of presence or absence of surfactant. Similar results have been verified by Zhao et al. [27]. The pH value should be between this range so that GaOOH can precipitate irrespective of surfactant use or not. Modification of the precursor:surfactant:solvent molar ratios allowed us to control the length (L)/width (D) aspect ratio of nanostructured gallium oxide, as shown in Figure 1. Figure 1a shows the nanostructures with L/D = 7:1 that were obtained using CTAB (Cetyl Trimethyl Ammonium Bromide) as the surfactant. Figure 1b shows the sample, displaying an average L/D = 11:1, obtained when using F127 (Pluronic F127) as the surfactant. This sample shows a similar aspect ratio to that exhibited by the sample in Figure 1c where no surfactant was employed (Table 1). Finally, the sample obtained when using PEO (Tergitol-S-7) as the surfactant showed the highest aspect ratio of L/D = 24:1 (Figure 1d). Interestingly, the highest aspect ratios were observed when noncharged surfactants (F127 and PEO), or no surfactant, were present in solution. When the charged cationic surfactant (CTAB) was employed, the lowest aspect ratios were observed. This experimental evidence suggests that charged surfactants may play an important role in stabilizing the lowest-energy configuration of all studied particles, which corresponds to the lowest aspect ratio samples. The molar ratios of precursor:surfactant:solvent employed were 1:(0–1.6:)370. Herein, the impact of the surfactant on the aspect ratio is clearly observed.
The BET surface areas for these samples were 29.6 m2/g, 11.1 m2/g, 51.7 m2/g and 23.9 m2/g for the L/D = 7:1 synthesized using CTAB, 11:1 synthesized using F127, 12:1 in the absence of surfactant and 24:1 using PEO, respectively. These samples showed adsorption–desorption isotherms of N2 exhibiting type III behavior, characteristic of macroporous materials. A representative adsorption–desorption isotherm of N2 for the sample synthesized when PEO was employed as surfactant is shown in Figure 2. The samples synthesized with other surfactants displayed similar isotherms (not shown here).
The sample synthesized using PEO showed the highest aspect ratio value. The X-ray Diffraction (XRD) analysis for the gallium oxide nanostructures confirmed the presence of β-Ga2O3 phase (Figure 3). β-Ga2O3 phase has been reported [43] as the most stable form at this high calcination temperature of 900 °C.
In order to further explore the effect of the surfactant over the aspect ratio of the crystallites, we modified the CTAB concentration in the synthesis gel. We focused on CTAB because the gallium oxide nanostructures obtained when using this surfactant were more reproducible with uniform shape and geometry. They were also more homogeneous and the size distribution was over a narrower range compared to those obtained using other surfactants. By changing the precursor:surfactant:solvent ratios in the range 1:(1.6–4.8):740, we were able to change the aspect ratios of the nanostructures when using CTAB. Figure 4a–c shows the effect of an increased surfactant concentration on the final structure of the sample. The samples obtained when using lower concentrations of surfactant (Figure 4a) show an aspect ratio of ~ 2, whereas an increase in the molar concentration of the surfactant leads to an increase of ~ 18; and going further, the most concentrated surfactant sample (Figure 4c) shows an aspect ratio of ~ 4. Figure 4d shows that the sample without surfactant shows cube-like morphology, with similar length and diameter. See Table 2 for precursor:surfactant:solvent ratios for these samples along with calculated aspect ratios.
It is clear from these images that the presence of surfactant allows the control over the nanostructure crystals’ aspect ratio. Our results suggest that the surfactant is acting as a capping agent or crystal growth inhibitor [44] rather than as a structure-directing agent, as in the case of Ga2O3 mesostructures where CTAB is commonly used for that purpose. Typically, in the latter case, the amount of surfactant employed ranges between three and 50 times [45] the amount employed in the present study. In our case, the low concentration of surfactant employed for the synthesis of Ga2O3 nanostructures did not allow the formation of micelles that would act as structure-directing agents. Figure 5 shows the type III adsorption isotherm characteristic of all our catalysts.
The morphology and nanostructure of these materials were studied using transmission electron microscopy (TEM). The powders were prepared by dispersing them on 300-mesh lacey carbon copper-supported TEM grids, and then were studied using a field emission gun FEI Tecnai F20 electron microscope operated at the accelerating voltage of 200 kV. Low magnification TEM imaging of these samples showed crystallite morphology and size distribution consistent with the SEM observations. At the same time, high-resolution TEM (HRTEM) images of crystallites showed lattice planes with d-spacing values consistent with the Ga2O3 structure. Representative HRTEM images from all the four samples are shown in Figure 6 Corresponding d-spacing values, as measured from these images, are: (a) 0.459 nm and 0.303 nm; (b) 0.259 nm, 0.367 nm and 0.586 nm; (c) 0.264 nm and 0.829 nm; and (d) 0.485 nm.

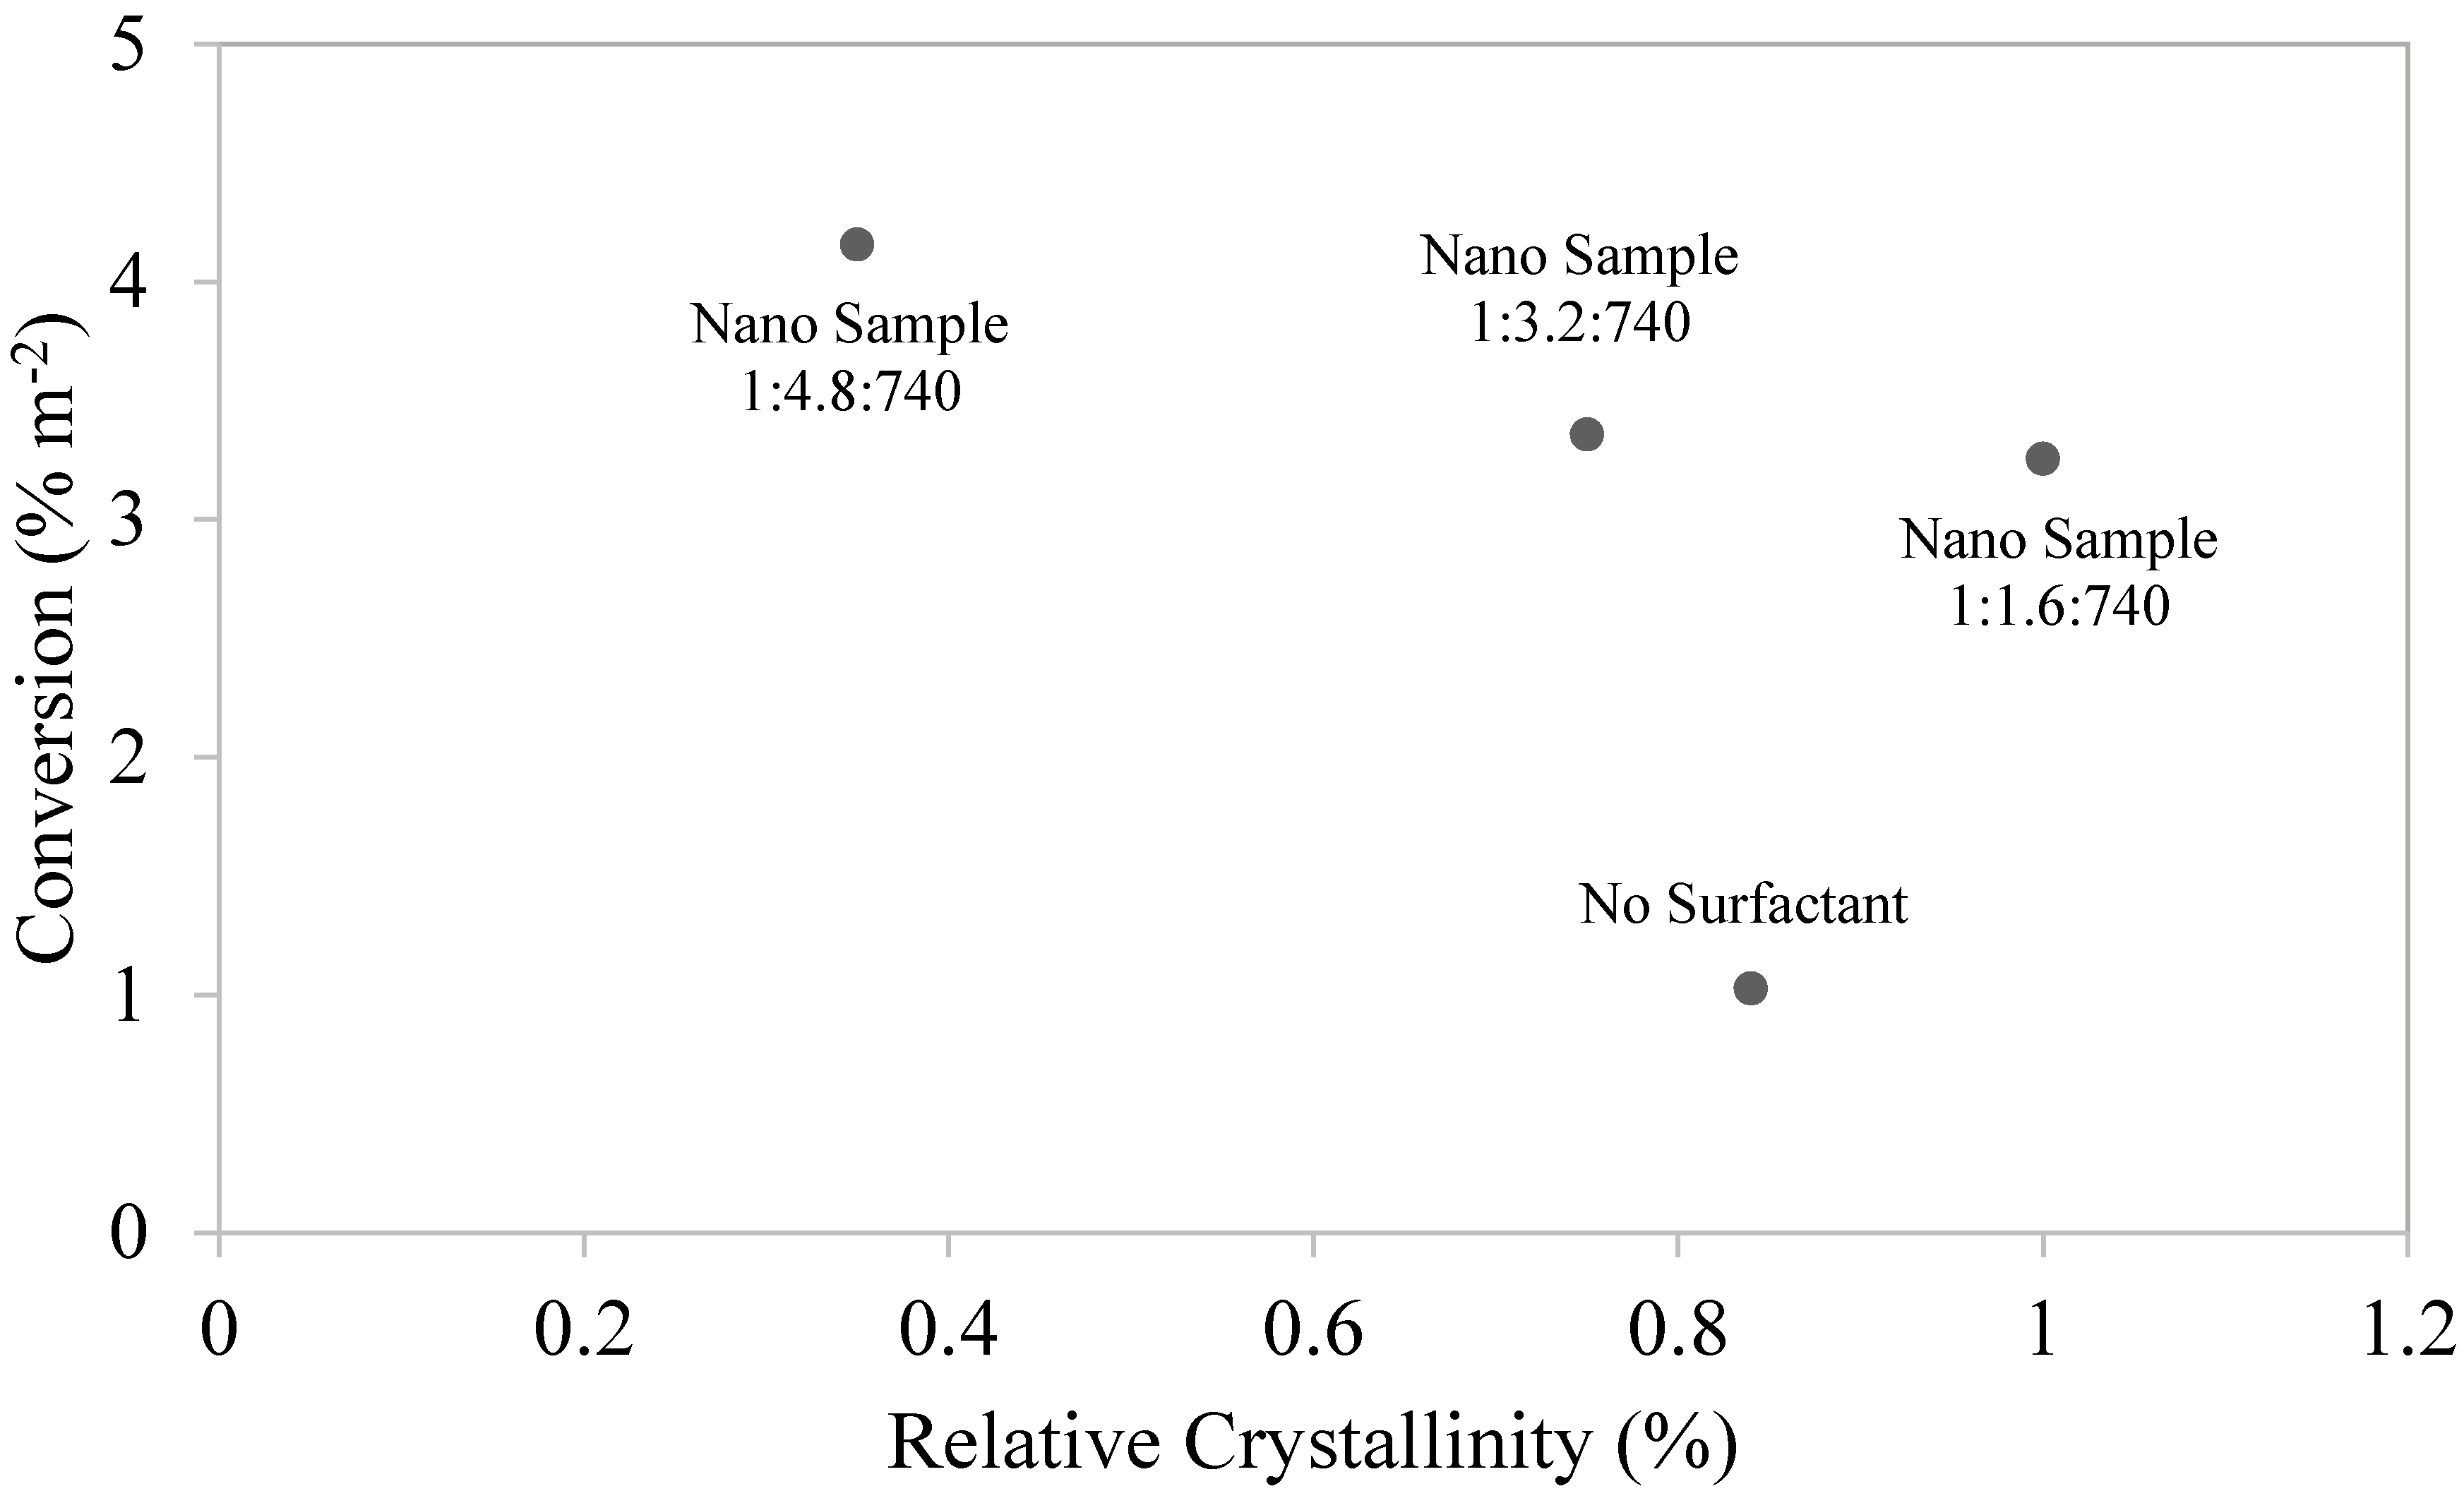
2.2. Catalytic Activity

The catalytic performance of the synthesized catalysts was evaluated for the synthesis of propyl N-octylcarbamate from n-octylamine, CO2 and n-propanol. The catalytic results are summarized in Table 3. Interestingly, all the nanostructured samples prepared using surfactant during their synthesis showed selectivity to carbamate as high as ~70%. The reference samples (Ga2O3-Sigma-Aldrich, and the nanostructured sample without surfactant) exhibited much lower selectivity. Yields to carbamate were also higher for the surfactant-synthesized nanostructures. Although these yields are moderate, these are in the typical range of most oxides [46]. The other observed product from the reaction was urea.
The recycled catalysts retained their original morphological features and catalytic performance. Specifically, the yield for the recycled catalysts showed a decrease only of ~ 2%. The SEM images of the recycled catalysts are represented in Figure 7. It could be clearly seen that the original morphology has been retained but the individual crystals, which were separated in the pre-reaction catalyst, show agglomeration (Figure 7c).
For the samples with precursor:surfactant:solvent ratios of 1:(1.6–4.8):740, the selectivity is independent of the amount of surfactant (See Supplementary Materials, Figure S2). Gallium oxide itself shows high selectivity towards carbamates irrespective of the morphology or structure it presents. This was confirmed by obtaining similar selectivity when an amorphous (not nanostructured) Ga2O3 from Sigma-Aldrich was used as catalyst for the reaction (See Table 3). As opposed to the surfactant-assisted synthesized gallium oxide nanostructured samples, the sample without surfactant showed the smallest selectivity to carbamate. This affirms that the use of surfactant decreases the crystal growth in selected planes leading to a decrease in crystallinity. This was confirmed by the observation that the non-surfactant nanostructured sample was the most crystalline. Also, it was observed that the selectivity to carbamates for the samples obtained when using surfactant was almost six times the selectivity obtained for the nanostructured sample with no surfactant.
The yields of carbamates are found by multiplying the total conversion and carbamate selectivity. Relative crystallinity played a major role in driving the total conversion of this model reaction. Figure 8 shows the plot of conversion with respect to relative crystallinity. The conversion is inversely proportional to the square of the relative crystallinity (See Supplementary Materials, Table S1).
The plot was generated in Excel with a regression coefficient of 0.99. The crystallinity was calculated using the dominant peak area from the XRDs. This comparison does not include the data of the commercial Ga2O3-Sigma-Aldrich sample as it is not nanostructured and the dominant peak has a very high peak area and a very abnormally drifting baseline. The XRD patterns of all five samples pre-reaction can be found in Figure S1 of Supplementary Materials. The non-nanostructured Ga2O3-Sigma-Aldrich sample has the highest crystallinity and the smallest conversion. The crystallinity of the samples tested in the synthesis of propyl N-octylcarbamate was found to be as follows: Ga2O3-Sigma-Aldrich > nano sample 1:1.6:740 > nano sample 1:0:740 > nano sample 1:3.2:740 > nano sample 1:4.8:740. The conversion is the exact inverse of the order previously stated. As can be observed from Figure 6d, the sample 1:4.8:740 showed the presence of a kinked nanostructure. It is well known that in heterogeneous catalysis the presence of defects, such as kinks, are high-energy regions that can enhance the catalytic performance. Therefore, it is likely that these defects (kinking) might help in the observed improved catalytic behavior for this sample.
It was observed that the conversion of the reactants is dependent on the crystallinity of the sample. The more amorphous the sample with respect to the β-form of Ga2O3, the better the conversion. The planes contributing to the catalytic activity, which also agreed with this trend, are (−401), (002), (401), (−311) and (600), which are also the major planes which contribute to the formation of a crystalline β-form of gallium oxide. The increase in conversion rate per area is observed to be decreasing with respect to relative crystallinity. The catalysts synthesized using CTAB as surfactant have conversion at least three times higher than the samples synthesized without surfactant. This correlates with the decrease in relative crystallinity with increasing amount of surfactant. This can be attributed to the defects produced during calcination. Higher surfactant concentration is more difficult to remove, which can lead to higher defects after calcination, while no such defects can be formed in the sample with no surfactant content. The conversion rate (per area) with respect to relative crystallinity is represented in Figure 9. There is a slight increase in conversion rate (per area) with respect to the linear increase in surfactant amount. These observations can shed some light on the role of the nanostructured catalyst employed for the synthesis of carbamates.

3. Materials and Methods

3.1. Catalyst Preparation

Gallium oxide nanoplates were synthesized via a modified hydrothermal approach described elsewhere [27]. In a typical synthesis, gallium nitrate hydrate (99.999% metal basis, Alfa Aesar, Haverhill, MA, USA) was dissolved in DI water. A second solution was prepared and added by dissolving sodium hydroxide in DI water. Two sets of this solution were prepared. To each set were added CTAB (>99%, Sigma Life Sciences), F127 (Bio Reagent Grade, Sigma Life Sciences) and PEO (Tergitol® 15-S-7, Sigma Aldrich, St. Louis, MO, USA) to control crystal growth. The resulting solutions were then heated at ~ 80 °C and the pH was adjusted to 9–10. The resultant solution was poured in a Teflon-lined autoclave (45 mL, Parr Instruments Company, St. Moline, IL, USA) for hydrothermal treatment in the 100–150 °C range for 6–48 h. Solid products were separated and dried overnight at 80 °C in a conventional oven and calcined at 900 °C for several hours with a heating ramp of 2.5 °C/min.

3.2. Characterization

The solids were analyzed with a Helios NanoLab 600 series scanning electron microscope using immersion mode (Thermo Fisher Scientific, Hillsboro, OR, USA). The accelerating voltage was between 10 and 15 kV. The BET surface areas and N2 isotherms were measured using a Micromeritics Tristar-3000 porosimeter (Micromeritics Instrument Corporation, Norcross, GA, USA) at 77 K using liquid nitrogen as the coolant. Before measurements, the samples were degassed at 180 °C for 6 h under vacuum. HRTEM images were obtained using a Tecnai F20FEI TEM with a Gatan 2002 GIF system (Thermo Fisher Scientific, Hillsboro, OR, USA).

3.3. Catalytic Activity

The catalytic performance of the synthesized gallium oxide nanostructures was evaluated in the synthesis of propyl N-octylcarbamate from the reaction of n-octylamine, CO2 and n-propanol. The chosen amine and alcohol are considered model carbamate reactants due to the lower steric hindrance offered by linear alkyl chains as compared to branched and aryl amines. The reactions were carried out in a stainless-steel, high-pressure Parr reactor (Model 4593). In a typical reaction, n-octylamine, n-propanol and the gallium oxide sample used as catalyst were placed in the high-pressure reactor. The employed molar ratio of amine:alcohol was 1:15. 0.6 g of catalyst was loaded into the reactor. The reactor was then pressurized with CO2 in the range of 20–25 bar. The reactions were carried out at 200 °C for 24 h. After the reaction, the reactor was cooled to room temperature, and the unreacted CO2 was vented. The catalyst was recovered and separated by centrifugation. Recyclability is an important feature that is essential for any catalyst to be considered for industrial applications. Catalysts were recycled by extensive washing with acetone, followed by centrifugation, drying in air and calcination at 300 °C for 4 h before reuse.

3.4. Product Analysis

The liquid product was collected and analyzed with a gas chromatograph (GC, 6980N) equipped with a HP-5 MS column (with dimensions of 30 m × 250 µm × 0.25 µm) and a 5973N MSD detector. A product sample of 0.2 µL was injected into the GC column (250 °C, 10.52 psi) with a split ratio 100:1. The carrier gas was helium and the flow rate was 1.0 mL/min. The following GC temperature program was used for analysis: 100 °C for 5 min, 300 °C (1 °C/min for 2 min). The product identification was confirmed with a gas chromatograph–mass spectrometer.

4. Conclusions

The catalytic activity of β-gallium oxide nanostructures in the synthesis of propyl N-octylcarbamate from CO2 and n-propanol, in the absence of phosgene, is reported. The obtained nanostructures showed different aspect ratios (L/D) varying from 2 to 18. The modification of the crystalline aspect ratio was achieved by the use of different surfactants and by varying the surfactant concentrations. The observed selectivity towards the corresponding carbamate was as high as ~70%, comparable to the non-nanostructured and non-surfactant-added samples. Our samples showed negligible catalytic activity loss during recycling. The nanostructures exhibited the β-gallium oxide phase and they preserved this phase and their morphology even after reaction. Interestingly, the relative crystallinity towards selected planes is the controlling factor for the overall conversion, while it doesn’t affect the selectivity. Furthermore, the gallium oxide planes contributing to the catalytic activity are (−401), (002), (401), (−311) and (600). Conversion rate (per area) has been found to increase with the decrease in relative crystallinity. This property is attributed to the defects caused on the surface by increasing concentration of surfactant.

Supplementary Materials

The following are available online at www.mdpi.com/2073-4344/7/12/372/s1, Figure S1. XRD patterns of gallium oxide catalysts employed for the studied reaction, Figure S2. Carbamate selectivity as function of relative crystallinity, Table S1. Relative crystallinity of the studied catalysts and their corresponding selectivity to carbamate.

Acknowledgments

Maria L. Carreon acknowledge The University of Tulsa Faculty Development Summer Fellowship Program for financial support of this work.

Author Contributions

Maria L. Carreon conceived and directed the presented research. Javishk Shah performed the experiments for catalyst preparation and catalytic activity. Synthesis of catalysts and their catalytic performance evaluation was performed at The University of Tulsa. Paul Ratnasamy particularly helped with interpretation of the catalytic activity data. The paper was written with the contribution of Paul Ratnasamy, Maria L. Carreon and Javishk Shah.

Conflicts of Interest

The authors declare no conflict of interest.

References

  1. Åhman, J.; Svensson, G.; Albertsson, J. A reinvestigation of β-gallium oxide. Acta Crystallogr. Sect. C 1996, 52, 1336–1338. [Google Scholar] [CrossRef]
  2. Fleischer, M.; Hanrieder, W.; Meixner, H. Stability of semiconducting gallium oxide thin films. Thin Solid Films 1990, 190, 93–102. [Google Scholar] [CrossRef]
  3. Wu, X.; Song, W.; Huang, W.; Pu, M.; Zhao, B.; Sun, Y.; Du, J. Crystalline gallium oxide nanowires: Intensive blue light emitters. Chem. Phys. Lett. 2000, 328, 5–9. [Google Scholar] [CrossRef]
  4. Binet, L.; Gourier, D. Origin of the blue luminescence of β-Ga2O3. J. Phys. Chem. Solids 1998, 59, 1241–1249. [Google Scholar] [CrossRef]
  5. Li, Z.; De Groot, C.; Moodera, J.H. Gallium oxide as an insulating barrier for spin-dependent tunneling junctions. Appl. Phys. Lett. 2000, 77, 3630–3632. [Google Scholar] [CrossRef]
  6. Ogita, M.; Saika, N.; Nakanishi, Y.; Hatanaka, Y. Ga2O3 thin films for high-temperature gas sensors. Appl. Surf. Sci. 1999, 142, 188–191. [Google Scholar] [CrossRef]
  7. Jung, W.-S. Reaction intermediate(s) in the conversion of β-gallium oxide to gallium nitride under a flow of ammonia. Mater. Lett. 2002, 57, 110–114. [Google Scholar] [CrossRef]
  8. Vaidhyanathan, B.; Agrawal, D.; Roy, R. Novel synthesis of nitride powders by microwave-assisted combustion. J. Mater. Res. 2000, 15, 974–981. [Google Scholar] [CrossRef]
  9. Shimizu, K.-I.; Takamatsu, M.; Nishi, K.; Yoshida, H.; Satsuma, A.; Tanaka, T.; Yoshida, S.; Hattori, T. Alumina-supported gallium oxide catalysts for NO selective reduction: Influence of the local structure of surface gallium oxide species on the catalytic activity. J. Phys. Chem. B 1999, 103, 1542–1549. [Google Scholar] [CrossRef]
  10. Shimizu, K.-I.; Satsuma, A.; Hattori, T. Selective catalytic reduction of NO by hydrocarbons on Ga2O3/Al2O3 catalysts. Appl. Catal. B 1998, 16, 319–326. [Google Scholar] [CrossRef]
  11. Li, Y.; Armor, J.N. Selective catalytic reduction of NO with methane on gallium catalysts. J. Catal. 1994, 145, 1–9. [Google Scholar] [CrossRef]
  12. Hou, Y.; Wang, X.; Wu, L.; Ding, Z.; Fu, X. Efficient decomposition of benzene over a β-Ga2O3 photocatalyst under ambient conditions. Environ. Sci. Technol. 2006, 40, 5799–5803. [Google Scholar] [CrossRef] [PubMed]
  13. Saito, M.; Watanabe, S.; Takahara, I.; Inaba, M.; Murata, K. Dehydrogenation of propane over a silica-supported gallium oxide catalyst. Catal. Lett. 2003, 89, 213–217. [Google Scholar] [CrossRef]
  14. Zheng, B.; Hua, W.; Yue, Y.; Gao, Z. Dehydrogenation of propane to propene over different polymorphs of gallium oxide. J. Catal. 2005, 232, 143–151. [Google Scholar] [CrossRef]
  15. Nakagawa, K.; Okamura, M.; Ikenaga, N.; Suzuki, T.; Kobayashi, T. Dehydrogenation of ethane over gallium oxide in the presence of carbon dioxide. Chem. Commun. 1998, 9, 1025–1026. [Google Scholar] [CrossRef]
  16. Macias, E.E.; Deshmane, C.A.; Jasinski, J.B.; Carreon, M.A.; Ratnasamy, P. Catalytic transformations of methyl oleate and biodiesel over mesoporous gallium–niobium oxides. Catal. Commun. 2011, 12, 644–650. [Google Scholar] [CrossRef]
  17. Petre, A.; Auroux, A.; Gelin, P.; Caldararu, M.; Ionescu, N. Acid–base properties of supported gallium oxide catalysts. Thermochim. Acta 2001, 379, 177–185. [Google Scholar] [CrossRef]
  18. Xu, B.; Zheng, B.; Hua, W.; Yue, Y.; Gao, Z. Support effect in dehydrogenation of propane in the presence of CO2 over supported gallium oxide catalysts. J. Catal. 2006, 239, 470–477. [Google Scholar] [CrossRef]
  19. Tsuneoka, H.; Teramura, K.; Shishido, T.; Tanaka, T. Adsorbed Species of CO2 and H2 on Ga2O3 for the Photocatalytic Reduction of CO2. J. Phys. Chem. C 2010, 114, 8892–8898. [Google Scholar] [CrossRef]
  20. Huang, C.-C.; Yeh, C.-S.; Ho, C.-J. Laser ablation synthesis of spindle-like gallium oxide hydroxide nanoparticles with the presence of cationic cetyltrimethylammonium bromide. J. Phys. Chem. B 2004, 108, 4940–4945. [Google Scholar] [CrossRef]
  21. Hu, J.; Li, Q.; Meng, X.; Lee, C.; Lee, S. Synthesis of β-Ga2O3 nanowires by laser ablation. J. Phys. Chem. B 2002, 106, 9536–9539. [Google Scholar] [CrossRef]
  22. Higashiwaki, M.; Sasaki, K.; Kuramata, A.; Masui, T.; Yamakoshi, S. Gallium oxide (Ga2O3) metal-semiconductor field-effect transistors on single-crystal β-Ga2O3 (010) substrates. Appl. Phys. Lett. 2012, 100, 013504. [Google Scholar] [CrossRef]
  23. Valet, M.; Hoffman, D.M. Synthesis of homoleptic gallium alkoxide complexes and the chemical vapor deposition of gallium oxide films. Chem. Mater. 2001, 13, 2135–2143. [Google Scholar] [CrossRef]
  24. Battiston, G.; Gerbasi, R.; Porchia, M.; Bertoncello, R.; Caccavale, F. Chemical vapour deposition and characterization of gallium oxide thin films. Thin Solid Films 1996, 279, 115–118. [Google Scholar] [CrossRef]
  25. Kim, H.W.; Kim, N.H. Growth of gallium oxide thin films on silicon by the metal organic chemical vapor deposition method. Mater. Sci. Eng. B 2004, 110, 34–37. [Google Scholar] [CrossRef]
  26. Taş, A.C.; Majewski, P.J.; Aldinger, F. Synthesis of gallium oxide hydroxide crystals in aqueous solutions with or without urea and their calcination behavior. J. Am. Ceram. Soc. 2002, 85, 1421–1429. [Google Scholar] [CrossRef]
  27. Zhao, Y.; Frost, R.L.; Martens, W.N. Synthesis and characterization of gallium oxide nanostructures via a soft-chemistry route. J. Phys. Chem. C 2007, 111, 16290–16299. [Google Scholar] [CrossRef]
  28. Quan, Y.; Fang, D.; Zhang, X.; Liu, S.; Huang, K. Synthesis and characterization of gallium oxide nanowires via a hydrothermal method. Mater. Chem. Phys. 2010, 121, 142–146. [Google Scholar] [CrossRef]
  29. Zhao, Y.; Frost, R.L.; Yang, J.; Martens, W.N. Size and morphology control of gallium oxide hydroxide GaO (OH), nano-to micro-sized particles by soft-chemistry route without surfactant. J. Phys. Chem. C 2008, 112, 3568–3579. [Google Scholar] [CrossRef]
  30. Zhu, F.; Yang, Z.X.; Zhou, W.M.; Zhang, Y.F. Direct synthesis of beta gallium oxide nanowires, nanobelts, nanosheets and nanograsses by microwave plasma. Solid State Commun. 2006, 137, 177–181. [Google Scholar] [CrossRef]
  31. Dai, Z.; Pan, Z.; Wang, Z. Gallium oxide nanoribbons and nanosheets. J. Phys. Chem. B 2002, 106, 902–904. [Google Scholar] [CrossRef]
  32. Kumar, S.; Singh, R. Nanofunctional gallium oxide (Ga2O3) nanowires/nanostructures and their applications in nanodevices. Phys. Status Solidi (RRL)-Rapid Res. Lett. 2013, 7, 781–792. [Google Scholar] [CrossRef]
  33. He, H.; Blanco, M.A.; Pandey, R. Electronic and thermodynamic properties of β-Ga2O3. Appl. Phys. Lett. 2006, 88, 261904. [Google Scholar] [CrossRef]
  34. Srivastava, R.; Srinivas, D.; Ratnasamy, P. CO2 activation and synthesis of cyclic carbonates and alkyl/aryl carbamates over adenine-modified Ti-SBA-15 solid catalysts. J. Catal. 2005, 233, 1–15. [Google Scholar] [CrossRef]
  35. Areán, C.O.; Bellan, A.L.; Mentruit, M.P.; Delgado, M.R.; Palomino, G.T. Preparation and characterization of mesoporous γ-Ga2O3. Microporous Mesoporous Mater. 2000, 40, 35–42. [Google Scholar] [CrossRef]
  36. Lavalley, J.; Daturi, M.; Montouillout, V.; Clet, G.; Areán, C.O.; Delgado, M.R.; Sahibed-Dine, A. Unexpected similarities between the surface chemistry of cubic and hexagonal gallia polymorphs. Phys. Chem. Chem. Phys. 2003, 5, 1301–1305. [Google Scholar] [CrossRef]
  37. Delgado, M.R.; Areán, C.O. Surface chemistry and pore structure of β-Ga2O3. Mater. Lett. 2003, 57, 2292–2297. [Google Scholar] [CrossRef]
  38. Vimont, A.; Lavalley, J.; Sahibed-Dine, A.; Otero Areán, C.; Rodríguez Delgado, M.; Daturi, M. Infrared spectroscopic study on the surface properties of γ-gallium oxide as compared to those of γ-alumina. J. Phys. Chem. B 2005, 109, 9656–9664. [Google Scholar] [CrossRef] [PubMed]
  39. Collins, S.E.; Baltanás, M.A.; Bonivardi, A.L. Infrared spectroscopic study of the carbon dioxide adsorption on the surface of Ga2O3 polymorphs. J. Phys. Chem. B 2006, 110, 5498–5507. [Google Scholar] [CrossRef] [PubMed]
  40. Tsyganenko, A.A. Variable temperature IR spectroscopy in the studies of oxide catalysts. Top. Catal. 2013, 56, 905–913. [Google Scholar] [CrossRef]
  41. Busca, G.; Lorenzelli, V. Infrared spectroscopic identification of species arising from reactive adsorption of carbon oxides on metal oxide surfaces. Mater. Chem. 1982, 7, 89–126. [Google Scholar] [CrossRef]
  42. Lavalley, J. Infrared spectrometric studies of the surface basicity of metal oxides and zeolites using adsorbed probe molecules. Catal. Today 1996, 27, 377–401. [Google Scholar] [CrossRef]
  43. Stepanov, S.; Nikolaev, V.; Bougrov, V.; Romanov, A. Gallium Oxide: Properties and Applications a Review. Rev. Adv. Mater. Sci. 2016, 44, 63–86. [Google Scholar]
  44. Venna, S.R.; Carreon, M.A. Synthesis of SAPO-34 crystals in the presence of crystal growth inhibitors. J. Phys. Chem. B 2008, 112, 16261–16265. [Google Scholar] [CrossRef] [PubMed]
  45. Deshmane, C.A.; Jasinski, J.B.; Carreon, M.A. Microwave-assisted synthesis of nanocrystalline mesoporous gallium oxide. Microporous Mesoporous Mater. 2010, 130, 97–102. [Google Scholar] [CrossRef]
  46. Ion, A.; Van Doorslaer, C.; Parvulescu, V.; Jacobs, P.; De Vos, D. Green synthesis of carbamates from CO2, amines and alcohols. Green Chem. 2008, 10, 111–116. [Google Scholar] [CrossRef]
Figure 1. Representative scanning electron microscope (SEM) images of gallium oxide nanoplates with different aspect ratios (length/diameter; L/D) synthesized using different surfactants. (a) L/D = 7:1 using CTAB (Cetyl Trimethyl Ammonium Bromide) as surfactant; (b) L/D = 11:1 using F127 (Pluronic F-127) as surfactant; (c) L/D = 12:1 no surfactant; and (d) L/D = 24:1 using PEO (Tergitol-S-7) as surfactant.
Catalysts 07 00372 g001
Figure 2. Representative adsorption–desorption isotherm of N2 for the sample synthesized when using PEO as surfactant.
Catalysts 07 00372 g002
Figure 3. XRD patterns of different gallium oxide nanostructures showing the presence of the β-phase.
Catalysts 07 00372 g003
Figure 4. SEM images of gallium oxide nanoplates synthesized using CTAB with different precursor:surfactant:solvent ratios. (a) 1:1.6:740; (b) 1:3.2:740; (c) 1:4.8:740; (d) no surfactant.
Catalysts 07 00372 g004
Figure 5. Adsorption isotherms for nanoplates synthesized (a) without using surfactant and using CTAB with different precursor:surfactant:solvent ratios (b) 1:1.6:740; (c) 1:3.2:740; (d) 1:4.8:740, no surfactant.
Catalysts 07 00372 g005
Figure 6. HRTEM images of gallium oxide nanoplates synthesized using (a) no surfactant and precursor:surfactant:solvent ratio as follows: (b) 1:1.6:740; (c) 1:3.2:740; and (d) 1:4.8:740.
Catalysts 07 00372 g006aCatalysts 07 00372 g006b
Figure 7. SEM images of post-reaction recycled gallium oxide nanoplates synthesized using CTAB with different precursor:surfactant:solvent ratios (a) 1:1.6:740; (b) 1:3.2:740; (c) 1:4.8:740; (d) no surfactant.
Catalysts 07 00372 g007
Figure 8. Relative crystallinity (%) vs. conversion (%).
Catalysts 07 00372 g008
Figure 9. Relative crystallinity (%) vs. conversion (% m−2).
Catalysts 07 00372 g009
Table 1. Catalyst general synthesis conditions.
SurfactantMolar Ratio (Precursor:Surfactant:Solvent)BET Surface Area (m2/g)
CTAB1:1.6:37029.6
F1271:0.04:37011.1
PEO1:1.13:37023.9
None1:0:37051.7
Table 2. Samples using CTAB general synthesis conditions.
SurfactantMolar Ratio (Precursor:Surfactant:Solvent)Aspect Ratio L/D
CTAB1:1.6:7402
1:3.2:74018
1:4.8:404
Table 3. Catalytic performance and BET surface areas of the Ga2O3 nano samples used for the synthesis of propyl N-octylcarbamate from n-octylamine, CO2 and n-propanol.
CatalystSurface Area (m2/g)Conversion (%)Selectivity to Carbamate (%)Yield to Carbamate (%)
Ga2O3-Sigma-Aldrich21.26.853.53.6
Nano sample7.47.669.15.2
precursor:surfactant:solvent
1:1.6:740
Nano sample5.517.969.312.4
precursor:surfactant:solvent
1:3.2:740
Nano sample7.023.568.516.1
precursor:surfactant:solvent
1:4.8:740
Nano sample3.213.39.41.2
1:0:740 (no surfactant)
Reaction conditions: The employed molar ratio of amine:alcohol = 1:15. 0.6 g of catalyst was loaded into the reactor. The reactor was then pressurized with CO2 in the range of 2–2.5 MPa. The reactions were carried out at 200 °C for 24 h.

