Abstract
In this work, structural and morphological properties of SiO2–C composite material to be used as support for catalysts in the conversion of biomass-derived oxygenated hydrocarbons, such as glycerol, were investigated in liquid water under various temperatures conditions. The results show that this material does not lose surface area, and the hot liquid water does not generate changes in the structure. Neither change in relative concentrations of oxygen functional groups nor in Si/C ratio due to hydrothermal treatment was revealed by X-ray photoelectron spectroscopy (XPS) analysis. Raman analysis showed that the material is made of a disordered graphitic structure in an amorphous silica matrix, which remains stable after hydrothermal treatment. Results of the hydrogenolysis of glycerol using a Ru/SiO2–C catalyst indicate that the support gives more stability to the active phase than a Ru/SiO2 consisting of commercial silica.
1. Introduction
Nowadays, catalytic conversion of renewable feedstock sources into chemicals and/or fuel components has received significant attention. More specifically, the conversion of biomass-derived oxygenated hydrocarbons—such as lignin, cellulose, sorbitol, xylitol, and glycerol—into added-value products requires the development of catalytic systems stable in hot liquid water to avoid deactivation. In this context, a variety of catalytic processes, including hydrogenation, reforming, and hydrogenolysis are carried out in an aqueous liquid phase at relatively low temperatures and high pressures. Aqueous phase hydrogenolysis will definitely play a central role in future biorefineries, both in the depolymerization of lignocellulosic biomass and in the production of chemical products. One of the main challenges for the use of the compounds derived from the biomass is the selective hydrogenolysis in the C–O bonds [1]. Yan et al. studied aqueous-phase hydrogenolysis lignin model compounds (10 bar H2 and 130 °C) for the production of aromatic chemicals using bimetallic catalysts Ni–Ru, Ni–Rh, Ni–Pd; it could be concluded from the results obtained that with the addition of ruthenium, metal nanoparticles of 2 nm are obtained, and they selectively promote the cleavage of C–O bonds and disable the hydrogenation of the aromatic rings, allowing high performance of the desired products [1].
Bronstein et al. have recently reported the production of ethylene and propylene glycol from the aqueous phase hydrogenolysis of cellulose (200–260 °C and 60 bar H2) using ruthenium catalysts supported on mesoporous Fe3O4–SiO2. All the studied catalysts exhibited excellent activities in cellulose hydrogenolysis to glycols, independent of the Ru loading (Ru 1 wt %, 3 wt %, and 5 wt %). To validate their study, Bronstein et al. synthesized a Ru/SiO2 catalyst (Ru 5 wt %) which was used in the same conditions as Ru/Fe3O4–SiO2, obtaining low activity and selectivity to glycols, the main products being sorbitol and mannitol. The results offered proof that the addition of Fe3O4 to the mesoporous SiO2 promotes the hydrogenolysis reaction. When the ruthenium nanoparticles are deposited on Fe3O4, there is an interaction and transference of electrons from the surface of Fe3O4 to the ruthenium that facilitates hydrogenolysis, and this is reflected in higher catalytic activity and selectivity [2].
Garcia Fierro et al. [3] studied sorbitol aqueous-phase hydrogenolysis (220 °C and 40 bar H2) in order to obtain ethylene and propylene glycol using ruthenium catalysts, and they evaluated the effects of different supports (Al2O3, TiO2, ZrO2, and SiO2) on the structure and physicochemical properties of supported Ru catalysts and their catalytic performance. The use of different supports modified the physicochemical properties of the Ru particles and allowed more Ru to be exposed in order to facilitate the interaction with adsorbed sorbitol. The Ru/ZrO2 catalyst presented higher dispersion and, as a consequence, a smaller sized metal particle, followed by Ru/Al2O3 and Ru/TiO2. Taking into account that in order to obtain glycols through sorbitol hydrogenolysis, a high quantity of metallic sites is required in order to cleavage C–C and C–O bonds, it is expected that those catalysts with higher metallic dispersion present the best catalytic activity. However, the authors could not establish a correlation between the particle size and the catalytic results obtained. The observed differences could be explained when the acidity of the solids employed was studied, and it was found that the best catalyst was Ru/Al2O3, which showed higher acidity thatpromoted sorbitol dehydrogenation in the acid sites of the support.
Glycerol hydrogenolysis in aqueous phase is an alternative route to increase the profitability of biodiesel production plants, since products of the glycerol hydrogenolysis can easily replace the chemical compounds, which are industrially produced these days mainly using nonrenewable sources.
Feng et al. [4] studied the effect of the support and the thermal pretreatment of reduction on the catalytic performance of Ru catalysts supported on NaY, SiO2, Al2O3, and TiO2. The low catalytic performance was attributed to two main reasons: (1) the growth in Ru particle caused by the thermal treatment; (2) the strong metal-support interaction (SMSI), which results in partial covering of Ru metal particles by Ti2O3 species. The results obtained evidenced that the support could influence the reaction routes.
In a recent work, Feng et al. synthesized a series of Ru–Co catalysts supported on ZrO2 and reported the effect of the thermal treatment (calcination–reduction) on the aqueous-phase hydrogenolysis of glycerol at 180 °C and 50 bar H2 [5]. The results showed that the more severe the thermal treatment, the lower the catalytic activity, thus obtaining low performance. Although the reaction conditions applied were moderate, the selectivity to propylene glycol was not satisfactory, compared to a Ru–Cu catalyst [6,7].
Ahmed et al. [8] synthesized ruthenium catalysts on Al2O3/AlF3 supports with different AlF3 content. The hydrogenolysis reaction of crude glycerol was performed at a temperature of 200 °C and a hydrogen pressure of 40 bar. The glycerol conversion reached its maximum between AlF3 contents of 17.5 wt % and 58.9 wt %. Besides, the selectivity to the main useful liquid products obtained (ethylene and propylene glycol) was found to be affected by the fluoridation.
Passos et al. [9] studied the aqueous-phase hydrogenolysis of glycerol using Ru–Cu/ZrO2 and Ru–Cu/Al2O3 catalysts (200 °C and 25 bar H2); an interesting aspect of the work was the study of the reuse of the catalysts. Recycling experiments that were performed for both Ru/Al2O3 and Ru/ZrO2 catalysts showed a drop—on the order of ~5% in activity—in the first recycle. The Ru/ZrO2 catalyst showed the more dramatic drop in activity after the second recycle (about 58% from the first recycle). Comparatively, Al2O3 seems to be a more stable support, presenting a drop on the order of 20% in activity with regard to the first recycle.
Through the analysis of bibliography, it is clear the importance of the role of the support in the hydrogenolysis reactions in liquid phase.
The presence of hot liquid water notably affects the structure and stability of catalysts, either the metallic phase or the support. Among the catalytic supports based on aluminum oxides, such as γ-Al2O3, rehydration and formation of boehmite takes place between 200 and 250 °C, which generate changes in acidic surface properties affecting the selectivity and stability of catalysts [10,11]. Similar effects have also been observed for δ-Al2O3- and θ-Al2O3-supported systems, where catalysts suffer a deactivation in aqueous phase because of the sintering of metal particles [12,13]. Studies of composite supports, such as SiO2–Al2O3 (“SIRALOX 30” of SASOL), show that they lose surface area because of pore collapse when they are used in liquid water at 225 °C and 25 bar [14]. On the other hand, carbon-based supports, such as TiO2/C, have shown a better performance due to the hydrophobic characteristics of carbon that would protect the catalytic sites from water blockage and maintain the catalytic activity [15].
The aim of this work is to evaluate the stability of a silica–carbon composite material (SiO2–C) as catalyst support submitted to different thermal treatments in the presence of liquid water. Catalytic activity and stability were evaluated considering the hydrogenolysis of glycerol in aqueous phase as a reaction test, using a Ru/SiO2–C catalyst prepared by incipient wetness impregnation. The results obtained with this catalyst are compared with those of a Ru/SiO2 catalyst based on commercial SiO2 (AEROSIL 200, Evonik Industries, Hanau-Wolfgang, Germany).
2. Results and Discussion
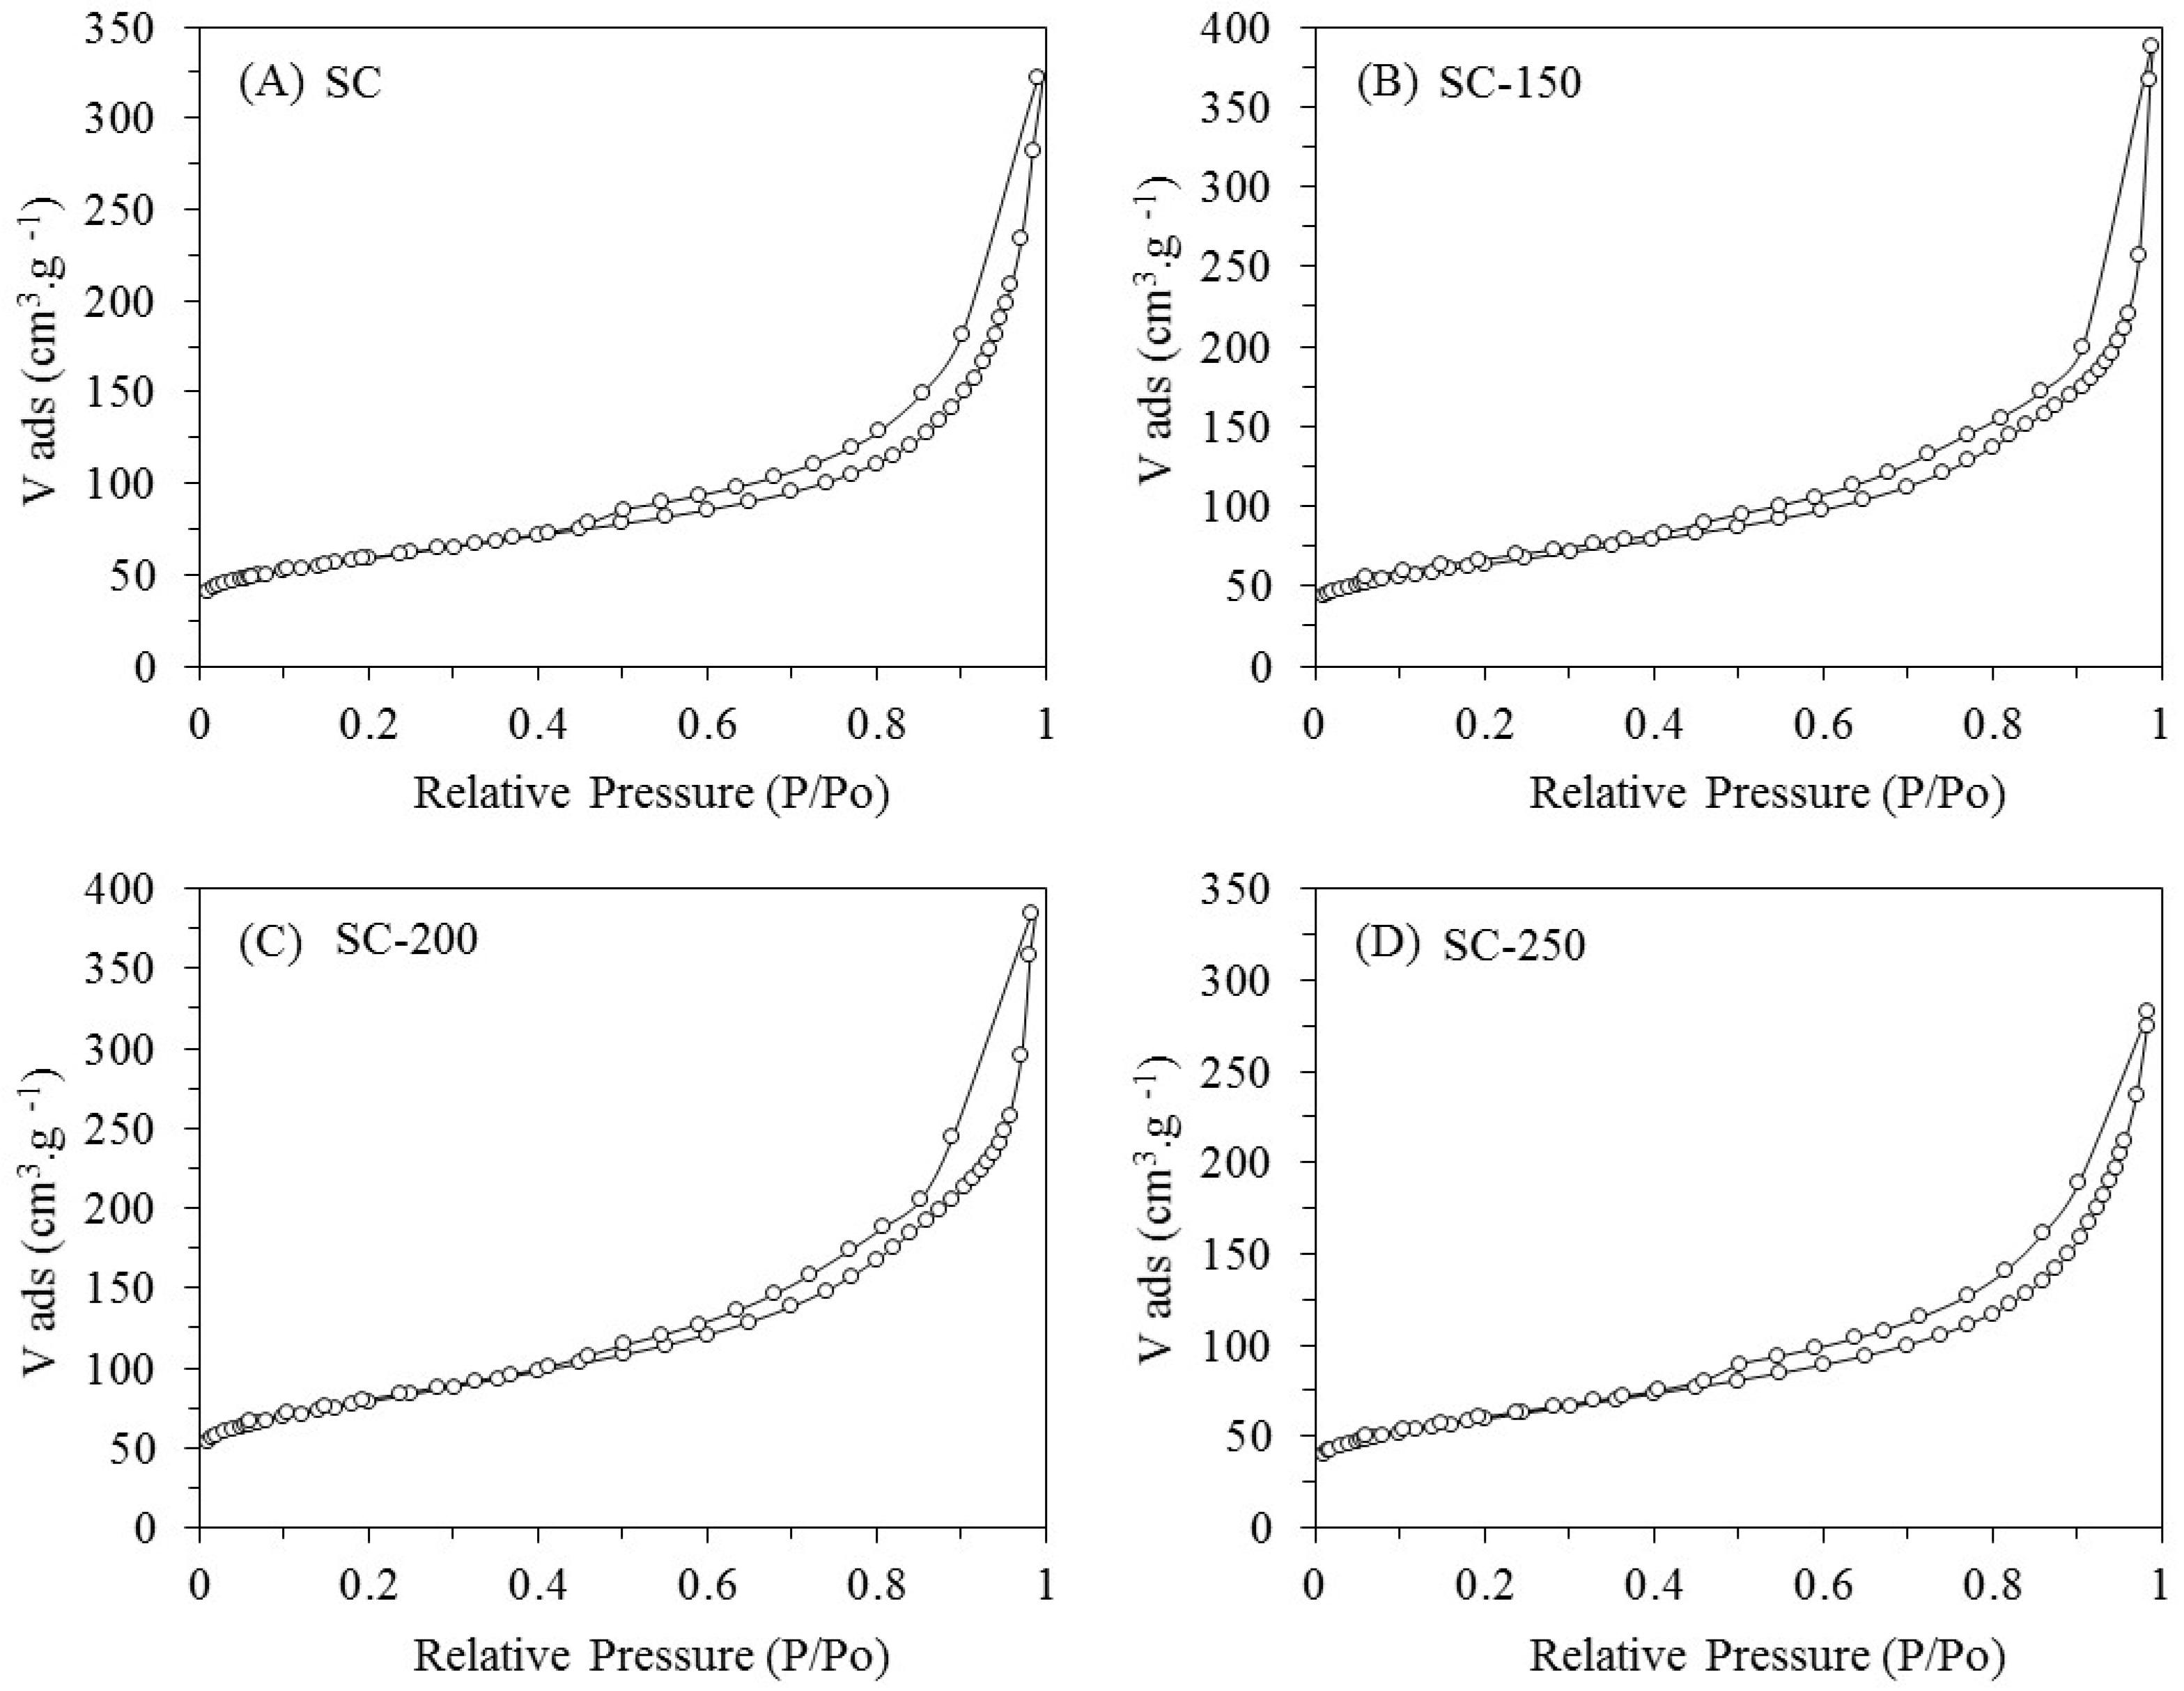
The isotherms obtained for all the samples (SC, SC-150, SC-200, and SC-250) are type IV, indicating that nitrogen adsorption occurs in multilayer (Figure 1). The isotherms present a hysteresis link of H3 type at relative pressures (P/P0) from 0.45 to 0.98, indicating that the materials exhibit both micro- and mesoporous features with slit-shape geometry (Table 1) [16].

Figure 1.
N2 adsorption–desorption isotherms at −196 °C for samples SC (A); SC-150 (B); SC-200 (C); SC-250 (D).

Table 1.
Brunauer–Emmett–Teller (BET) specific surface area, total pore volume, and micro-and mesopores characteristics obtained by N2 adsorption.
Compared to the SC fresh sample, a weak increase in the total pore volume (Vt) for the SC-150, SC-200, and SC-250 systems is observed. This is accompanied with an increase in the values of specific surface areas (SBET) for the treated samples. As the water is considered an oxidant compound would cause a partial gasification of carbon of support, generating an enlargement of pore size and an increase of surface area. According to Alegre et al., this is particularly significant for micropores due to their size, so there is an increase in total pore volume [17,18,19].
The most relevant changes of Vt and SBET are produced by the treatment in liquid water at 200 and 250 °C. With regards to commercial SiO2 (AEROSIL 200 from Evonik Industries, Hanau-Wolfgang, Germany), isotherms obtained are type IV with a hysteresis link of H3 type at relative pressures (P/P0) from 0.7 to 0.98 (not shown here); these features indicate that silica is present—both micro- and mesoporous—with slit-shape geometry. The silica treated at 200 °C for 24 h, denoted as SiO2-200, presents a strong drop in SBET of approximately 44%. This change is accompanied with a decrease in the values of Smeso and Smicro, indicating that micro- and mesopores suffer a collapse due to the hydrothermal treatment.
For the SC sample, the BJH pore width analysis shows the presence of a bimodal pore width distribution with diameters, of approximately 2 nm in the area of micropores, and of approximately 5 nm in the mesopore zone. The treatment in liquid water generates only a weak deviation of the second modal pore diameter, from 5 nm to 6 nm (Figure 2), indicating no collapse or loss of pore surface area under water exposure. The SiO2-200 sample shows a disappearance of the first modal pore diameter and only the second one is found at approximately 2 nm. The value of Vmicro for SiO2-200 sample is 0.003 cm3·g−1, which indicates that micropores are almost eliminated due to the treatment employed.
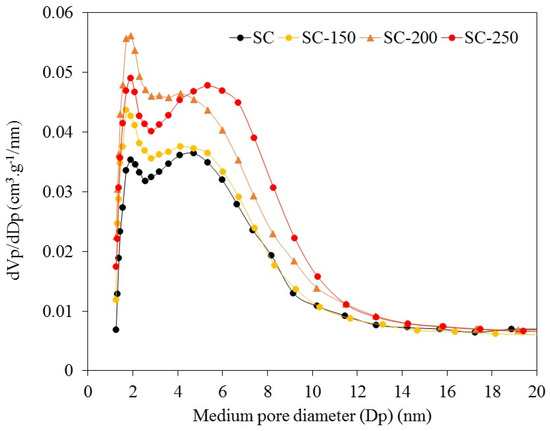
Figure 2.
Pore width distribution according to Barrett, Joyner, and Halenda BJH model from isotherm adsorption branch, assuming slit-shape pore geometry.
The relative concentrations of oxygen functional groups on samples were determined by curve fitting of the XPS spectra as previously described by Proctor and Sherwood [20]. For the SC fresh sample, surface concentration results with approximately 44% of C–C groups and 56% of oxygenated groups (~48% C–O and ~7% O=C–O) (Table 2). A slight increase of the surface oxygenated groups is observed in the treated samples. This behavior would indicate the stability of the acid–base properties of the materials, which is an essential attribute to maintain activity and selectivity of the catalyst. Besides, the XPS atomic ratio Si/C is constant (~0.07) before and after the hydrothermal treatments (Table 2), confirming the system stability.
Table 2.
X-ray photoelectron spectroscopy (XPS) results for C 1s (284.6–288.8 eV) and O 1s (530.6–531.8 eV) regions, Si/C ratio and relative concentration (%) of functional groups for SC and SC-250 samples.
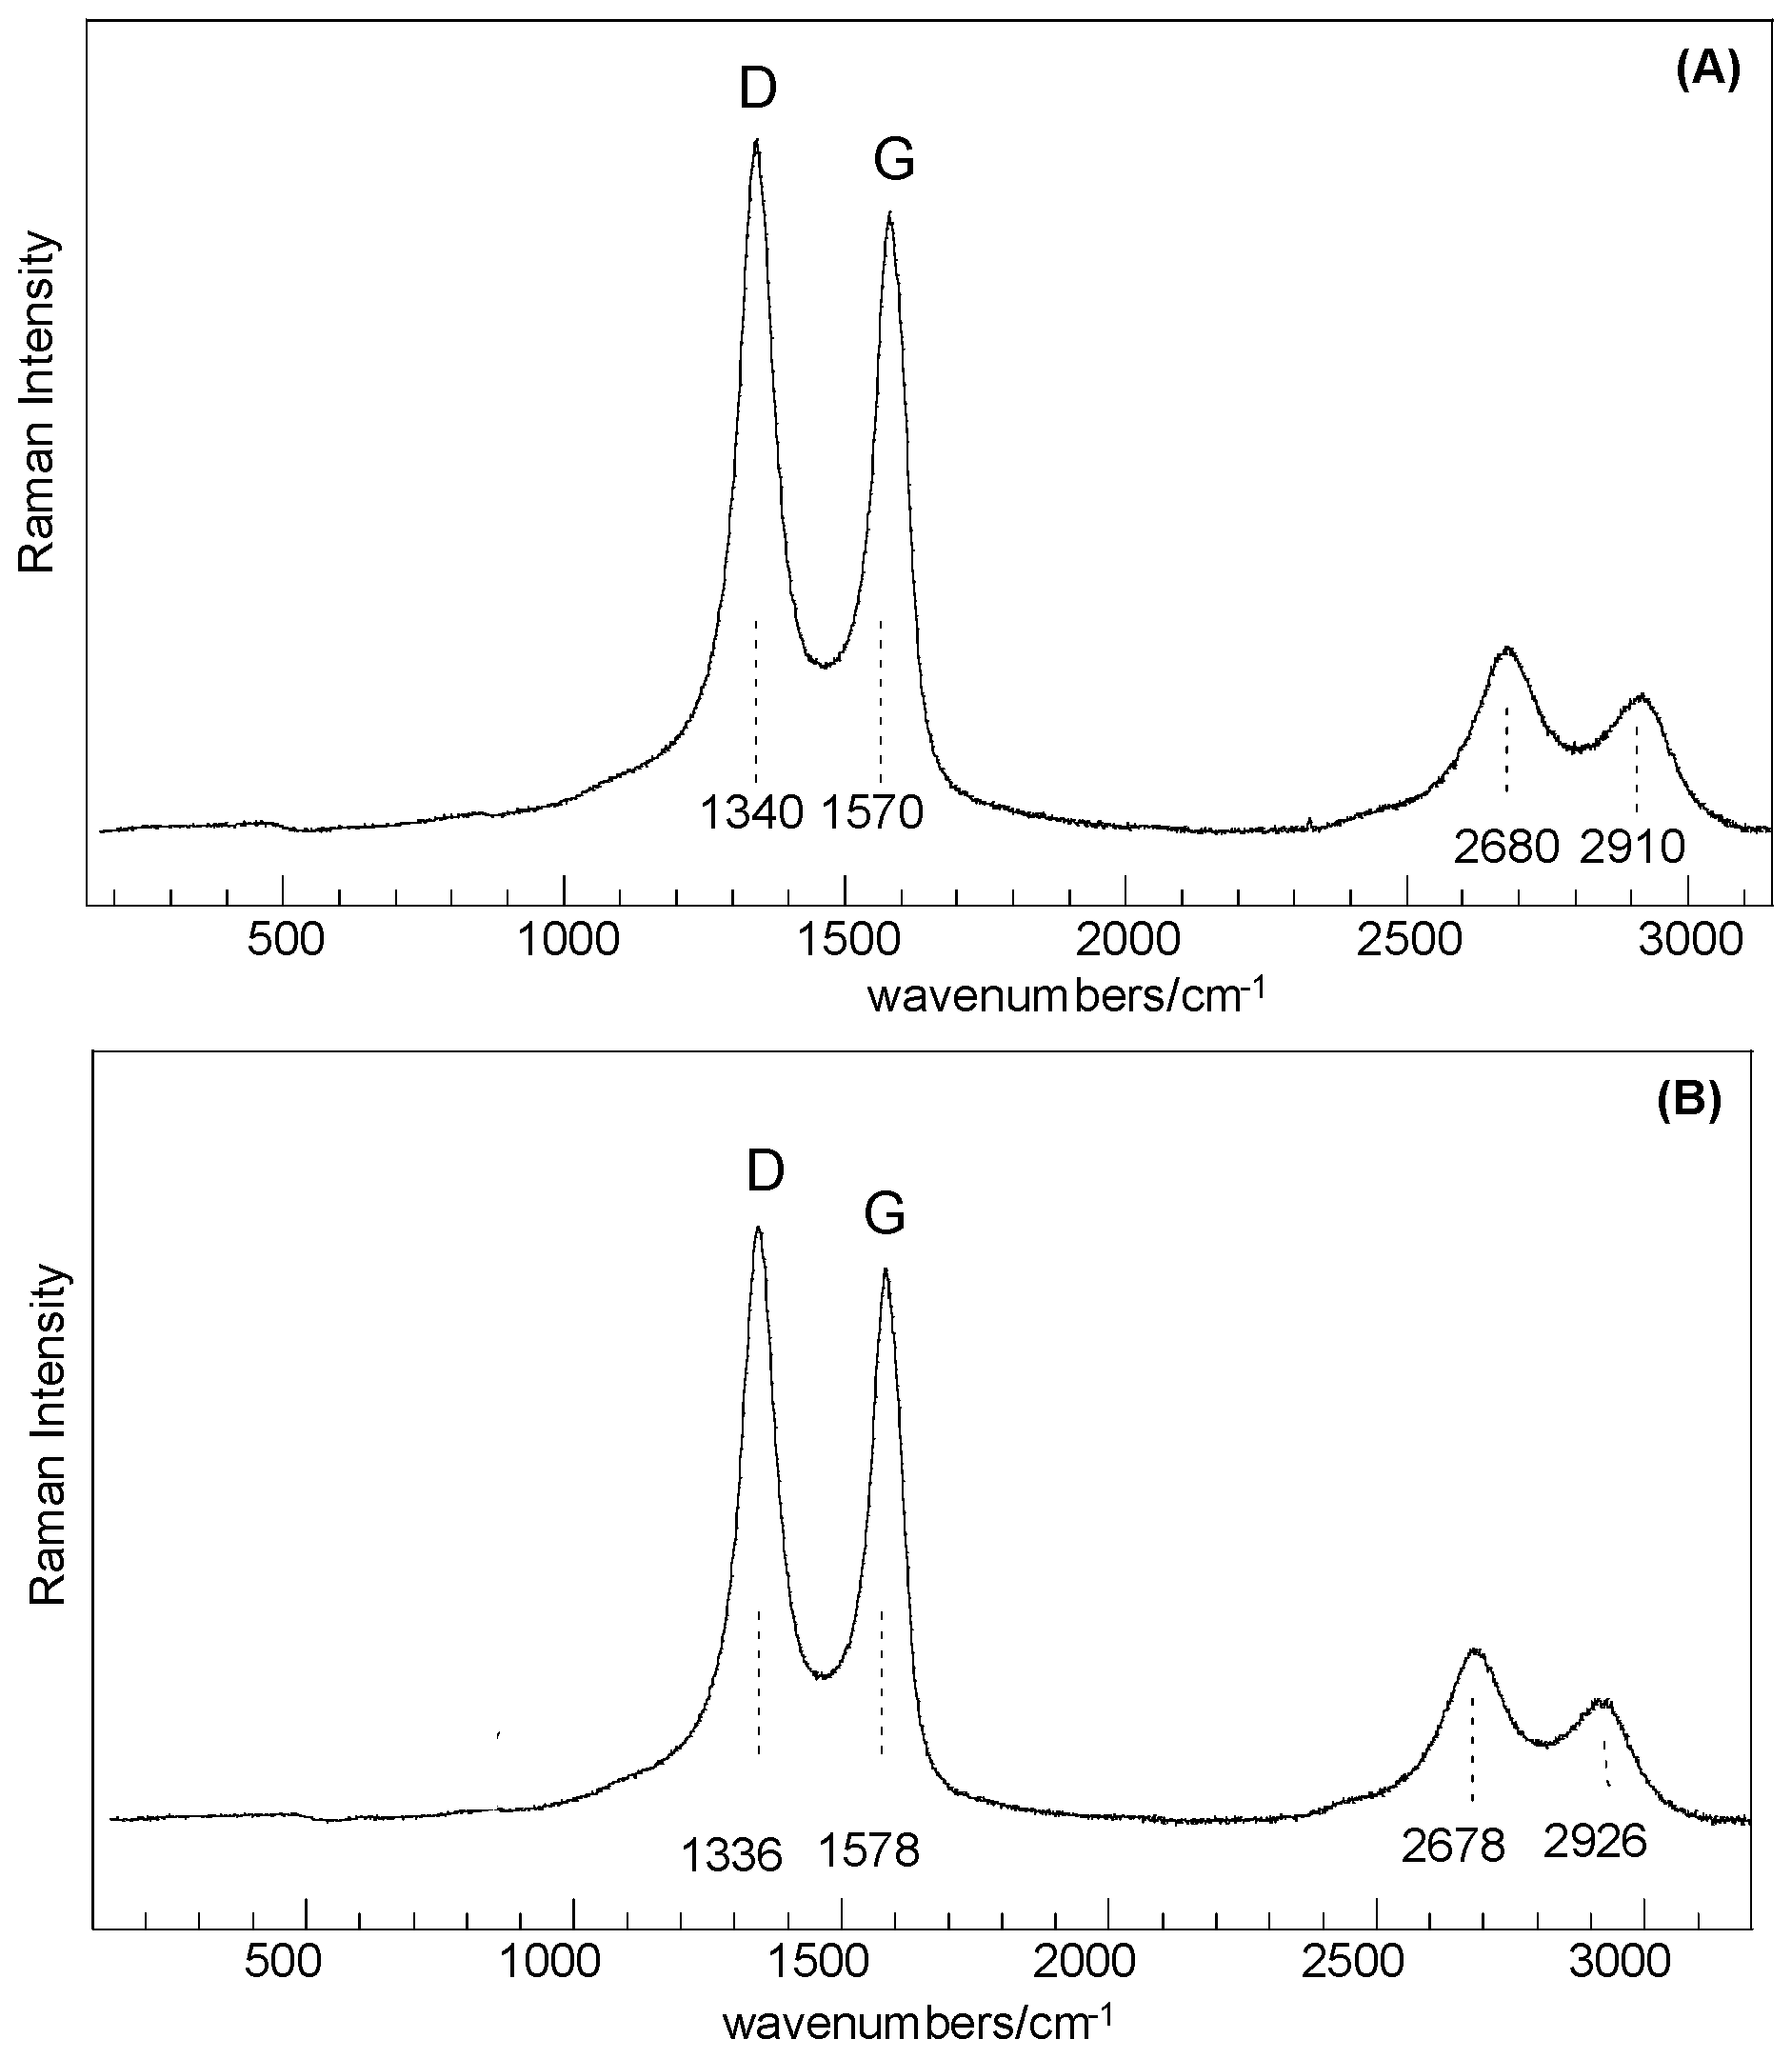
Results obtained from Raman analysis show that samples before and after thermal treatment share common features that can be correlated to SiO2-like structures and C-type species, as for disordered or defective graphitic species in an amorphous silica matrix. Dominant peaks at about 1340 cm−1, 1570 cm−1 (D and G bands, respectively), 2680, and 2910 cm−1 (second-order-related features) are assigned to highly disordered carbon species [21,22], whereas the very low intensity features in the range 200–1000 cm−1 are related to structures composed of Si–O tetrahedrally coordinated units (Figure 3). Basic SiO4 building blocks (silicon–oxygen tetrahedron) connected with each other are expected to yield Raman-active modes in the range 850–1250 cm−1 (Si–O stretching), 350–500 cm−1 (O–Si–O bending), and <300 cm−1 (Si–O–Si bending, torsional/twisting, and lattice vibrations), where as amorphous silica results in a broad band spanning the 201–515 cm−1 range [23,24].

Figure 3.
Full scan Raman spectra: (A) SiO2–C sample; (B) SiO2–C sample treated 24 h at 250 °C in liquid water.
For both the SC and SC-250 samples, the low intensity features in the range of 200–1000 cm−1 could be resolved by curve fitting (Figure 4A,B) and the bands at about 467, 690, and 816 cm−1 can be associated with quartz structural fractions, whereas bands at about 290 and 400 cm−1 can be attributed to the trimidite/crystobalite polymorphs. A little higher degree of crystallization can be obtained for the sample treated at 250 °C.
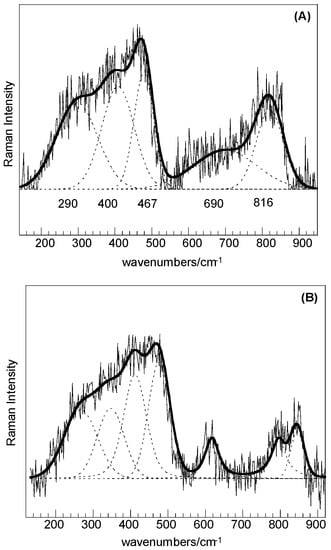
Figure 4.
Raman spectra in the range 150–1000 cm−1: (A) SiO2–C sample; (B) SiO2–C sample treated 24 h at 250 °C in liquid water.
A surface acidity characterization through an indirect method (i.e., catalytic decomposition reaction of isopropanol (IPA)) was carried out in order to determine acid–base properties of the support. As it has been demonstrated by Gervasini et al. [25], the isopropanol dehydration (that produces propylene and/or di-isopropylether) is catalyzed by acid sites. The dehydrogenation (that produces ketone), in absence of metals, is catalyzed by acid and basic sites through a concerted mechanism and serves as a basicity measure of materials analyzed. Table 3 shows the results of the catalytic decomposition reaction of isopropanol for SiO2 and SC supports at 200 °C.
Table 3.
Conversion of isopropanol (IPA) (XIPA) and selectivities to propylene (Sp), acetone (Sa), and di-isopropylether (Sdipe) in IPA decomposition reaction at 200 °C.
Both supports present very low isopropanol conversion (XIPA), evidencing the low surface acidity of these supports. It can be seen that the propylene and acetone products are in similar proportions, indicating the presence of weak Lewis acid sites and strong Lewis basics sites [26].
Table 4 shows the result of characterization of ruthenium catalysts (fresh and after reaction). Ruthenium content was determined by ICP (NexIon 300X, PerkinElmer, Shelton, CT, USA), obtaining a value similar to the nominal value (~0.20 wt %). Furthermore, it can be seen that the addition of ruthenium to the supports does not modify the values of SBET. Results obtained by TPR show the coexistence of two principal peaks of hydrogen consumption (indicated as “Tmain” and “Tsec”). As it was cited in the literature, this indicates the presence of two types of ruthenium oxides. Yan et al. reported that the low temperature peak (<230 °C) corresponds to well-dispersed species of RuOx, while the high temperature peak corresponds to the reduction of RuO2 particles [27]. Metal dispersion was calculated by the equation DTEM (%) = (6 × Vm)/(dTEM × Am), where dTEM is the metal particle size in nanometers, Vm is the volume occupied by a metal atom in the bulk (13.65 × 10⁻³ nm3), and Am is the surface area occupied by an exposed surface metal atom (9.09 × 10⁻² nm2) [28]. As can be seen in Table 4, the metal dispersion is close to 40% for the fresh Ru/SiO2 and Ru/SC samples.
Table 4.
Results of characterization of ruthenium catalysts before and after reaction.
Catalytic Activity: Glycerol Hydrogenolysis to Glycols
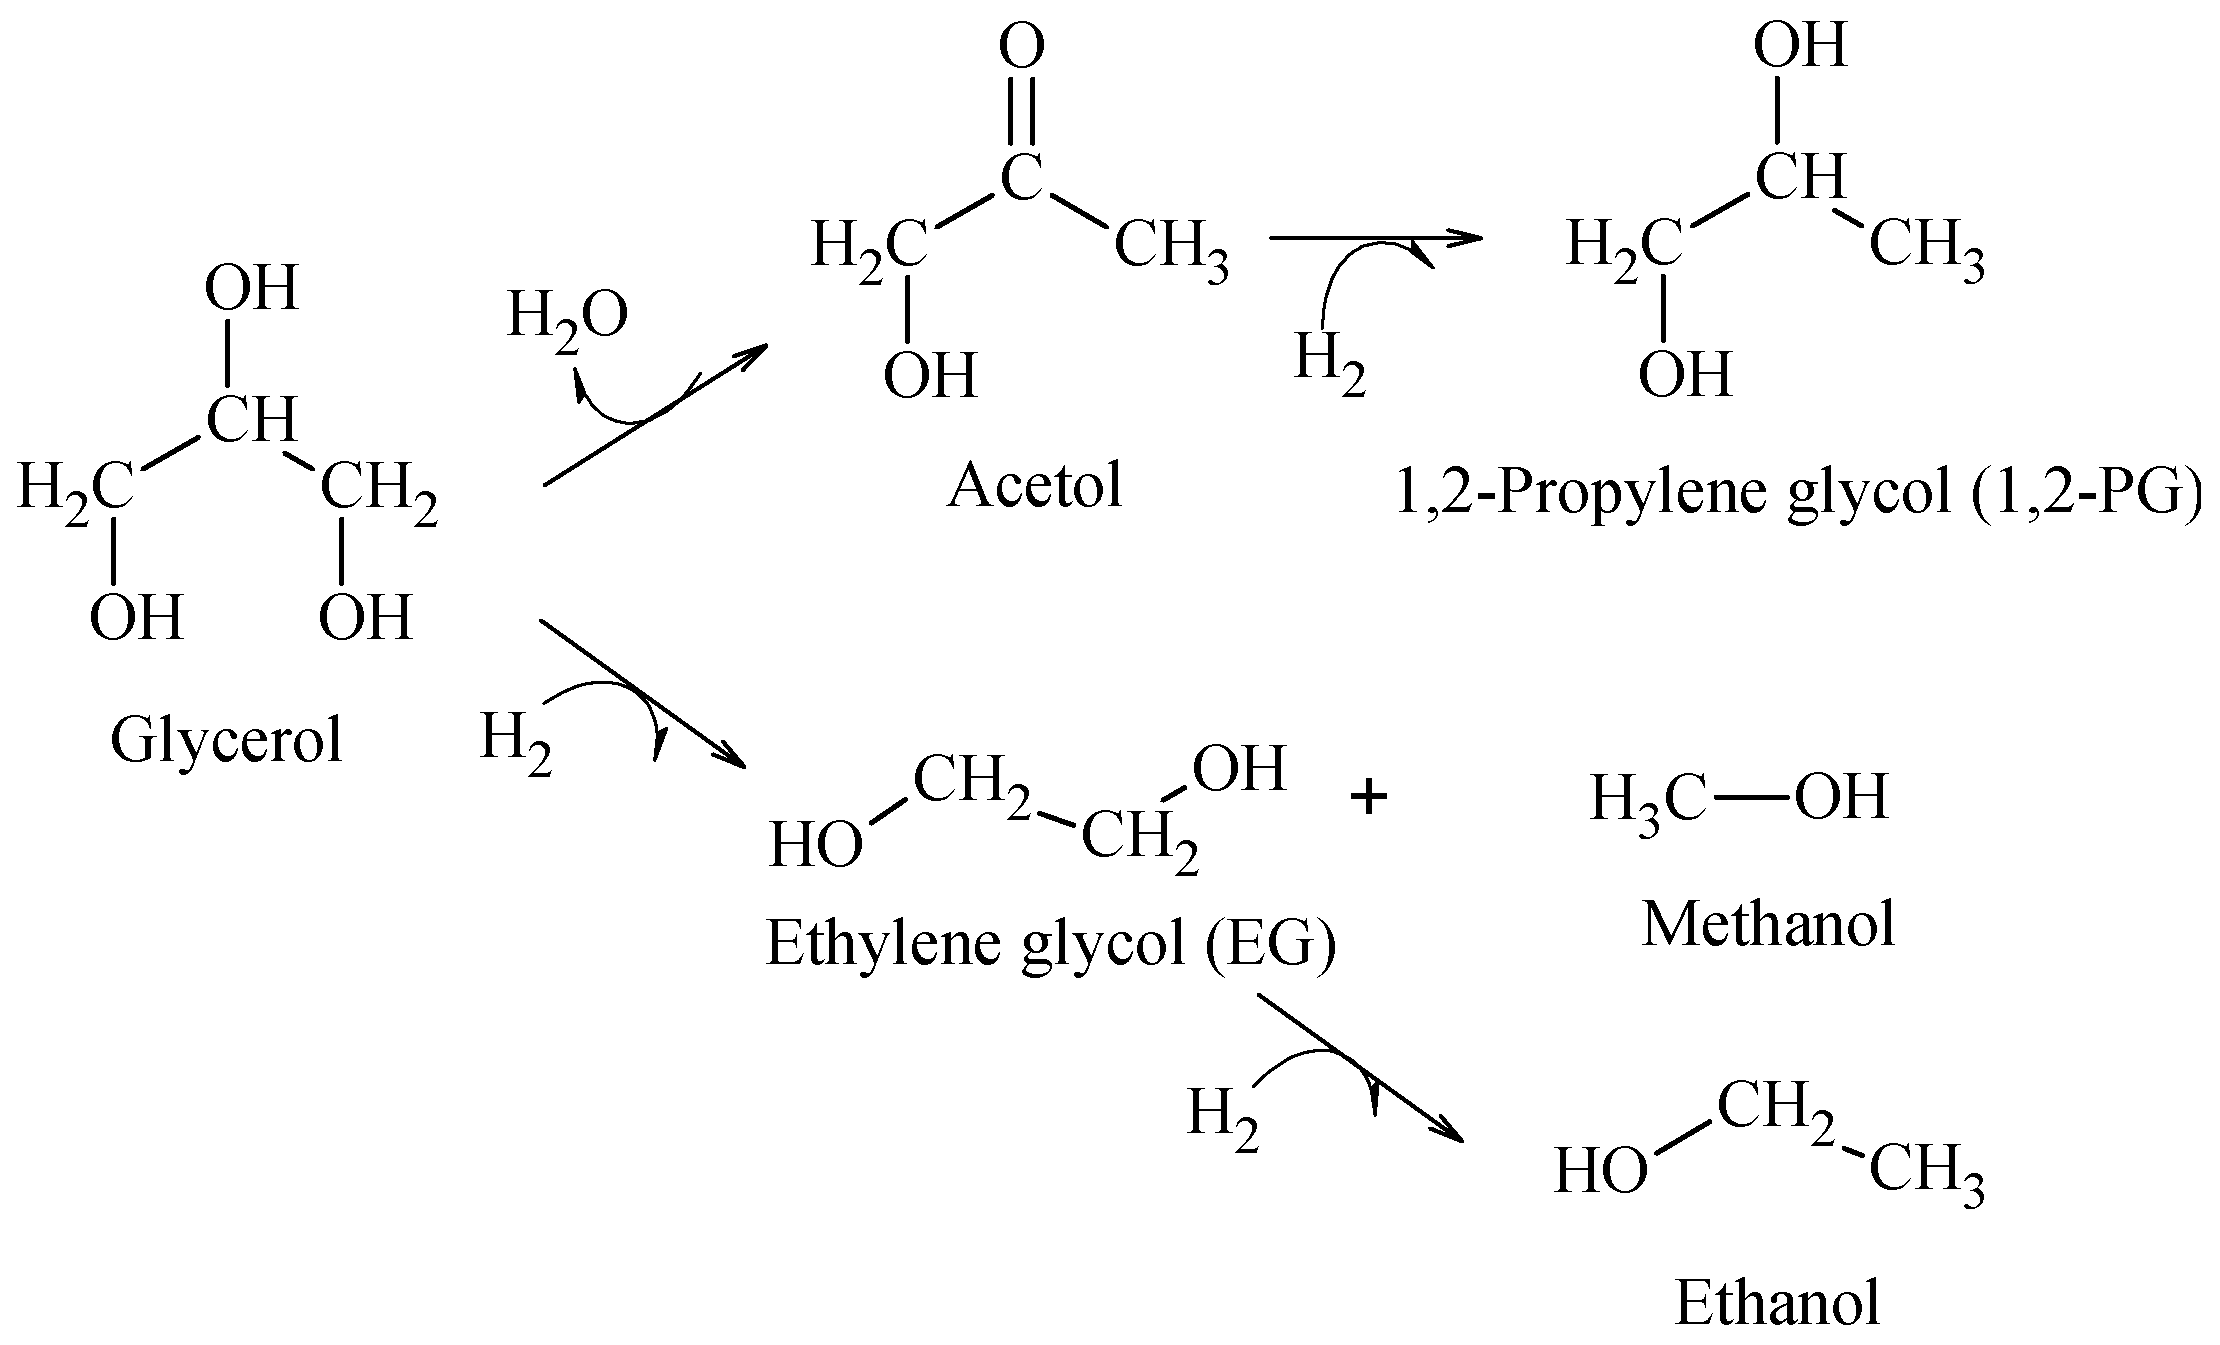
The hydrogenolysis of glycerol in liquid phase was employed as the reaction test. This reaction produces principally 1,2-propylene glycol (1,2-PG), through a mechanism that may proceed in the following ways: (i) a first dehydration on the metal site or acid sites on the support to produce acetol as intermediate and (ii) hydrogenation of acetol on the metal site to generate 1,2-PG (Scheme 1).

Scheme 1.
Principal products obtained from hydrogenolysis of glycerol in aqueous phase.
It was found that for a support presenting strong acid properties, the reaction can lead to a strong dehydration that produces acrolein [29], whereas when glycerol reacts directly with hydrogen by a C–C cleavage, the reaction produces ethylene glycol (EG) and other degradation products, such as methanol and ethanol, which are favored with temperature [30]. Accordingly, the hydrogenolysis tests were carried out at 200 °C to favor the production of 1,2-PG.
Results of the hydrogenolysis of glycerol with Ru/SC and Ru/SiO2 catalysts are presented in Figure 5A,B, respectively. The Ru/SC catalyst shows a higher activity than Ru/SiO2; a glycerol conversion to liquid products of 28% was obtained at 24 h, whereas it was reached ~6% at 24 h for the Ru/SiO2 sample. The conversion to gaseous products was negligible at 200 °C. For both catalysts, the main products at 200 °C are 1,2-PG and EG, reaching 76% and 20%, respectively, on the Ru/SC sample. Most 1,2-PG selectivity can be explained due to a greater contribution of C–O cleavage reactions versus C–C cleavage reactions that produce EG [7,31,32]. The selectivity to other products, such as methanol, ethanol, 1-propanol, and acetol is low (about 4%). This behavior indicates that both SiO2 and SC exhibit a similar surface acidity and do not contain strong acid sites.
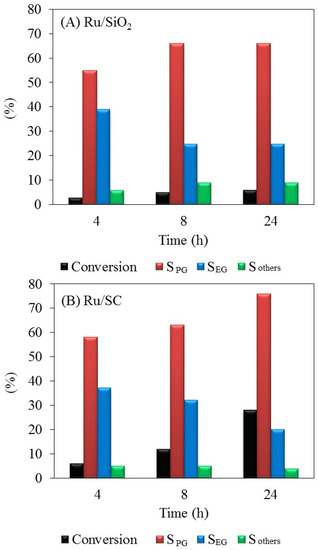
Figure 5.
Conversion and selectivities to 1,2-propylene glycol (SPG), ethylene glycol (SEG), and methanol + ethanol + 1-propanol + acetol (Sothers) in glycerol hydrogenolysis for the catalysts studied. (A) Ru/SiO2; (B) Ru/SC. Reaction conditions: 50 g of catalyst per liter of solution. Glycerol aqueous solution (10 wt %), 200 °C, 20 bar H2.
Catalyst deactivation in aqueous-phase reactions can occur by phase transformation of the supports, leaching and sintering of the supported metal particles, and coke formation on the catalyst surface [33]. According to Arena et al., Ru/Al2O3 catalysts in the hydrogenation in the aqueous phase may be deactivated due to changes in the physical properties of the support and agglomeration of Ru particles [34]. Gallezot et al. reported a strong deactivation of the Ru/SiO2 catalyst in the hydrogenation in liquid phase due to the instability of support [35].
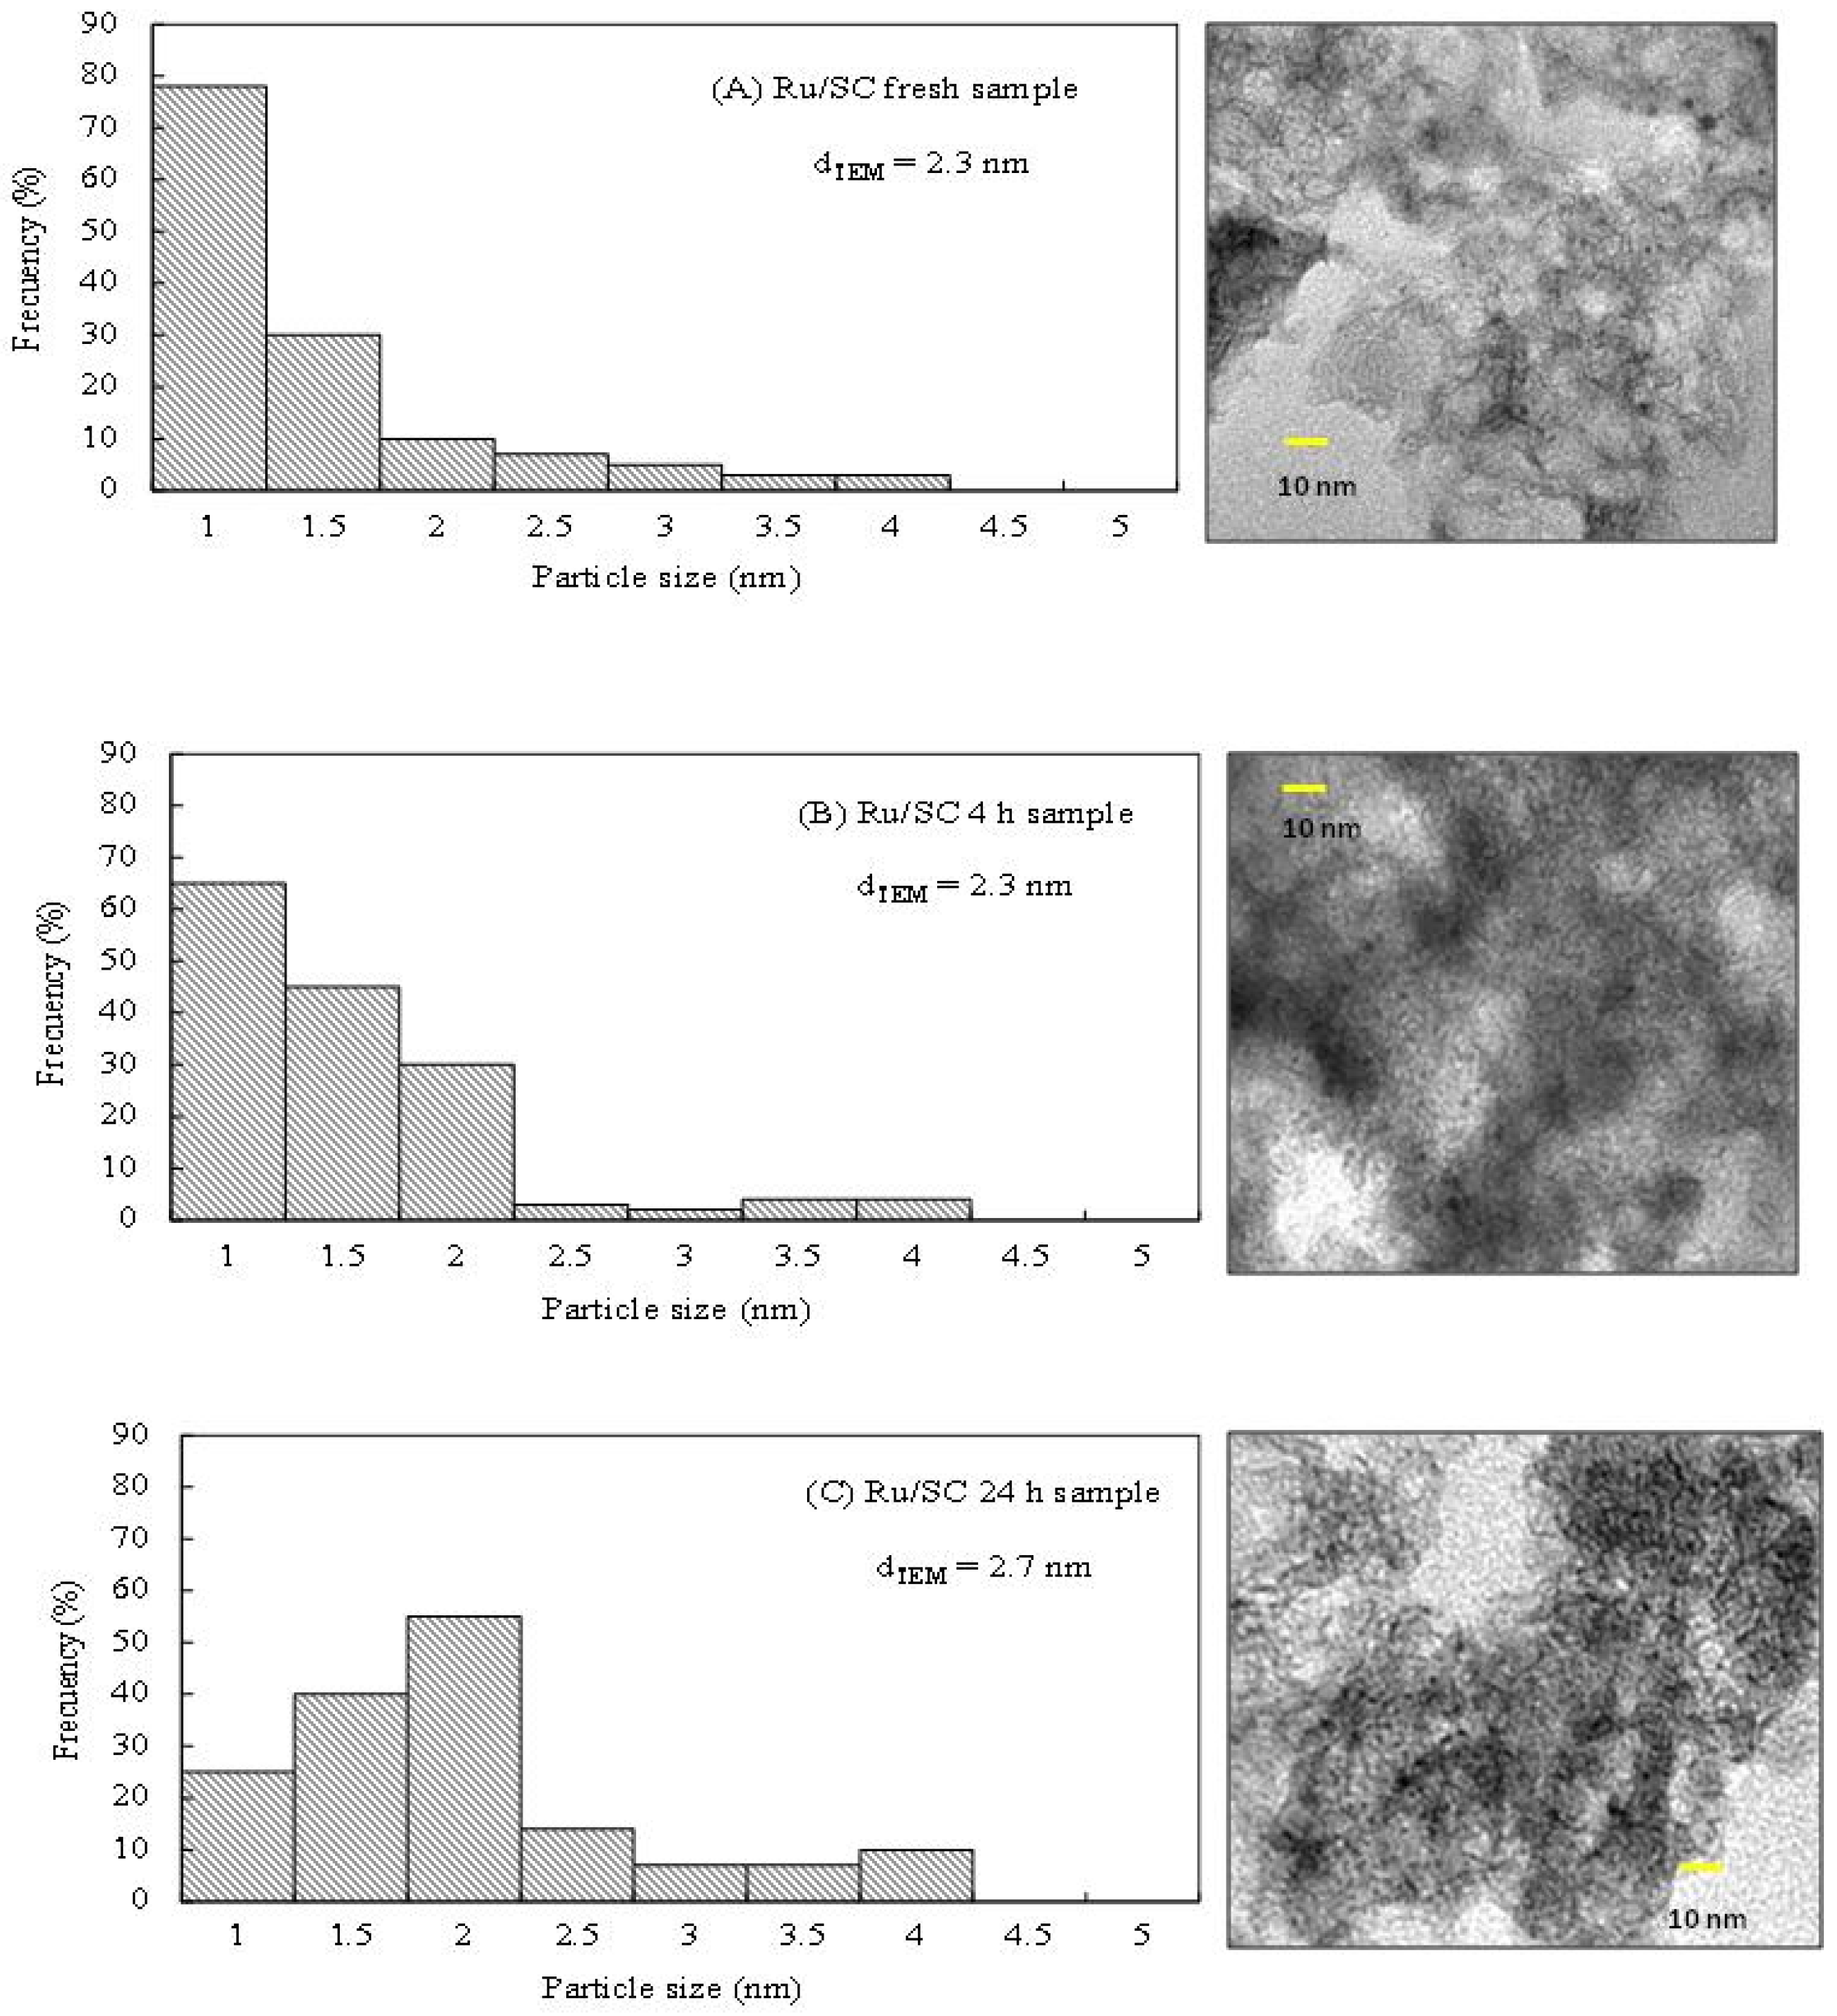
As can be observed in Figure 5A, the Ru/SiO2 catalyst shows that the conversion does not increase after 24 h in reaction, which could be explained by the transformation of the support and the collapse of the pores of silica observed in the treatment with water at 200 °C (Table 1). Figure 5B show that the glycerol conversion increases linearly with reaction time with the Ru/SC, indicating that the reaction rate is kept practically constant during the 24 h. To prove the stability of the metal phase, the distributions of particle sizes by TEM microscopy for both fresh and used sample were analyzed. The histogram of particle size distribution shows that the average particle diameter (dTEM) for the Ru/SC fresh sample is 2.3 nm (Figure 6A).

Figure 6.
Transmission Electron Microscopy TEM micrographs and diameter size distribution of (A) Ru/SC fresh sample; (B) Ru/SC 4 h used sample; and (C) Ru/SC 24 h used sample.
For the pos-reaction Ru/SC sample (Figure 6B), no changes are observed and the value of dTEM remains 2.3 nm during the 4 h reaction. Conversely, for the pos-reaction Ru/SC sample used for 24 h, the value of the average particle diameter is 2.7 nm, with a slight increase in the contribution of particles of 2 nm (Figure 6C). These slight changes confirm the stability of the metal particles in the reaction conditions.
3. Materials and Methods
3.1. Materials
The SiO2 carbon-containing sample was prepared, starting from the co-gelification of Tetraethyl orthosilicate TEOS (SILBOND 40-AKZO Chemicals, Buenos Aires, Argentina) and a liquid phenol–formaldehyde resin (RL 43003, ATANOR, Santa Fe, Argentina), as previously reported [36].
TEOS and RL 43003 were mixed on a magnetic stirrer until obtaining an emulsion, to which commercial ethyl alcohol (96 wt %) was gradually added until obtaining a translucent amber-colored liquid similar to the resin. Water necessary for TEOS gelification was provided by the alcohol and the liquid resin. Pre-gel liquid was poured into closed molds to gel at room temperature without solvent evaporation (alcohol and water). After 24 h, it was aerated at room temperature and dried at 50 °C for another 24 h. Subsequently, the material was heated to 180 °C with a 10 °C·h−1 heating rate, producing the resin polymerization.
Finally, the material was introduced to covered refractory crucibles to be calcined in a reducing atmosphere for 3 h on electrical oven at 1500 °C (at 5 °C·min−1). This material was denominated SC.
Hydrothermal treatments were carried out in liquid water at 50 bar N2 at 150 °C, 200 °C, and 250 °C during 24 h; the resulting samples were labeled SC-150, SC-200, and SC-250, respectively.
The Ru/SC and Ru/SiO2 catalysts were prepared by incipient wetness impregnation. RuCl3·xH2O (ruthenium content 38 wt %) was purchased from Sigma-Aldrich (St. Louis, MI, USA) and used without purification. Ethanol was purchased from Anedra (Buenos Aires, Argentina) and used as-received as solvent (96 wt %). Hydrophilic fumed silica (SiO2 AEROSIL 200) was obtained from Evonik Industries (Hanau-Wolfgang, Germany) and used as received. The solid was dried at 120 °C for 12 h and subsequently calcinated at 300 °C for 3 h in flowing Ar. Its activation was performed at 350 °C for 90 min in flowing H2.
3.2. Characterization
Adsorption–desorption measurements were performed on fresh and treated samples (SC, SC-150, SC-200, SC-250) for a textural characterization. Surface area measurements, Brunauer–Emmett–Teller (BET) multipoint method, and textural analysis results were obtained using Micromeritics ASAP 2020 equipment (Micromeritics Instrument Corporation, Norcross, GA, USA). The samples were pretreated under vacuum in two stages of 1 h at 100 and 300 °C. Textural characterization comprised specific surface measurements, pore width distribution determination, total pore volume, and micro- and mesopores volume values. Pore width distribution was calculated from the adsorption branch of each isotherm using the Barrett, Joyner, and Halenda model (BJH), assuming a pore model of “slit” type. Micropore surface (Smicro) and micropore volume (Vmicro) were estimated using the t-plot method, while the mesopore surface (Smeso) was calculated by subtracting Smicro from SBET.
Acid–base properties of supports were determined by an indirect method consisting of the test of isopropanol (IPA) decomposition. This reaction was tested in a continuous-flow fixed-bed reactor between 150 and 300 °C, atmospheric pressure, feed 4.5 wt % IPA in helium, with a flow 40 cm3·min−1.
Ruthenium content was determined by inductively coupled plasma mass spectrometry (ICP-MS) NexIon 300X (PerkinElmer, Shelton, CT, USA) analysis.
Temperature-programmed reduction tests (TPR) were performed using a dynamic equipment and the response was measured using a thermal conductivity detector. The feed flow was had a H2/N2 ratio of 1/9 and the heating rate was 10 °C·min−1 from room temperature up to 1000 °C.
The X-ray photoelectron spectroscopy (XPS) analysis was carried out in a multitechnique system (SPECS GmbH, Berlin, Germany), equipped with a dual Mg/Al X-ray source and a hemispherical PHOIBOS 150 analyzer operating in the fixed analyzer transmission (FAT) mode (SPECS GmbH, Berlin, Germany). The spectra were obtained with pass energy of 30 eV and an Al Kα anode operating at 200 W. The pressure during the measurement was less than 2 × 10⁻⁸ mbar. The samples were subjected to a reduction treatment for 10 min at 400 °C in a H2-5%/Ar stream in the pretreatment chamber of the equipment.
The Raman spectra were obtained from the powder samples at room temperature in the back-scattering geometry with an inVia Renishaw spectrometer (Hoffman Estates, IL, USA) equipped with an air-cooled charge-coupled device (CCD) detector and edge filters. The emission line at 488.5 nm from an Ar+ ion laser (power of the incident beam on the sample of about 5 mW) was focused on the sample under a Leica DLML microscope (Leica Microsystems, Buffalo Grove, IL, USA) using 20× or 5× objectives. The spectral resolution was 2 cm−1. The spectra were calibrated using the 520.5 cm−1 line of a silicon wafer. Band position, integrated band area, and band width (full width at half maximum, FWHM) were determined after background subtraction by a curve-fitting procedure with mixed Gaussian–Lorentzian functions using variable position, full width at half-maximum (FWHM), and intensities (PEAKFIT 3.2, Jandel Scientific Inc., San Rafael, CA, USA).
Transmission electron microscopy (TEM) images were taken by means of a TEM JEOL 100 C instrument (JEOL Ltd., Tokyo, Japan), operating at 200 KV. A graphite pattern was used for calibration. In this analysis, a suspension in 2-propanol was prepared by stirring the solid sample with ultrasound for 10 min. A few drops of the resulting suspension were deposited on a TEM Cu grid (Lacey Carbon Film 300 mesh, Electron Microscopy Science, Hatfield, PA, USA) and subsequently dried and evacuated before the analysis. To estimate the average particle size (dTEM), the particles were considered spherical and the diameter volume-area was calculated by the expression:
where ni is the number of particles with diameter di. Histograms of particle size distribution arose from microphotographs using the technique of clear field image.
3.3. Catalytic Tests
Hydrogenolysis reaction tests in the liquid phase of glycerol were performed in a discontinuous reactor (Berghof BR 100) (Berghof, Eningen, Germany) using analytic-grade glycerol (99.99 wt %, Anedra, Buenos Aires, Argentina) in aqueous solution at 10 wt %. The catalytic tests were carried out at 200 °C, with 50 g of catalyst per liter of solution and initial hydrogen pressure of 20 bar. Agitation of 1000 rpm was required to perform the test based on kinetic control.
For the analysis and quantification of gaseous products, a chromatograph Shimadzu GC-8A (Shimadzu Corporation, Tokyo, Japan) equipped with a thermal conductivity detector (TCD) with a Hayesep D 100–120 column was used. For the analysis and quantification of liquid products, a GCMS-QP505A Shimadzu chromatograph (Shimadzu Corporation, Tokyo, Japan) equipped with a 19091S-001 HP PONA 50 m capillary column (Agilent J&W, Santa Clara, CA, USA), flame ionization detector (FID), and MS detector was used (Shimadzu Corporation, Tokyo, Japan). The accuracy of the measured values was within 5%, and the experiments could be reproduced with a relative error of 10%.
4. Conclusions
The stability of SiO2–C material is demonstrated, allowing its application as catalyst support for processing raw materials derived from biomass in hot liquid water. Adsorption–desorption measurements were performed, finding that in any case there is a no loss of surface area. Raman analysis showed that the material is made of a disordered graphitic structure in an amorphous silica matrix, which remains stable after hydrothermal treatment. Besides, the small changes observed by XPS and Raman in the treated samples indicate the stability of the acid–base properties of the support and the role of carbon for stabilizing the silica. Compared to commercial Ru/SiO2, the results of activity and stability of Ru/SC are promising for several applications, such as the hydrogenolysis of glycerol in aqueous liquid phase.
Acknowledgments
This research was conducted with financial support from: “Consejo Nacional de Investigaciones Científicas y Técnicas” (CONICET-PIP 611) and “Universidad Nacional de La Plata” (UNLP-I-175). The authors thank Edgardo Soto for BET measurements.
Author Contributions
Martín N. Gatti carried out all the experimental work which was conceived and designed with Gerardo F. Santori and Francisco Pompeo; Barbara Lombardi conducted the synthesis of mesoporous carbon materials; Delia Gazzoli contributed to Raman analysis and also critically revised the manuscript; Nora N. Nichio wrote the paper. All authors read and approved the final manuscript.
Conflicts of Interest
The authors declare no conflict of interest.
References
- Zhang, J.; Teo, J.; Chen, X.; Asakura, H.; Tanaka, T.; Teramura, K.; Yan, N. A series of NiM (M = Ru, Rh, and Pd) bimetallic catalysts for effective lignin hydrogenolysis in water. ACS Catal. 2014, 4, 1574–1583. [Google Scholar] [CrossRef]
- Manaenkov, O.; Mann, J.; Kislitza, O.; Losovyj, Y.; Stein, B.; Morgan, D.; Pink, M.; Lependina, O.; Shifrina, Z.; Matveeva, V.; et al. Ru-containing magnetically recoverable catalysts: A sustainable pathway from cellulose to ethylene and propylene glycols. ACS Appl. Mater. Interfaces 2016, 8, 21285–21293. [Google Scholar] [CrossRef] [PubMed]
- Murillo Leo, I.; Lopez Granados, M.; Garcia Fierro, J.L.; Mariscal, R. Sorbitol hydrogenolysis to glycols by supported ruthenium catalysts. Chin. J. Catal. 2014, 35, 614–621. [Google Scholar]
- Feng, J.; Fu, H.; Wang, J.; Li, R.; Chen, H.; Li, X. Hydrogenolysis of glycerol to glycols over ruthenium catalysts: Effect of support and catalyst reduction temperature. Catal. Commun. 2008, 9, 1458–1464. [Google Scholar] [CrossRef]
- Feng, J.; Zhang, Y.; Xiong, W.; Ding, H.; He, B. Hydrogenolysis of glycerol to 1,2-propanediol and ethylene glycol over Ru-Co/ZrO2. Catalysts 2016, 6, 51. [Google Scholar] [CrossRef]
- Liu, H.Z.; Liang, S.G.; Jiang, T.; Han, B.X.; Zhou, Y.X. Hydrogenolysis of glycerol to 1,2-propanediol over Ru-Cu bimetals supported on different supports. Clean Soil Air Water 2012, 40, 318–324. [Google Scholar] [CrossRef]
- Salazar, J.B.; Falcone, D.D.; Pham, H.N.; Datye, A.K.; Passos, F.B.; Davis, R.J. Selective production of 1,2-propanediol by hydrogenolysis of glycerol over bimetallic Ru-Cu nanoparticles supported on TiO2. Appl. Catal. A 2014, 482, 137–144. [Google Scholar] [CrossRef]
- Ahmed, T.S.; Abdelaziz, O.Y.; Roberts, G.W. Preparation of Al2O3/AlF3-supported ruthenium catalysts for the hydrogenolysis of biodiesel-derived crude glycerol. Ind. Eng. Chem. Res. 2016, 55, 5536–5544. [Google Scholar] [CrossRef]
- Soares, A.V.H.; Salazar, J.B.; Falcone, D.D.; Vasconcellos, F.A.; Davis, R.J.; Passos, F.B. A study of glycerol hydrogenolysis over Ru-Cu/Al2O3 and Ru-Cu/ZrO2 catalysts. J. Mol. Catal. A Chem. 2016, 415, 27–36. [Google Scholar] [CrossRef]
- Luo, N.; Fu, X.; Cao, F.; Xiao, T.; Edwards, P. Glycerol aqueous phase reforming for hydrogen generation over Pt catalyst-Effect of catalyst composition and reaction conditions. Fuel 2008, 87, 3483–3489. [Google Scholar] [CrossRef]
- Ravenelle, R.; Copeland, J.; Kim, W.; Crittenden, J. Structural changes of γ-Al2O3-supported catalysts in hot liquid water. ACS Catal. 2011, 1, 552–561. [Google Scholar] [CrossRef]
- Ketchie, W.; Maris, E.; Davis, R. In-situ X-ray absorption spectroscopy of supported Ru catalysts in the aqueous phase. Chem. Mater. 2007, 19, 3406–3411. [Google Scholar] [CrossRef]
- Lehnert, K.; Claus, P. Influence of Pt particle size and support type on the aqueous-phase reforming of glycerol. Catal. Commun. 2008, 9, 2543–2546. [Google Scholar] [CrossRef]
- Vilcocq, L.; Cabiac, A.; Especel, C.; Lacombe, S.; Duprez, D. Study of the stability of Pt/SiO2-Al2O3 catalysts in aqueous medium: Application for sorbitol transformation. Catal. Commun. 2011, 15, 18–22. [Google Scholar] [CrossRef]
- Pham, T.N.; Shi, D.; Sooknoi, T.; Resasco, D.E. Aqueous-phase ketonization of acetic acid over Ru/TiO2/carbon catalysts. J. Catal. 2012, 295, 169–178. [Google Scholar] [CrossRef]
- Huang, B.; Bartholomew, C.H.; Woodfield, B.F. Improved calculations of pore size distribution for relatively large, irregular slit-shaped mesopore structure. Microporous Mesoporous Mater. 2014, 184, 112–121. [Google Scholar] [CrossRef]
- Alegre, C.; Gálvez, M.E.; Baquedano, E.; Pastor, E.; Moliner, R.; Lázaro, M.J. Influence of support’s oxygen functionalization on the activity of Pt/carbon xerogels catalysts for methanol electro-oxidation. Int. J. Hydrogen Energy 2012, 37, 7180–7191. [Google Scholar] [CrossRef]
- Mager, N.; Meyer, N.; Léonard, A.F.; Job, N.; Devillers, M.; Hermans, S. Functionalization of carbon xerogels for the preparation of palladium supported catalysts applied in sugar transformations. Appl. Catal. B Environ. 2014, 148–149, 424–435. [Google Scholar] [CrossRef]
- Ros, T.G.; van Dillen, A.J.; Geus, J.W.; Koningsberger, D.C. Surface oxidation of carbon nanofibres. Chem. A Eur. J. 2002, 8, 1151–1162. [Google Scholar] [CrossRef]
- Proctor, A.; Sherwood, P. X-ray photoelectron spectroscopic studies of carbon fibre surfaces. I. carbon fibre spectra and the effects of heat treatment. J. Electron Spectrosc. Relat. Phenom. 1982, 27, 39–56. [Google Scholar] [CrossRef]
- Arepalli, S.; Nikolaev, P.; Gorelik, O.; Hadjiev, V.; Holmes, W.; Files, B.; Yowell, L. Protocol for the characterization of single-wall carbon nanotube material quality. Carbon 2004, 42, 1783–1791. [Google Scholar] [CrossRef]
- Ferrari, A.; Robertson, J. Interpretation of Raman spectra of disordered and amorphous carbon. Phys. Rev. B 2000, 61, 14095–14107. [Google Scholar] [CrossRef]
- Tarrant, R.N.; Warschkow, O.; McKenzie, D.R. Raman spectra of partially oriented sp2 carbon films: Experimental and modeled. Vib. Spectrosc. 2006, 41, 232–239. [Google Scholar] [CrossRef]
- You, J.L.; Jiang, G.C.; Hou, H.Y.; Chen, H.; Wu, Y.Q.; Xu, K.D. Quantum chemistry study on superstructure and Raman spectra of binary sodium silicates. J. Raman Spectrosc. 2005, 36, 237–249. [Google Scholar] [CrossRef]
- Gervasini, A.; Fenyvesi, J.; Auroux, A. Study of the acidic character of modified metal oxide surfaces using the test of isopropanol decomposition. Catal. Lett. 1997, 43, 219–228. [Google Scholar] [CrossRef]
- Larmier, K.; Chizallet, C.; Cadran, N.; Abboud, M.J.; Lamic-Humblot, A.F.; Marceau, E.; Lauron-Pernot, H. Mechanistic investigation of isopropanol conversion on alumina catalysts: Location of active sites for alkene/ether production. ACS Catal. 2015, 5, 4423–4437. [Google Scholar] [CrossRef]
- Yan, Q.G.; Wu, T.H.; Weng, W.Z.; Toghiani, H.; Toghiani, R.K.; Wan, H.L.; Pittman, C.U. Partial oxidation of methane to H2 and CO over Rh/SiO2 and Ru/SiO2 Catalysts. J. Catal. 2004, 226, 247–259. [Google Scholar] [CrossRef]
- Li, D.; Li, R.; Lu, M.; Lin, X.; Zhan, Y.; Jiang, L. Carbon dioxide reforming of methane over Ru catalysts supported on Mg-Al oxides: A highly dispersed and stable Ru/Mg(Al)O catalyst. Appl. Catal. B Environ. 2017, 200, 566–577. [Google Scholar] [CrossRef]
- Pérez-Barrado, E.; Pujol, M.C.; Aguiló, M.; Llorca, J.; Cesteros, Y.; Díaz, F.; Pallarès, J.; Marsal, L.F.; Salagre, P. Influence of acid-base properties of calcined MgAl and CaAl layered double hydroxides on the catalytic glycerol etherification to short-chain polyglycerols. Chem. Eng. J. 2015, 264, 547–556. [Google Scholar] [CrossRef]
- Barbelli, M.; Santori, F.; Nichio, N. Aqueous phase hydrogenolysis of glycerol to bio-propylene glycol over Pt-Sn catalysts. Bioresour. Technol. 2012, 111, 500–503. [Google Scholar] [CrossRef] [PubMed]
- Vasiliadou, E.S.; Heracleous, E.; Vasalos, I.A.; Lemonidou, A.A. Ru-based catalysts for glycerol hydrogenolysis—Effect of support and metal precursor. Appl. Catal. B Environ. 2009, 92, 90–99. [Google Scholar] [CrossRef]
- Miyazawa, T.; Koso, S.; Kunimori, K.; Tomishige, K. Development of a Ru/C catalyst for glycerol hydrogenolysis in combination with an ion-exchange resin. Appl. Catal. A 2007, 318, 244–251. [Google Scholar] [CrossRef]
- Bartholomew, C.H.; Farrauto, R.J. Fundamentals of Industrial Catalytic Processes, 2nd ed.; John Wiley and Sons: Hoboken, NJ, USA, 2005; pp. 1–954. [Google Scholar]
- Arena, B.J. Deactivation of ruthenium catalysts in continuous glucose hydrogenation. Appl. Catal. A 1992, 87, 219–229. [Google Scholar] [CrossRef]
- Besson, M.; Gallezot, P. Deactivation of metal catalysts in liquid phase organic reactions. Catal. Today 2003, 81, 547–559. [Google Scholar] [CrossRef]
- Lombardi, B.; Pompeo, F.; Scian, A.N.; Nichio, N.N. High specific surface area of SiO2-C meso- and nanoporous materials textural assessment and surface development. Mater. Lett. 2013, 106, 393–395. [Google Scholar] [CrossRef]


© 2016 by the authors; licensee MDPI, Basel, Switzerland. This article is an open access article distributed under the terms and conditions of the Creative Commons Attribution (CC-BY) license (http://creativecommons.org/licenses/by/4.0/).