Article

Low-Temperature Catalytic Performance of Ni-Cu/Al2O3 Catalysts for Gasoline Reforming to Produce Hydrogen Applied in Spark Ignition Engines

1
Department of Internal Combustion Engine, School of Transportation Engineering, Hanoi University of Science and Technology, No.1 Dai Co Viet street, Hanoi 112400, Vietnam
2
Department of Socio-Environmental Energy Science, Graduate School of Energy Science, Kyoto University, Yoshida Honmachi, Sakyo-ku, Kyoto 606-8501, Japan
*
Author to whom correspondence should be addressed.
Catalysts 2016, 6(3), 45; https://doi.org/10.3390/catal6030045
Submission received: 1 September 2015 / Revised: 1 March 2016 / Accepted: 7 March 2016 / Published: 14 March 2016

Abstract

:
The performance of Ni-Cu/Al2O3 catalysts for steam reforming (SR) of gasoline to produce a hydrogen-rich gas mixture applied in a spark ignition (SI) engine was investigated at relatively low temperature. The structural and morphological features and catalysis activity were observed by X-ray diffractometry (XRD), scanning electron microscopy (SEM), and temperature programmed reduction (TPR). The results showed that the addition of copper improved the dispersion of nickel and therefore facilitated the reduction of Ni at low temperature. The highest hydrogen selectivity of 70.6% is observed over the Ni-Cu/Al2O3 catalysts at a steam/carbon ratio of 0.9. With Cu promotion, a gasoline conversion of 42.6% can be achieved at 550 °C, while with both Mo and Ce promotion, the gasoline conversions were 31.7% and 28.3%, respectively, higher than with the conventional Ni catalyst. On the other hand, initial durability testing showed that the conversion of gasoline over Ni-Cu/Al2O3 catalysts slightly decreased after 30 h reaction time.

Graphical Abstract

1. Introduction

Hydrogen is an emerging alternative used increasingly to replace the depletion of conventional fossil fuels—it has long been recognized as a fuel having some highly desirable properties for application in engines [1]. These features make hydrogen an excellent fuel to potentially meet the increasingly stringent targets for exhaust emissions from combustion devices, including the reduction of greenhouse gas emissions. Hydrogen can be used in internal combustion engines (ICE) on its own or as a partial substitute for traditional ICE fuels to improve performance and emissions, as has been reported by many researchers [2,3,4,5,6,7,8,9,10,11].
The combustion speed of the mixture of hydrogen and air is much higher than other petroleum mixtures. Burning its mixture with air requires ignition by a spark. However, the spark needs only a minuscule amount of energy to ignite this mixture [12]. A hydrogen engine is easy to start in a cold winter because hydrogen remains in a gaseous state until it reaches the low temperature of −253 °C [13]. Its combustion products are clean, consisting of water and a tiny amount of NOx [14].
Hydrogen-rich gaseous fuel was produced by exhaust gas assisted reforming of gasoline or diesel fuel with steam (on-board production) [8,15]. This technique can potentially provide a feasible and practical engine system. It does not require a secondary fueling system, which is undesirable for the driver/operator.
Hydrogen-rich gaseous fuel involves hydrogen generation by direct catalytic interaction of liquid fuels with steam (steam reforming). Krumplet et al. reported the activity of different transition metals (Fe, Cu, Co, Ag, Ru, Ni, Pt, Pd, Rh) for converting liquid fuels into hydrogen-rich products; all metals exhibited 100% conversion above 700 °C [16,17,18,19]. They also reported that below 600 °C, conversion drops more quickly for first-row transition metals (particularly Ni and Co) than for second-row (Ru) and third-row (Pt, Pd) ones. The second- and third-row transition metals exhibit higher H2 selectivity (>60%) than the first-row transition metals at temperatures above 650 °C [16]. Nickel has been widely used as a catalyst for steam reforming of gasoline fuels because of its high electronic conductivity, thermal stability, activity, and low cost [20]. However, it showed low conversion of gasoline fuels at low temperatures and was easily deactivated at high temperatures [21,22,23]. Addition of a second metal (Co, Mo, W, Re, Pd) to the Ni-alumina catalyst also resulted in better activity at much lower operating temperatures [21,22,23,24,25,26]. The activity, durability, and hydrogen selectivity of nickel catalysts doped with a thermal stabilizer and activity promoter, such as lanthanum and cerium oxide, respectively, were reported [27]; a lower carbon deposition and a higher thermal stability of metallic Ni particles under the reaction conditions were also observed [27]. Ni catalysts containing Cu have already been found to have significantly different catalytic activity and yield distribution compared to monometallic Ni catalysts in many reactions [28,29,30,31,32]. For example, the addition of Cu to Ni enhanced the catalytic effect of steam reforming of dimethyl at low temperatures [28]. It is also reported that adding Cu to Ni in the ethanol steam reforming reaction not only reduced CO generation, but also improved resistance to coke formation on the Ni catalysts [29]. It has been suggested that changes in the catalytic properties induced by Cu addition to Ni can be caused by changes in the electronic and/or geometric properties of the homogeneous bimetallic particles [15]. Huang et al. reported the WGS (water gas shift) reaction during steam reforming of methane over supported Cu-Ni catalysts and showed that the addition of Cu to Ni catalysts enhanced the WGS activity [16]. The presence of Cu in Ni catalysts may suppress methane steam reforming activity and thus enhance the extent of the WGS reaction in methane steam reforming [16]. In addition, Li et al. also reported that the Cu- and Ni-loaded ceria catalyst retained high activity in the WGS reaction [20]. However, the Ni-Cu catalysts for steam reforming of gasoline fuels to produce hydrogen have not been investigated. Therefore, the aim of this study was to investigate the catalytic performance of Ni-Cu/γ-Al2O3 for steam reforming of gasoline to produce hydrogen at relatively lower temperatures, which is suitable for the exhaust gases of spark ignition (SI) engines.

2. Results and Discussion

2.1. Textural, Structural, and Morphological Characterizations

2.1.1. Textural Characterizations

Table 1 shows the surface and pore properties of different catalysts. The specific surface area, pore volume, and average pore diameter of (Ni0.5-Cu0.5)x/(Al2O3)1−x catalysts (x = 6 wt. %, 18 wt. %, and 36 wt. %) decreased with the increase of Ni-Cu loading; the reason could be the depositions of the active components in the pores and the micropores of γ-Al2O3. The surface area (152.8 m2/g) and total pore volume (0.22 cm3/g) of 18 wt. % Ni/γ-Al2O3 catalyst demonstrated progressive substitution of Ni by Cu of 18 wt. % Ni1−x-Cux /Al2O3 catalysts; this results in a slight increase of the BET area and total pore volume, which may be caused by the different CuO and NiO crystallite sizes and formation of mixed oxides. In addition, the surface area and pore structure of different catalysts are also shown in Table 1.

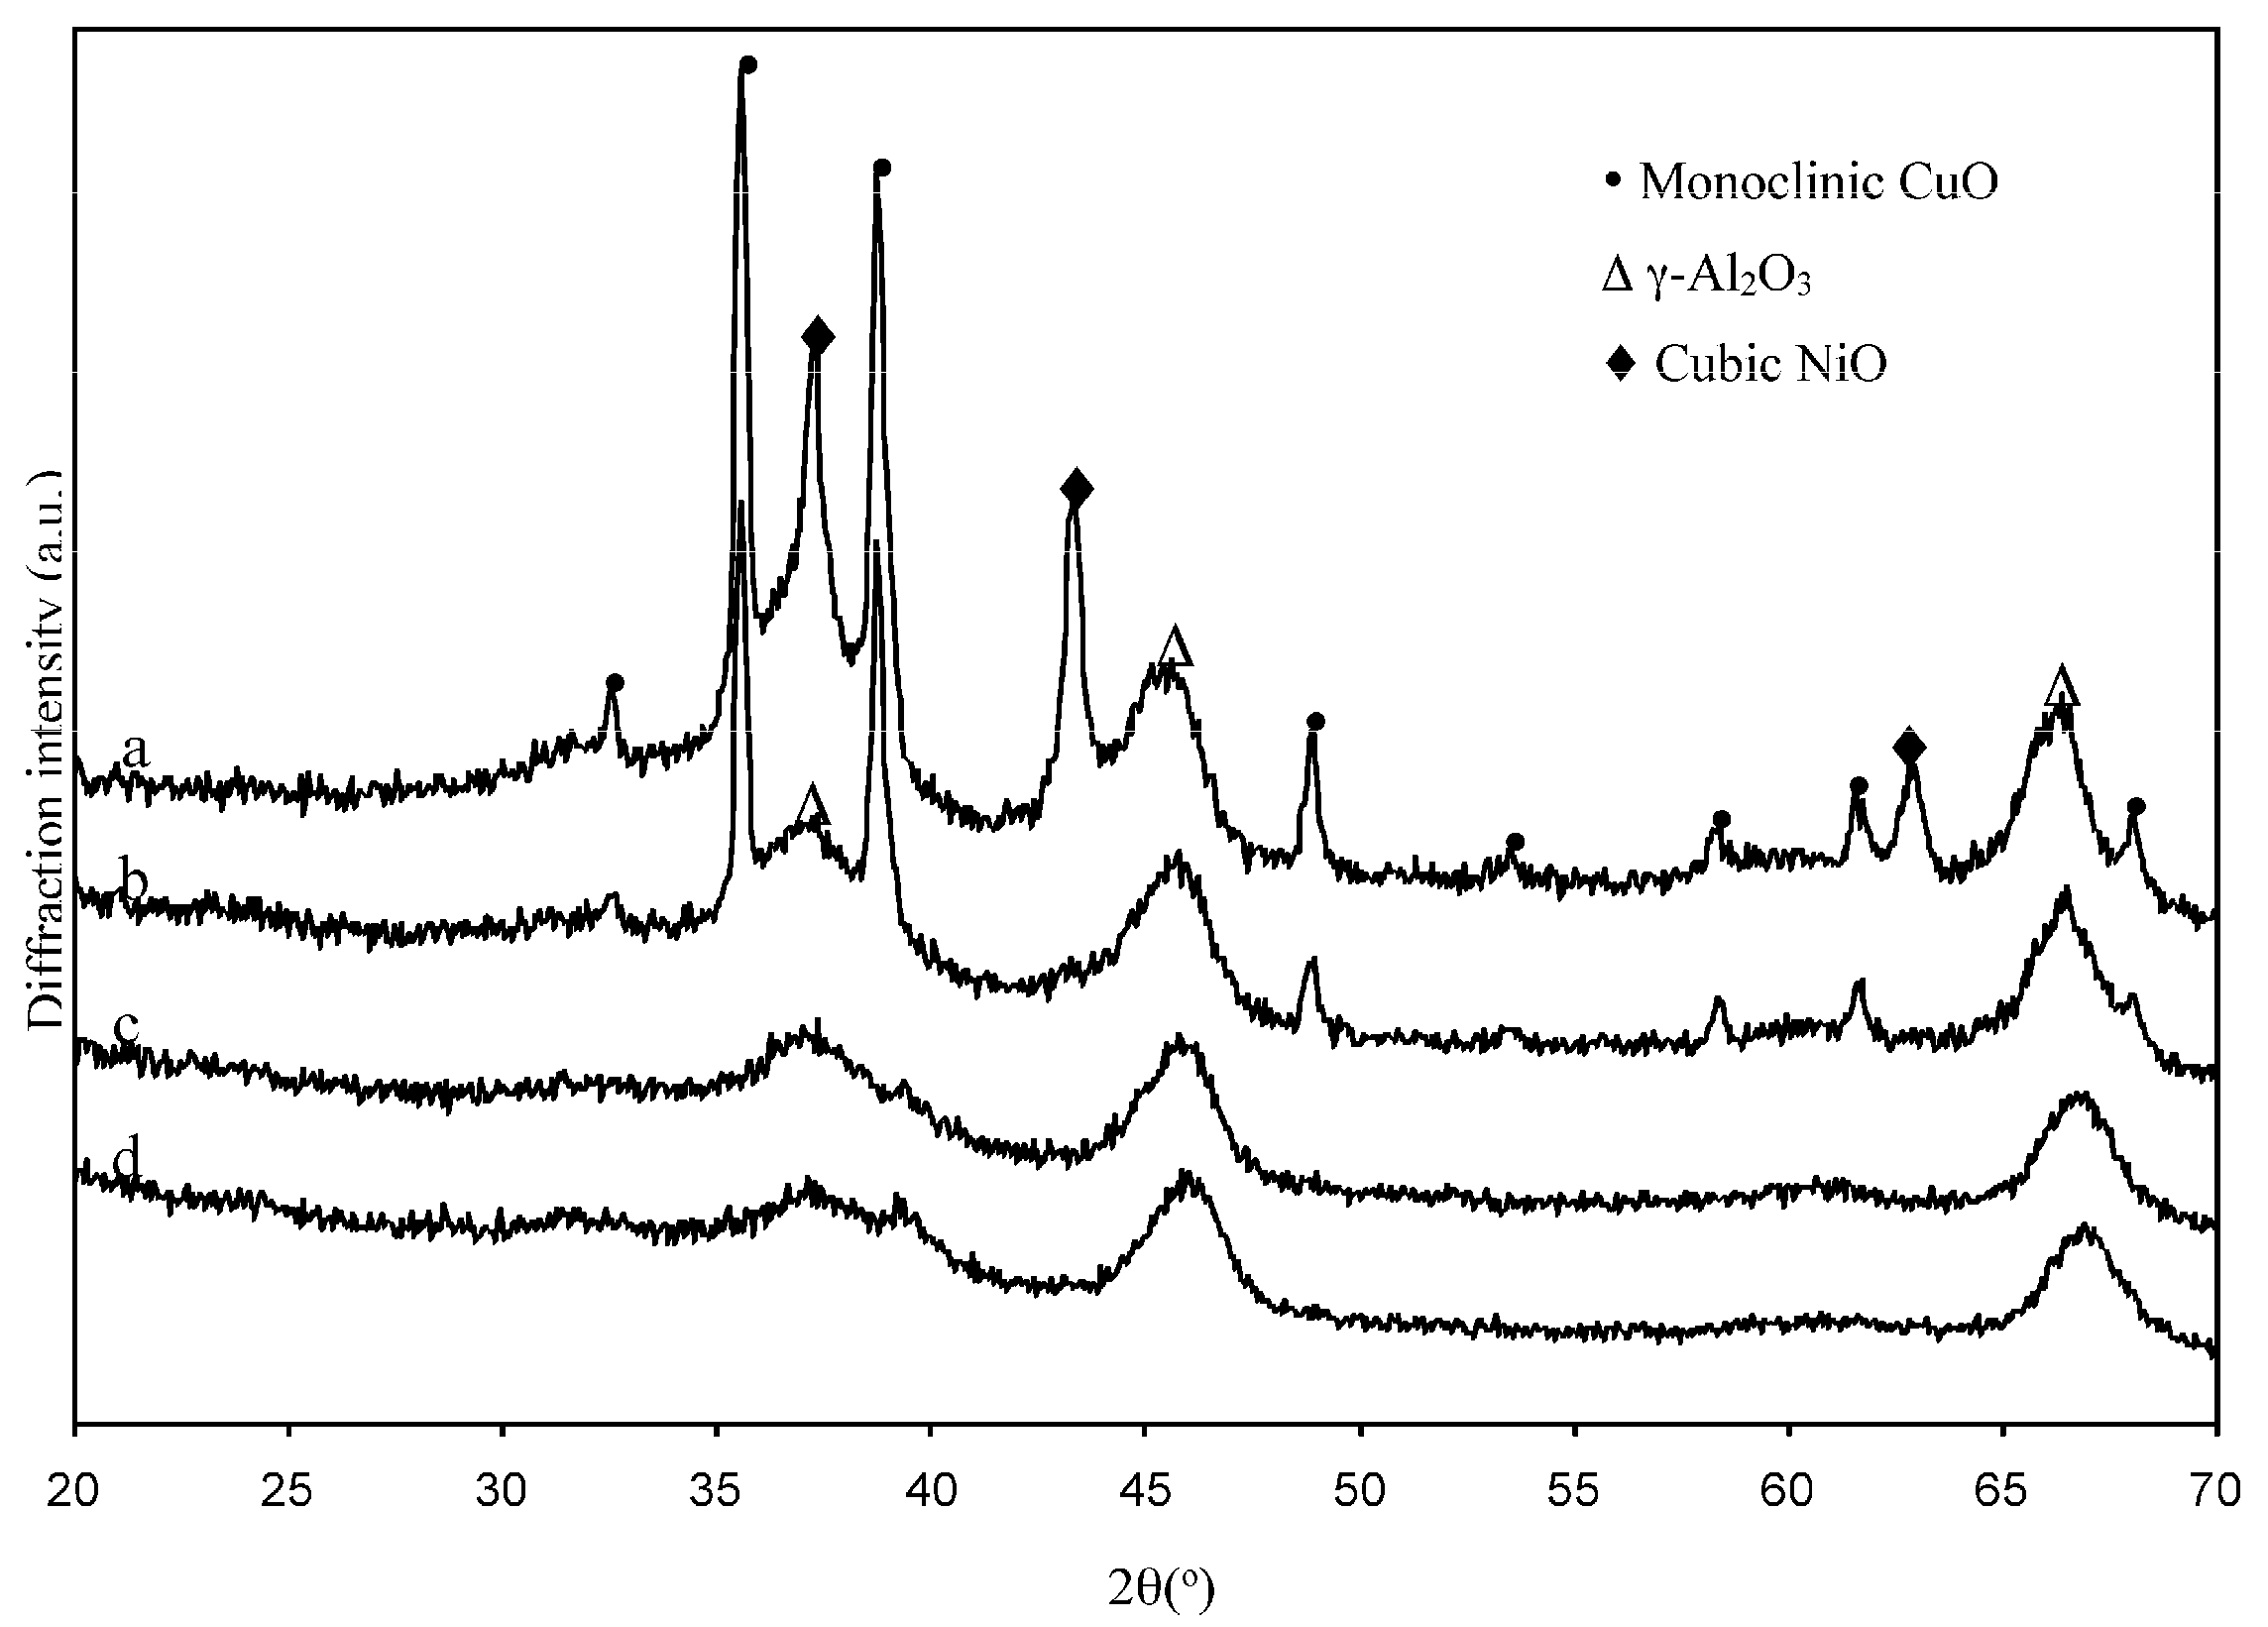
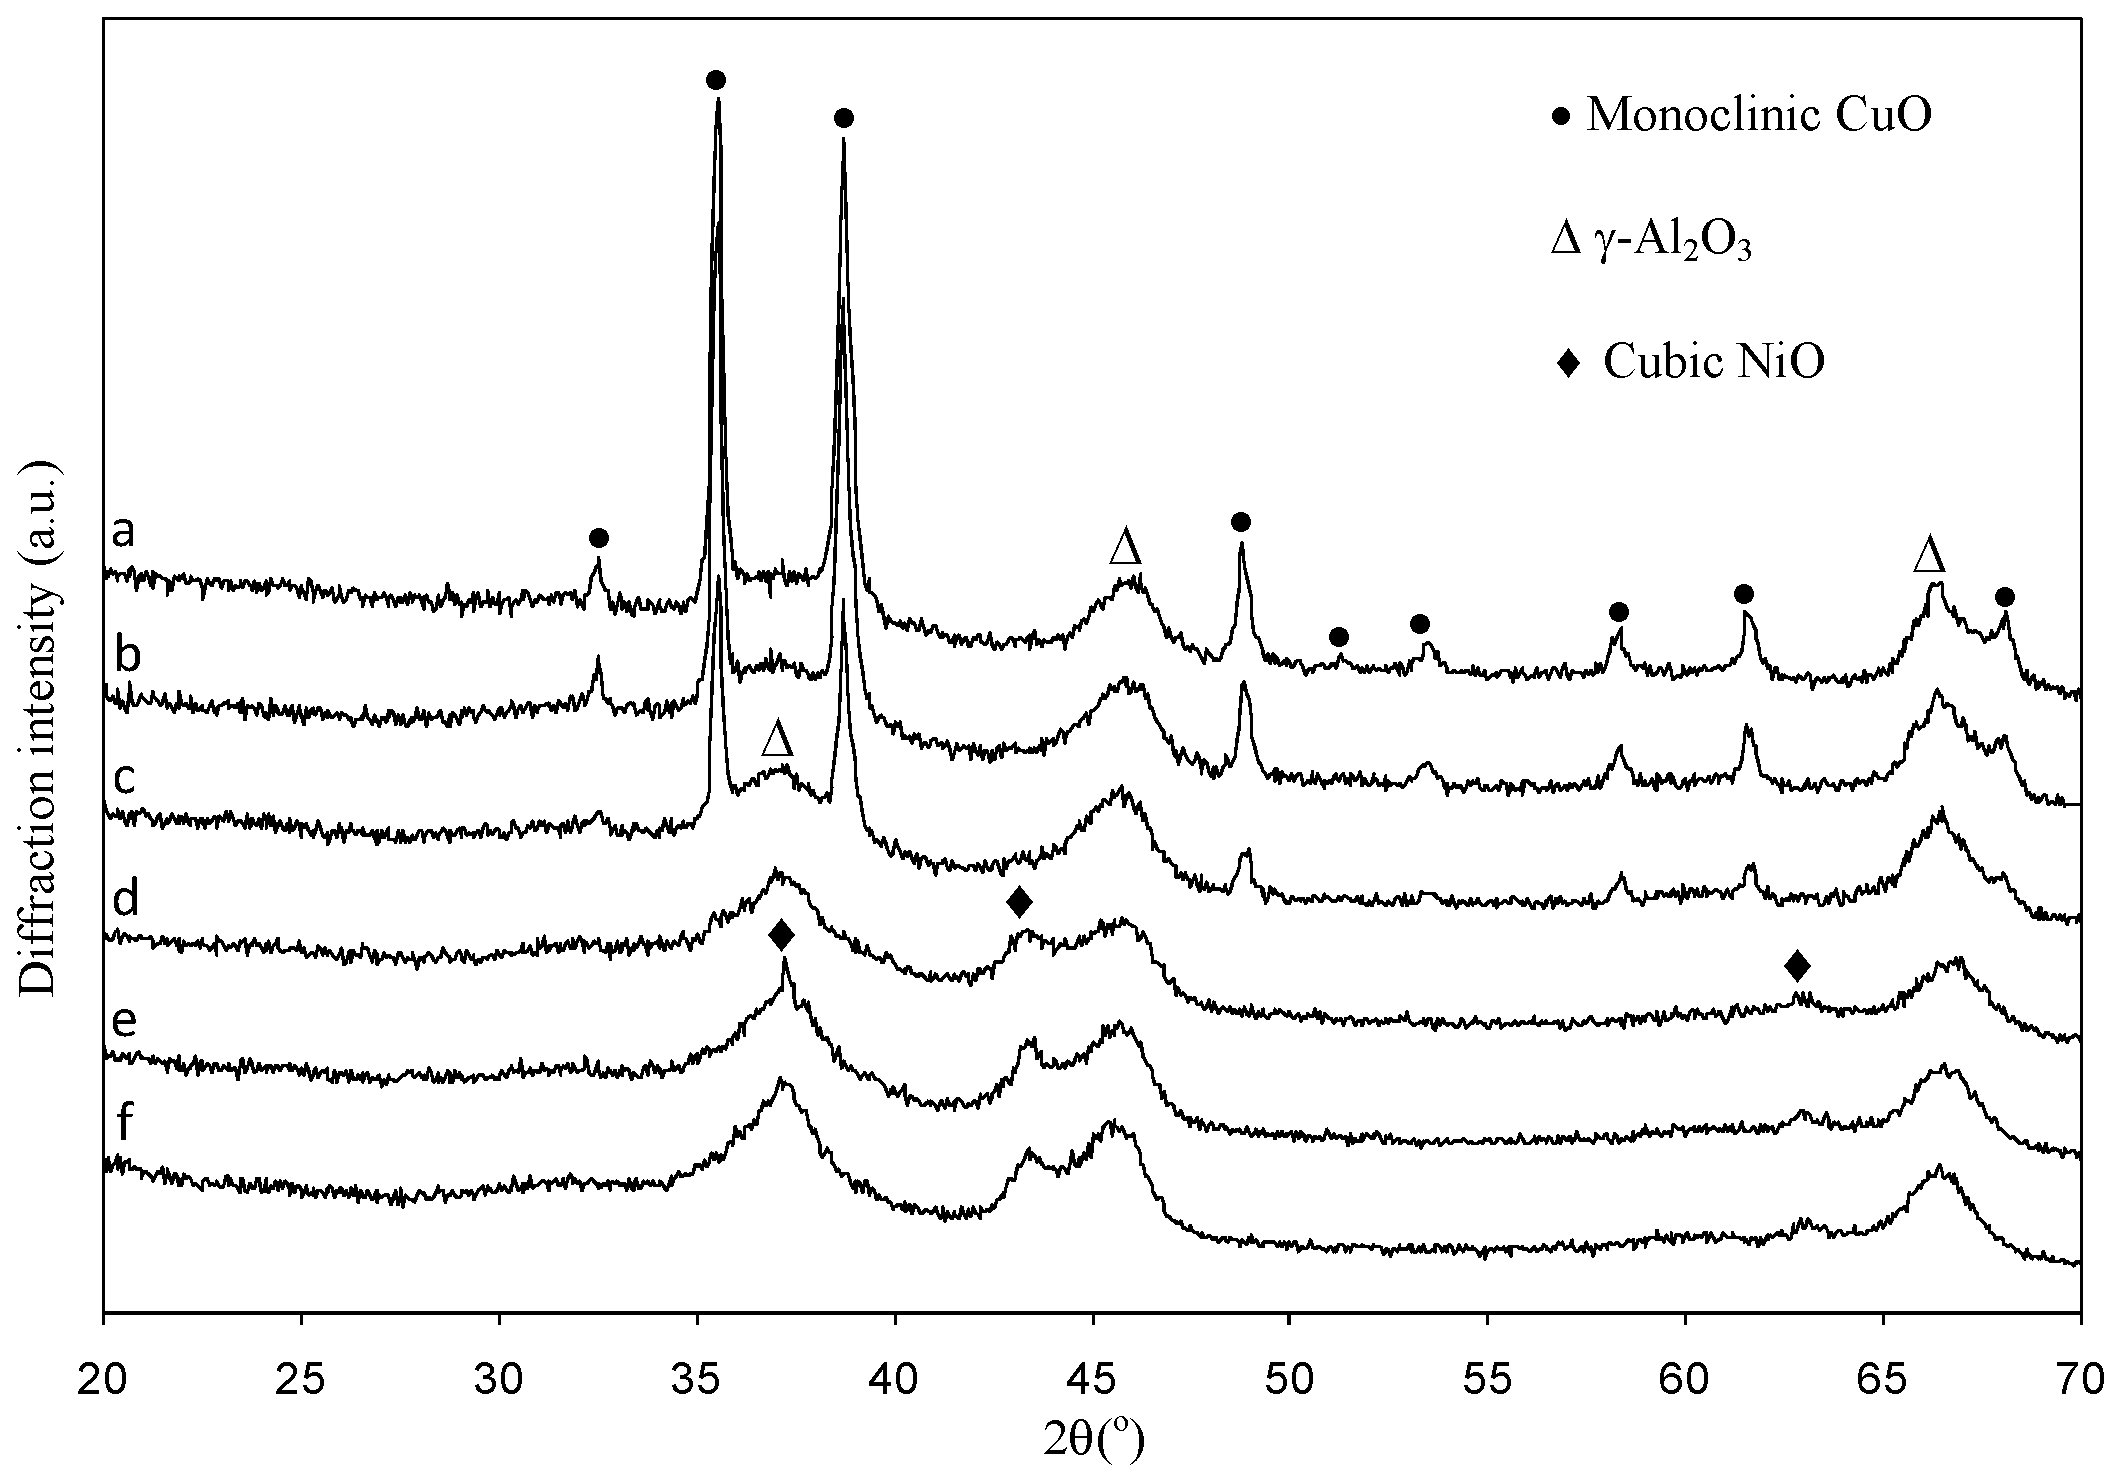
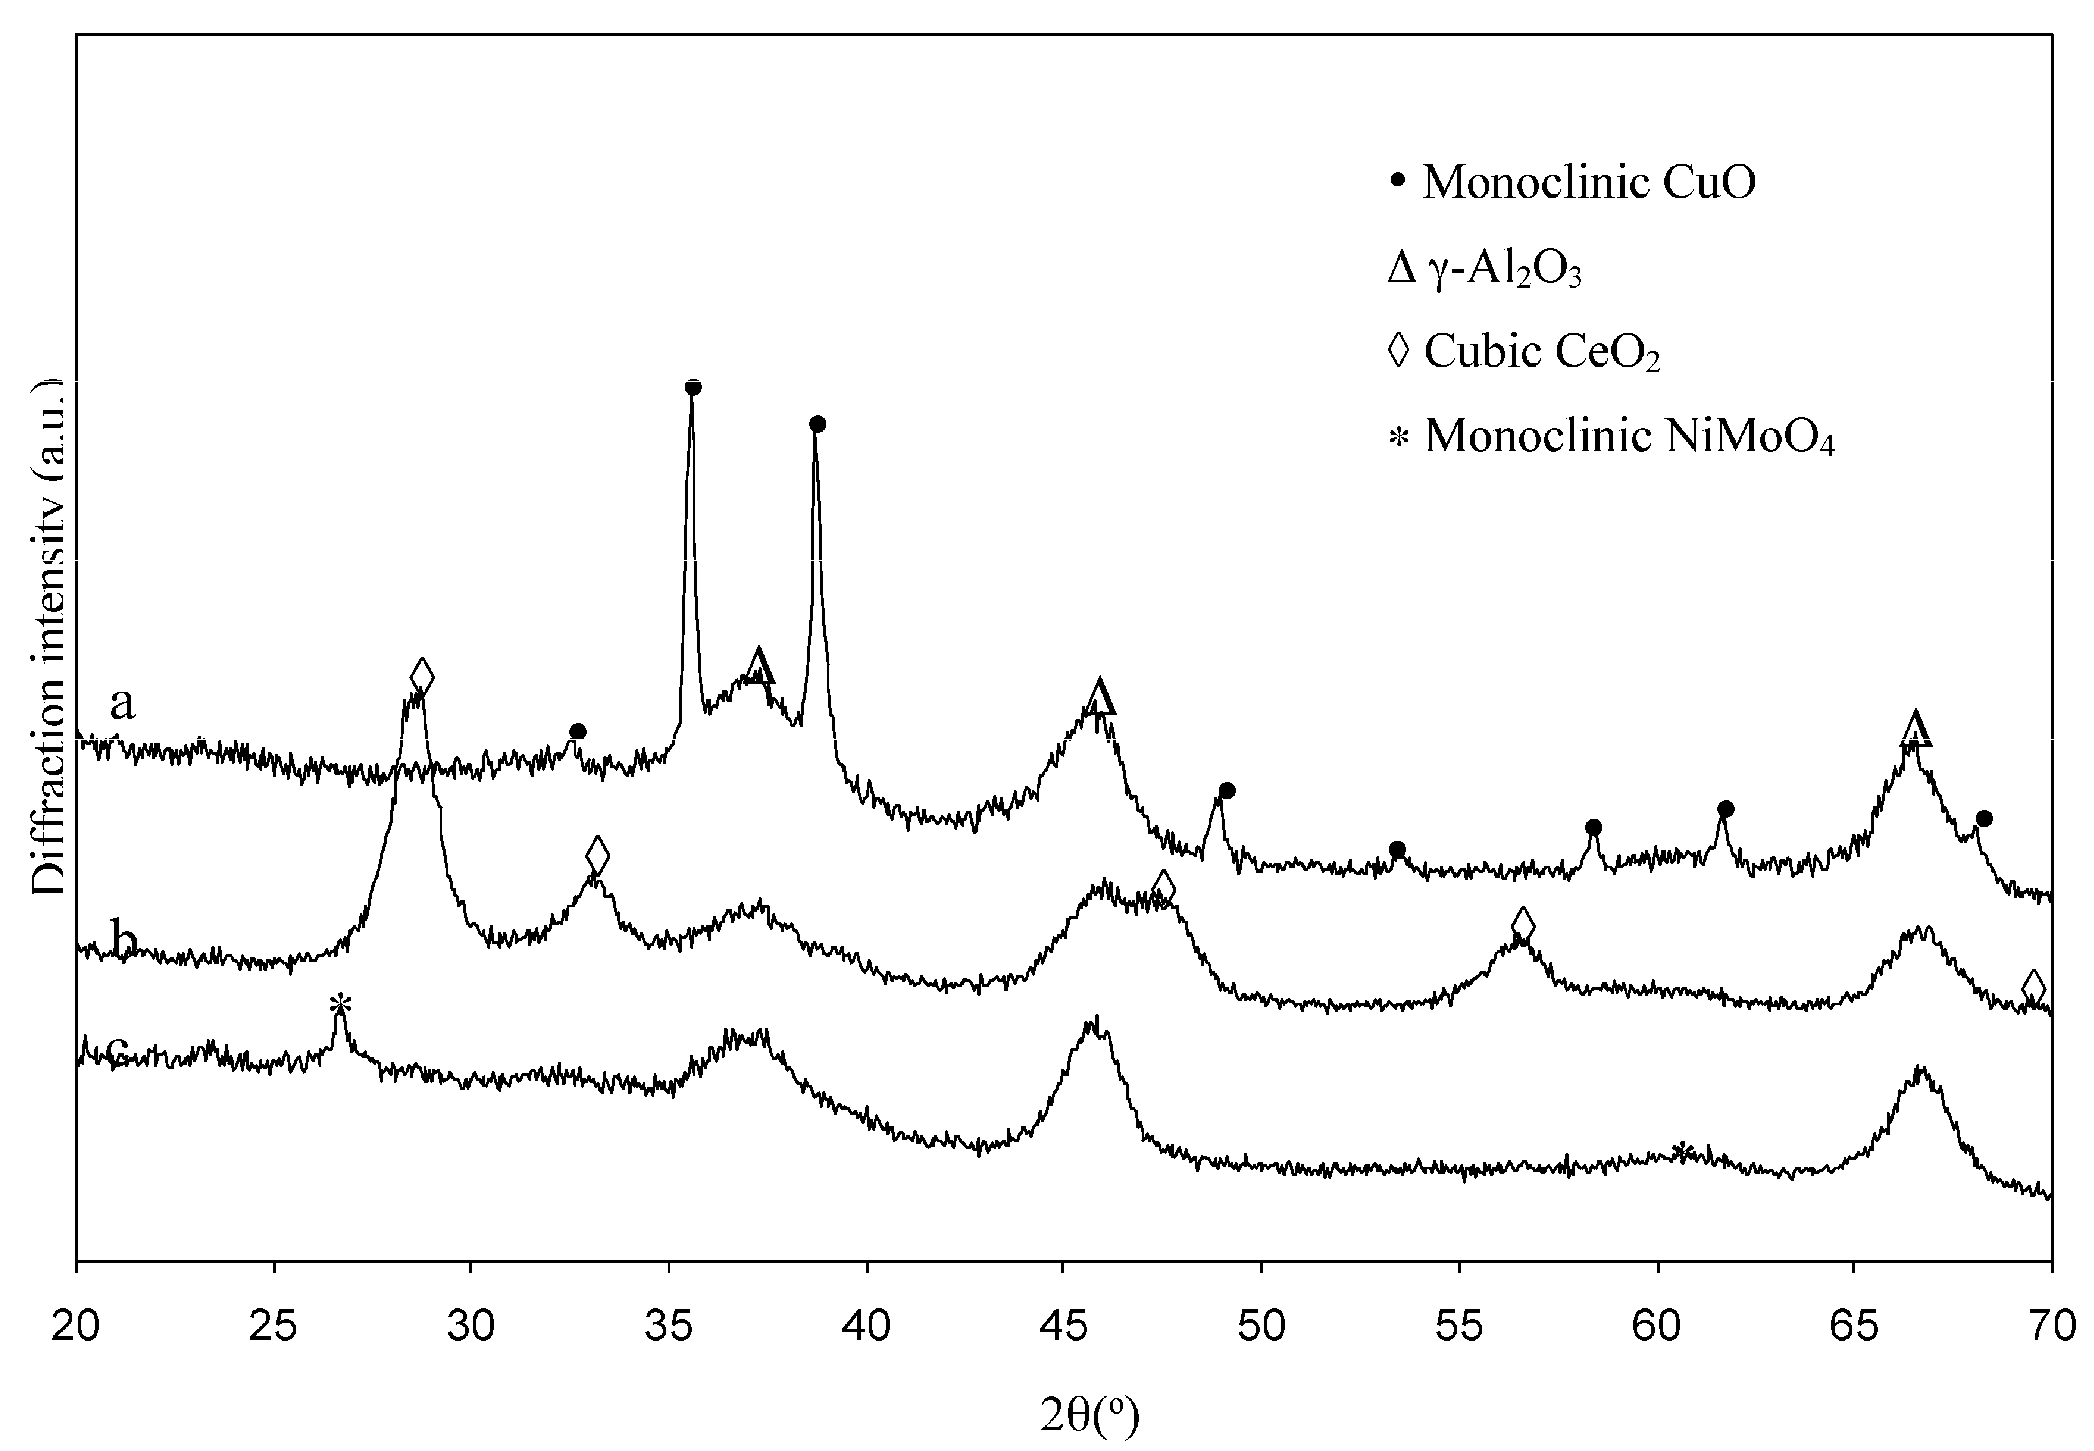
2.1.2. Structural Characterizations

Figure 1 shows the X-ray diffractometry (XRD patterns of Ni0.5-Cu0.5/Al2O3 catalysts (with varying Ni0.5-Cu0.5/Al2O3 ratios). The γ-Al2O3 peaks were observed with other ratios; the intensity of the γ-Al2O3 peaks slightly decreases, indicating that CuO and NiO particles could be highly dispersed in γ-Al2O3 [29,33]. The reflection peak intensities of the CuO and NiO phase occurred and became sharper with the increase of Ni-Cu loading, while no appearance of other phases was detected (Figure 1c,d).
Figure 2 showed XRD patterns of 18 wt. % Ni-Cu/Al2O3 catalysts with various Cu ratios. For pure CuO/Al2O3 (Figure 2a), only the phases of CuO were observed. With the decrease of CuO loading, the reflection peak intensities of the CuO phase were largely reduced with peak broadening (Figure 2a–c). At 30 mol % CuO ratio, only the cubic NiO phase was observed (Figure 2d). On further reducing the CuO contents (Figure 2e,f), the emerged intensity of the cubic NiO phase was gradually increased, while no reflection peaks of CuO were observed.
XRD patterns of 18 wt. % different catalysts are shown in Figure 3. The reflection of CuO and cubic CeO2 are evidently observed (Figure 3a,b), while no separate reflections from Ni are detected for all samples. This provided further evidence that nickel promoted the dispersion of Cu and Ce [28]. It is surprising to note that the reflections of NiMo4 were observed over 18 wt. % Ni0.5-Mo0.5/Al2O3 catalysts. The presence of the NiMo4 phase was possibly due to the preparations of Ni-Mo catalysts [34,35].

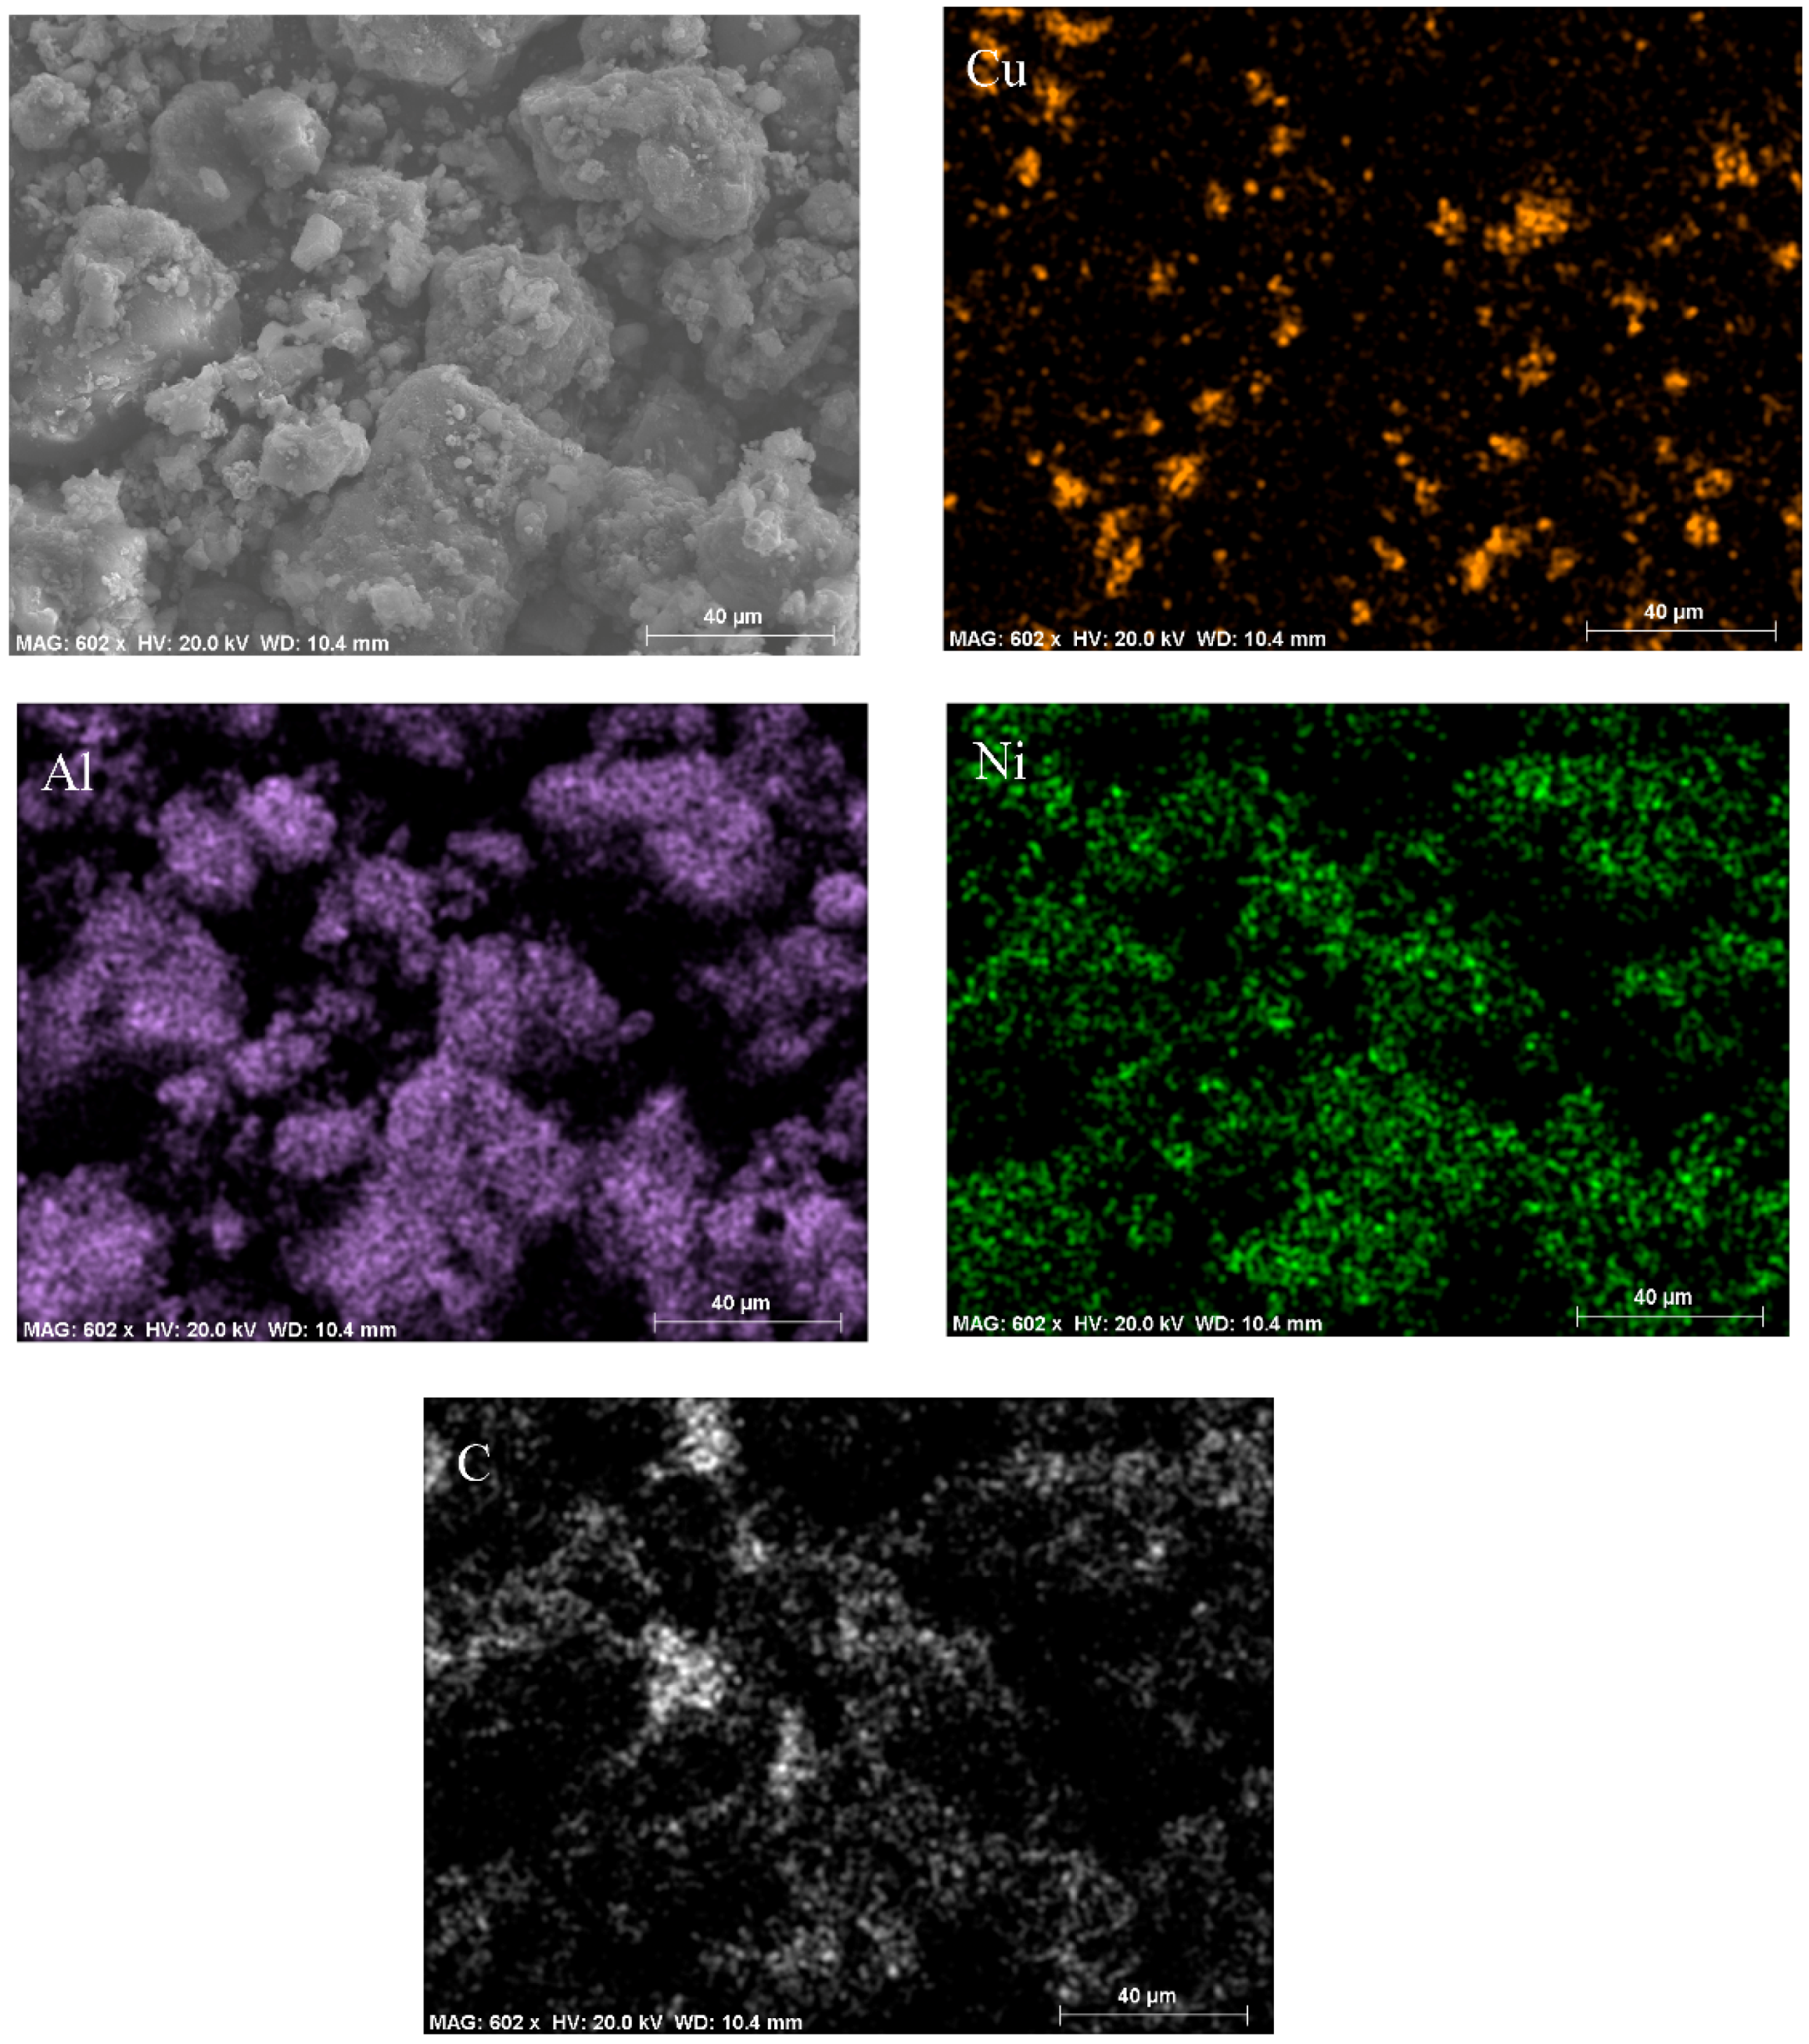
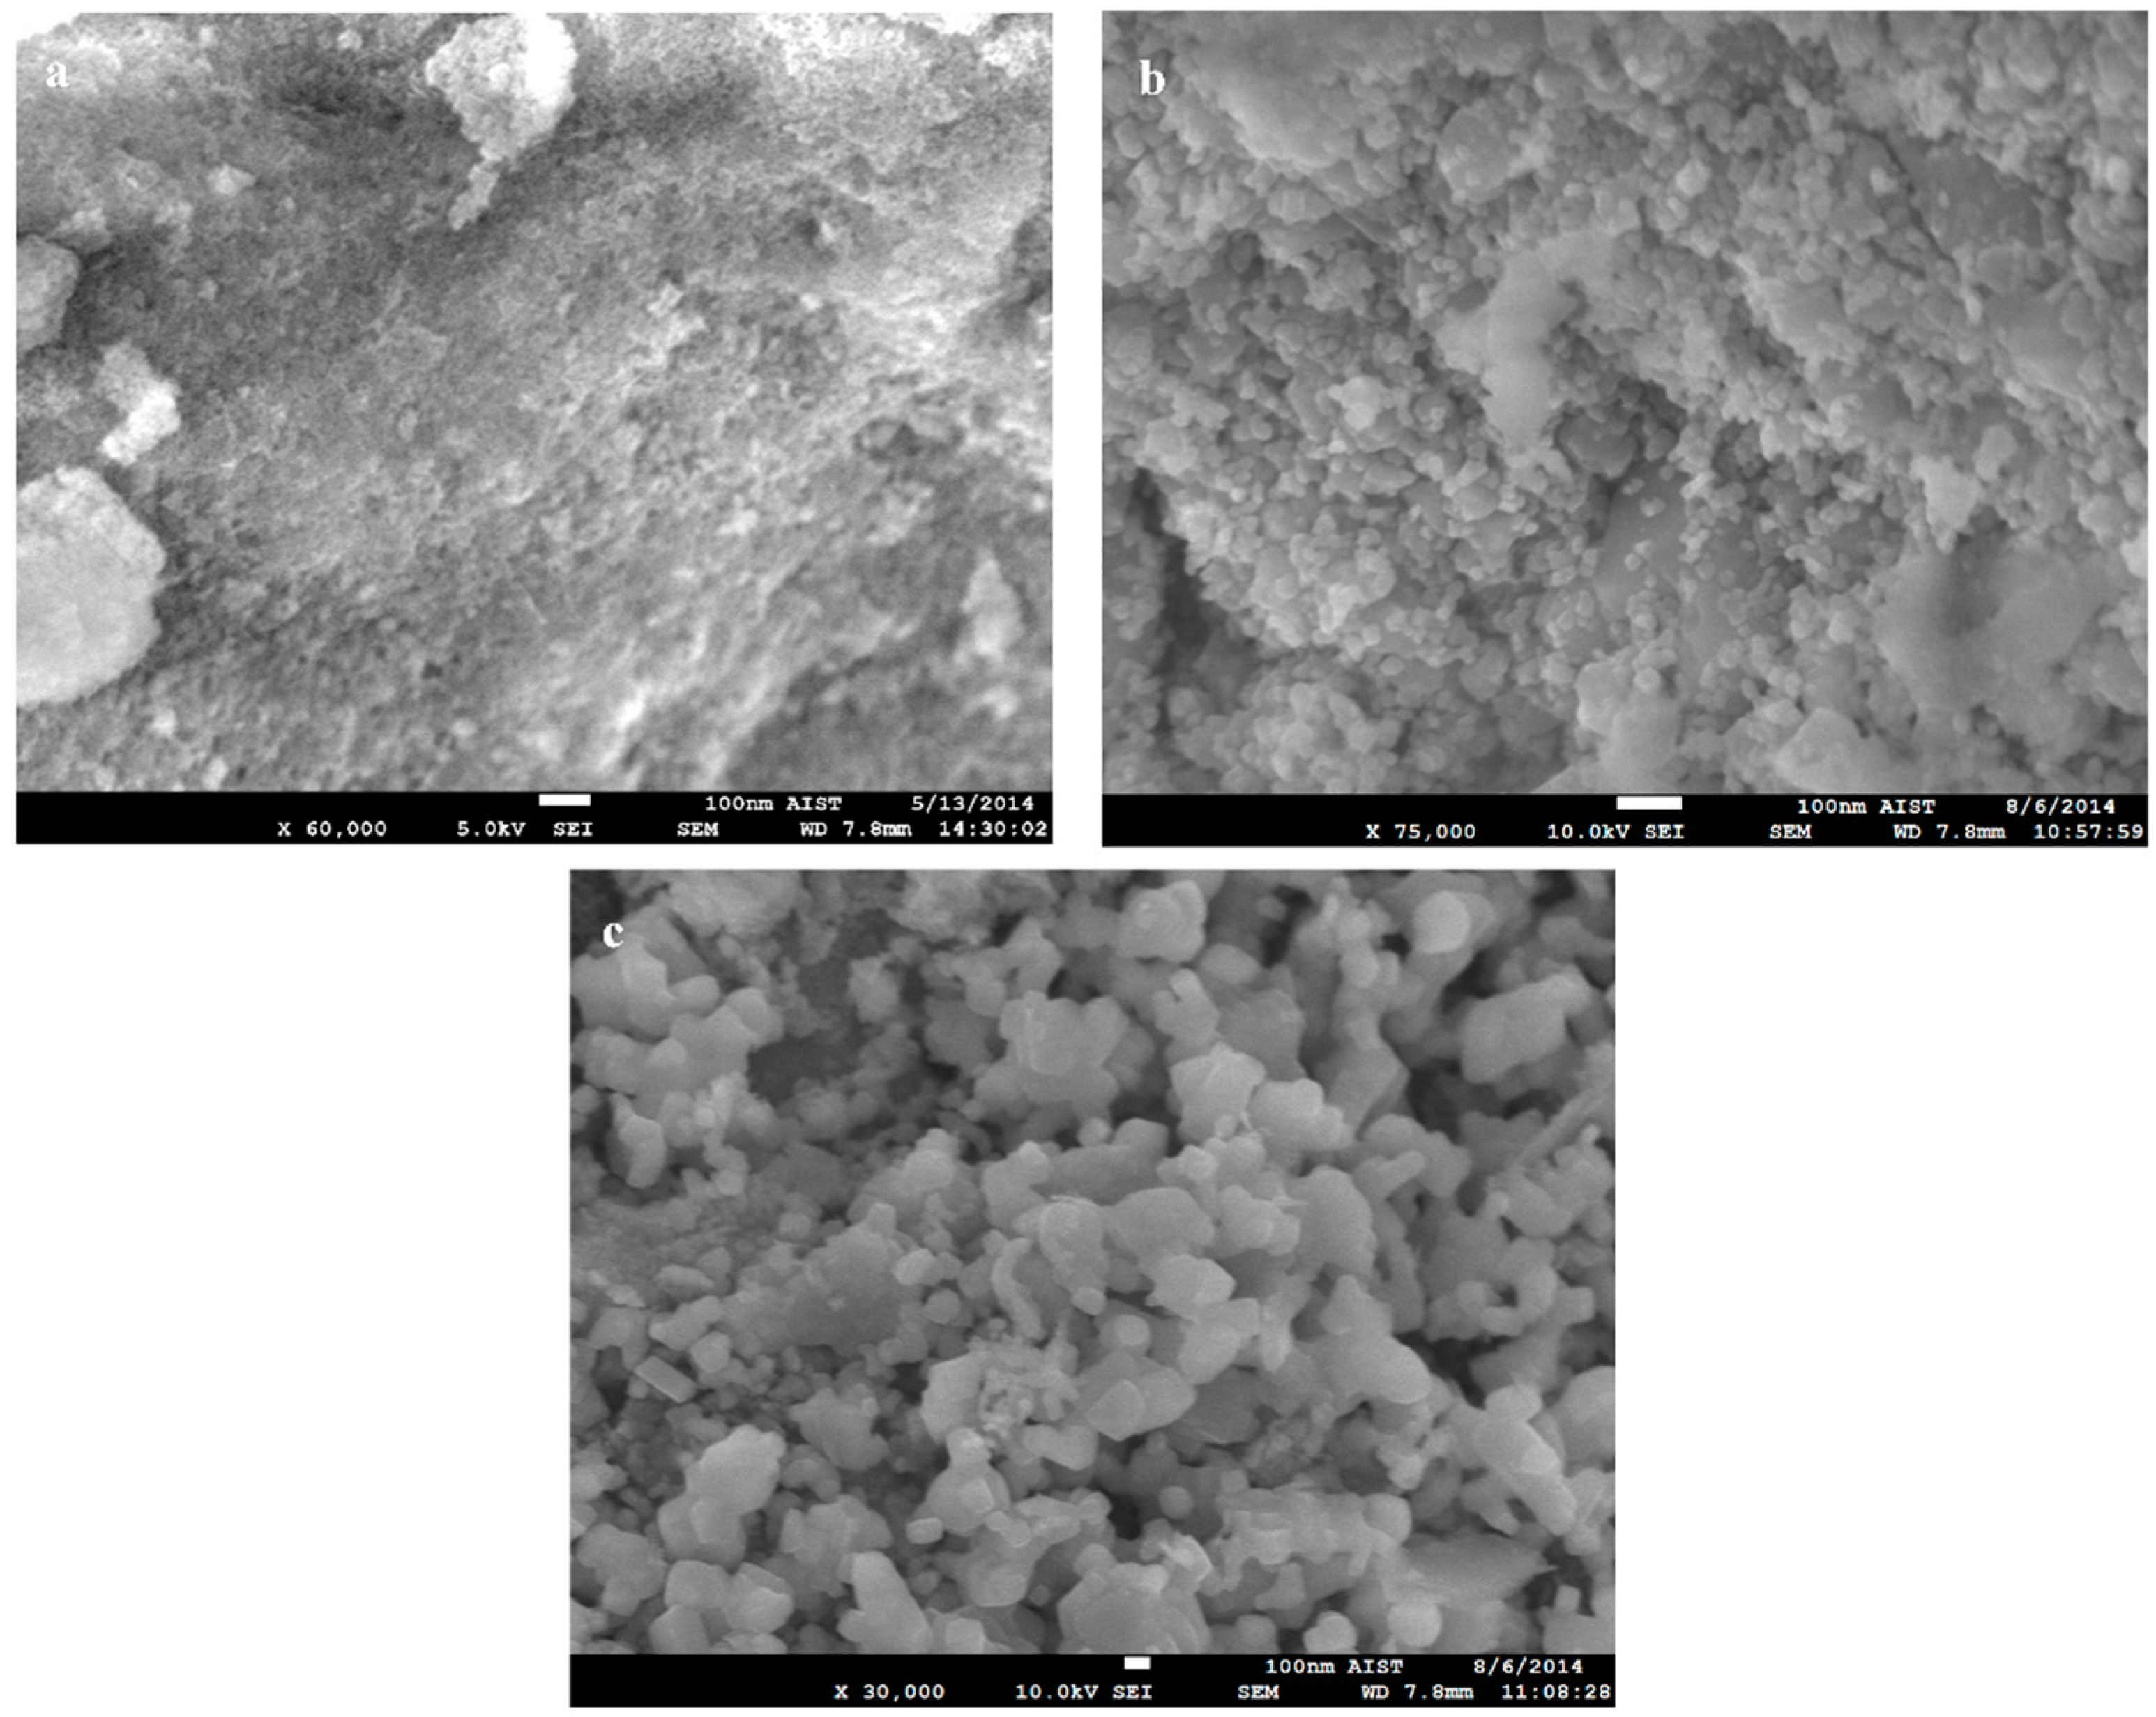
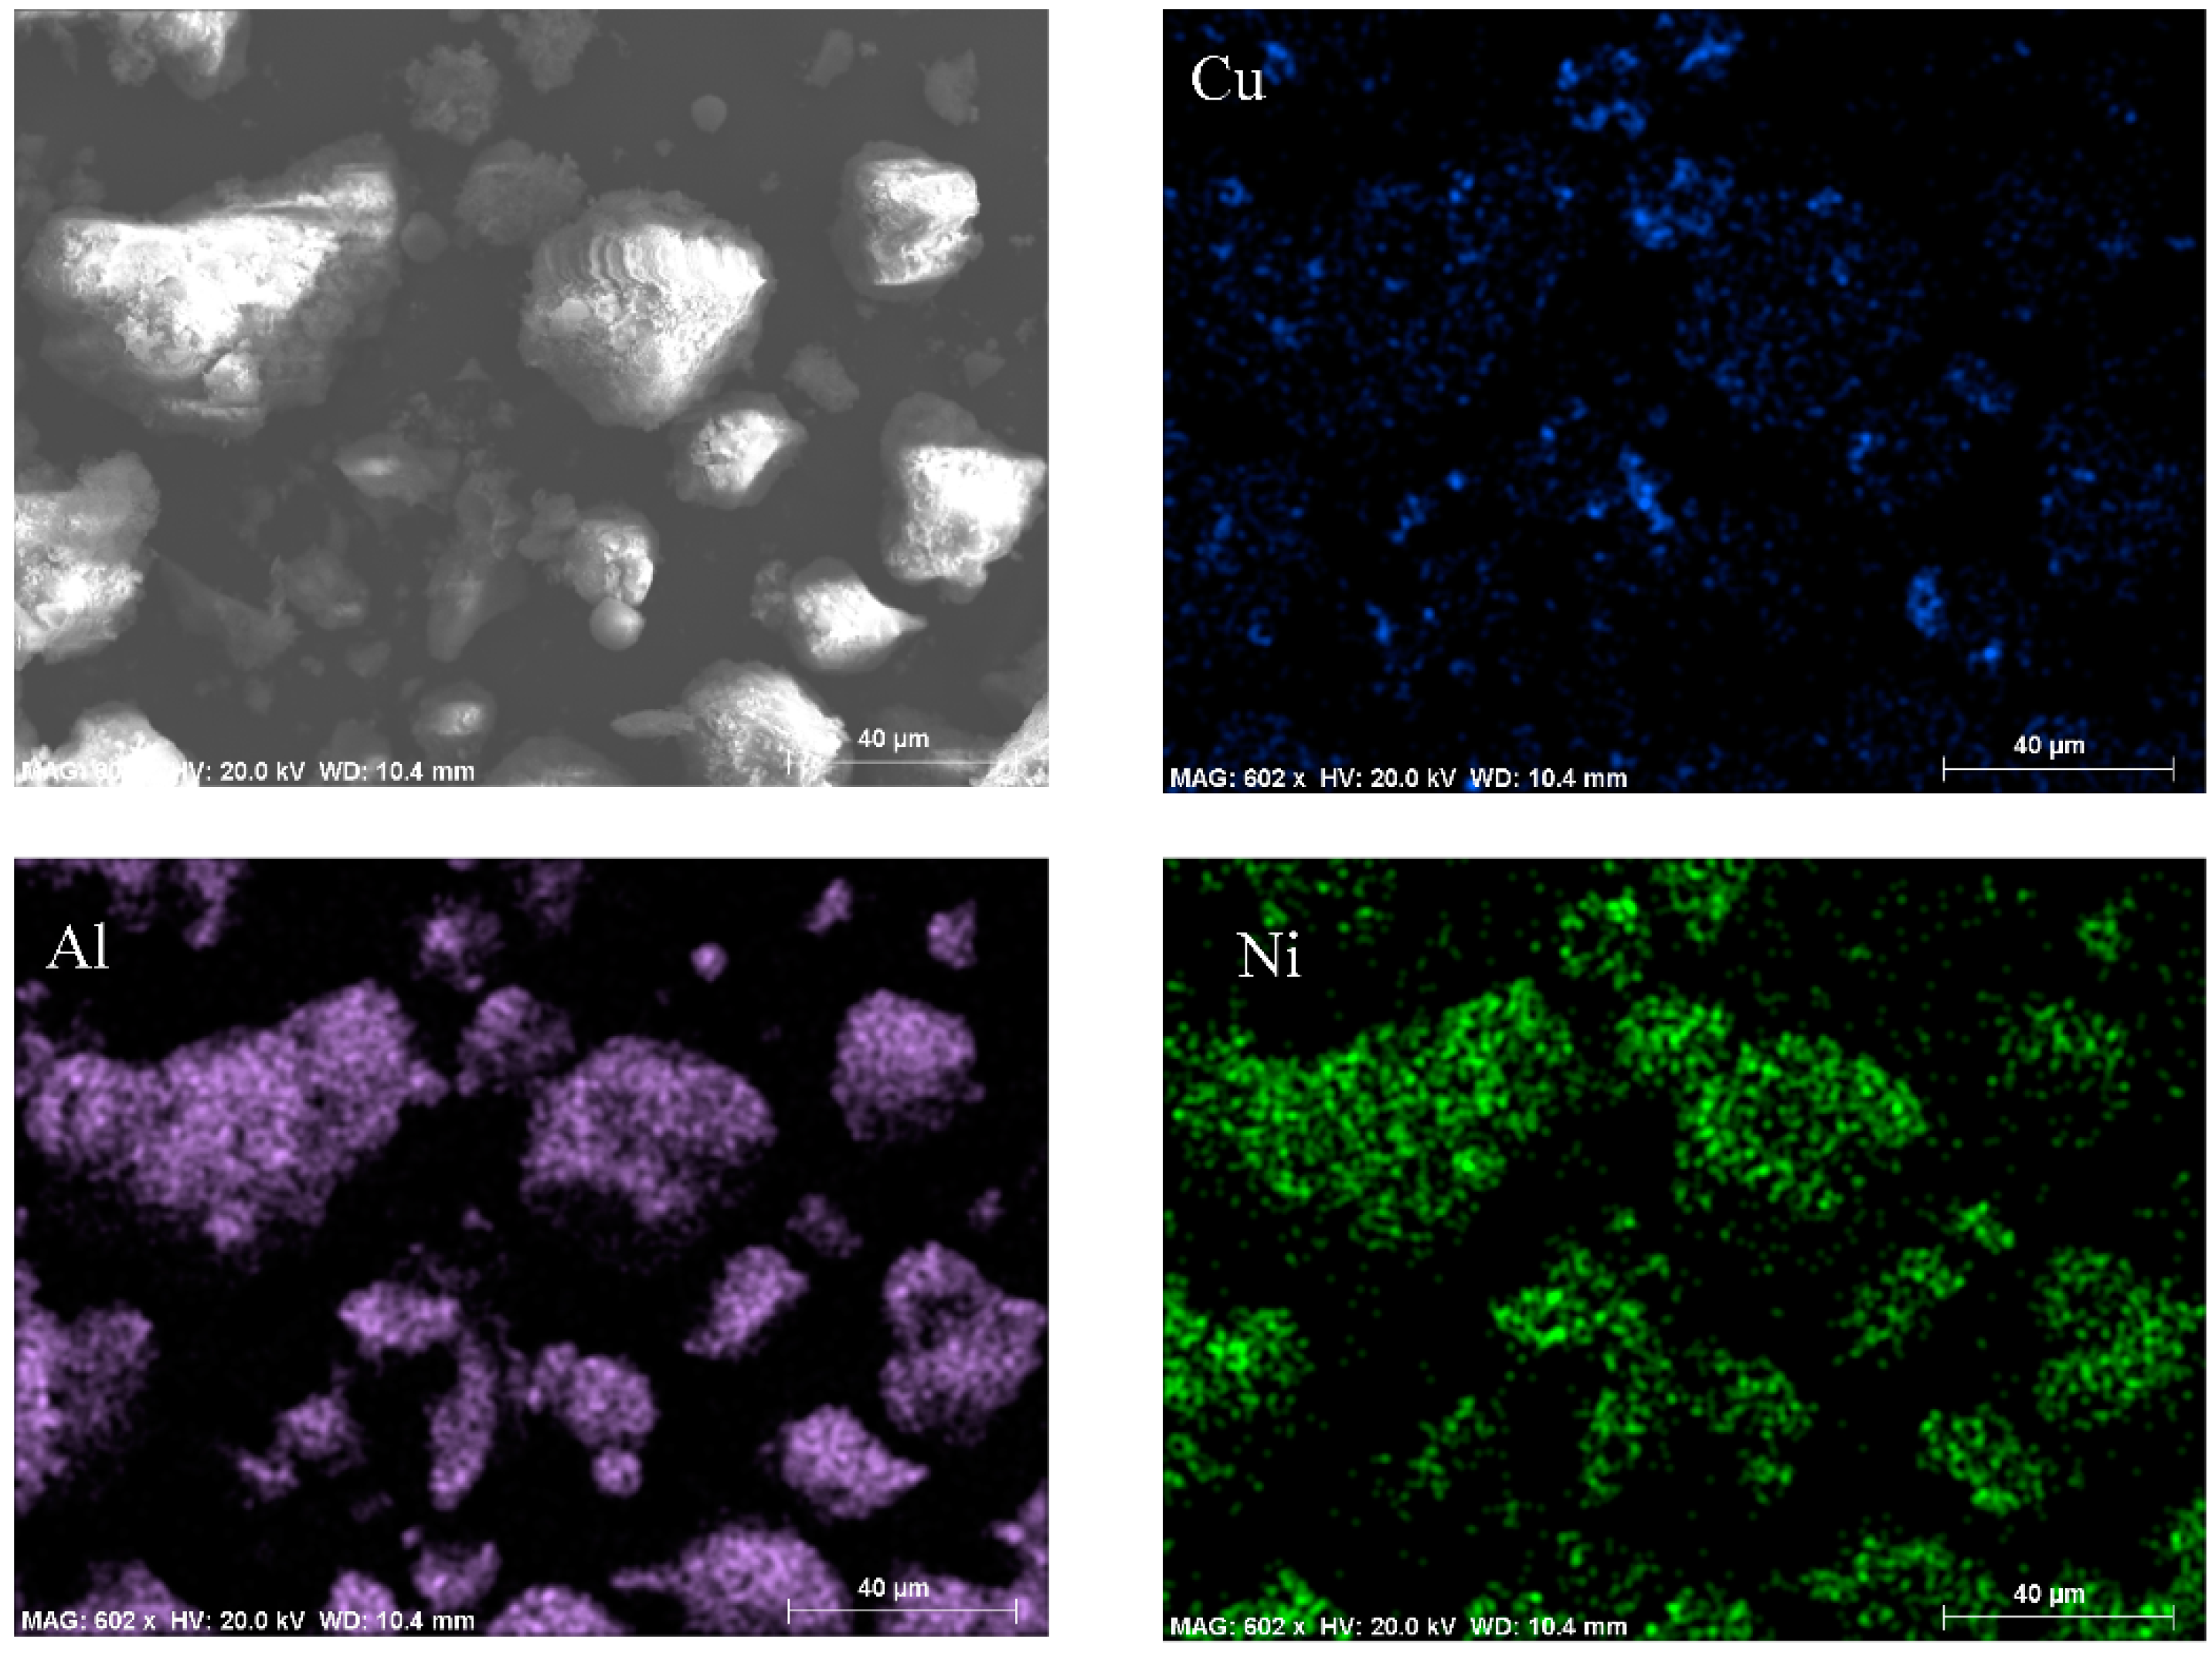
2.1.3. Morphology Characterizations

Figure 4 shows a scanning electron microscopy (SEM) micrograph of Ni0.5-Cu0.5/Al2O3 catalysts with various Ni-Cu content ratios; high distributions of CuO-NiO nanoparticles on large spongy clusters of γ-Al2O3 were observed for all the samples. Ni-Cu nanoparticles of 10 nm were observed on the 6 wt. % Ni0.5-Cu0.5/Al2O3 catalysts (Figure 4a). With the increase of Ni-Cu loading, an increase in the particle size of Ni-Cu was clearly observed (Figure 4b,c) where aggregations of packed particles from a few nanometers to few hundred nanometers in size exist, which may cause agglomeration of powders, indicating sintering of the catalysts.
Figure 5 shows the corresponding SEM micrograph and energy dispersive X-ray (EDX) mapping of Ni0.5-Cu0.5/Al2O3 catalysts; it clearly shows the presence of Ni, Cu, and Al elements. In addition, the element mapping revealed a uniform distribution for Ni, Cu, and Al.

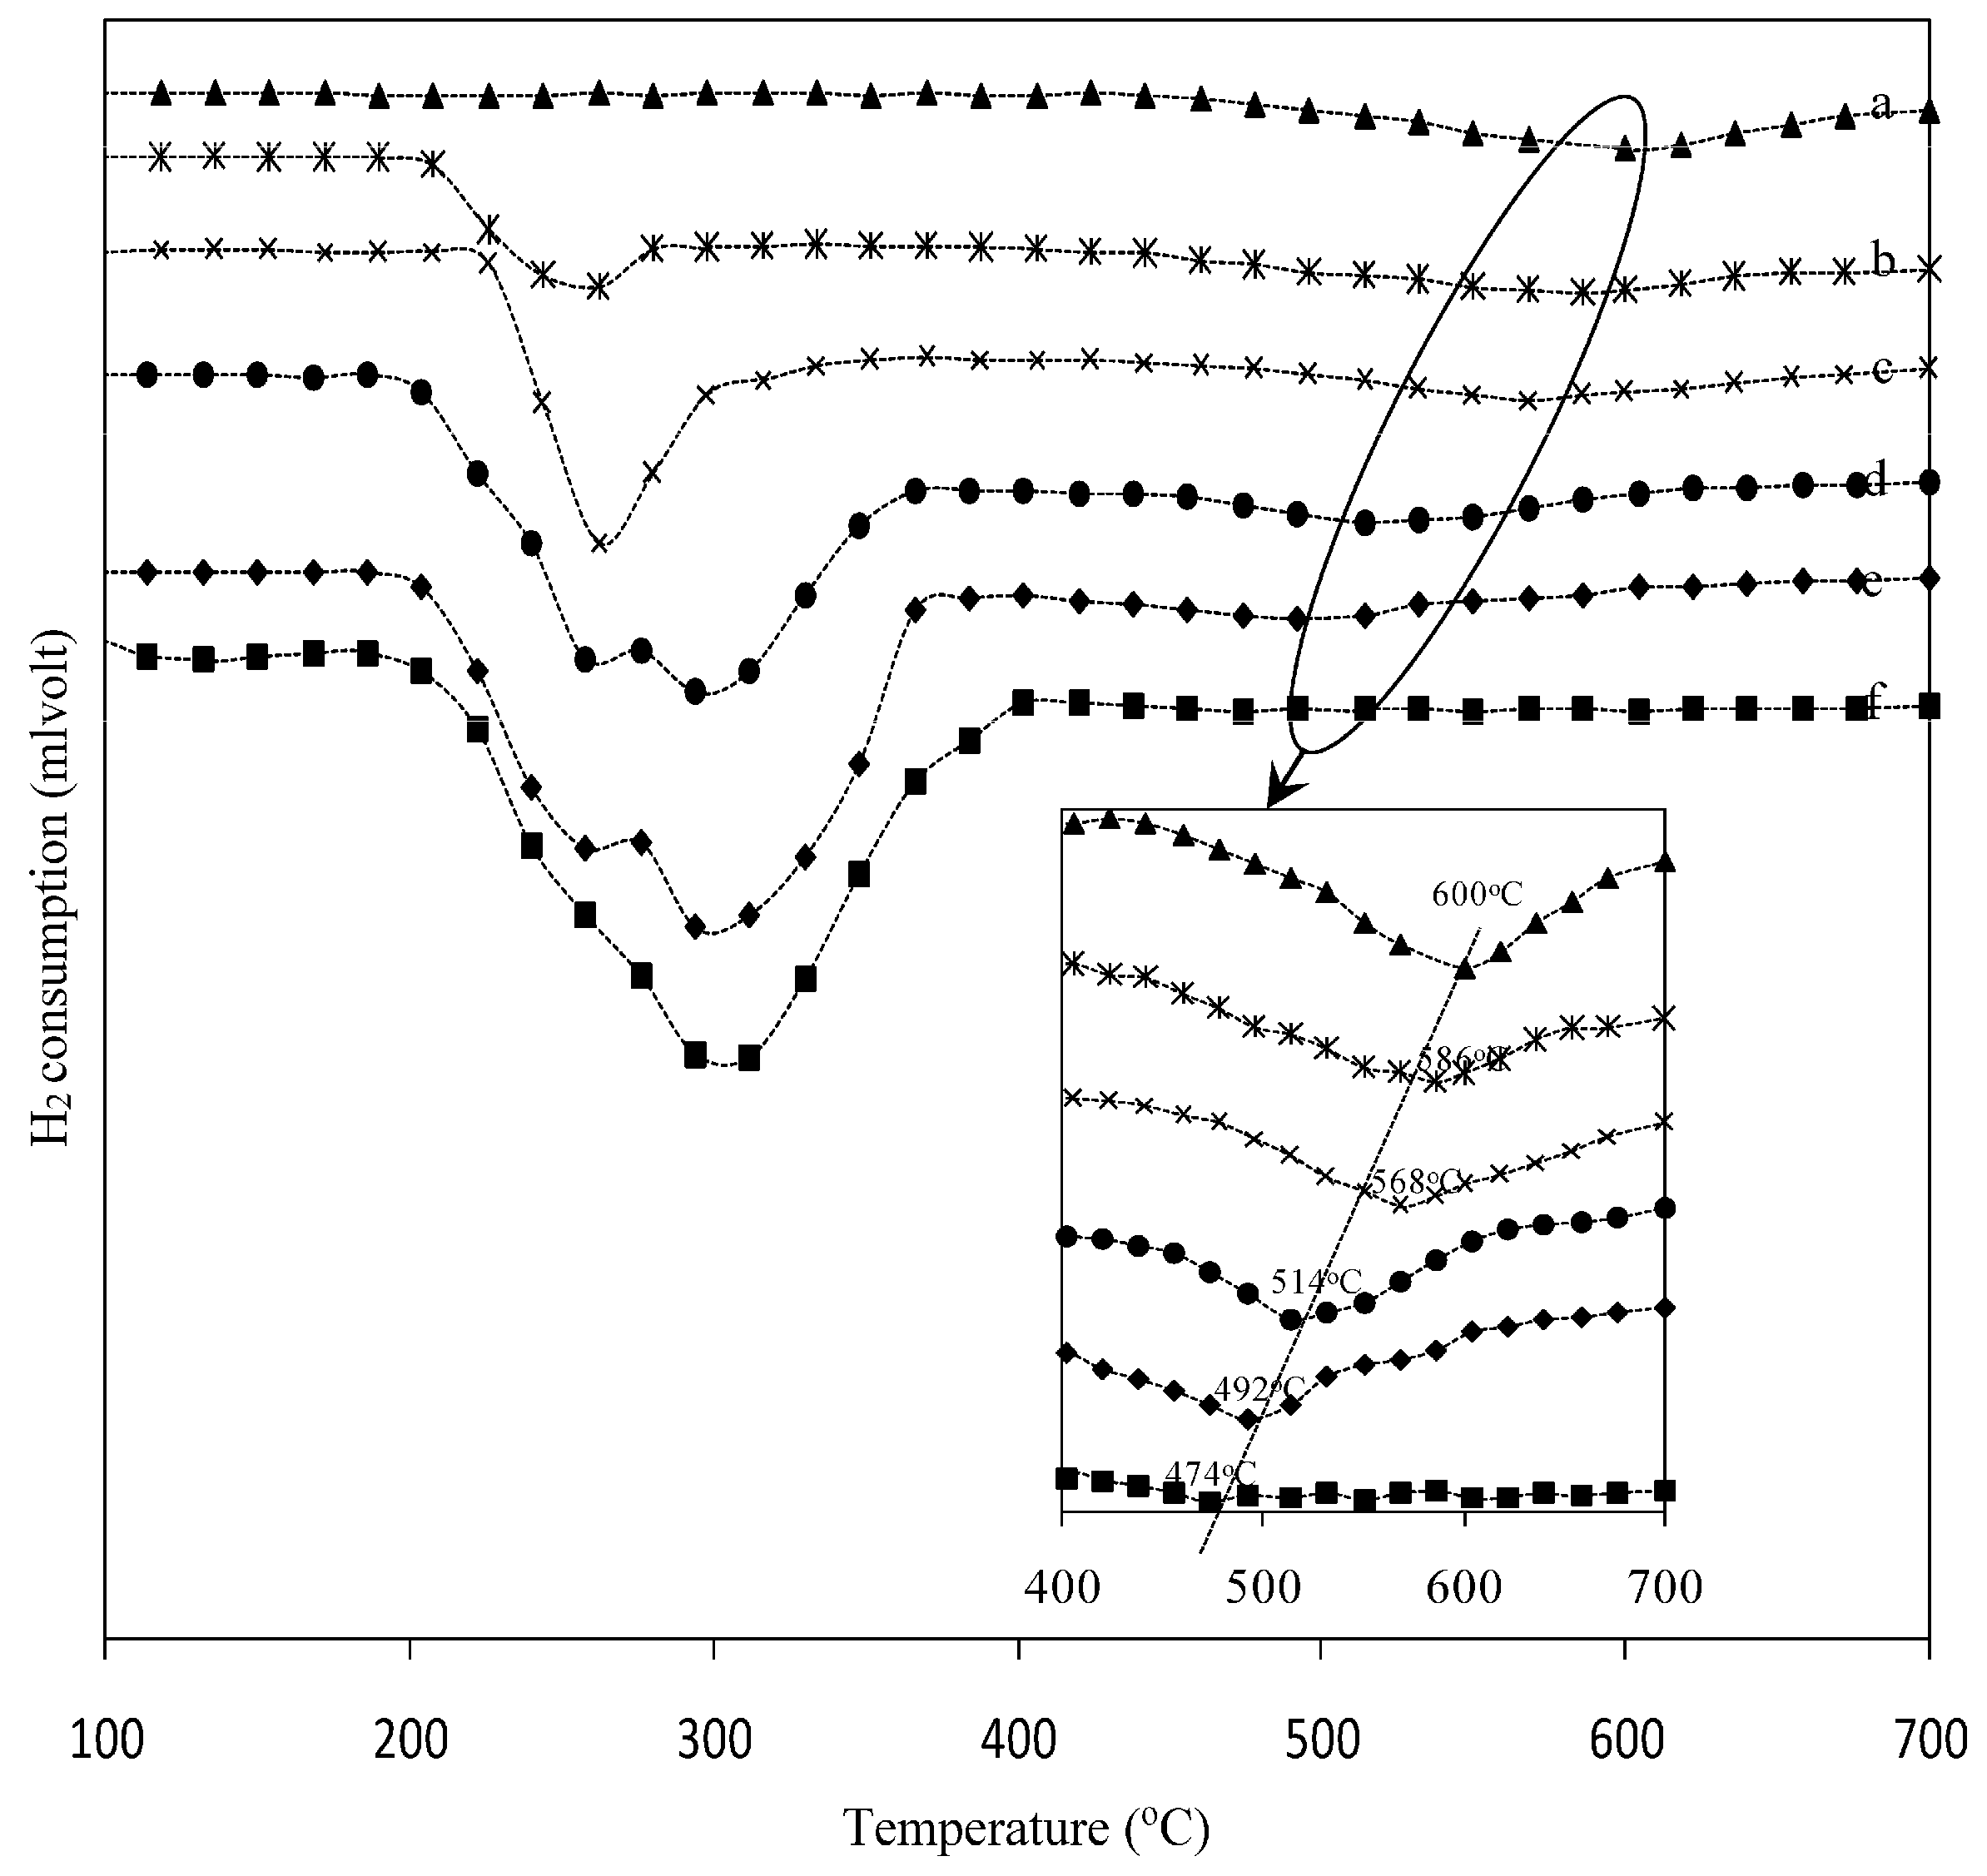
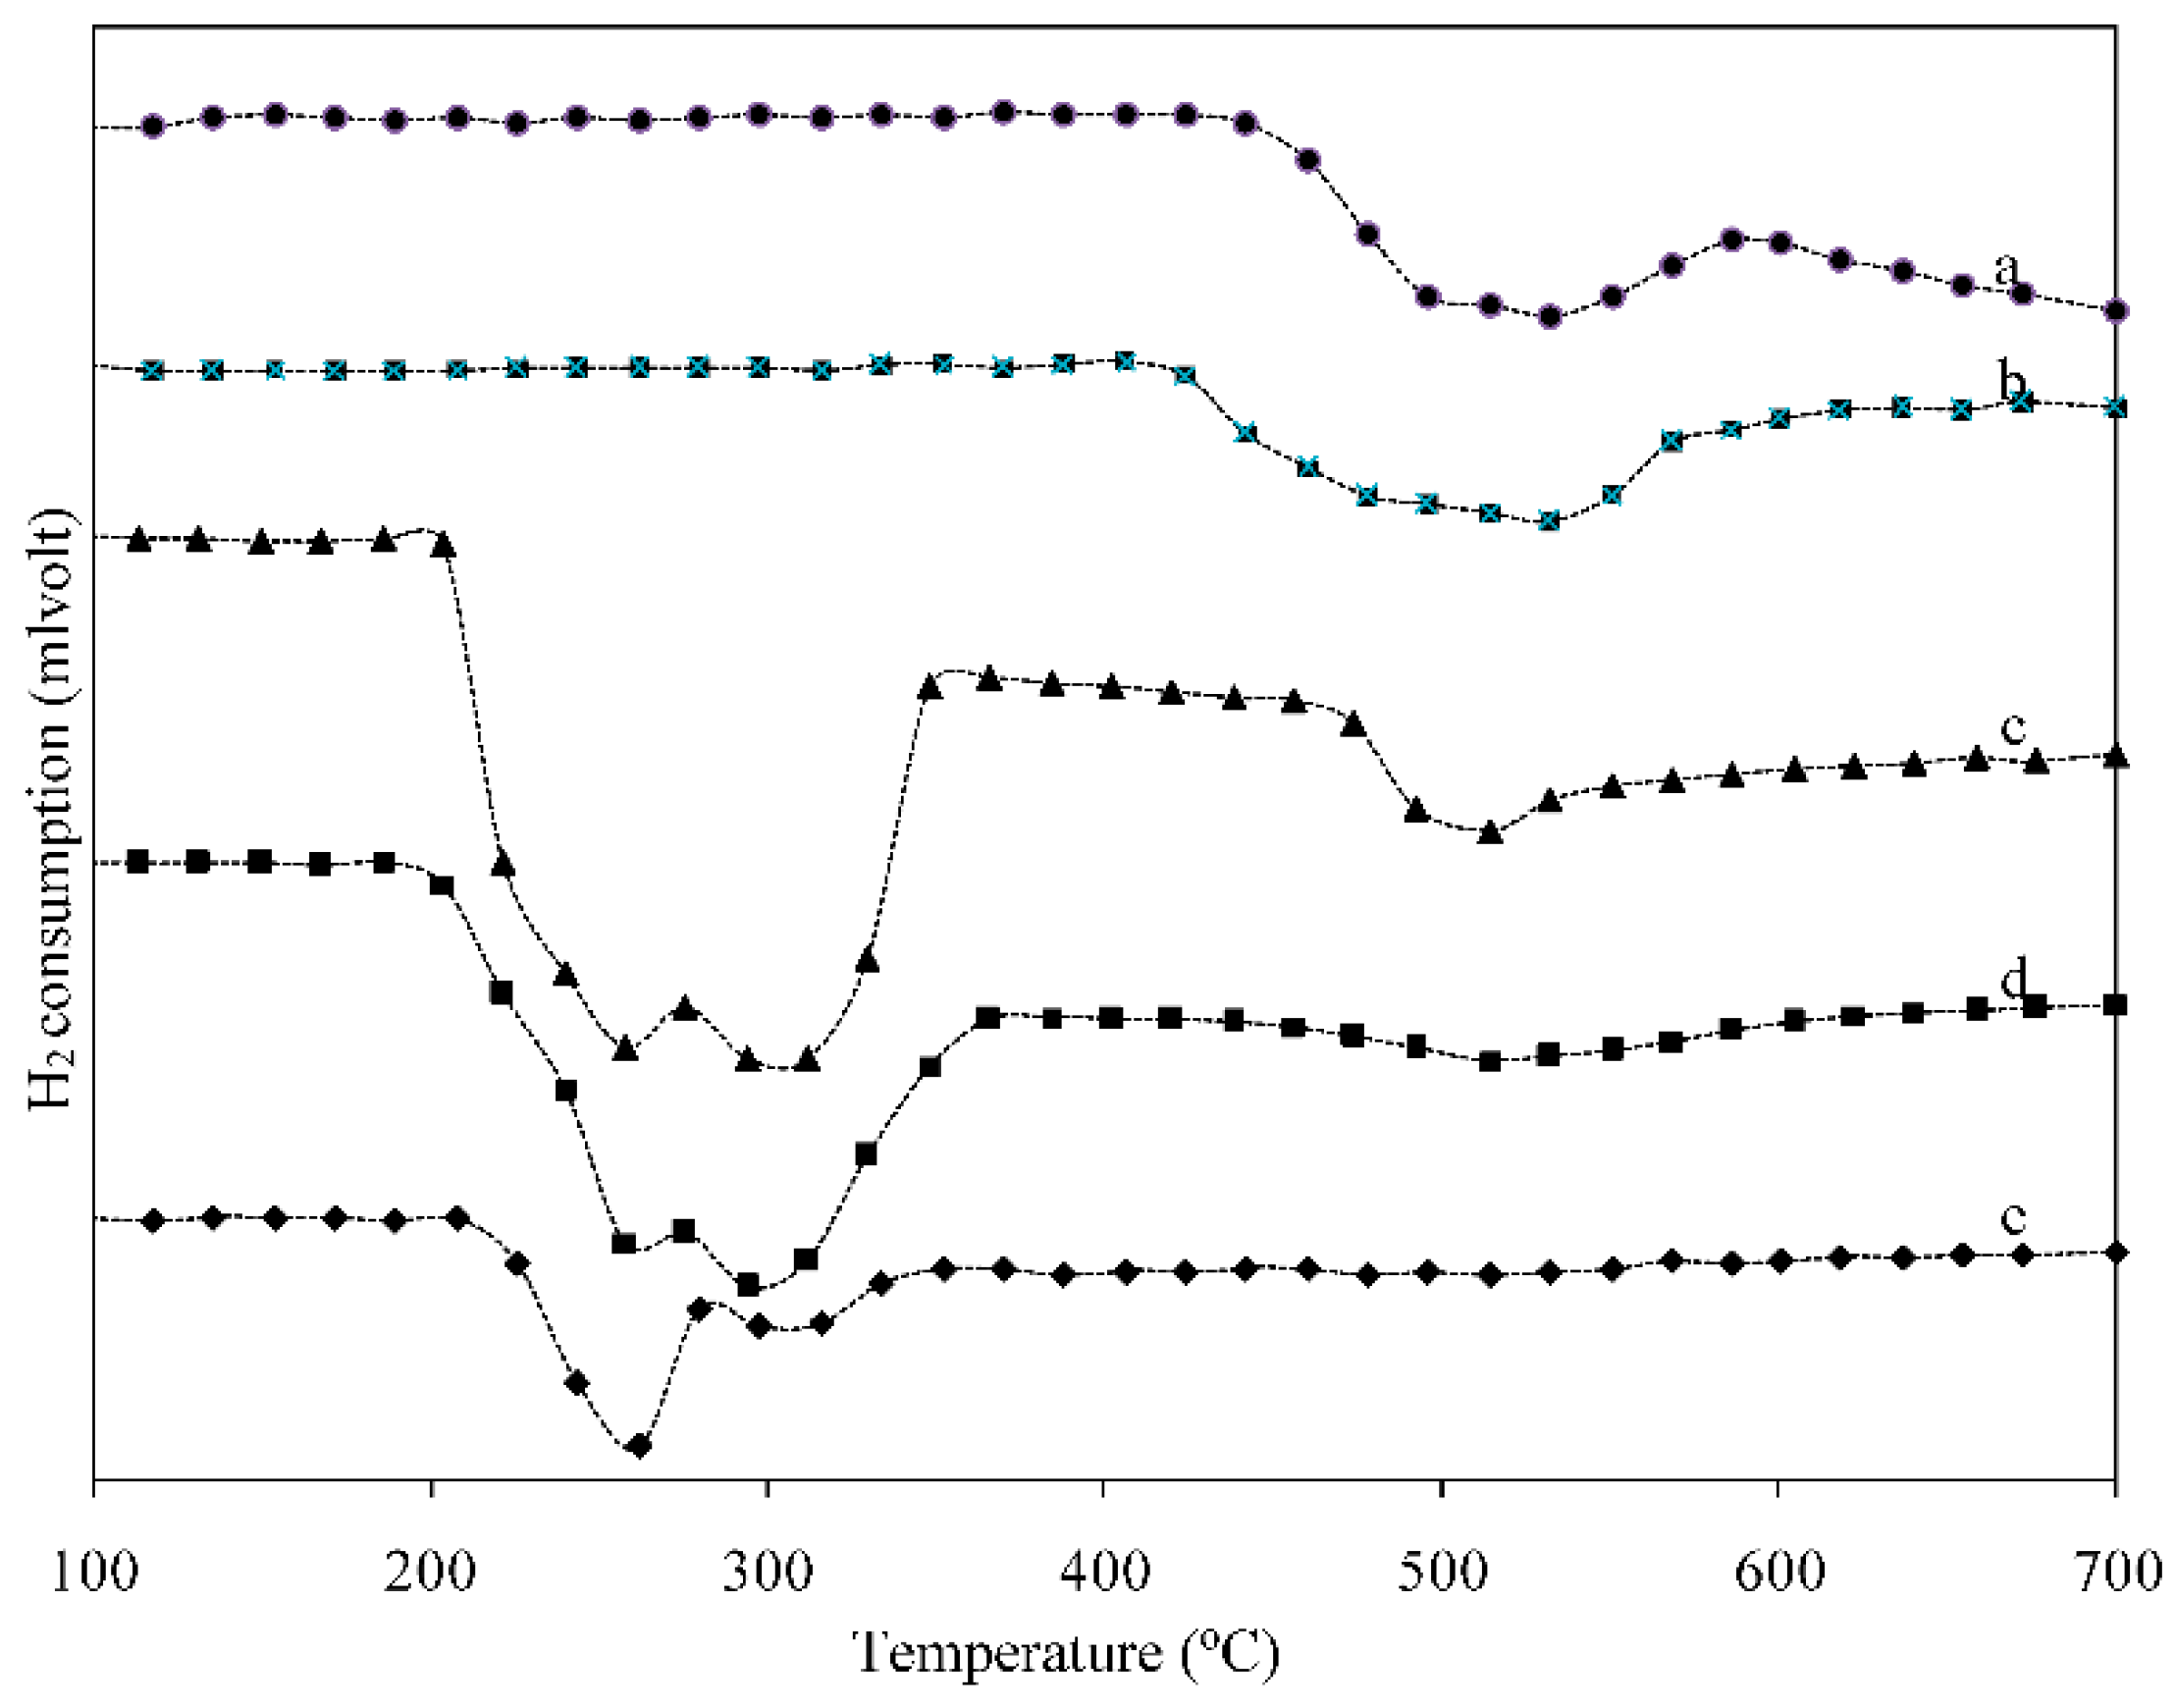
2.2. Temperature Program Reduction (TPR)

Figure 6 shows the TPR profiles of 18 wt. % Ni-Cu/γ-Al2O3 catalysts with various Cu ratios. For the Ni/γ-Al2O3 catalysts (Figure 6a), the TPR pattern shows that the broad reduction signal appears from 400 °C, which can be attributed to the reduction of NiO particles [36,37]; it recognizes that with the Ni/γ-Al2O3 catalysts reduced at 400 °C, there might be a reduction of dispersed Ni2+ and a more intense broad reduction corresponding to bulk NiO species [38]. At lower Cu ratios, only two apparent peaks were observed (Figure 6b,c): A low-temperature peak between 200 and 270 °C, and a high-temperature peak between 580 and 620 °C. With the increase of Cu ratios, the H2-TPR profile patterns showed three reduction peaks (Figure 6d,e); one more low temperature peak between 260 and 380 °C was detected. The intensity of the low-temperature peaks increased with increasing Cu content; while the high-temperature peak shifted to a lower temperature, the range of reduction temperatures was wider. For pure Cu/γ-Al2O3 catalysts, the reduction is characterized by rather-combined two peaks in the range of 200–400 °C (Figure 6f).
Fierro et al. [39] reported that the TPR characteristics could be affected by mass transfer limitations and experimental operating variables such as the initial amount of reducible species, the initial H2 concentration, the total gas flow rate, the heating rate, and the activation energy of the reaction. They claimed that desorption of H2 attached on the reduced Cu metal surface could exhibit the apparent double-peak behavior, which could be affected by water vapor produced by the reduction process, and that the H2-TPR profile of CuO depends on the particle size and surface area, where the peak top is higher by 288 °C for particle sizes of 425–850 microns compared with <100 microns [39]. A similar tendency but with a much larger peak was also reported by Luo et al. [40], who claimed that the hydrogen spillover effect was the reason for the difference between CO-TPR and H2-TPR.
Kim et al. [41] reported that there is an incubation period prior to reduction, which is longer at lower temperatures. The tendency was in agreement with the general theory of nucleation and growth, where the number of newly-formed nuclei was copious at lower temperatures but since the growth was very much limited at lower temperatures, the phase existence was not easily detected by X-ray diffractometry. They claimed that CuO reduction was generally easier than Cu2O reduction with H2-TPR and that the apparent activation energy for Cu2O was close to twice that of CuO, but when the H2 flow rate was not high enough to avoid the rate-limiting step of the reduction process, a sequential reduction process such as CuO → (Cu4O3→) Cu2O → Cu could occur.
Hierl et al. [42] reported that the lowering of the reduction temperature was partially caused by the effect of Ni on the segregation of Cu from the surface in preference of Ni to occupy subsurface or bulk coordination sites. The enrichment of Cu may be enhanced by an increase in the nickel content. On the other hand, the reduction of CuO species could accelerate the reduction of NiO species due to the formation of atomic hydrogen in the environment [43]. Xiaolei Wang et al. [28] reported the interaction between CuO and NiO as well as their occupancy on surface acidic sites of γ-Al2O3 reducing the interaction between metals and support, leading to lowering of the reduction temperature of CuO and NiO.
Consequently, the peak for pure CuO reduction in Figure 6f can be mainly attributable to direct reduction of CuO particles to Cu, contributing a low-temperature peak. The extended TPR peak profile indicates the difficulty of the reduction due to a longer diffusion path for H atoms or H2 molecules as well as the escape of the produced H2O molecules. TPR profile analysis of 18 wt. % Ni-Cu/γ-Al2O3 catalysts at small Cu ratios shows a low-temperature peak (Figure 6b,c) that corresponds to the reduction of CuO particles to Cu. The high-temperature peak corresponding to the reduction of NiO interacted with alumina is also observed in the Ni-Al profile. With increase of Cu content, the first peak at low temperature between 200 and 270 °C could be due to the reduction of CuO particles while the second peak between 260 and 380 °C could correspond to the reduction of CuO bulk [44]. The range of reduction temperatures is wider, which could possibly be due to agglomeration of the CuO bulk to form larger crystallites [45]. Furthermore, the high-temperature peak shifted to a lower temperature with an increase in the Cu content, which is due to the added Cu that produces spillover hydrogen, which considerably accelerates the nucleation of the Ni metal under these reduction conditions, and enhances the reducibility of Ni [46]. This suggests that Cu could enhance the reducibility of the dispersed NiO species, resulting in the shift to lower temperatures.
Figure 7 shows the TPR profiles of different catalysts. In the case of the 18 wt. % Ni0.5-Mo0.5/γ-Al2O3 catalysts (Figure 7a), a reduction peak at about 532 °C was observed and another peak could be assigned at 700 °C. It was reported that the presence of a Mo species impeded the incorporation of the Ni species into the lattice of alumina, thus preventing the growth of Ni particles, leading to less lattice expansion of alumina and highly dispersed Ni-Mo catalysts. This resulted in a weak metal-support interaction and, consequently, improved the reducibility of the catalysts [34,35,47]. Thus we assigned the peak at 532 °C to the reduction of NiMoO4 (the XRD data showed a NiMoO4 peak); the latter peak could be assigned to the reduction of NiO interacting with MoO3. This result is consistent with a previous report [34]. Figure 7b shows the TPR of 18 wt. % Ni0.5-Ce0.5/γ-Al2O3 catalysts. It shows that a peak at about 535 °C is observed and it has been reported that the presence of Ce improves Ni dispersion, thus promoting the reduction of nickel species [48,49,50]. Incidentally, the reduction peak could be assigned to the strong interaction between NiO and CeO2. For Ni0.5-Cu0.5/Al2O3 catalysts with varying Ni0.5-Cu0.5/Al2O3 ratios (Figure 7c–f), the three reduction peaks were clearly observed at 36 wt. % Ni0.5-Cu0.5/Al2O3 catalysts; the intensity of the reduction peaks decreased with no change to the position of peaks due to decreasing the Ni-Cu content. A summary of the TPR results including the temperature peak at maximum H2 consumption and estimated quantity H2 consumption during the catalysts reduction is also presented in Table 2. The amount of H2 consumption during the reduction of Ni-Cu/Al2O3 catalysis is higher than that for Ni-Mo/Al2O3 and Ni-Ce/Al2O3 catalysis and with a lower temperature peak.

2.3. Catalytic Activity

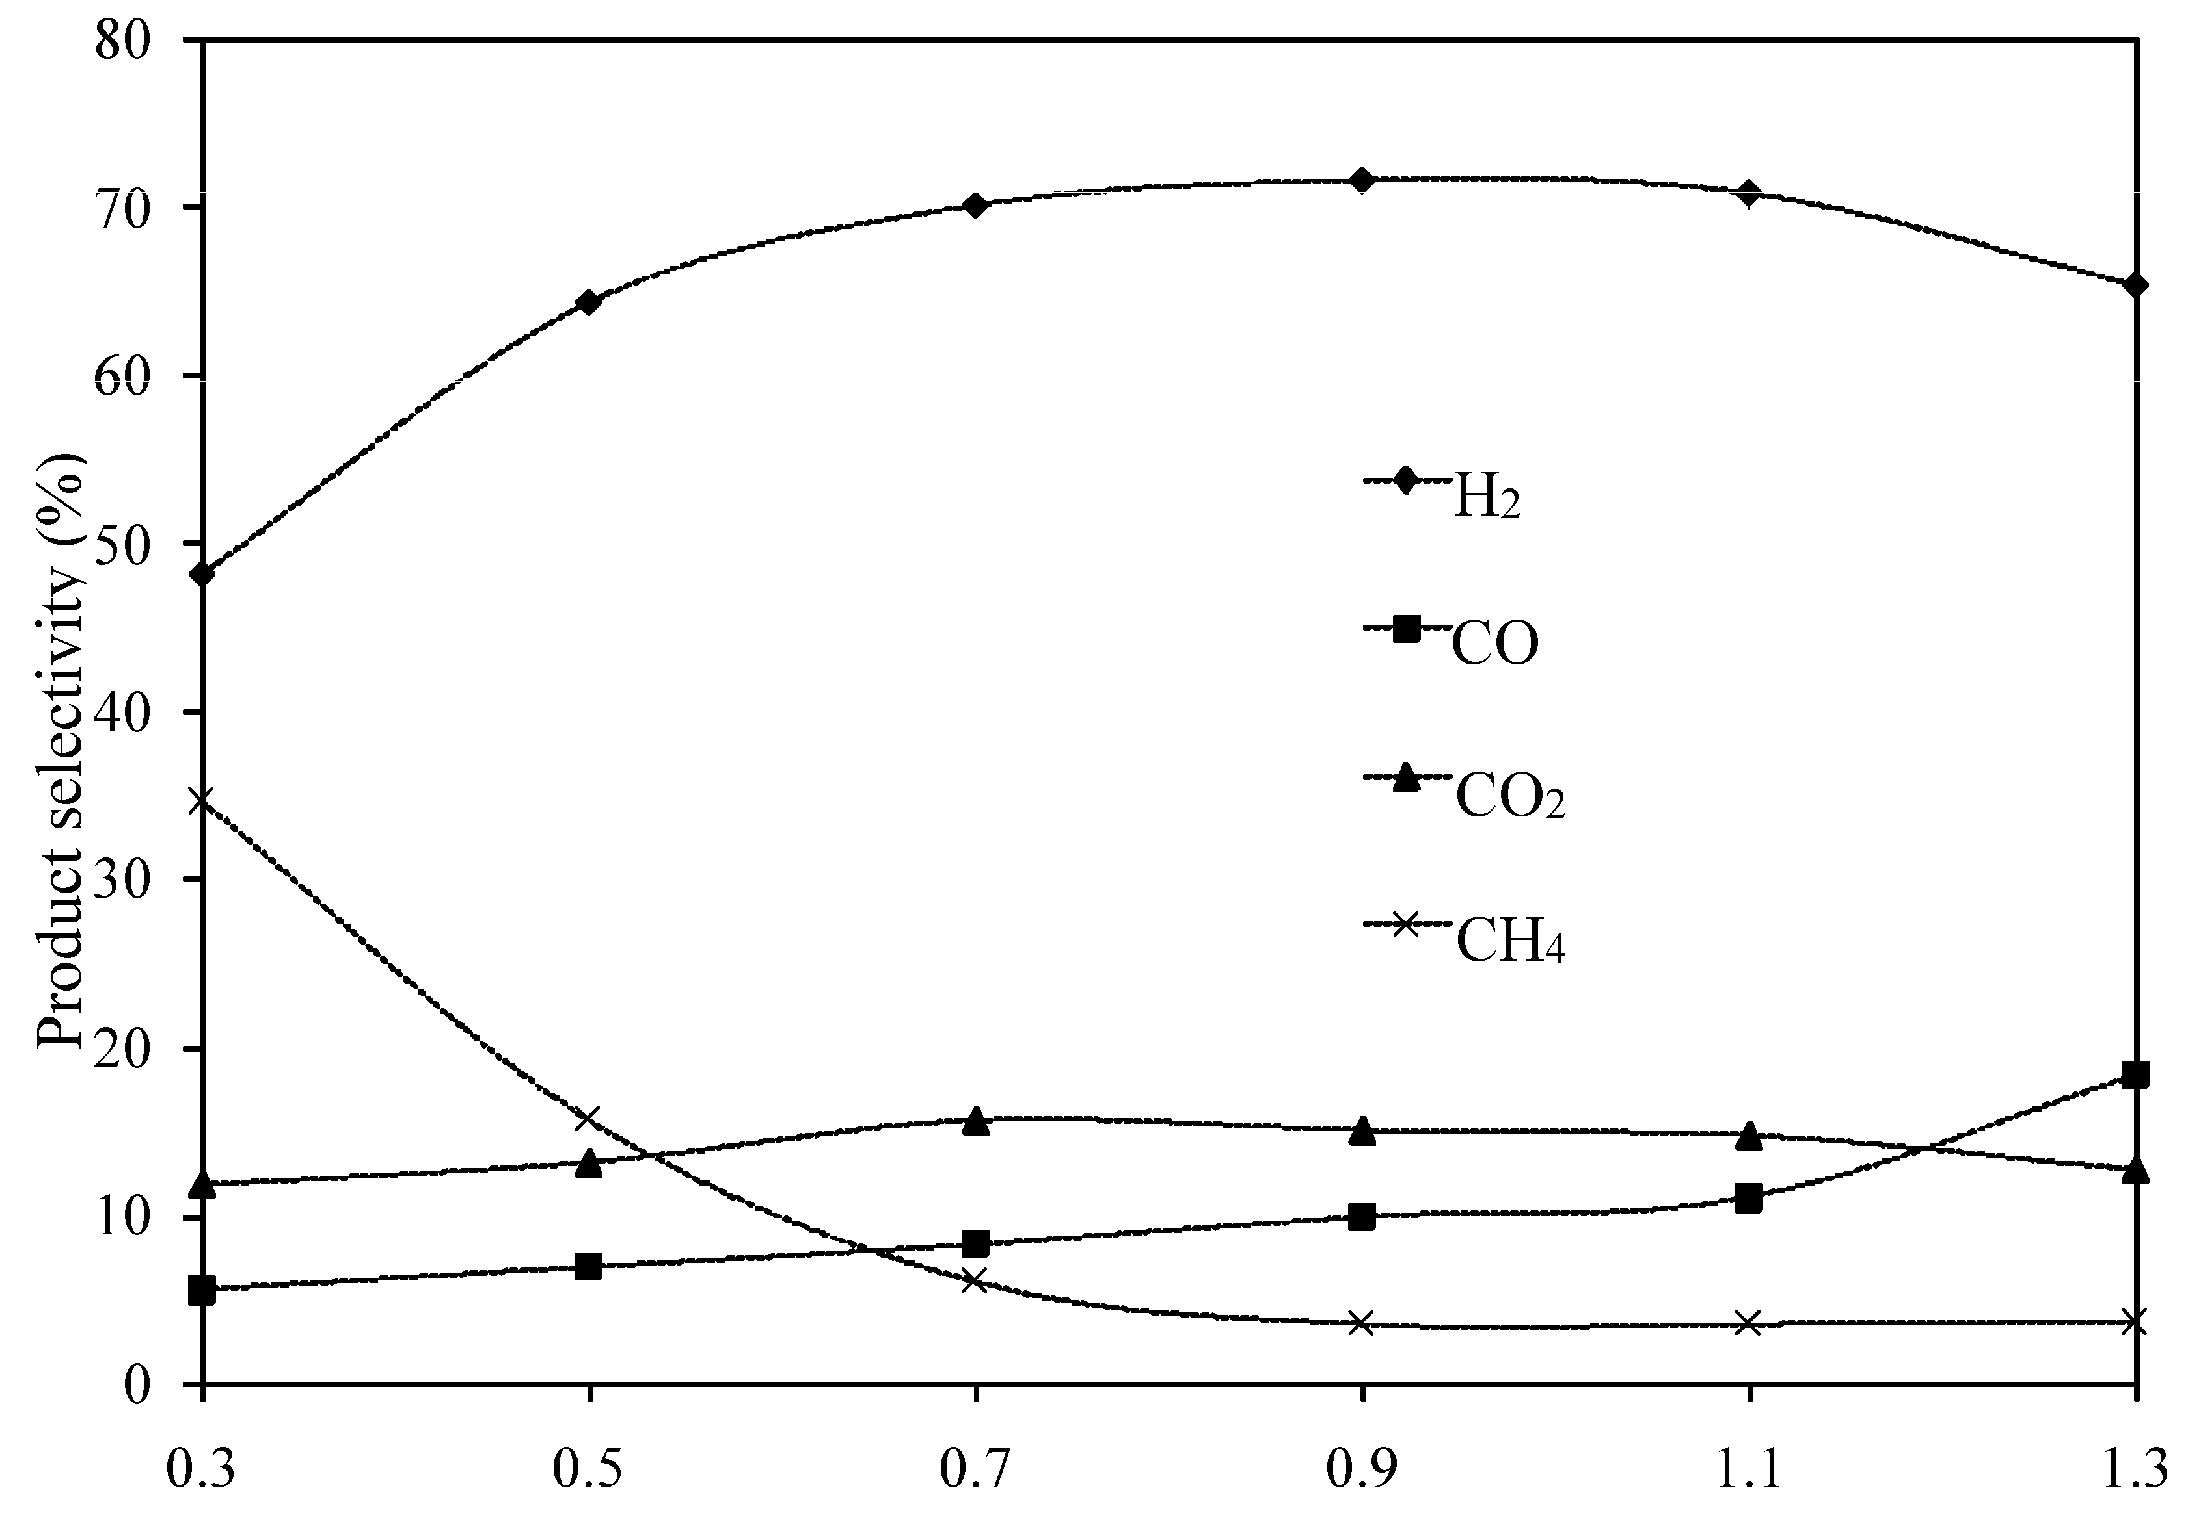
2.3.1. Effect of Steam/Carbon Molar Ratios

Figure 8 shows the effect of steam/carbon (S/C) molar ratios on product selectivity over 18 wt. % Ni0.5-Cu0.5/γ-Al2O3 catalysts at 550 °C. At a small S/C molar ratio of 0.3, less H2 was formed, with selectivity in favor of CH4 and low formation of CO2 and CO was observed. When the ratio of S/C increased from 0.3 to 0.9, H2 selectivity gradually increased and the best H2 selectivity was obtained with a 0.9 ratio of S/C, the formation of CH4 decreased while the formation of CO and CO2 did not change much. When the S/C ratio increased over 0.9, H2 production decreased and the formation of CO2 increased slightly. This suggests that the formation of products derived from thermal decomposition, WGS, and catalytic cracking reactions is favored at stoichiometric reaction conditions due to the limited amount of steam for reforming reactions [44,45,46]. The 0.9 ratio of S/C is used for the rest of the Ni-Cu/γ-Al2O3 catalysts.

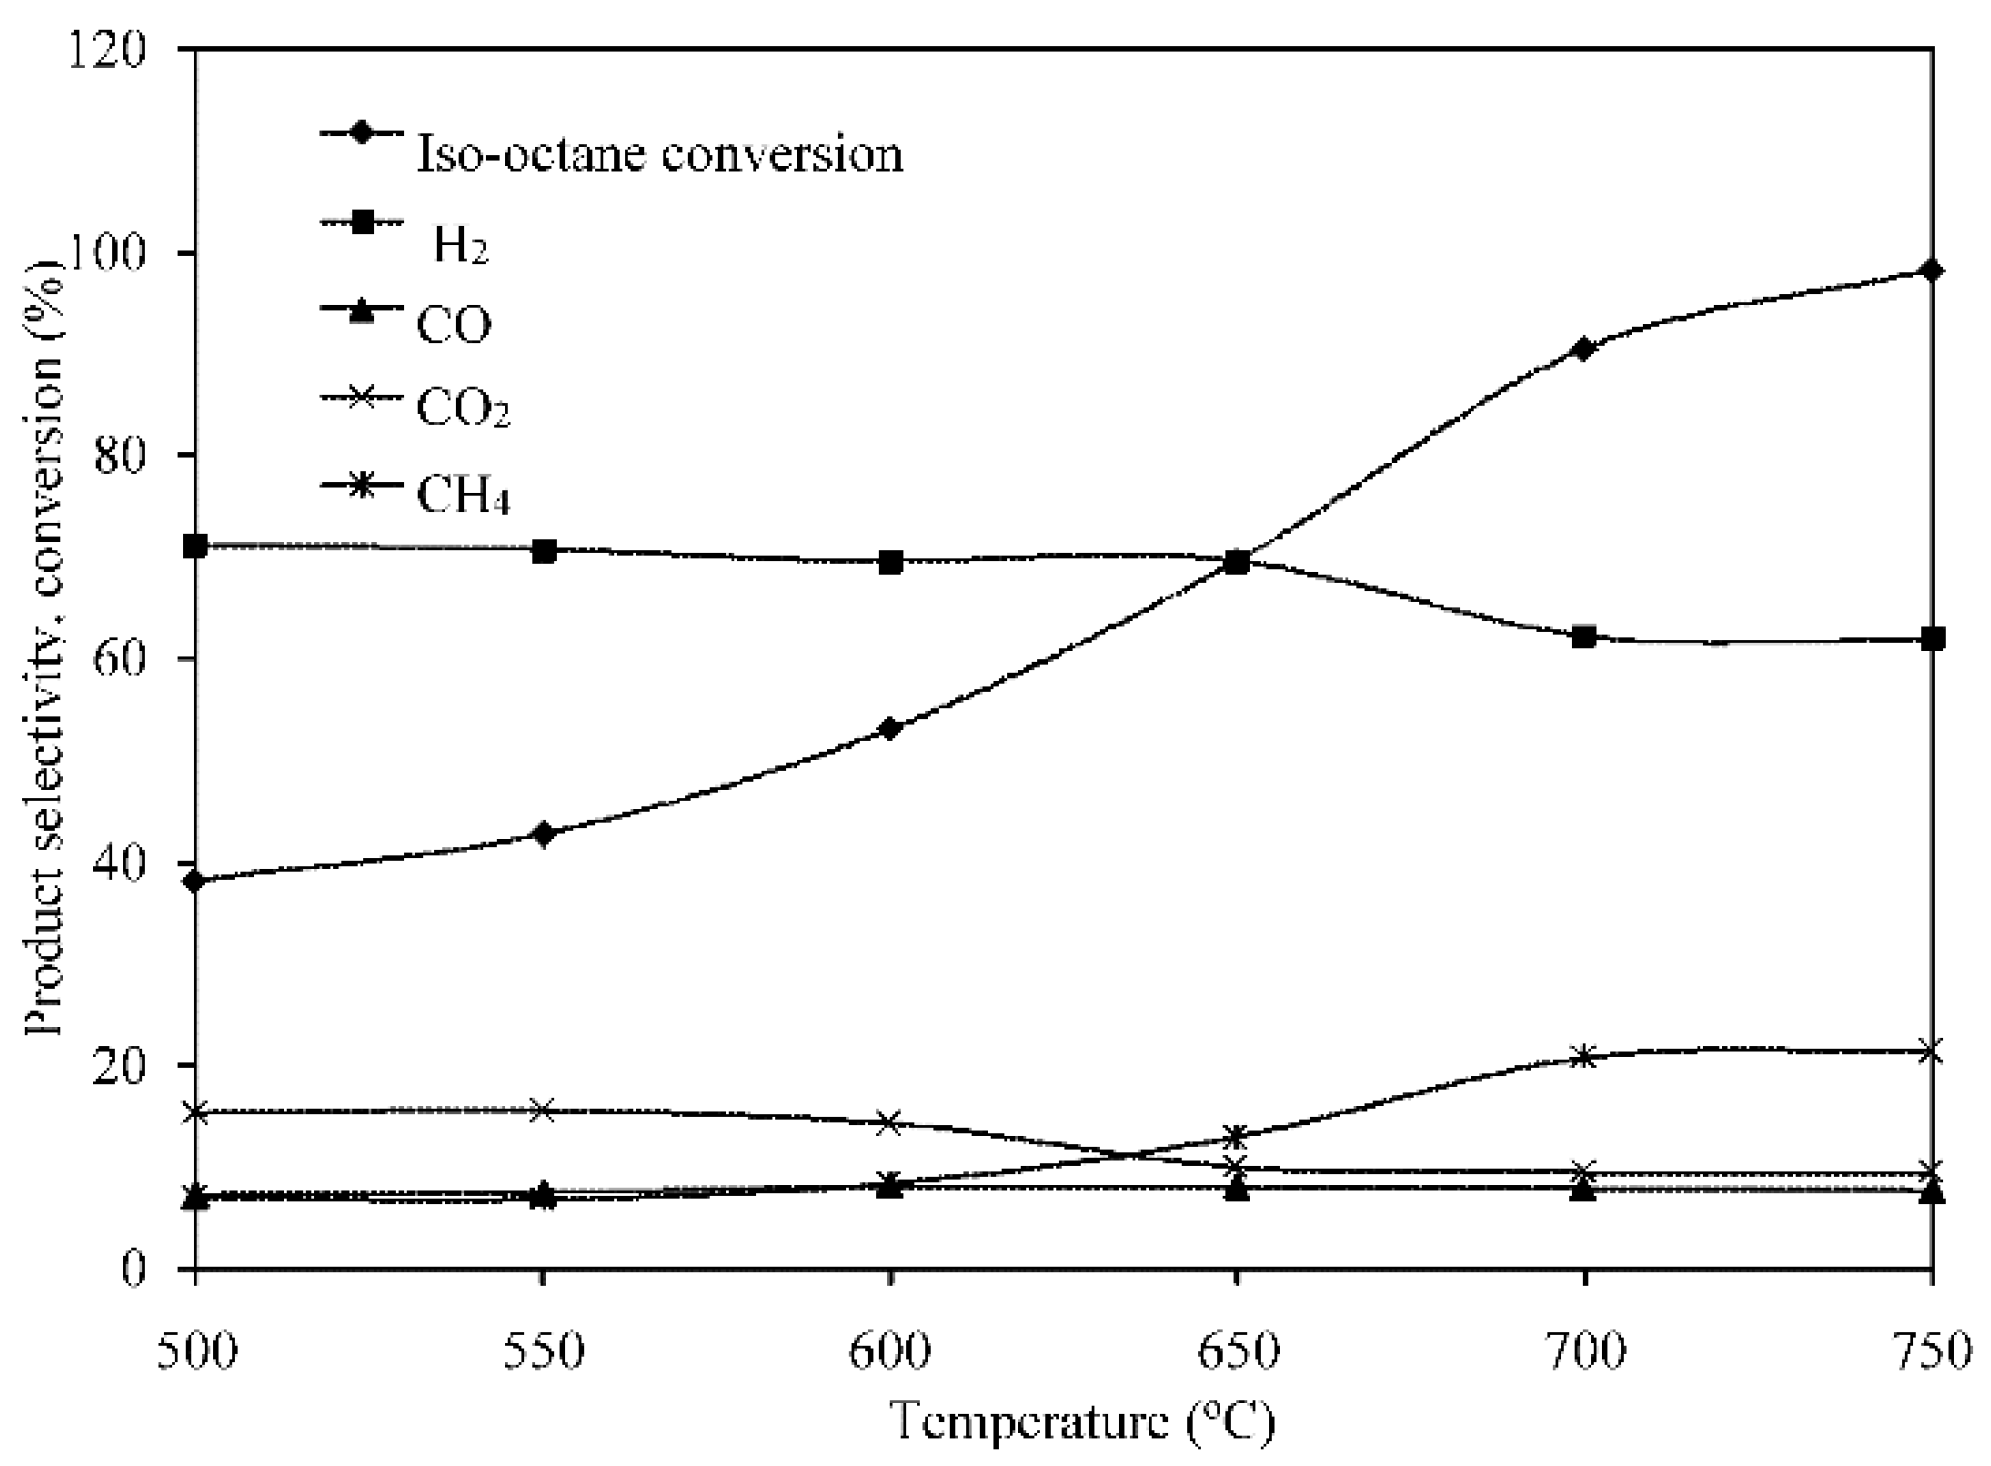
2.3.2. Effect of Temperature on Reformation Composition

Steam reforming of iso-octane is a complex process including several gas phase and chemical reactions, such as pyrolysis, oxidation, reforming, methanation, and WGS reactions [46]. Savage et al. [51] reported that hydrogen selectivity occurs through multiple pyrolysis reactions, as hemolytic dissociation of the C–C bond, radical recombination, beta scission, isomerization, and hydrogen abstraction. The product selectivity is determined by the strength of the C–H and C–C bonds in the reactant molecules; an alternative approach for H2 selectivity through steam reforming (SR) of iso-octane was proposed by Kopasz et al. [16]. iso-Octane is initially broken down by thermolysis into lighter hydrocarbons, which are reformed by steam on the catalytic surface. The following simplified reaction scheme has been proposed and includes reforming/decomposition reactions and secondary chemical steps involving the different intermediate products [45].
C8H18 + 8H2O → 8CO + 17H2   ∆H0 = 1310 kJ/mol
C8H18 + 16H2O → 8CO2 + 25H2  ∆H0 = 1684 kJ/mol
C8H18 → 8C + 9H2     ∆H0 = 391 kJ/mol
C8H18 + 8CO2 → 16CO + 9H2   ∆H0 = 1639 kJ/mol
CO + H2O → CO2 + H2    ∆H0 = –41 kJ/mol
CO + 3H2 → CH4 + H2O    ∆H0 = –206 kJ/mol
CO2 + 4H2 → CH4 + 2H2O   ∆H0 = –165 kJ/mol
C + 2H2 → CH4      ∆H0 = –75 kJ/mol
CO + C → CO2      ∆H0 = –172 kJ/mol
C + H2O → CO + H2     ∆H0 = 131 kJ/mol
Figure 9 shows the effects of temperature on conversion and product selectivity over 18 wt. % Ni0.5-Cu0.5/γ-Al2O3 catalyst at a 0.9 ratio of S/C. Steam reforming of iso-octane results mainly in H2, CO, CO2, and CH4. As the reforming temperature increases from 500 to 750 °C, the CO2 concentration decreases slightly from 15.1% to 9.4%; the CO concentration remained almost constant (7%), while a strong increase in the CH4 concentration from 6.9% to 21.2% was obtained. The concentration of H2 dropped from the highest concentration of 71% to 61.8% due to the reforming temperature increasing from 500 to 750 °C. This indicates that the methanation reactions between the carbonaceous compounds (C, CO, CO2) and H2 are favored at high temperatures (reaction 10, 11, and 12). Therefore, a decrease in H2 was observed at high temperatures, accompanied by an increase in CH4 concentration. It should also be noted that the CO concentration was almost stable at high temperatures, probably implying a balance between the CO production and CO consumption (reactions 5, 8–10, and 13–14). A similar result on product selectivity was also observed by Ming [52]. The conversion of iso-octane is also shown in Figure 9. At 500 °C, only 38.1% of iso-octane was converted to gas compositions, while nearly 100% conversion was observed at 750 °C. As the reaction temperature increased, the energies for steam reforming (reactions 5 and 6), cracking (reaction 7), and dry reforming reactions (reaction 8) were promoted, therefore conversion performance was improved.

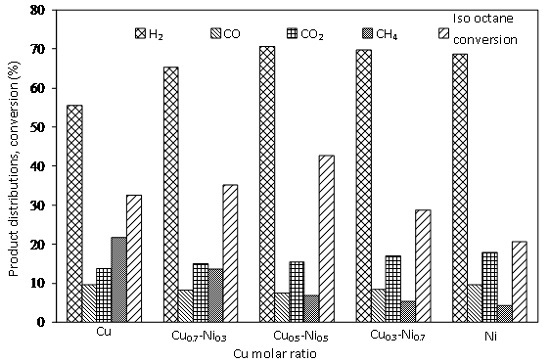
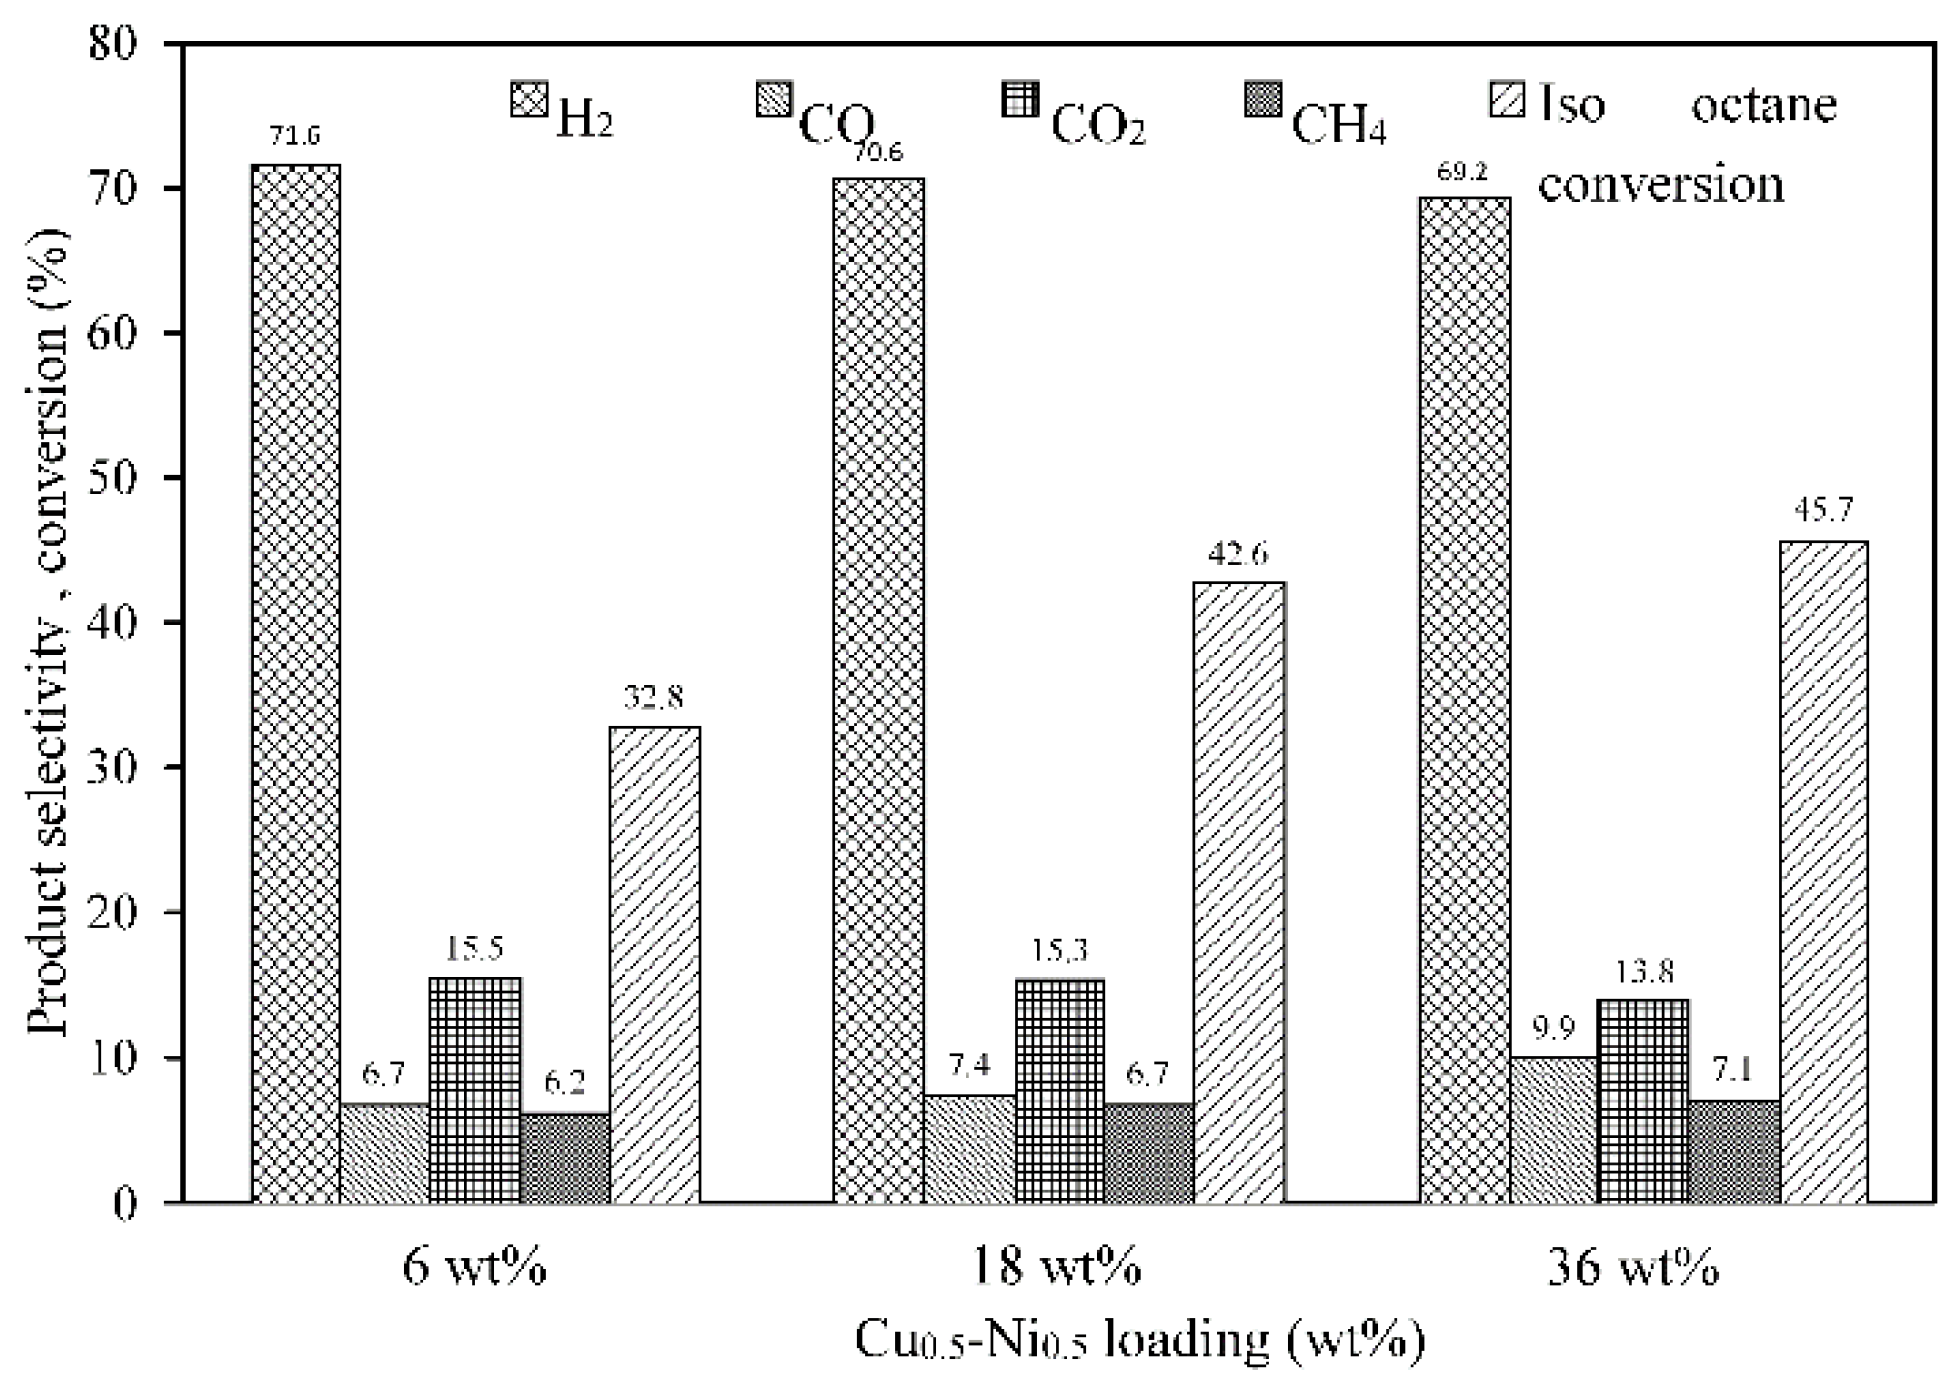
2.3.3. Effect of Ni-Cu Loading on γ-Al2O3 Support

Figure 10 shows the effects of conversion and product selectivity when Ni0.5-Cu0.5 increased from 6 wt. % to 36 wt. %. The results show that the iso-octane conversion increased with increasing Ni-Cu content. It is a fact that with the increase of Ni-Cu loading, a higher interaction between CuO and NiO as well as their occupancy of surface sites of γ-Al2O3 were seen, therefore enhancing the iso-octane conversion [28]. The product selectivity were not dependent upon the metal loading; the results showed that product selectivity was almost identical for 6 wt. %, 18 wt. %, and 36 wt. % Ni-Cu loading (Figure 10).
Figure 11 shows the effect of the Cu molar ratios on conversion and product selectivity over 18 wt. % Nix-Cu1−x/Al2O3 (x = 1, 0.7, 0.5, 0.3, 0) catalysts at the low temperature reaction of 550 °C. For the 18 wt. % Ni/γ-Al2O3 catalysts, it exhibited poor catalytic activity with a maximum iso-octane conversion of 20.6%. It was also observed that iso-octane conversion increased from 20.6% to 42.6% with increasing Cu loading up to 0.5 molar, while H2 and CH4 selectivity reached values of 70.5% and 6.7%, respectively; CO and CO2 selectivity decreased slightly. This fact was probably caused by Cu, which enhanced the reducibility of the dispersed Ni species, and/or by Ni, which favored the segregation of Cu2+ ions to the surface [28,53]. This is in agreement with the analysis of XRD and H2-TPR; in this way the iso-octane conversion was enhanced. It seems that a catalyst containing about 0.5 molar of Cu is suitable for steam reforming reactions (reactions 5–8); as a result, high hydrogen concentration is observed. At higher Cu loadings of 0.5 molar, iso-octane conversion and H2 selectivity decreased while higher CH4 formation was favored. The phenomenon could be caused by agglomeration of bulk Cu particles that were dispersed on the Ni surface, therefore inhibiting the reducibility of Ni. This indicated that the methanation reaction (reactions 10–12) should take preference at higher Cu loadings of 0.5 molar [54]. For 18 wt. % Cu/γ-Al2O3 catalysts, it also showed poor catalytic activity, with a maximum iso-octane conversion of 32.4%; hydrogen selectivity reached a poor maximum value of 55.4% which is much lower than that obtained for the bimetallic Ni-Cu catalyst, and the highest CH4 selectivity of 21.5% was observed.

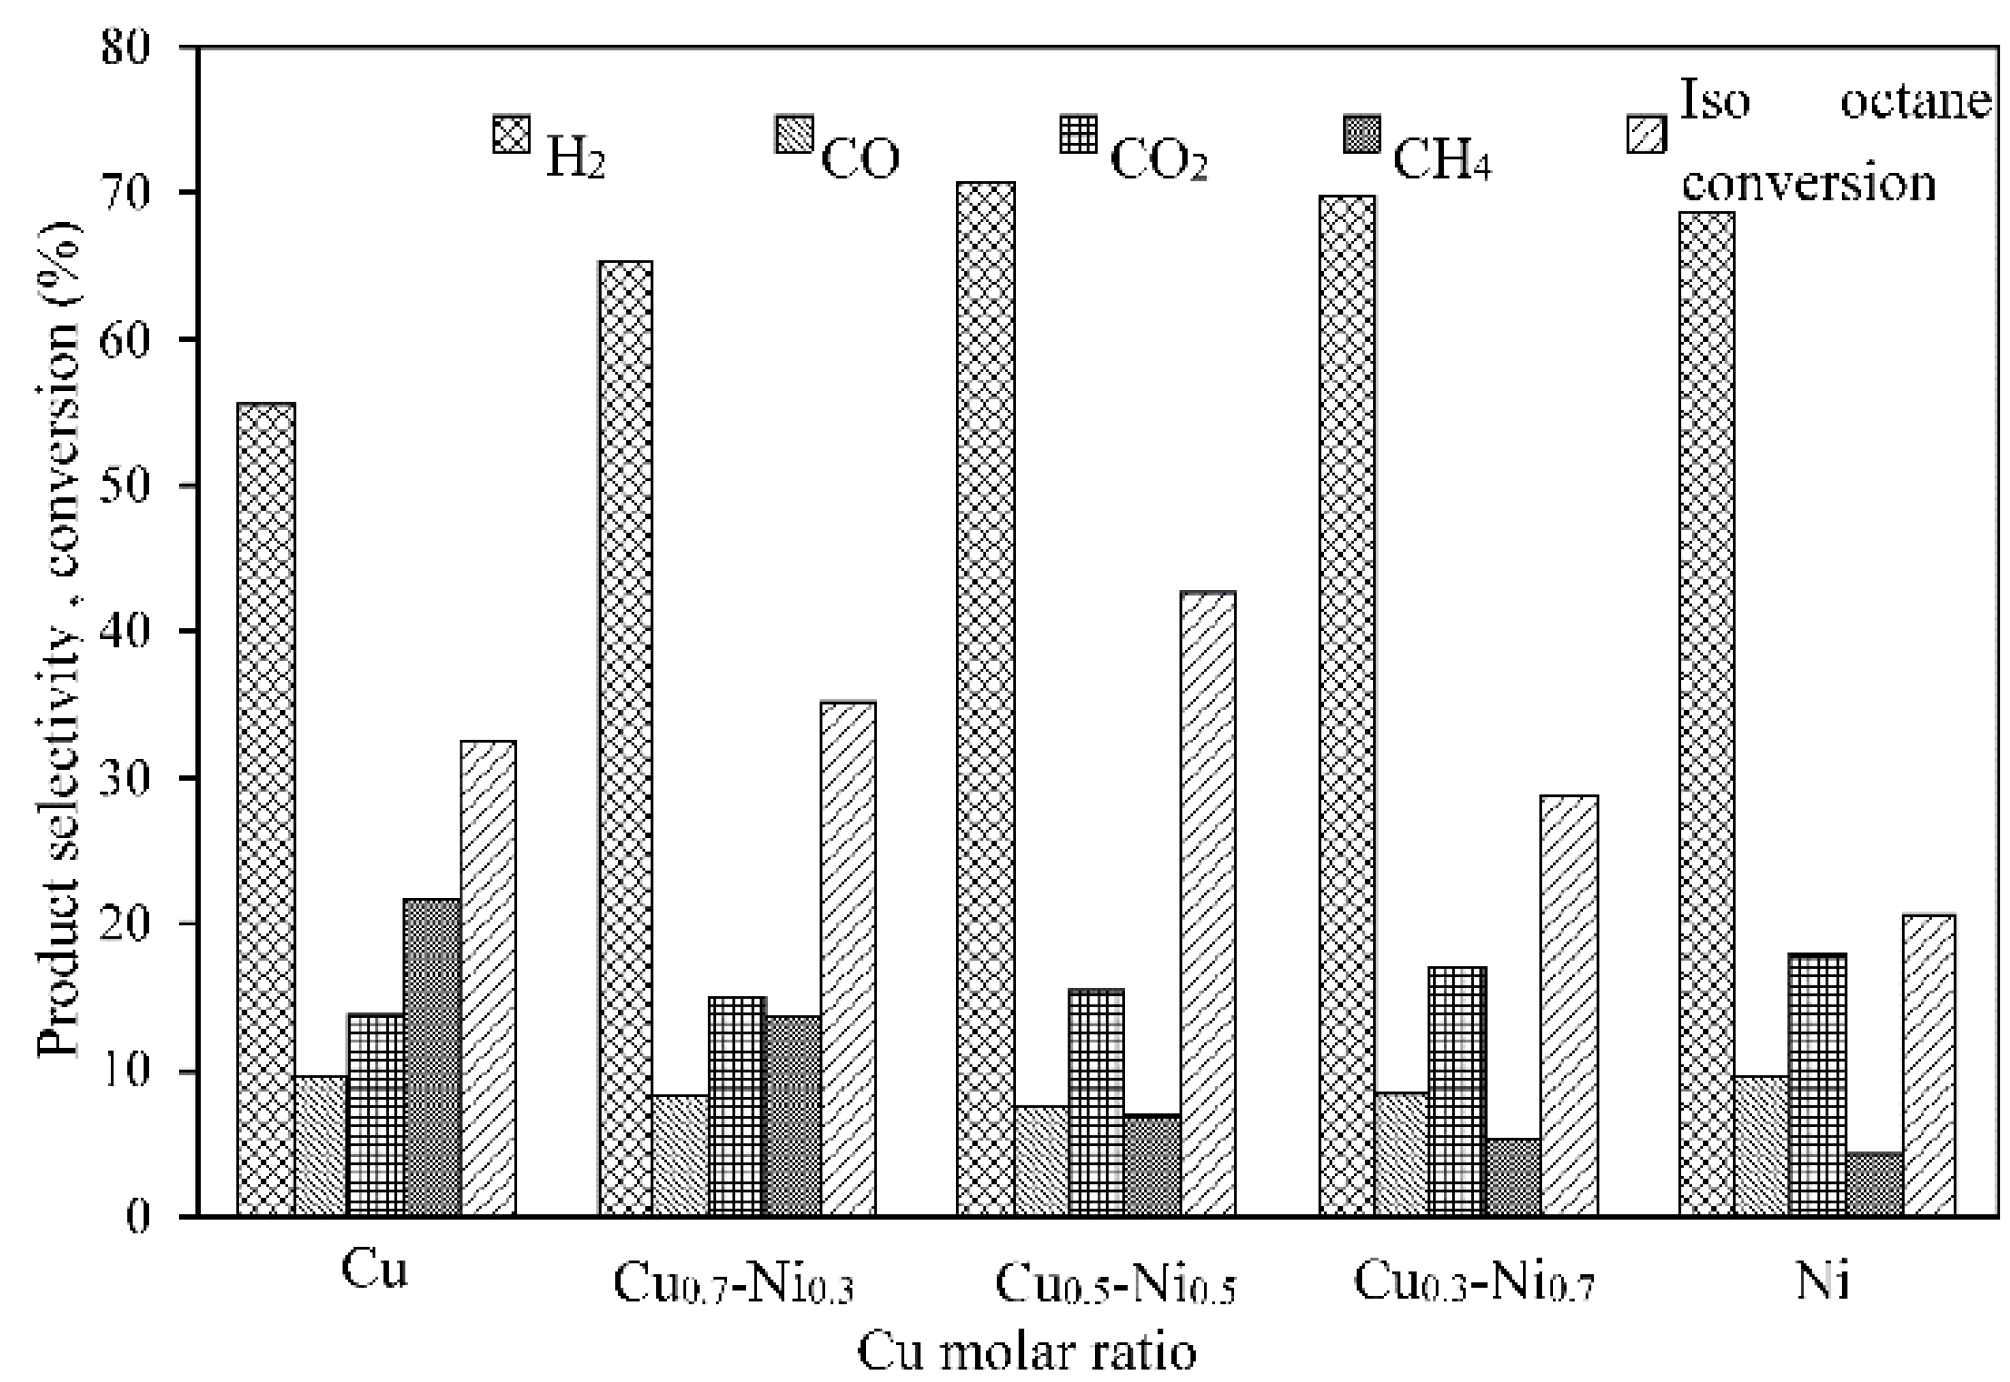
2.3.4. Effect on Catalytic Performance

Conversion and product selectivity for steam reforming of iso-octane on Al2O3-supported catalysts at the low temperature of 550 °C are summarized in Table 3. Here it is presented that iso-octane conversion over 18 wt. % Ni0.5-Cu0.5/γ-Al2O3 catalyst was much higher than that of 18 wt. % Ni0.5-Mo0.5/γ-Al2O3 and of 18 wt. % Ni0.5-Ce0.5/γ-Al2O3 catalysts; similar product selectivity was observed for all catalysts. Wang et al. [55] reported steam reforming of gasoline over the Ni-Ce/γ-Al2O3 catalyst and found that the Ce addition improved oxygen mobility and therefore enhanced the activity maintenance of the catalyst. A better activity maintenance of Ni-Ce/γ-Al2O3 than Ni/γ-Al2O3 was exhibited at a temperature of 690 °C. It was also reported that the largest and most desirable changes of nickel catalytic properties in steam reforming of hydrocarbon were observed with small amounts of Mo at high temperatures [47]. The best catalytic performance of Ni0.5-Cu0.5/γ-Al2O3 catalyst demonstrated in Table 3 is consistent with TPR results (Figure 6), of which the superior reducibility of the Ni-Cu/γ-Al2O3 catalyst was reached at low temperatures.

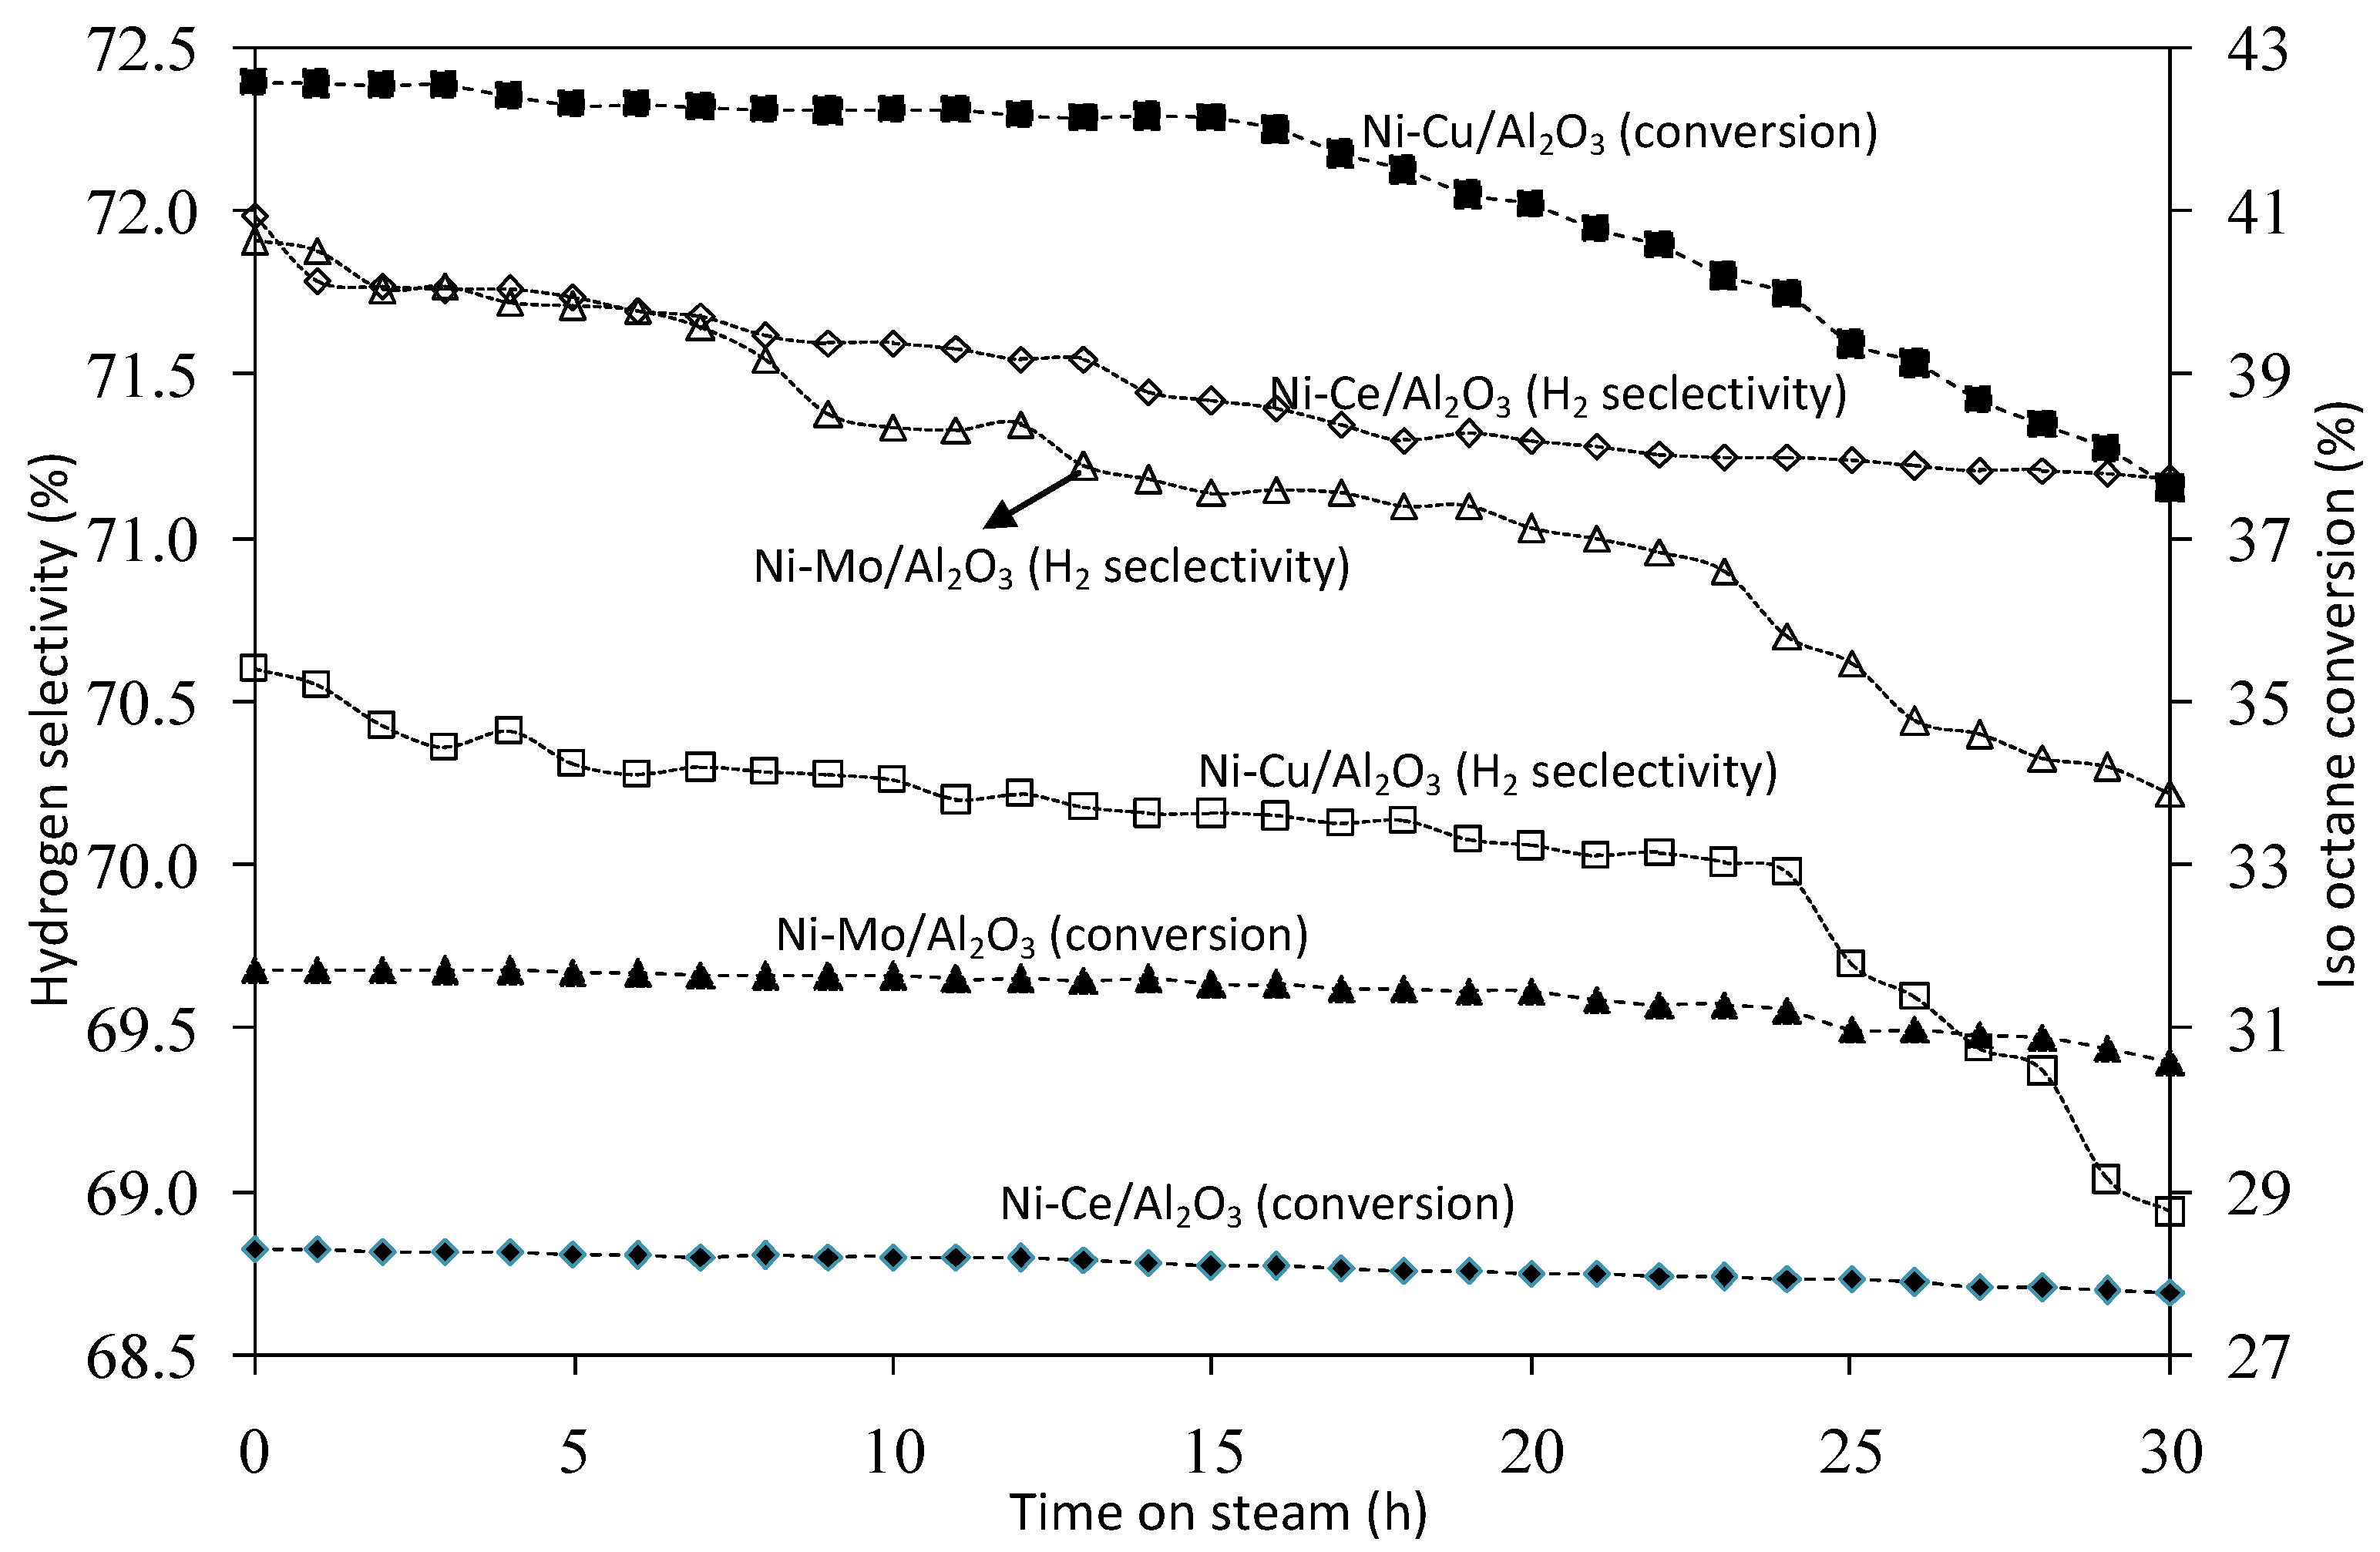
2.3.5. Stability Testing

Figure 12 shows hydrogen selectivity and iso-octane conversion over different catalysts with the time on steam of 30 h. For Ni0.5-Cu0.5/γ-Al2O3 catalyst, the conversion of iso-octane and H2 selectivity were stabilized for the first hours and thereafter slightly decreased when the time on steam was extended to 30 h. The same tendency of hydrogen selectivity and iso-octane conversion was observed over the Ni0.5-Ce0.5/γ-Al2O3 and Ni0.5-Mo0.5/γ-Al2O3 catalysts, this result is consistent with previous studies [47,48]. It is widely accepted that the deactivation of the Ni catalyst in the steam reforming of fossil fuels is mainly due to carbon deposition on the catalyst surface [20]. A large amount of coke was deposited on the surface of the Ni catalyst, resulting in a loss of catalytic activity for C–C bond cleavage. It is believed that Mo species incorporated with the Ni catalyst suppress coke formation. Mo species not only decrease the coking rate but also prolong the induction period of coke formation [56]. It was also reported that the highly dispersed Mo species served as a barrier for preventing the growth of Ni particles [56]. This is the reason for the low rate of coke deposition on the Ni-Mo catalyst. It was also reported that the Ce content in Ni0.5-Ce0.5/γ-Al2O3 catalyst can make highly dispersed Ni particles with a strong metal-support interaction, resulting in high coke resistance [48]. The results in Figure 12 also show a higher decrease in the conversion of iso-octane over Ni0.5-Cu0.5/γ-Al2O3 catalyst. This phenomenon could be caused by agglomeration of copper particles. It was reported that Cu-based catalysts could easily be deactivated, caused by agglomeration of copper particles when reaction temperatures are over 300 °C [57]. Figure 13 shows SEM micrograph and EDX mapping of Ni0.5-Cu0.5/Al2O3 catalysts after 30 h on steam. The results show that the Cu particles become larger and the carbon particles deposited on the surface can also be clearly observed.

3. Experimental Section

3.1. Catalyst Preparation

γ-Al2O3 powder (Wako Pure Chemical, Osaka, Japan, pure 99.98%, 216.4 m2/g), Cu(NO3)2·3H2O, Ni(NO3)2·6H2O, Ce(NO3)3·6H2O, (NH4)6Mo7O24·4H2O (Merck Chemicals, Darmstadt, Germany, pure 99,99%) were used as starting materials. Ni-Cu/γ-Al2O3 (with various Ni-Cu ratio and loading), Ni-Mo/γ-Al2O3 and Ni-Ce/γ-Al2O3 were prepared by co-impregnating γ-Al2O3 support with Ni(NO3)2·6H2O, Cu(NO3)2·3H2O, Ce(NO3)3·6H2O, (NH4)6Mo7O24·4H2O aqueous solutions, respectively. After impregnation, all samples were dried at 110 °C for 6 h, followed by calcination at 500 °C for 6 h [18]. The molar ratios of Ni:Mo and Ni:Ce on Ni-Mo/γ-Al2O3 and Ni-Ce/γ-Al2O3 catalysts were kept at 1:1. The loading of Ni-Mo and Ni-Ce was maintained at 18 wt. %. The molar ratios of Cu in Ni-Cu/γ-Al2O3 catalysts were varied by 0, 10, 30, 50, 70, and 100%. Loading of Cu and Ni on Ni0.5-Cu0.5/γ-Al2O3 catalysts was changed from 6 to 36 wt. %.

3.2. Catalyst Characterization

The structures, the morphological aspects and the compositions of catalysts were analyzed by X-ray diffractometry (XRD) using Cu Kα radiation (RIGAKU RINT-2100CMT, Tokyo, Japan), scanning electron microscopy (SEM, Hitachi, SU6600 EVACSEQ, Tokyo, Japan and JOEL JSM7600F, Tokyo, Japan) and EDX (energy dispersive X-ray, X-Max50, Tokyo, Japan). The surface area was estimated by the N2 adsorption at −196 °C, using the multipoint BET analysis method (ASAP 2010, Norcross, GA, USA). The total pore volume was calculated based on the adsorbed nitrogen at the highest relative pressure, while the average pore size diameter was determined by the Barrett, Joyner, and Halenda (BJH) method [25].
Hydrogen temperature programmed reduction (H2-TPR) was conducted to determine the reductive properties of catalysts; 500 mg of catalyst was put in a quartz flow micro reactor and heated to 700 °C at a heating rate of 3 °C/min under 10% H2/He with a total flow of 25 mL/min. Prior to TPR profile measurement, all samples were pretreated at 600 °C for 1 hour under 20% O2/N2 and cooled to room temperature. The consumption of H2 was detected by a gas chromatography (Thermal Trace GC, San Jose, CA, USA).

3.3. Catalytic Activity

iso-Octane (Merck Chemicals, Darmstadt, Germany, pure 99.999%) was used as a gasoline surrogate for the simplicity of the experimental procedure. Catalytic activities were carried out with about 500 mg of catalyst placed in a fixed bed continuous-flow quartz reactor. Before the steam reforming reaction, all catalysts were preheated by flowing air at 600 °C for 1 hour then reduced under 10% H2/He at 400 °C for 2 h. Flows of liquid hydrocarbon (iso-octane) and water were controlled by liquid pumps and preheated in an evaporator before being fed into the reactor. Pure 99.99% N2 was used as the carrier gas and internal standard; the flow rate of N2 was controlled by a mass flow rate-controller at a value of 15 mL/min. The products were withdrawn periodically from the outlet of a condenser installed at the reactor exit to collect water. The gas mixture was analyzed by a gas chromatograp, (Thermal Trace GC RGA) equipped with a thermal conductivity detector. Conversion, selectivity, and formation rates of products were calculated by an internal standard analyzing method as reported earlier [10,18],whereby, the flow rate of nonreactive internal standard gas (Fst) was kept constant.
F s t = F t o t a l o u t l e t X s t o u t l e t = F t o t a l i n l e t X s t i n l e t
Here, F t o t a l i n l e t and F t o t a l o u t l e t were the total flow rates at inlet and outlet of the reactor, respectively. Xst refers to the concentration of the internal standard gas.
The formation rate of i product (Fi) can be calculated as:
F i = F t o t a l o u t l e t X i o u t l e t = F s t X i o u t l e t X s t o u t l e t
Hydrocarbon conversion (CHC) can be calculated on the basis of the carbon balance as
C H C = F C O o u t l e t + F C O 2 o u t l e t + F C H 4 o u t l e t F g a s o l i n e i n l e t
In the same way, H2O conversion ( C H 2 O ) is calculated as
C H 2 O = F C O o u t l e t + 2 F C O 2 o u t l e t F H 2 O i n l e t
F g a s o l i n e i n l e t and F H 2 O i n l e t are the flow rates of the gasoline and water feed, respectively, which were controlled by liquid pumps.

4. Conclusions

Steam reforming of gasoline with hydrogen selectivity over Ni-Cu/γ-Al2O3 catalysts was investigated at low temperatures. TPR analysis of Ni-Cu/Al2O3 catalysts indicated a shift in Tmax towards a lower temperature; the addition of copper improved the dispersion of nickel and therefore facilitated the reduction of the Ni at lower temperatures. The catalytic performance of Ni-Cu/γ-Al2O3 catalysts was improved by the addition of Cu, which enhanced the reducibility of the dispersed Ni species. The conversion of gasoline with Ni-Cu/Al2O3 catalysts was significantly higher than that with nickel catalysts at a low temperature of 550 °C close to the normal SI engine exhaust gas temperature. On the other hand, initial durability testing showed that the conversion of gasoline slightly decreased after 30 h with steam, which was ascribed mainly to carbon deposition and agglomeration of copper particles. Therefore, Ni-Cu/Al2O3 could be effective in hydrogen selectivity when applied in SI engines.

Acknowledgments

This research was supported by the Ministry of Science and Technology, Vietnam; the Laboratory of Petrochemical Refinery & Catalysts at Hanoi University of Science and Technology is acknowledged for catalytic activity measurement.

Author Contributions

Nguyen The Luong carried out the catalyst preparation and experimental tests and wrote the draft of the manuscript. Le Anh Tuan and Keiichi N. Ishihara conceived and designed the experiment, Keiichi N. Ishihara performed the experiments; Le Anh Tuan analyzed the data.

Conflicts of Interest

The authors declare no conflict of interest.

References

  1. King, R.O.; Hayes, S.V.; Allan, A.B.; Anderson, R.W.P.; Walker, E.J. The hydrogen engine: Combustion knock and the related Dame velocity. Trans. Eng. Inst. Canada 1958, 2, 143–148. [Google Scholar] [CrossRef]
  2. Tsolakis, A.; Megaritis, A.; Wyszynski, M.L. Application of exhaust gas fuel reforming in compression ignition engines fuelled by diesel and biodiesel fuel mixtures. Energy Fuels 2003, 17, 1464–1473. [Google Scholar] [CrossRef]
  3. Jamal, Y.; Wyszynski, M.L. On-board generation of hydrogen rich fuels—A review. Int. J. Hydrogen Energy 1994, 19, 557–572. [Google Scholar] [CrossRef]
  4. Allenby, S.; Chang, W.C.; Megaritis, A.; Wyszynski, M.L. Hydrogen enrichment: A way to maintain combustion stability in a natural gas fuelled engine with exhaust gas recirculation, the potential of fuel reforming. Proc. Inst. Mech. Eng. 2001, 215, 405–417. [Google Scholar] [CrossRef]
  5. Kumar, M.S.; Ramesh, A.; Nagalingam, B. Use of hydrogen to enhance the performance of a vegetable oil fuelled compression ignition engine. Int. J. Hydrogen Energy 2003, 28, 1143–1154. [Google Scholar]
  6. Ji, C.; Wang, S. Effect of hydrogen addition on combustion and emissions performance of a spark ignition gasoline engine at lean conditions. Int. J. Hydrogen Energy 2009, 34, 7823–7834. [Google Scholar] [CrossRef]
  7. Le Anh, T.; Nguyen Duc, K.; Tran Thi Thu, H.; Cao Van, T. Improving Performance and Reducing Pollution Emissions of a Carburetor Gasoline Engine by Adding HHO Gas into the Intake Manifold; SAE Technical Paper 2013-01-0104; SAE International: Bangkok, Thailand, 2013. [Google Scholar]
  8. Bade Shrestha, S.; LeBlanc, G.; Balan, G.; de Souza, M. A Before Treatment Method for Reduction of Emissions in Diesel Engines; SAE Technical Paper Series No. 2000-01-2791; SAE International: Paris, France, 2000. [Google Scholar]
  9. Sogaard, C.; Schramm, J.; Jensen, T.K. Reduction of UHC Emissions from Natural Gas Fired SI-Engine-Production and Application of Steam Reforming Natural Gas; SAE Technical Paper Series No. 2000-01-2823; SAE International: Paris, France, 2000. [Google Scholar]
  10. Kirwan, J.E.; Quader, A.A.; Grieve, M.J. Advanced Engine Management Using On-Board Gasoline Partial Oxidation Reforming for Meeting Super-ULEV (SULEV) Emissions Standards; SAE Technical Paper Series No. 1999-01-2927; SAE International: Costa Mesa, CA, USA, 1999. [Google Scholar]
  11. Tsolakis, A.; Megaritis, A.; Wyszynski, M.L. Effects of reformed EGR on the diesel engine smoke-NOx emissions trade-off. In Proceedings of the 9th Research Symposium 2003, School of Engineering, The University of Birmingham, Birmingham, UK, 2003.
  12. Kratzel, T.; Pantow, E.; Eichert, H. Modeling of hydrogen combustion: Turbulent Jame acceleration and detonation. Int. J. Hydrogen Energy 1996, 21, 407–414. [Google Scholar] [CrossRef]
  13. Vezirogcu, T.N. Hydrogen movement and the next action: Fossil fuel industry and sustainability economics. Int. J. Hydrogen Energy 1997, 22, 551–556. [Google Scholar] [CrossRef]
  14. Vandenborre, H.; Sierens, R. Greenbus: A hydrogen fueled city bus. Int. J. Hydrogen Energy 1996, 21, 521–524. [Google Scholar] [CrossRef]
  15. Ladommatos, N.; Abdelhalim, S.M.; Zhao, H.; Hu, Z. Effects of EGR on Heat Release in Diesel Combustion; SAE Technical Paper Series No. 980184; SAE International: Detroit, MI, USA, 1998. [Google Scholar]
  16. Krumplet, M.; Krause, T.R.; Carter, J.D.; Kopasz, J.P.; Ahmed, S. Fuel Processing for Fuel Cell Systems in Transportation and Portable Power Applications. Catal. Today 2002, 77, 3–16. [Google Scholar] [CrossRef]
  17. Cunha, A.F.; Wu, Y.-J.; Santos, J.C.; Rodrigues, A.E. Sorption Enhanced Steam Reforming of ethanol on Hydrotalcite-like compounds impregnated with active copper. Chem. Eng. Res. Des. 2013, 91, 581–592. [Google Scholar] [CrossRef]
  18. Okal, J.; Zawadzki, M. Catalytic combustion of butane on Ru/γ-Al2O3 catalysts. Appl. Catal. B 2009, 89, 22–32. [Google Scholar] [CrossRef]
  19. Cunha, A.F.; Wu, Y.J.; Santos, J.C.; Rodrigues, A.E. Steam reforming of ethanol on copper catalysts derived from hydrotalcite-like materials. Ind. Eng. Chem. Res. 2012, 51, 13132–13143. [Google Scholar] [CrossRef]
  20. Praveen, K.; Cheekatamarla, C.M. Finnerty, Reforming catalysts for hydrogen generation in fuel cell applications. J. Power Sources 2006, 160, 490–499. [Google Scholar]
  21. Wang, L.; Murata, K.; Inaba, M. Control of the product ratio of CO2/(CO+CO2) and inhibition of catalyst deactivation for steam reforming of gasoline to produce hydrogen. Appl. Catal. B 2004, 48, 243–248. [Google Scholar] [CrossRef]
  22. Wang, L.; Murata, K.; Inaba, M. Steam reforming of gasoline promoted by partial oxidation reaction on novel bimetallic Ni-based catalysts to generate hydrogen for fuel cell-powered automobile applications. J. Power Sources 2005, 145, 707–711. [Google Scholar] [CrossRef]
  23. Wang, L.; Murata, K.; Matsumura, Y.; Inaba, M. Lower-Temperature Catalytic Performance of Bimetallic Ni-Re/Al2O3 Catalyst for Gasoline Reforming to Produce Hydrogen with the Inhibition of Methane Formation. Energy Fuels 2006, 20, 1377–1381. [Google Scholar] [CrossRef]
  24. Wang, L.; Murata1, K.; Inaba, M. Development of novel highly active and sulphur-tolerant catalysts for steam reforming of liquid hydrocarbons to produce hydrogen. Appl. Catal. A 2004, 257, 43–47. [Google Scholar] [CrossRef]
  25. Zhang, J.; Wang, Y.; Maa, R.; Wu, D. Characterization of alumina-supported Ni and Ni-Pd catalysts for partial oxidation and steam reforming of hydrocarbons. Appl. Catal. A: 2003, 243, 251–259. [Google Scholar] [CrossRef]
  26. Trimm, D.L.; Adesina, A.A.; Cant, N.W. The conversion of gasoline to hydrogen for on-board vehicle applications. Catal. Today 2004, 17, 93–95. [Google Scholar] [CrossRef]
  27. Navarro, R.M.; Álvarez-Galván, M.C.A.; Rosa, F.; Fierro, J.L.G. Hydrogen production by oxidative reforming of hexadecane over Ni and Pt catalysts supported on Ce/La-doped Al2O3. Appl. Catal. A 2006, 297, 60–72. [Google Scholar] [CrossRef]
  28. Wang, X.; Pan, X.; Lin, R.; Kou, S.; Zou, W.; Ma, J.X. Steam reforming of dimethyl ether over Cu–Ni/γ-Al2O3 bi-functional catalyst prepared by deposition–precipitation method. Int. J. Hydrogen Energy 2010, 35, 4060–4068. [Google Scholar] [CrossRef]
  29. Vizcaino, A.J.; Carrero, A.; Calles, J.A. Hydrogen production by ethanol steam reforming over Cu-Ni supported catalysts. Int. J. Hydrogen Energy 2007, 32, 1450–1461. [Google Scholar] [CrossRef]
  30. Choi, Y.H.; Lee, W.Y. Effect of second metals and Cu content on catalyst performance of Ni-Cu/SiO2 in the hydrodechlorination of 1,1,2-trichloroethane into vinyl chloride monomer. J. Mol. Catal. A 2001, 174, 193–204. [Google Scholar] [CrossRef]
  31. Huang, T.; Yu, T.; Jhao, S. Weighting Variation of Water-Gas Shift in Steam Reforming of Methane over Supported Ni and Ni-Cu Catalysts. Ind. Eng. Chem. Res. 2006, 45, 150–156. [Google Scholar] [CrossRef]
  32. Li, Y.; Fu, Q.; Flytzani-Stephanopoulos, M. Low-temperature water-gas shift reaction over Cu- and Ni-loaded cerium oxide catalysts. Appl. Catal. B 2000, 27, 179–191. [Google Scholar] [CrossRef]
  33. Cunha, A.F.; Wu, Y.J.; Alvarado, F.A.D.; Santos, J.C.; Vaidya, P.D.; Rodrigues, A.E. Steam reforming of ethanol on a Ni/Al2O3 catalyst coupled with a hydrotalcite-like sorbent in a multilayer pattern for CO2 uptake. Can. J. Chem. Eng. 2012, 90, 1514–1526. [Google Scholar] [CrossRef]
  34. Brito, J.; Laine, J.; Pratt, K.C. Temperature programmed reduction of Ni-Mo oxides. J. Mater. Sci. 1989, 24, 425–431. [Google Scholar] [CrossRef]
  35. Cordeo, R.L.; Agudo, A.L. Effect of water extraction on the surface properties of Mo/Al2O3 and NiMo/Al2O3 hydrotreating catalysts. Appl. Catal. A 2000, 202, 23–35. [Google Scholar] [CrossRef]
  36. Hou, Z.Y.; Yokota, O.; Tanaka, T.; Yashima, T. Characterization of Ca-promoted Ni/γ-Al2O3 catalyst for CH4 reforming with CO2. Appl. Catal. A 2003. [Google Scholar] [CrossRef]
  37. Hu, C.W.; Yao, J.; Yang, H.Q.; Chen, Y.; Tian, A.M. On the inhomogeneity of low nickel loading methanation catalyst. J. Catal. 1997, 166, 1–7. [Google Scholar] [CrossRef]
  38. Rynkowski, J.M.; Paryjczak, T.; Lenik, M. On the nature of oxidic nickel phases in NiO/γ-Al2O3 catalysts. Appl. Catal. A 1993, 106, 73–82. [Google Scholar] [CrossRef]
  39. Fierro, G.; Jacono, M.L.; Inversi, M.; Porta, P.; Lavecchia, R.; Cioci, F. A Study of Anomalous Temperature-Programmed Reduction Profiles of Cu2O, CuO, and CuO-ZnO Catalysts. J. Catal. 1994, 148, 709–721. [Google Scholar] [CrossRef]
  40. Luo, M.-F.; Ma, J.-M.; Lu, J.-Q.; Song, Y.-P.; Wang, Y.-J. High-surface area CuO-CeO2 catalysts prepared by a surfactant-templated method for low-temperature CO oxidation. J. Catal. 2007, 246, 52–59. [Google Scholar] [CrossRef]
  41. Kim, J.Y.; Rodriguez, J.A.; Hanson, J.C.; Frenkel, A.I.; Lee, P.L. Reduction of CuO and Cu2O with H2: H Embedding and Kinetic Effects in the Formation of Suboxides. J. Am. Chem. Soc. 2003, 125, 10684–10692. [Google Scholar] [CrossRef] [PubMed]
  42. Hierl, R.; Knozinger, H.; Urbach, H. Surface properties and reduction behavior of calcined CuO/Al2O3 and CuO-NiO/Al2O3 catalyst. J. Catal. 1981, 69, 475–486. [Google Scholar] [CrossRef]
  43. Gonzalez, O.; Lujano, J.; Pietri, E.; Goldwasser, M.R. New Co-Ni catalyst systems used for methane dry reforming based on supported catalysts over an INT-MM1 mesoporous material and a perovskite-like oxide precursor LaCo0.4Ni0.6O3. Catal. Today 2005, 107–108, 436–443. [Google Scholar] [CrossRef]
  44. Wang, Z.; Liu, Q.; Yu, J.; Wu, T.; Wang, G. Surface structure and catalytic behavior of silica-supported copper catalysts prepared by impregnation and sol-gel methods. Appl. Catal. A 2003, 239, 87–94. [Google Scholar] [CrossRef]
  45. Kim, S.K.; Kim, K.H.; Ihm, S.K. The characteristics of wet air oxidation of phenol over CuO/Al2O3 catalysts: Effect of copper loading. Chemosphere 2007, 68, 287–292. [Google Scholar] [CrossRef] [PubMed]
  46. Ertl, G.; Knozinger, H.; Weitkamp, J. Handbook of Heterogeneous Catalysis; VCH: Weinheim, Germany, 1997; p. 274. [Google Scholar]
  47. Borowiecki, T.; Gac, W.; Denis, A. Effects of small MoO3 additions on the properties of nickel catalysts for the steam reforming of hydrocarbons III. Reduction of Ni-Mo/Al2O3 catalysts. Appl. Catal. A 2004, 270, 27–36. [Google Scholar] [CrossRef]
  48. Koo, K.Y.; Roh, H.-S.; Jung, U.H.; Yoon, W.L. CeO2 Promoted Ni/Al2O3 Catalyst in Combined Steam and Carbon Dioxide Reforming of Methane for Gas to Liquid (GTL) Process. Catal. Lett. 2009, 130, 217. [Google Scholar] [CrossRef]
  49. Smolakova, L.; Kout, M.; Koudelkova, E.; Capek, L. Effect of Calcination Temperature on the Structure and Catalytic Performance of the Ni/Al2O3 and Ni-Ce/Al2O3 Catalysts in Oxidative Dehydrogenation of Ethane. Ind. Eng. Chem. Res. 2015, 54, 12730–12740. [Google Scholar] [CrossRef]
  50. Biniwale, R.B.; Kariya Masaru Ichikawa, N. Production of hydrogen-rich gas via reforming of iso-octane over Ni-Mn and Rh-Ce bimetallic catalysts using spray pulsed reactor. Catal. Lett. 2005, 100, 17–25. [Google Scholar] [CrossRef]
  51. Savage, P.E. Mechanisms and kinetics models for hydrocarbon pyrolysis. J. Anal. Appl. Pyrolysis 2000, 54, 109–126. [Google Scholar] [CrossRef]
  52. Ming, Q.; Healey, T.; Allen, L.; Irving, P. Steam reforming of hydrocarbon fuels. Catal. Today 2002, 77, 51–64. [Google Scholar] [CrossRef]
  53. Marino, F.; Boveri, M.; Baronetti, G.; Laborde, M. Hydrogen production from steam reforming of bioethanol using Cu/Ni/K/γ-Al2O3 catalysts. Effect of Ni. Int. J. Hydrogen Energy 2001, 26, 665–668. [Google Scholar] [CrossRef]
  54. Al-Musa, A.; Al-Saleh, M.; Ioakeimidis, Z.C.; Ouzounidou, M.; Yentekakis, I.V.; Konsolakis, M.; Marnellos, G.E. Hydrogen production by iso-octane steam reforming over Cu catalysts supported on rare earth oxides (REOs). Int. J. Hydrogen Energy 2014, 39, 1350–1363. [Google Scholar] [CrossRef]
  55. Wang, L.; Murata, K.; Inaba, M. Highly efficient conversion of gasoline into hydrogen on Al2O3-supported Ni-based catalysts: Catalyst stability enhancement by modification with W. Appl. Catal. A 2009, 358, 264–268. [Google Scholar] [CrossRef]
  56. Youn, M.H.; Seo, J.G.; Kim, P.; Song, I.K. Role and effect of molybdenum on the performance of Ni-Mo/Al2O3 catalysts in the hydrogen production by auto-thermal reforming of ethanol. J. Mol. Catal. A 2007, 261, 276–281. [Google Scholar] [CrossRef]
  57. Kawabata, T.; Matsuoka, H.; Shishido, T.; Li, D.L.; Tian, Y.; Sano, T.; Takehira, K. Steam reforming of dimethyl ether over ZSM-5 coupled with Cu/ZnO/Al2O3 catalyst prepared by homogeneous precipitation. Appl. Catal. A 2006, 308, 82–90. [Google Scholar] [CrossRef]
Figure 1. X-ray diffractometry (XRD) patterns of Ni0.5-Cu0.5/Al2O3 catalysts with various Ni-Cu content ratios: (a) 36 wt. %; (b) 18 wt. %; (c) 6 wt. %; (d) 0 wt. %.
Catalysts 06 00045 g001
Figure 2. XRD patterns of 18 wt. % Ni1−x-Cux /Al2O3 (x = (a) 1, (b) 0.7, (c) 0.5, (d) 0.3, (e) 0.9, (f) 0).
Catalysts 06 00045 g002
Figure 3. XRD patterns of different catalysts: (a) 18 wt. % Ni0.5-Cu0.5/Al2O3, (b) 18 wt. % Ni0.5-Ce0.5/Al2O3, (c) 18 wt. % Ni0.5-Mo0.5/Al2O3.
Catalysts 06 00045 g003
Figure 4. Scanning electron microscopy (SEM) micrograph of Ni0.5-Cu0.5/Al2O3 catalysts with various Ni-Cu content ratios: (a) 6 wt. % Ni0.5-Cu0.5/γ-Al2O3, (b) 18 wt. % Ni0.5-Cu0.5/γ-Al2O3, (c) 36 wt. % Ni0.5-Cu0.5/γ-Al2O3.
Catalysts 06 00045 g004
Figure 5. SEM and energy dispersive X-ray (EDX) mapping of 18 wt. % Ni0.5-Cu0.5/γ-Al2O3 catalyst.
Catalysts 06 00045 g005
Figure 6. Temperature program reduction (TPR) profiles of 18 wt. % Ni1−x-Cux/Al2O3 (x = (a) 0, (b) 0.1, (c) 0.3, (d) 0.5, (e) 0.7, (f) 1.
Catalysts 06 00045 g006
Figure 7. TPR profiles of other catalysts; (a) 18 wt. % Ni0.5-Mo0.5/γ-Al2O3; (b) 18 wt. % Ni0.5-Ce0.5/γ-Al2O3; (c) 36 wt. % Ni0.5-Cu0.5/γ-Al2O3; (d) 18 wt. % Ni0.5-Cu0.5/γ-Al2O3; (e) 6 wt. % Ni0.5-Cu0.5/γ-Al2O3.
Catalysts 06 00045 g007
Figure 8. Effect of steam/carbon (S/C) molar ratios on product selectivity over 18 wt. % Ni0.5-Cu0.5/γ-Al2O3 catalysts at 550 °C, N2 = 15 cm3/min; iso-octane feed rate was 0.03 g/min (SV = 1.21 h−1).
Catalysts 06 00045 g008
Figure 9. Effect of temperature on conversion and product selectivity over 18 wt. % Ni0.5-Cu0.5/γ-Al2O3 catalyst, N2 = 15 cm3/min; iso-octane feed rate was 0.03 g/min; S/C molar ratio: 0.9.
Catalysts 06 00045 g009
Figure 10. Effect of Ni0.5-Cu0.5/Al2O3 catalysts on conversion and product selectivity with varying Ni0.5-Cu0.5/Al2O3 ratios: T = 550 °C; N2 = 15 cm3/min, iso-octane feed rate was 0.03 g/min; S/C molar ratio: 0.9.
Catalysts 06 00045 g010
Figure 11. Effect of Cu molar ratio on conversion and product selectivity over 18 wt. % Cu-Ni/Al2O3 catalyst; T = 550 °C, N2 = 15 cm3/min; iso-octane feed rate was 0.03 g/min; S/C molar ratio: 0.9.
Catalysts 06 00045 g011
Figure 12. Durability testing of different catalysts in steam reforming for 30 h, T = 550 °C, N2 = 15 cm3/min; iso-octane feed rate was 0.03 g/min; S/C molar ratio: 0.9.
Catalysts 06 00045 g012
Figure 13. SEM and EDX mapping of 18 wt. % Ni0.5-Cu0.5/γ-Al2O3 catalyst after durability testing for 30 h at 550 °C, N2 = 15 cm3/min; iso-octane feed rate was 0.03 g/min; S/C molar ratio: 0.9.
Catalysts 06 00045 g013
Table 1. Surface area and pore structure of different catalysts.
SampleSBET (m2/g)Total Pore Volume (cm3/g)Average Pore Diameter (nm)
18 wt. % Ni/γ-Al2O3152.80.222.2
18wt. %Ni0.9-Cu0.1/γ-Al2O3153.10.222.3
18wt. %Ni0.7-Cu0.3/γ-Al2O3154.40.233.1
18wt. %Ni0.5-Cu0.5/γ-Al2O3156.80.244.6
18wt. %Ni0.3-Cu0.7/γ-Al2O3160.40.285.1
18 wt. % Cu/γ-Al2O3165.90.295.8
18 wt. % Ni0.5-Mo0.5/γ-Al2O3154.70.233.1
18 wt. % Ni0.5-Ce0.5/γ-Al2O3171.40.316.6
6wt. %Ni0.5-Cu0.5/γ-Al2O3197.20.357.4
36 wt. % Ni0.5-Cu0.5/γ-Al2O3105.40.171.6
Table 2. Summary of H2-Temperature program reduction (TPR) of different catalysts.
SampleTemperature (°C)H2 Consumption (mmol·g−1)
T°C (Initial)Peak IPeak IIPeak III
18 wt. % Ni/γ-Al2O3400--6001.67
18 wt. % Ni0.9-Cu0.1/γ-Al2O3208260-5862.23
18 wt. % Ni0.7-Cu0.3/γ-Al2O3220262-5683.31
18 wt. % Ni0.5-Cu0.5/γ-Al2O31852582955144.75
18 wt. % Ni0.3-Cu0.7/γ-Al2O31802583004924.83
18 wt. % Cu/γ-Al2O3185295-4744.39
18 wt. % Ni0.5-Mo0.5/γ-Al2O3425-532-3.68
18 wt. % Ni0.5-Ce0.5/γ-Al2O3350-535-3.73
6 wt. % Ni0.5-Cu0.5/γ-Al2O3210262316-2.84
36 wt. % Ni0.5-Cu0.5/γ-Al2O32052583125143.81
Table 3. Conversion and product selectivity for steam reforming of iso-octane on Al2O3 supported catalysts, T = 550 °C, N2 = 15 cm3/min; iso-octane feed rate was 0.03 g/min; S/C molar ratio: 0.9.
CatalystsConversion (%)Product Selectivity (%)
iso-OctaneWaterH2COCO2CH4
18 wt. % Ni0.5-Cu0.5/γ-Al2O342.612.270.67.415.36.7
18 wt. % Ni0.5-Mo0.5/γ-Al2O331.79.771.97.115.65.4
18 wt. % Ni0.5-Ce0.5/γ-Al2O328.38.272.07.616.14.4

