Article

Optimization of Solar Photocatalytic Degradation of Chloroxylenol Using TiO2, Er3+/TiO2, and Ni2+/TiO2 via the Taguchi Orthogonal Array Technique

by
Ahmed J. Mohammed
1,
Abdul Amir H. Kadhum
1,
Muneer M. Ba-Abbad
1 and
Ahmed A. Al-Amiery
2,*
1
Department of Chemical and Process Engineering, Faculty of Engineering and Built Environment, Universiti Kebangsaan Malaysia, Bangi, Selangor 43600, Malaysia
2
Environmental Research Center, University of Technology, Baghdad 10001, Iraq
*
Author to whom correspondence should be addressed.
Catalysts 2016, 6(10), 163; https://doi.org/10.3390/catal6100163
Submission received: 22 August 2016 / Revised: 6 October 2016 / Accepted: 11 October 2016 / Published: 20 October 2016

Abstract

:
In this study, the optical properties of a TiO2 photocatalyst were enhanced with various impregnations of Er3+ and Ni2+ separately, using the impregnation method as photocatalysts for the direct solar photolysis degradation of chloroxylenol. The synthesized Er3+/TiO2 and Ni2+/TiO2 catalysts were characterized using X-ray diffraction (XRD), field emission scanning electron microscopy (FESEM), energy dispersive X-ray (EDX), metal mapping, and ultraviolet visible (UV–Vis) spectroscopy. The results showed that the Er3+/TiO2 and Ni2+/TiO2 nano-particles have the same structures of TiO2 nano-particles with little difference in particle size. The Er3+ and Ni2+ ions were well-distributed on the TiO2 surface, and it was found that the maximum band gap decreased from 3.13 eV for intrinsic TiO2 to 2.63 eV at 1.8 wt % Er3+/TiO2 and to 2.47 eV at 0.6 wt % for Ni2+/TiO2. The initial concentration of chloroxylenol, catalyst loading, and pH of the solution are the most important factors affecting the solar photocatalytic degradation efficiency that were optimized using Design Expert software (version 6.0.10, Minneapolis, MN, USA, 2003). The results showed that the optimal conditions for chloroxylenol degradation include a pH of 4, TiO2 loading at 3 g/L, and a chloroxylenol concentration of 50 mg/L. These conditions resulted in a degradation efficiency of 90.40% after 60 min of direct solar irradiation, wherein the solar energy recorded during a clear sunny day is 1000 W/m2. However, some experiments were conducted on a semi-cloudy day to cover all weather stated and to study the degradation kinetics. During semi-cloudy day experiments, using Er3+/TiO2 and Ni2+/TiO2 with a solar irradiation activity of 600 W/m2 for a 60 min exposure at optimal conditions increased the degradation efficiency from 68.28% for intrinsic TiO2 to 82.38% for Er3+/TiO2 and 80.70% for Ni2+/TiO2.

1. Introduction

One of the most pervasive problems that people face today is the effluent of toxic compounds in water sources. One of these compounds is chloroxylenol (4-chloro-3,5-dimethylphenol), which is widely used as an antibacterial agent. It is a phenolic derivative used in many product formulations for use as an antiseptic and disinfectant [1]. Chloroxylenol has unique antiseptic properties and is a very effective antimicrobial agent against many germs that cause infections since it disrupts the proton gradient of the cell membrane necessary for the bacteria to produce adenosine triphosphate (ATP). The ATP deficiency results in cell death due to starvation [2]. Chloroxylenol also oxidizes the structure of the cell and impedes the nutrients from passing through the cell wall, causing a loss of normal enzyme activity leading to cell death. Furthermore, chloroxylenol also changes the permeability of the cell walls of microorganisms and disrupts its biological processes [3]. Owing to its antimicrobial properties, chloroxylenol is widely used in various applications and is present in many products and formulations. Due to the large use of products that contain chloroxylenol in their formulations, it can be discharged directly or via urban sewage systems into aquatic systems. Chloroxylenol, as a biocide, represents a potential hazard and has adverse impacts on human health and the environment [4,5]. Due to this impact, efforts are focused on the removal of this compound from aqueous solutions by coagulation [6], adsorption [7], oxidation [8], and biodegradation [9]. All of these methods have significant limitations and disadvantages. Solar photocatalytic oxidation is a promising method because of the low cost of the energy and most of the pollutants can be completely mineralized to CO2 with suitable catalysts. TiO2 is one of the best photocatalysts because it is highly photosensitive, non-toxic, has strong oxidizing power and long-term stability. One of the disadvantages of TiO2 nano-particles (NPs) is their high band gap energy (3.2 eV). Hence, the doping of TiO2 NPs with metal (rare earth) ions, wherein these metal ions will become concentrated on the surface of the TiO2 NPs, is one way to decrease the band gap energy and enhance the photoactivity of the TiO2 NPs [10]. The absorption of visible light by TiO2 becomes enhanced because visible light makes up approximately 43% of the solar spectrum as its primary source of energy [11]. However, many researchers have doped TiO2 with rare earth (RE) and transition metal ions for specific applications in the ultraviolet (UV) and visible frequency ranges [12,13]. A design of experiment (DOE) is an effective method to reduce the total cost of the process by minimizing the number of experimental runs. Many designs, such as the Box–Behnken, Taguchi, D-optimal, and central composite designs, have been used to improve the efficiency of degradation [14]. Recently, the Taguchi method has been reported as the ideal method for the optimization process, which is a simple and easy tool that provides effective solutions [15]. Fewer experimental runs with a higher performance value of the response close to the target value have been obtained by the Taguchi method compared with other methods [16]. To optimize any process using the optimization design, it is necessary to identify all factors that have the highest effect on an existing process. When the Taguchi method is applied, the following two points have to occur: (1) clearly define a set of orthogonal arrays (OA), each of which can be used for many experimental situations; and (2) devise a standard method for the analysis of the results [17,18,19]. Optimization via the Taguchi method can significantly reduce the time required for experiments, which is used to show the effects of multiple factors on performance and determine which factor has more or less influence on the process [20]. In the Taguchi method, after the generation of the optimum conditions, the experimental results should be confirmed and compared with the prediction results [21]. As a continuation of previous studies [22,23,24,25,26,27,28] on nanomaterials and catalysts, herein, we report the solar photocatalytic degradation of chloroxylenol that was optimized by the DOE Taguchi OA using TiO2 NPs, as well as Er3+/TiO2 and Ni2+/TiO2 NPs prepared by the impregnation method.

2. Results and Discussion

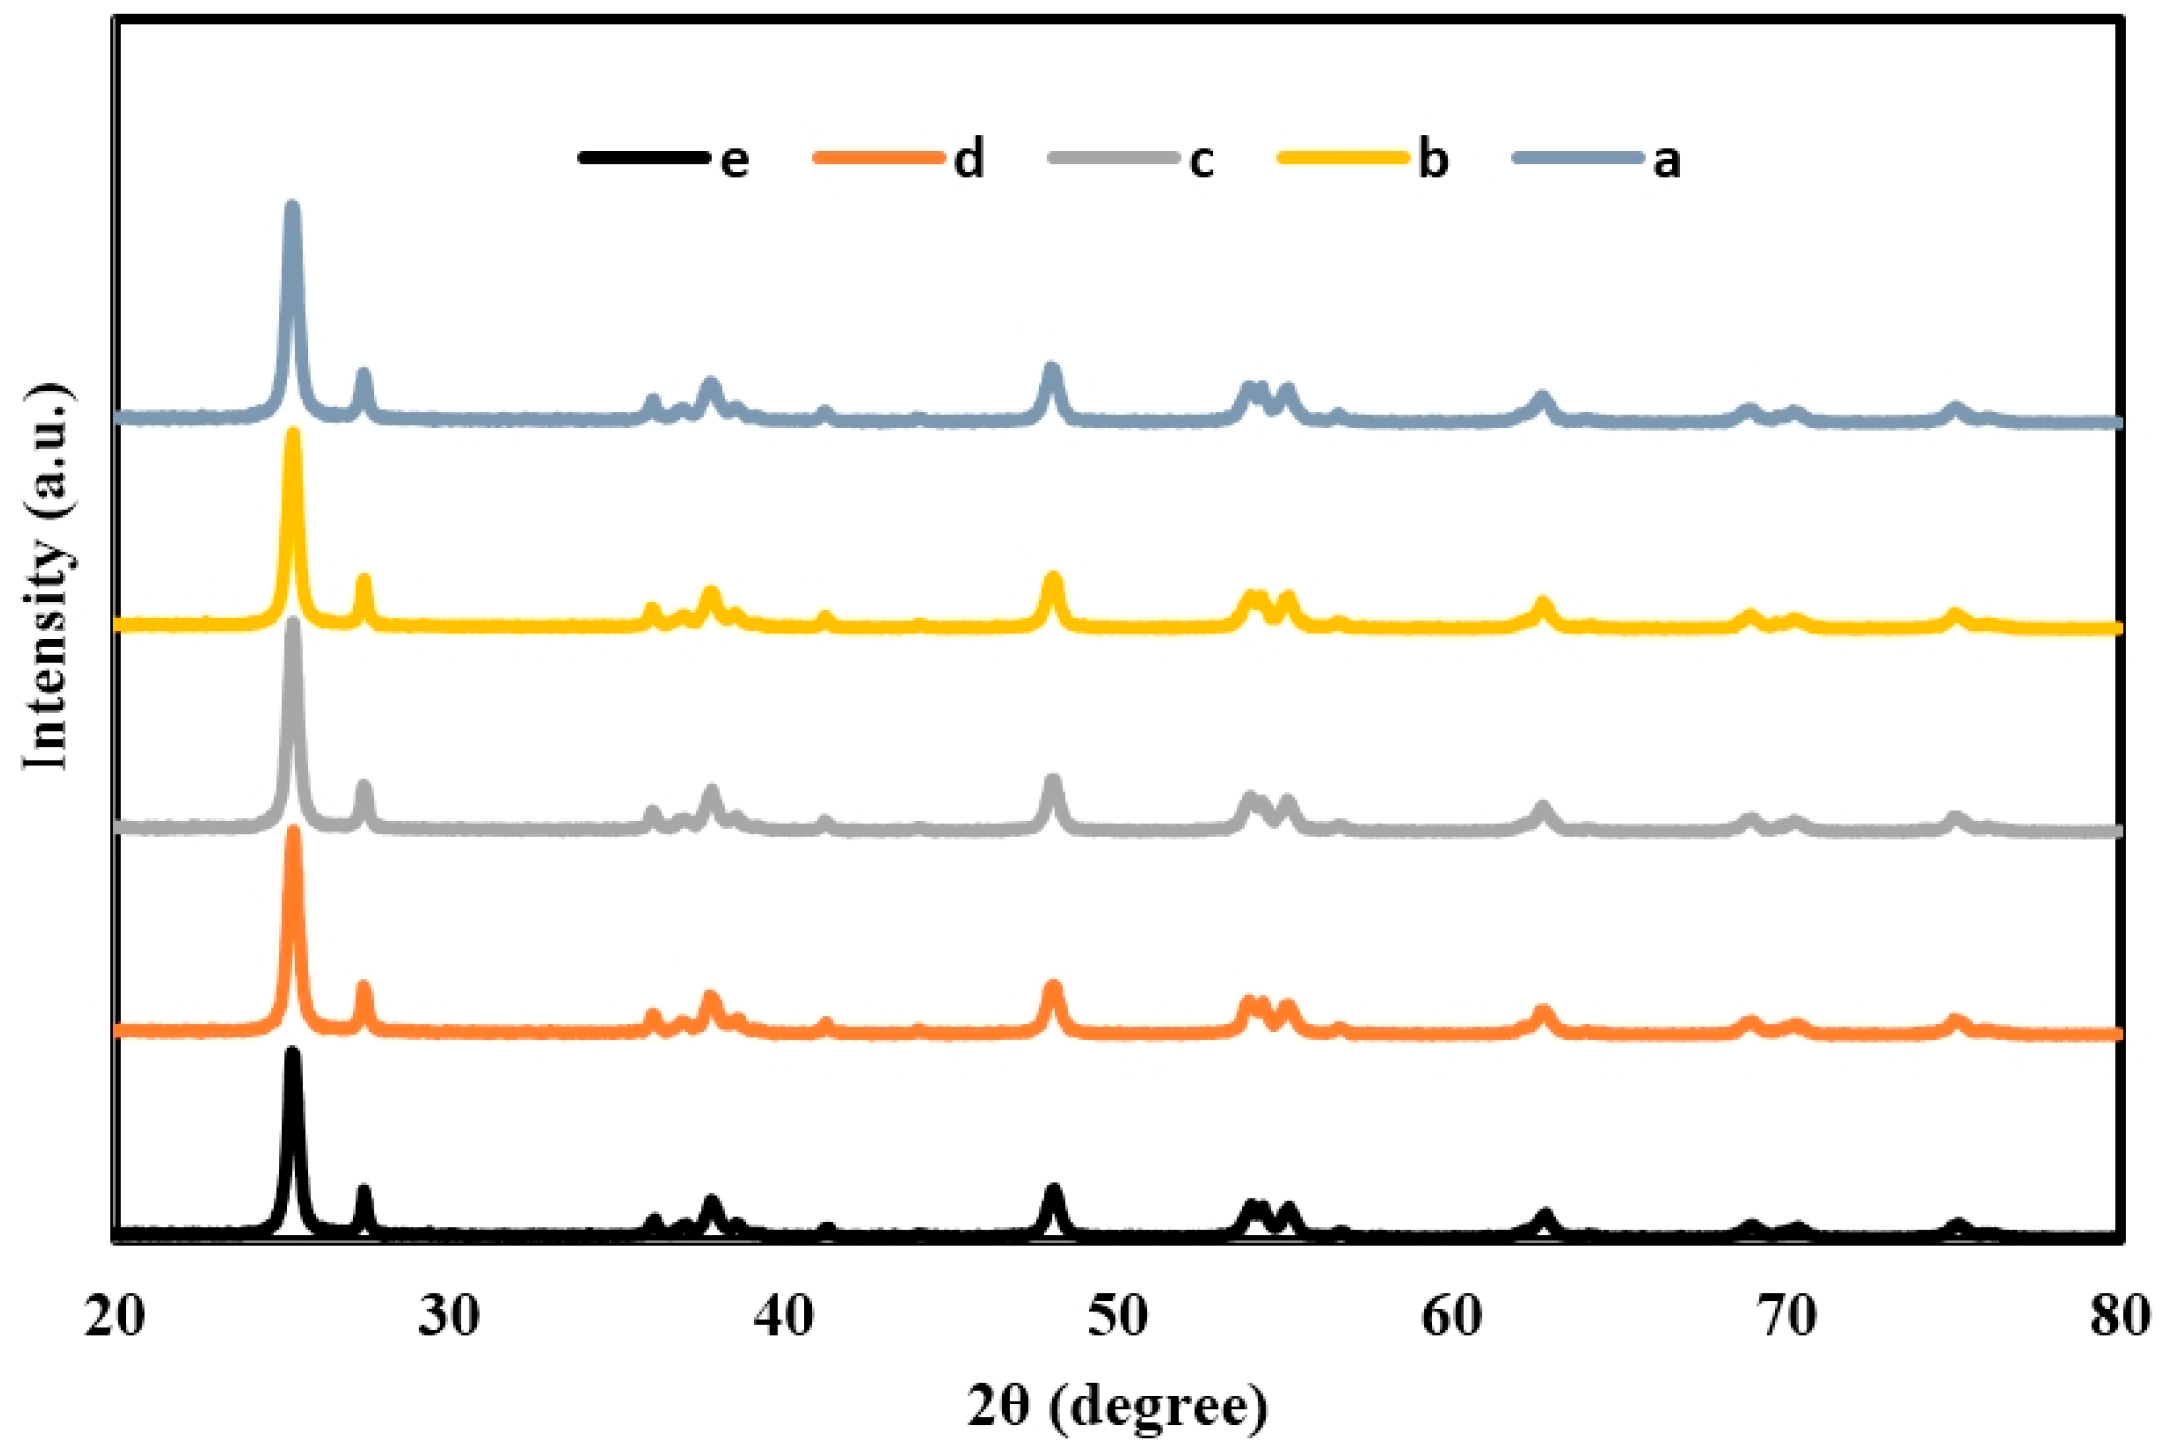
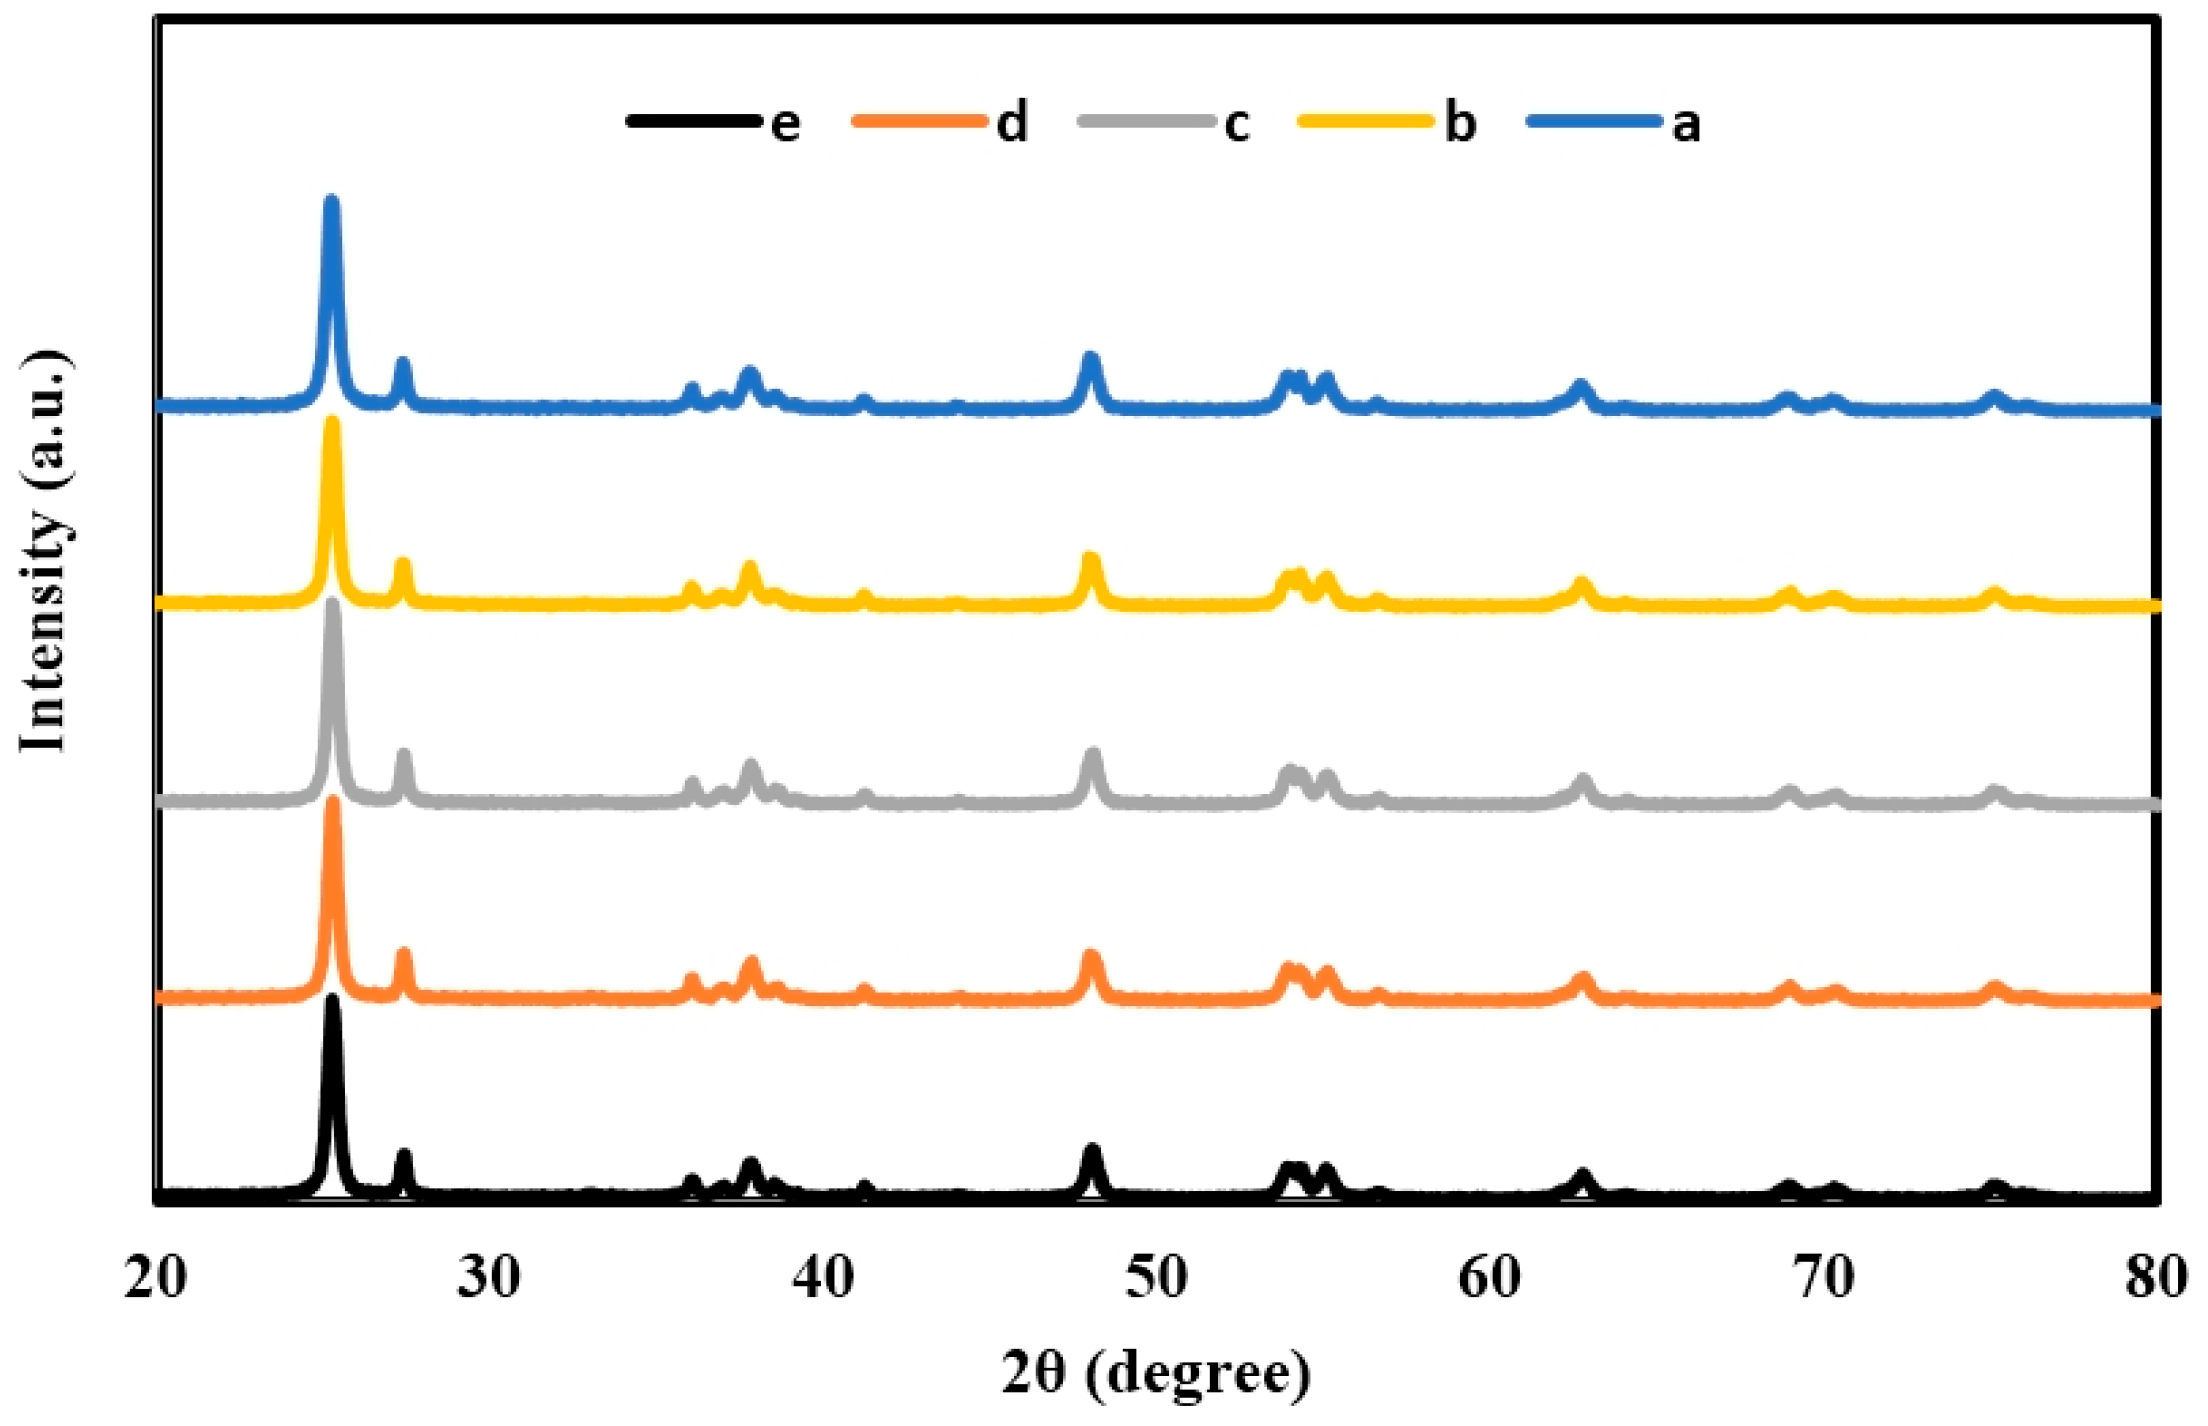
2.1. X-ray Diffraction (XRD) of TiO2, Er3+/TiO2 and Ni2+/TiO2 NPs

All prepared samples were subjected to X-ray diffraction (XRD) to investigate the type of crystallinity of the used materials and to determine if any change that occurred during the impregnation of the TiO2 NPs with Er3+ and Ni2+ ions. The XRD scanning of the Er3+/TiO2 and Ni2+/TiO2 NPs is, respectively presented in Figure 1 and Figure 2. The peaks that appear for both the anatase and rutile types (JCPDS File No. 21-1276) of TiO2 [29,30] are clear. These patterns show that the structure and phase compositions of the TiO2 NPs were not affected by impregnation with Er3+ and Ni2+ ions. Furthermore, the intensity of all TiO2 peaks decreased, which means that the crystal structure of the TiO2 NPs is impregnated with Er3+ and Ni2+ ions.
Table 1 and Table 2 show the values of the intensity for each of the peaks. Diffraction spectra of the Er3+/TiO2 and Ni2+/TiO2 NPs samples did not indicate the presence of Er or Ni. This result can most likely be attributed to the favorable dispersion of Er3+ and Ni2+ in the TiO2 structural lattice [31].
The catalyst crystallite size D was determined according to Debye–Scherer equation (Equation (1)):
D = K λ β   c o s θ
where K is the Scherer constant (K = 0.89), λ is the incident X-ray wavelength, β is the peak width at half maximum, and θ is the Bragg diffraction angle. The data of the catalyst crystallite size is presented in Table 3 for TiO2 with several wt % of Er3+ and Ni2+. It is observable that there is a small increase in particle size as impregnation increases for Er3+/TiO2 and Ni2+/TiO2 samples.

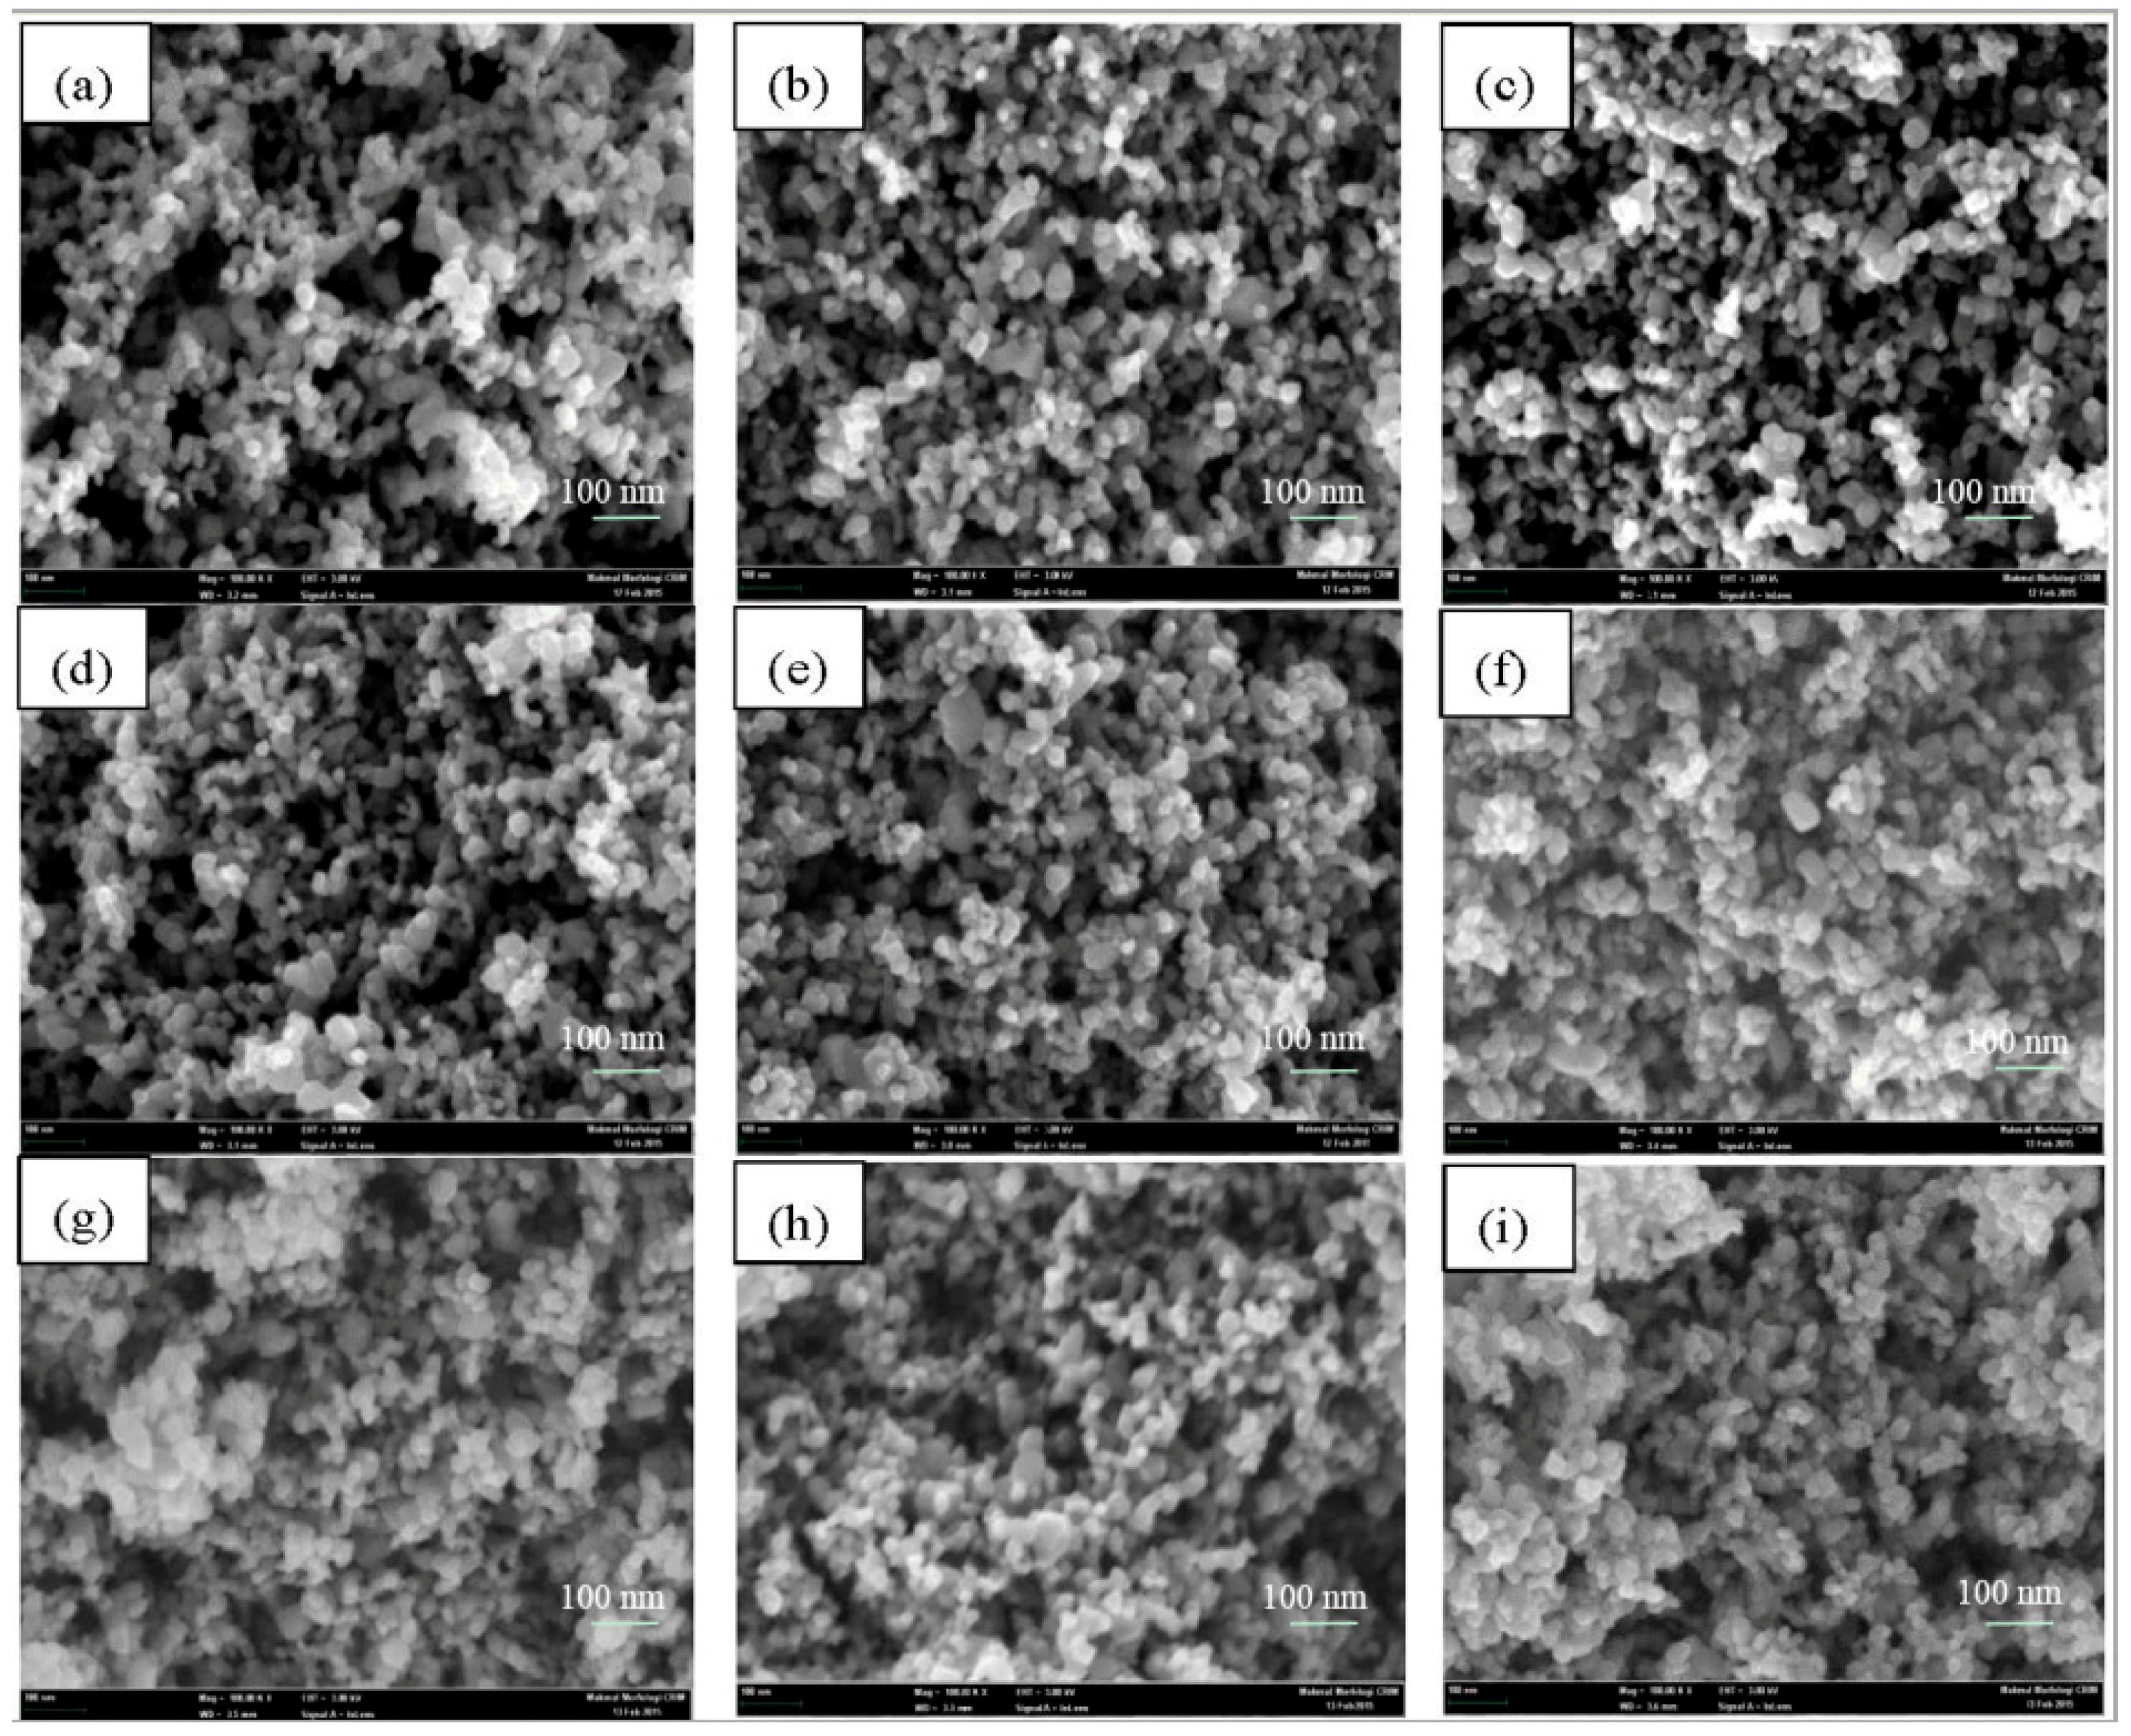
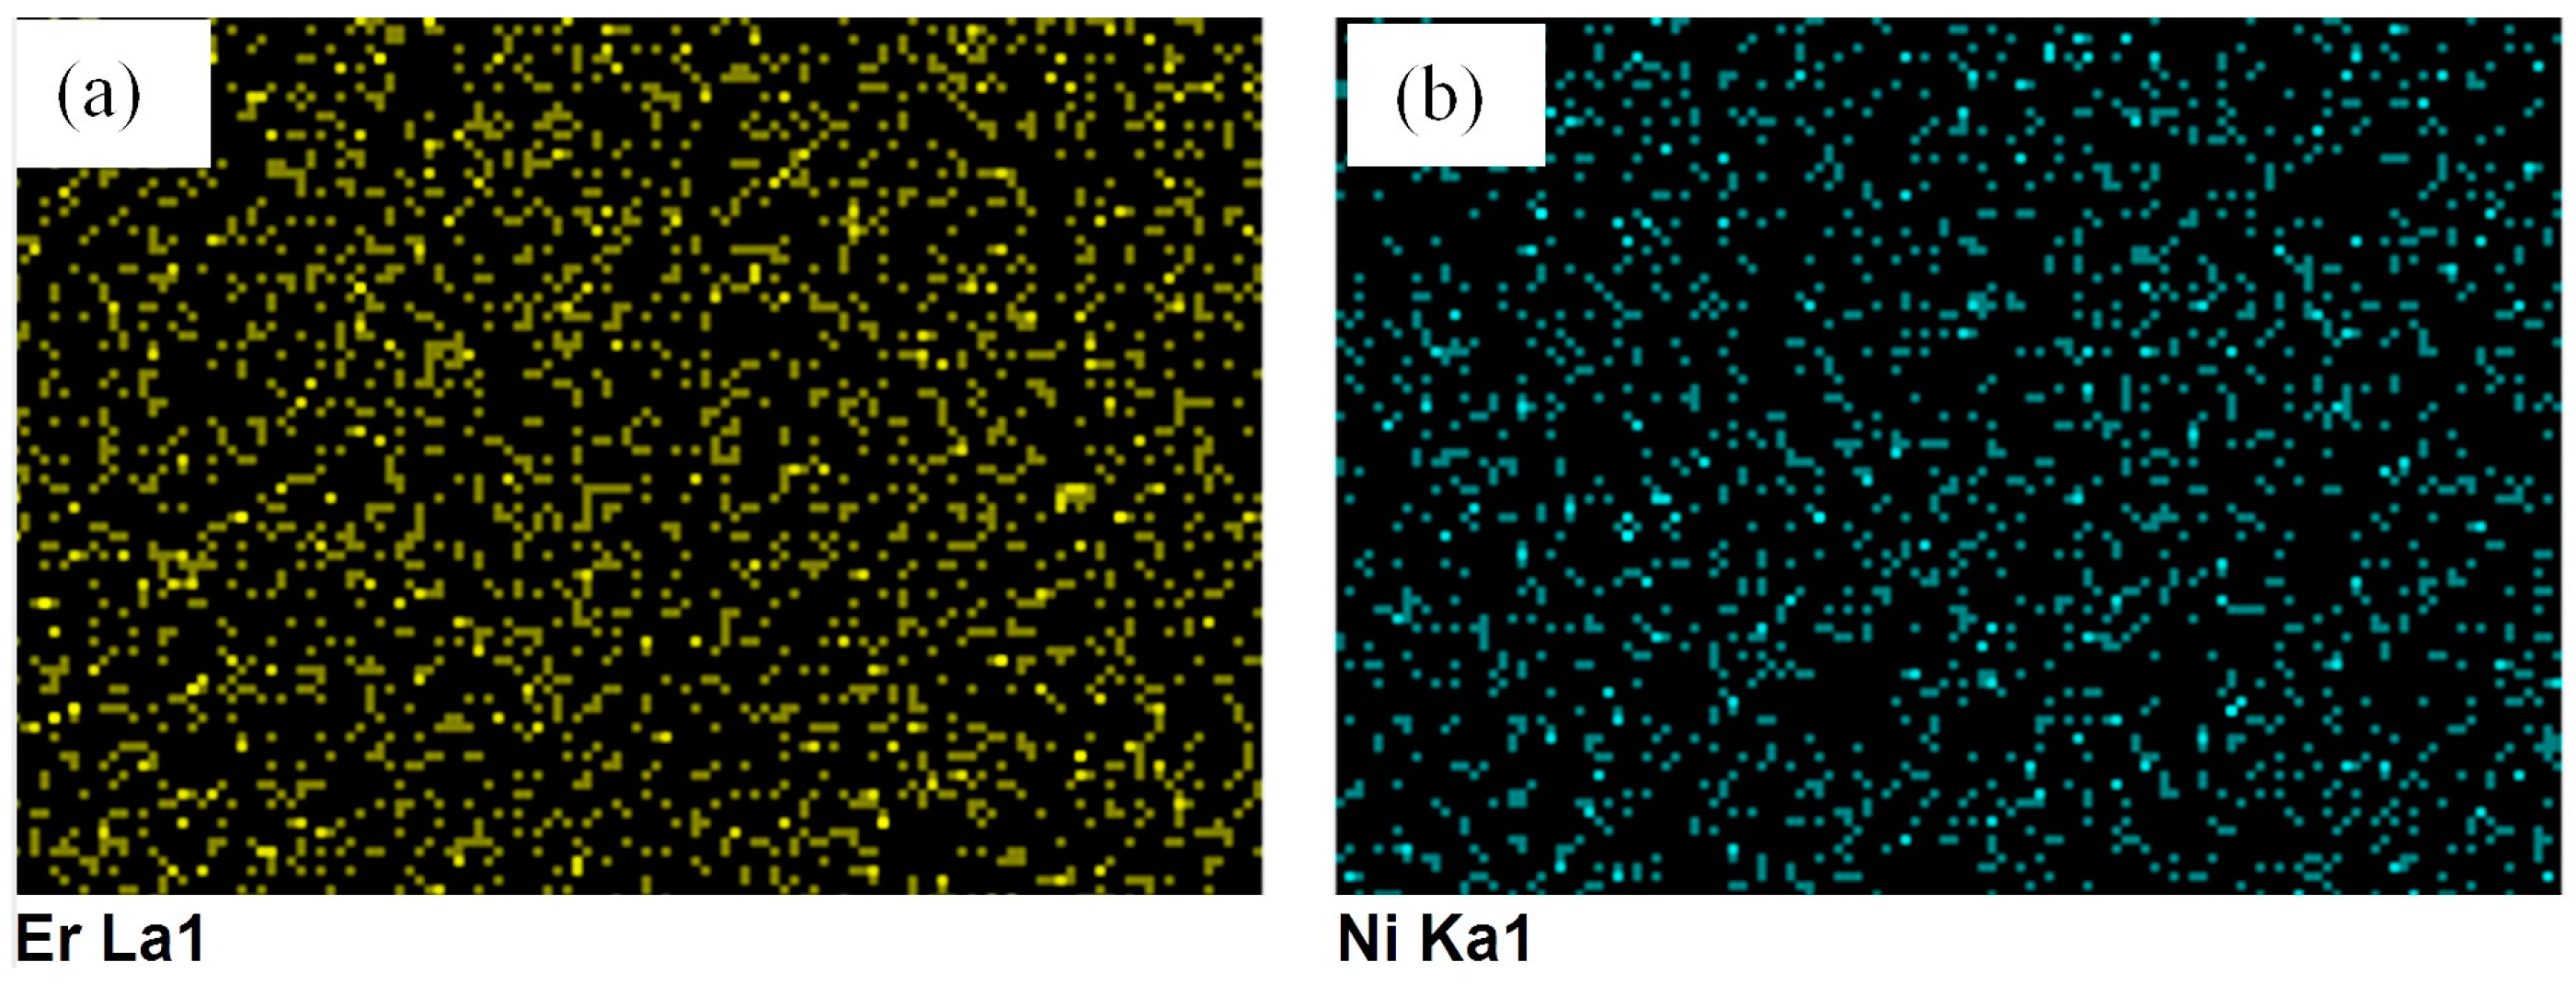
2.2. Catalyst Surface Morphology of TiO2, Er3+/TiO2 and Ni2+/TiO2 NPs

The morphologies of the Er3+/TiO2 and Ni2+/TiO2 NPs were investigated using field emission scanning electron microscopy (FESEM), energy dispersive X-ray (EDX), and metal mapping. The FESEM images are shown in Figure 3. The images revealed that the shape of the particles are mostly spherical, and less agglomeration was observed in the Er3+/TiO2 sample than the Ni2+/TiO2 sample.
EDX analysis was conducted on the Er3+/TiO2 and Ni2+/TiO2 samples to investigate the presence of Er and Ni on the TiO2 surface. The results of the EDX spectra are shown in Figure 4 and show that the Er and Ni are present in each of their respective samples. Additionally, the EDX spectral data provided the wt % of the Er and Ni content in the samples, and the results are summarized in Table 4. These results indicate that there is good agreement between the calculated and actual content of Er and Ni. Metal mapping tests were conducted to investigate the dispersion of Er and Ni on the TiO2 surface. The results are shown in Figure 5 and reveal a good distribution of Er and Ni on the TiO2 NPs in each of the prepared samples.

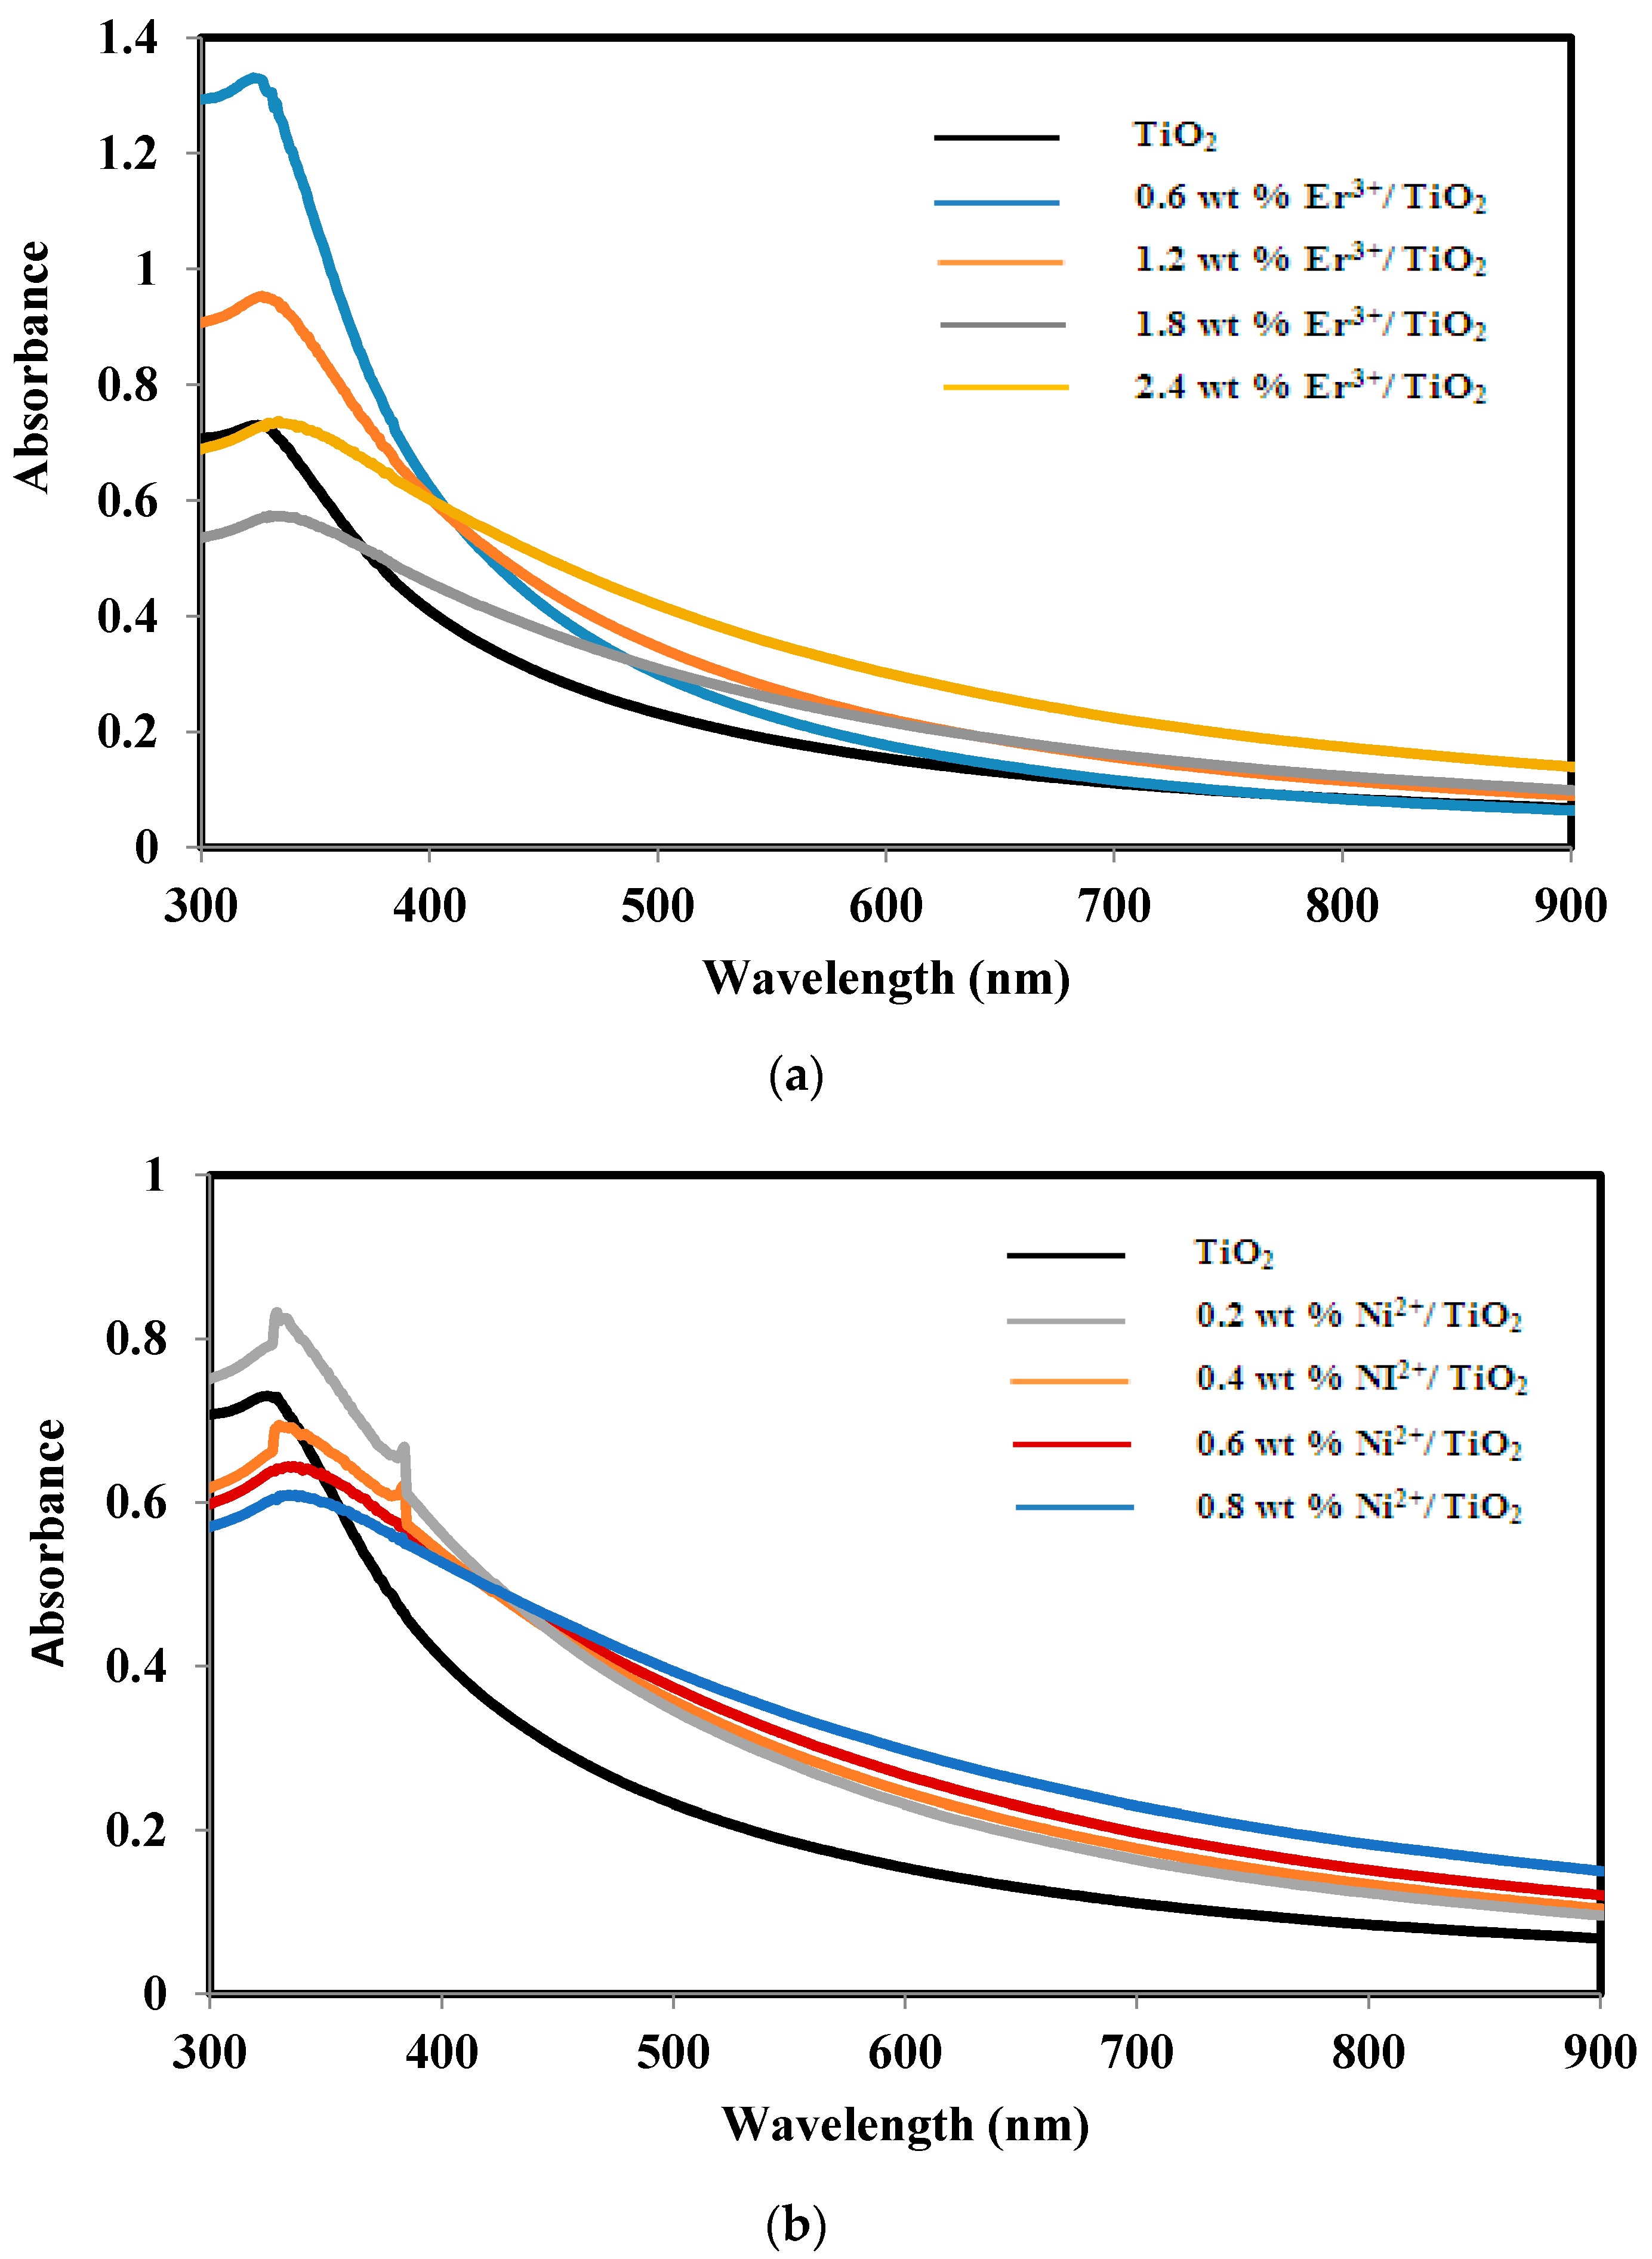
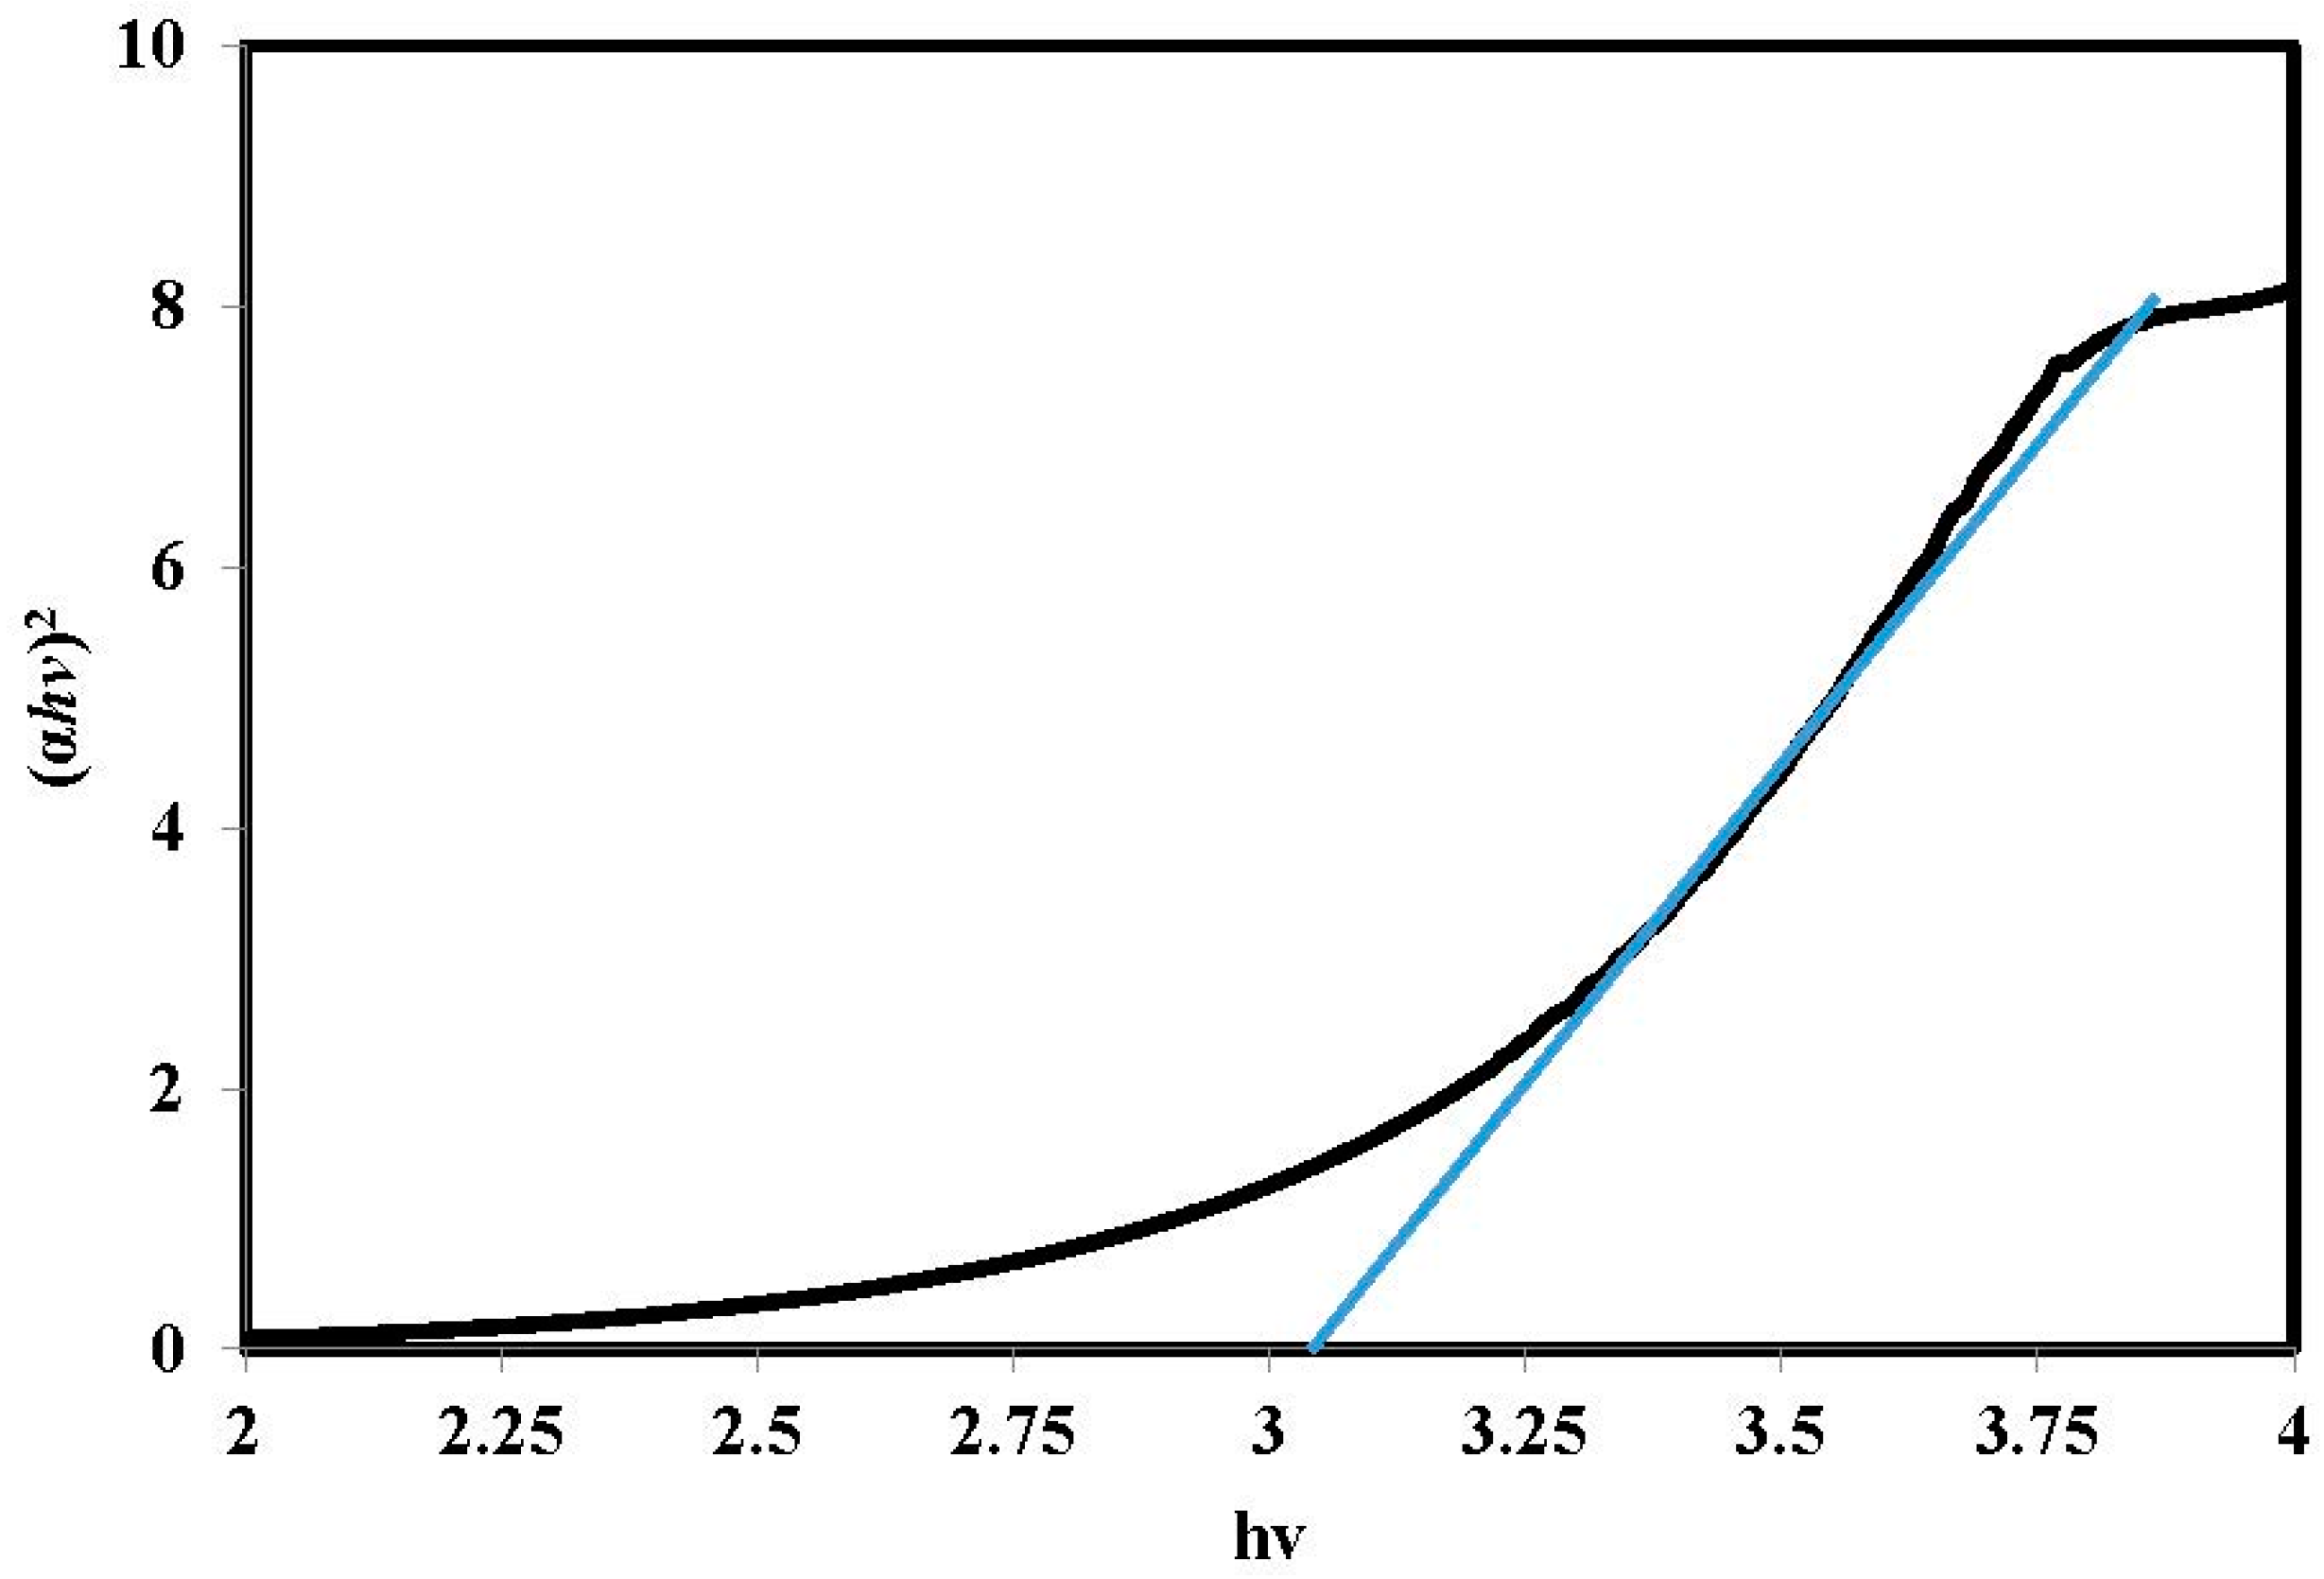
2.3. Absorbance and Band Gap of TiO2, Er3+/TiO2 and Ni2+/TiO2 NPs

The absorbance spectra for all the prepared samples (0.6, 1.2, 1.8, and 2.4 wt %) and (0.2, 0.4, 0.6, and 0.8 wt %) of Er3+/TiO2 and Ni2+/TiO2, respectively, were recorded at room temperature and are shown in Figure 6. The maximum absorption was observed at 320 nm. The direct band gap (Eg) values of TiO2, Er3+/TiO2 and Ni2+/TiO2 NPs were determined using the following direct transition equation (Equation (2)):
α h v = E d ( h v E g ) 1 2 .
where (α) is the optical absorption coefficient, h is Planck’s constant, v is the frequency (hv = 1240/wavelength), Eg is the direct band gap, and Ed is a constant [32]. By plotting (αhv)2 as a function of the photon energy (hv) and extrapolating the linear portion of the curve to a value of zero, band gap (Eg) was calculated and is shown in Figure 7. The obtained values of the band gap (Eg) of TiO2 with several wt % of Er3+ and Ni2+ are listed in Table 5. The minimum values of the band gap energies obtained are 2.63 and 2.47 eV for Er3+/TiO2 and Ni2+/TiO2 NPs, respectively.

2.4. Experimental Design

2.4.1. Response of Solar Photocatalytic Degradation Experiments and Modeling

All experiments were conducted according to the Taguchi OA plan shown in Table 6 under constant direct solar radiation on a clear sunny day. All samples were exposed to solar radiation for a period of 60 min. The degradation efficiency (DE%) was calculated using Equation (1). The results of the DE% for all experiments are listed in Table 6. The results of the predicted values of the DE% generated by the model created by Design Expert software are in agreement with the experimental results presented in Table 6.
After the experimental results of the DE% analysis were obtained, the predicted model of the process was fit with a linear regression, and several factors were determined to have a significant effect on the estimated final model. The linear model of the process and the factors affecting the results and respective coefficients are shown in Equation (3) below:
DE% = +63.25 − 3.32 × A [1] + 0.72 × A [2] + 1.29 × B [1] − 1.62 × B [2] + 23.27 × C [1] − 8.31 × C [2]
where DE% represents the degradation efficiency determined by UV–Vis spectroscopy; A, B, and C are the catalyst loading, pH, and initial concentration, respectively.

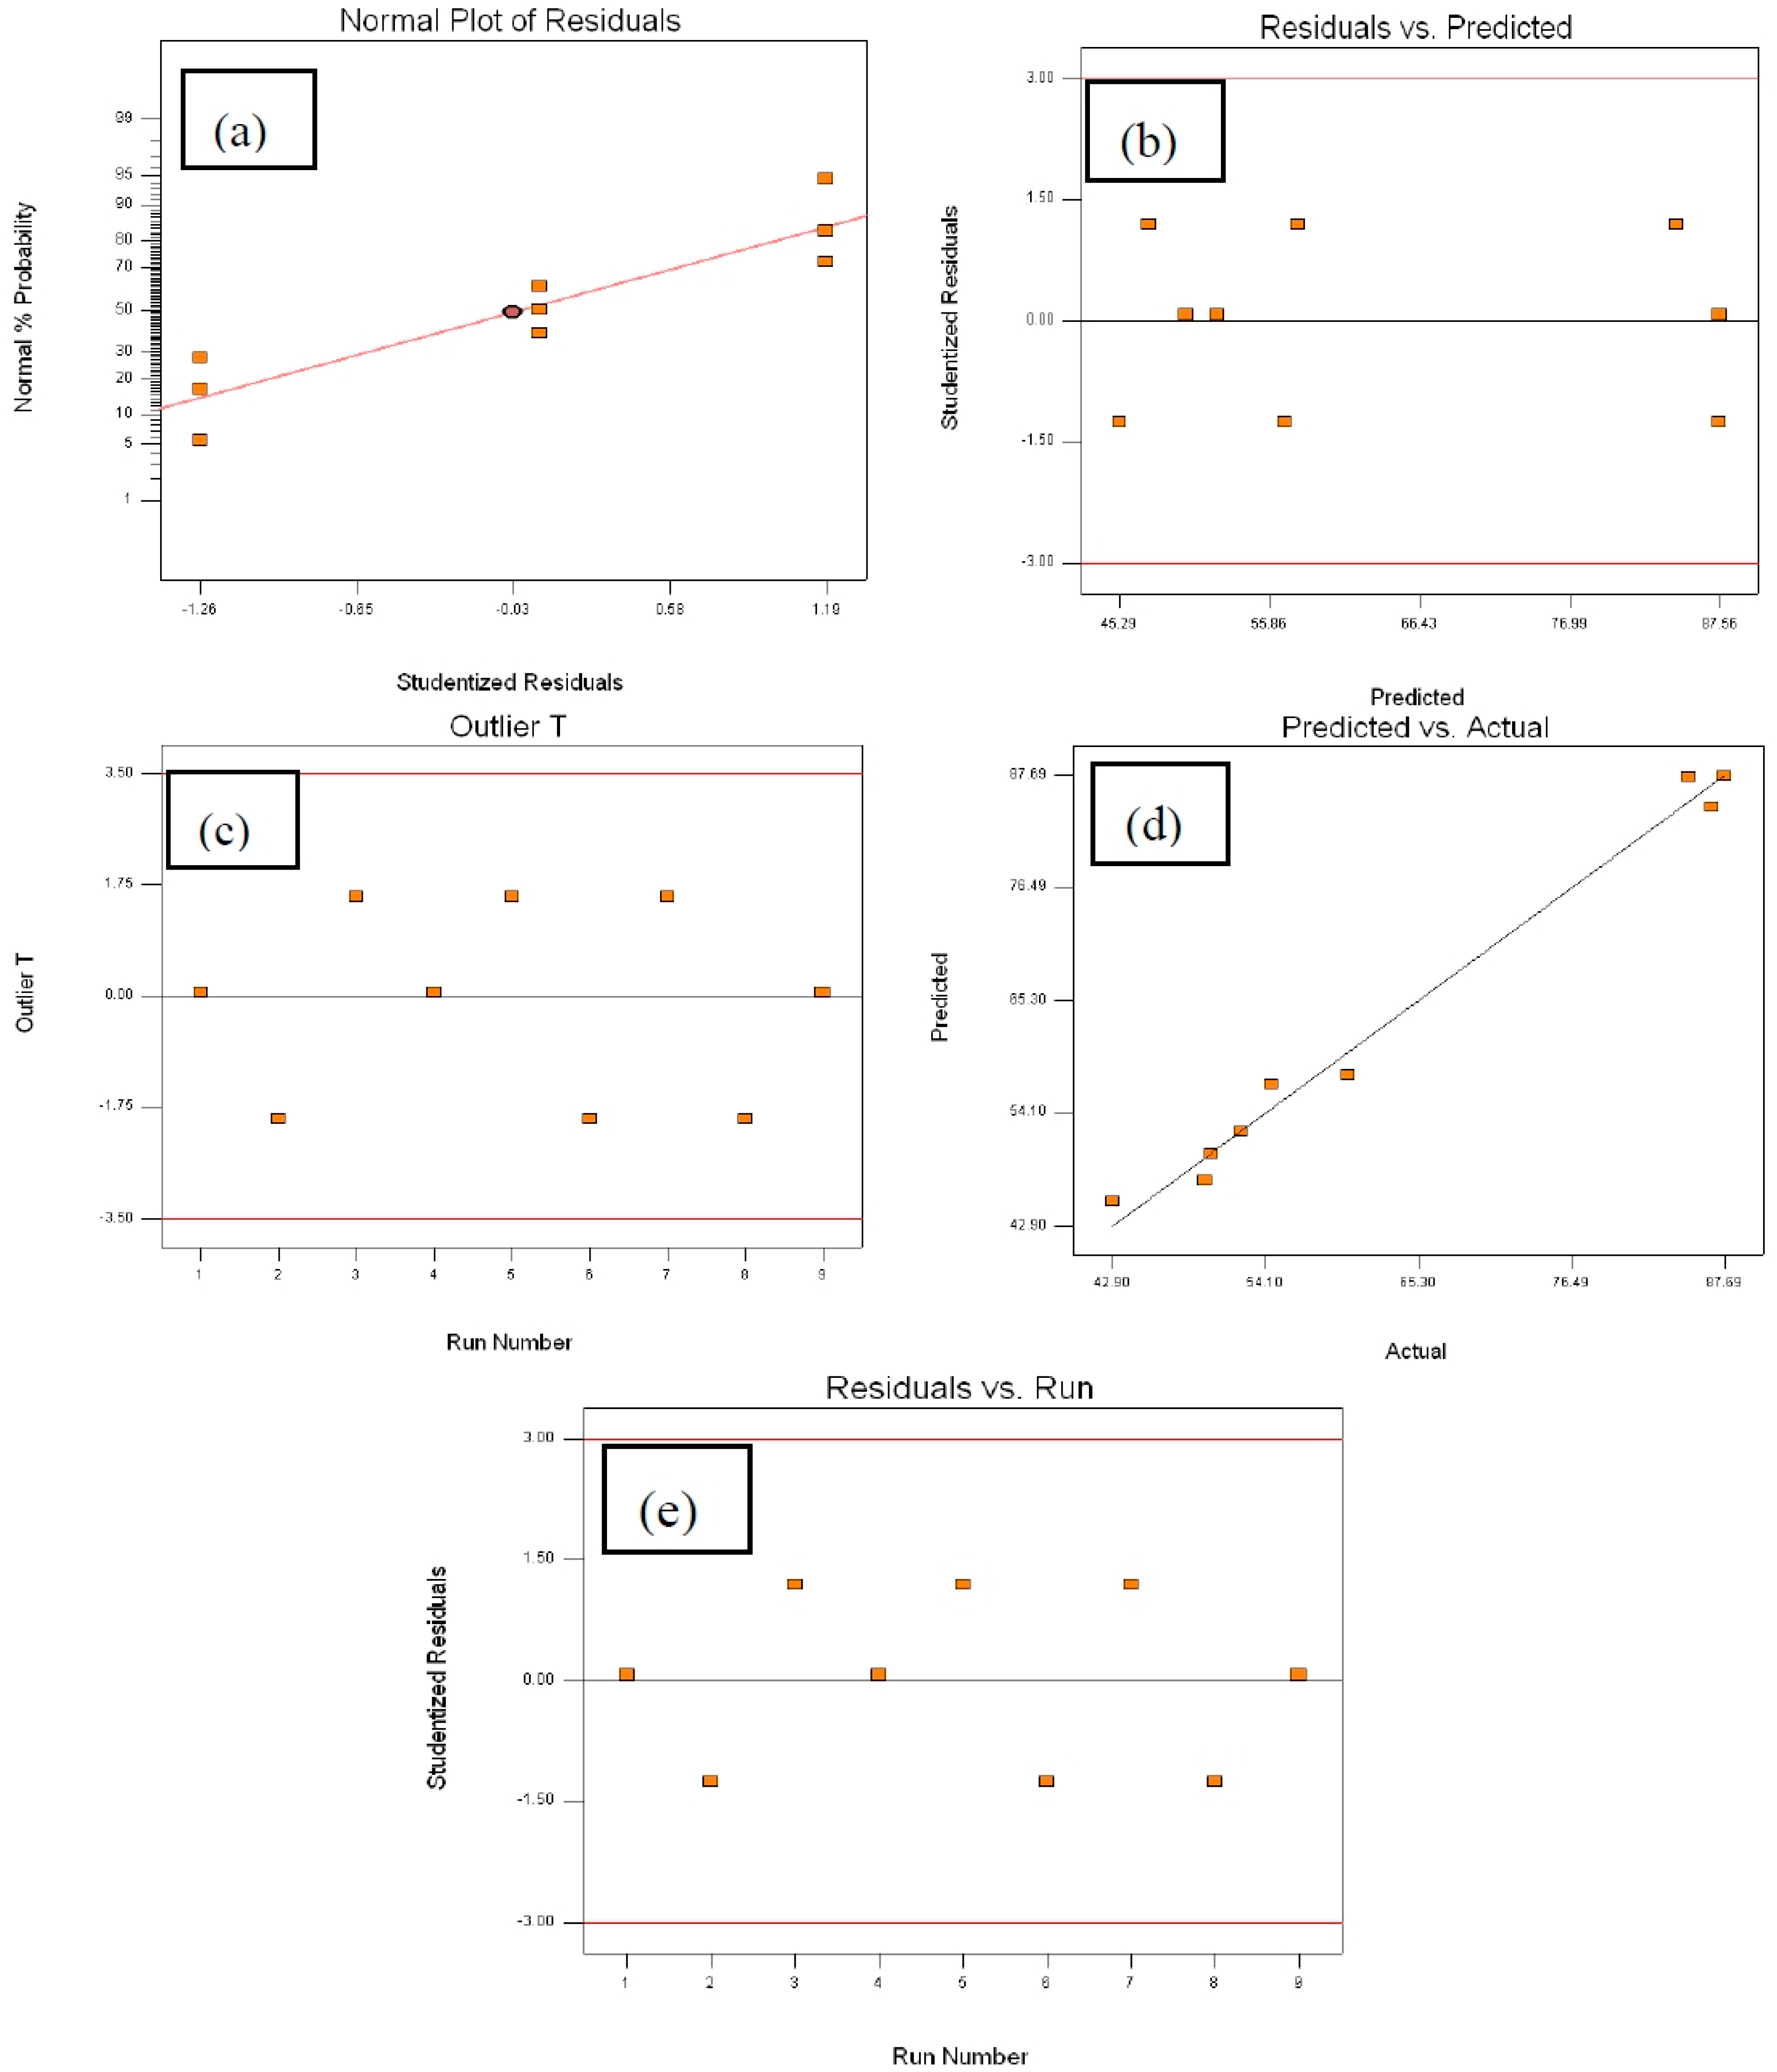
2.4.2. Analysis of Variance (ANOVA)

The ANOVA results are summarized in Table 7. It is clear that the model is significant with a 95% confidence interval since the p-value was 0.0371, which is less than 0.05. The analysis revealed that the most significant factor is the initial concentration of the chloroxylenol. The R 2 and R adj 2 values, which were 0.9875 and 0.9499, respectively, show that a sufficient model was created to explain the optimization conditions for the degradation process. The adequacy precision was 11.87, which is larger than 4, indicating that the model is adequate.
The diagnostic plots of the optimization process are shown in Figure 8. The experimental data shows a good fit with the graphical line, confirming that the model provides a good assumption based on the ANOVA results as shown by the normal probability versus the Studentized residual plots in Figure 8a. The random scattering of the experimental points compared to the funnel-shaped pattern that was obtained indicates that the DE% response had an original observation of variance with no problem between the response and the factors, as shown in Figure 8b [33]. Figure 8c shows a good distribution of the experimental points; none were located out of the indicated range. The actual value of the DE% with the predicted value of the model was evaluated by the value of R 2 and R adj 2 , as plotted in Figure 8d. All of the points in the figure are close to the line, indicating the capability of the model to predict the optimum conditions for the degradation process. The Studentized residuals for the experimental runs are shown in Figure 8e, which indicates that the model has values less than ±3.5 for the Studentized residuals, providing a good fit of the model to the response.

2.4.3. Optimal Conditions for Maximum DE% and Model Validation

To obtain the optimal conditions of the maximum degradation efficiency, the data shown in Table 6 was optimized numerically using Design Expert software for DE% (larger is better) for the ranges of all factors. The optimal conditions were found to be 3 g/L of Catalyst Loading, pH at 4 and 50 mg/L of chloroxylenol Concentration which the highest DE% of 90.40.
To validate the model shown in Equation (3) created by the software and the optimal conditions for the maximum DE%, three experimental runs were conducted under the optimal conditions listed in Table 8. The results of these experimental runs are shown in Table 8.
The average DE% according to the experimental data shown in Table 8 is 88.48%, which is only a 1.92% difference from that of the value predicted by the model (90.40%) and, thus, supports the model validity.

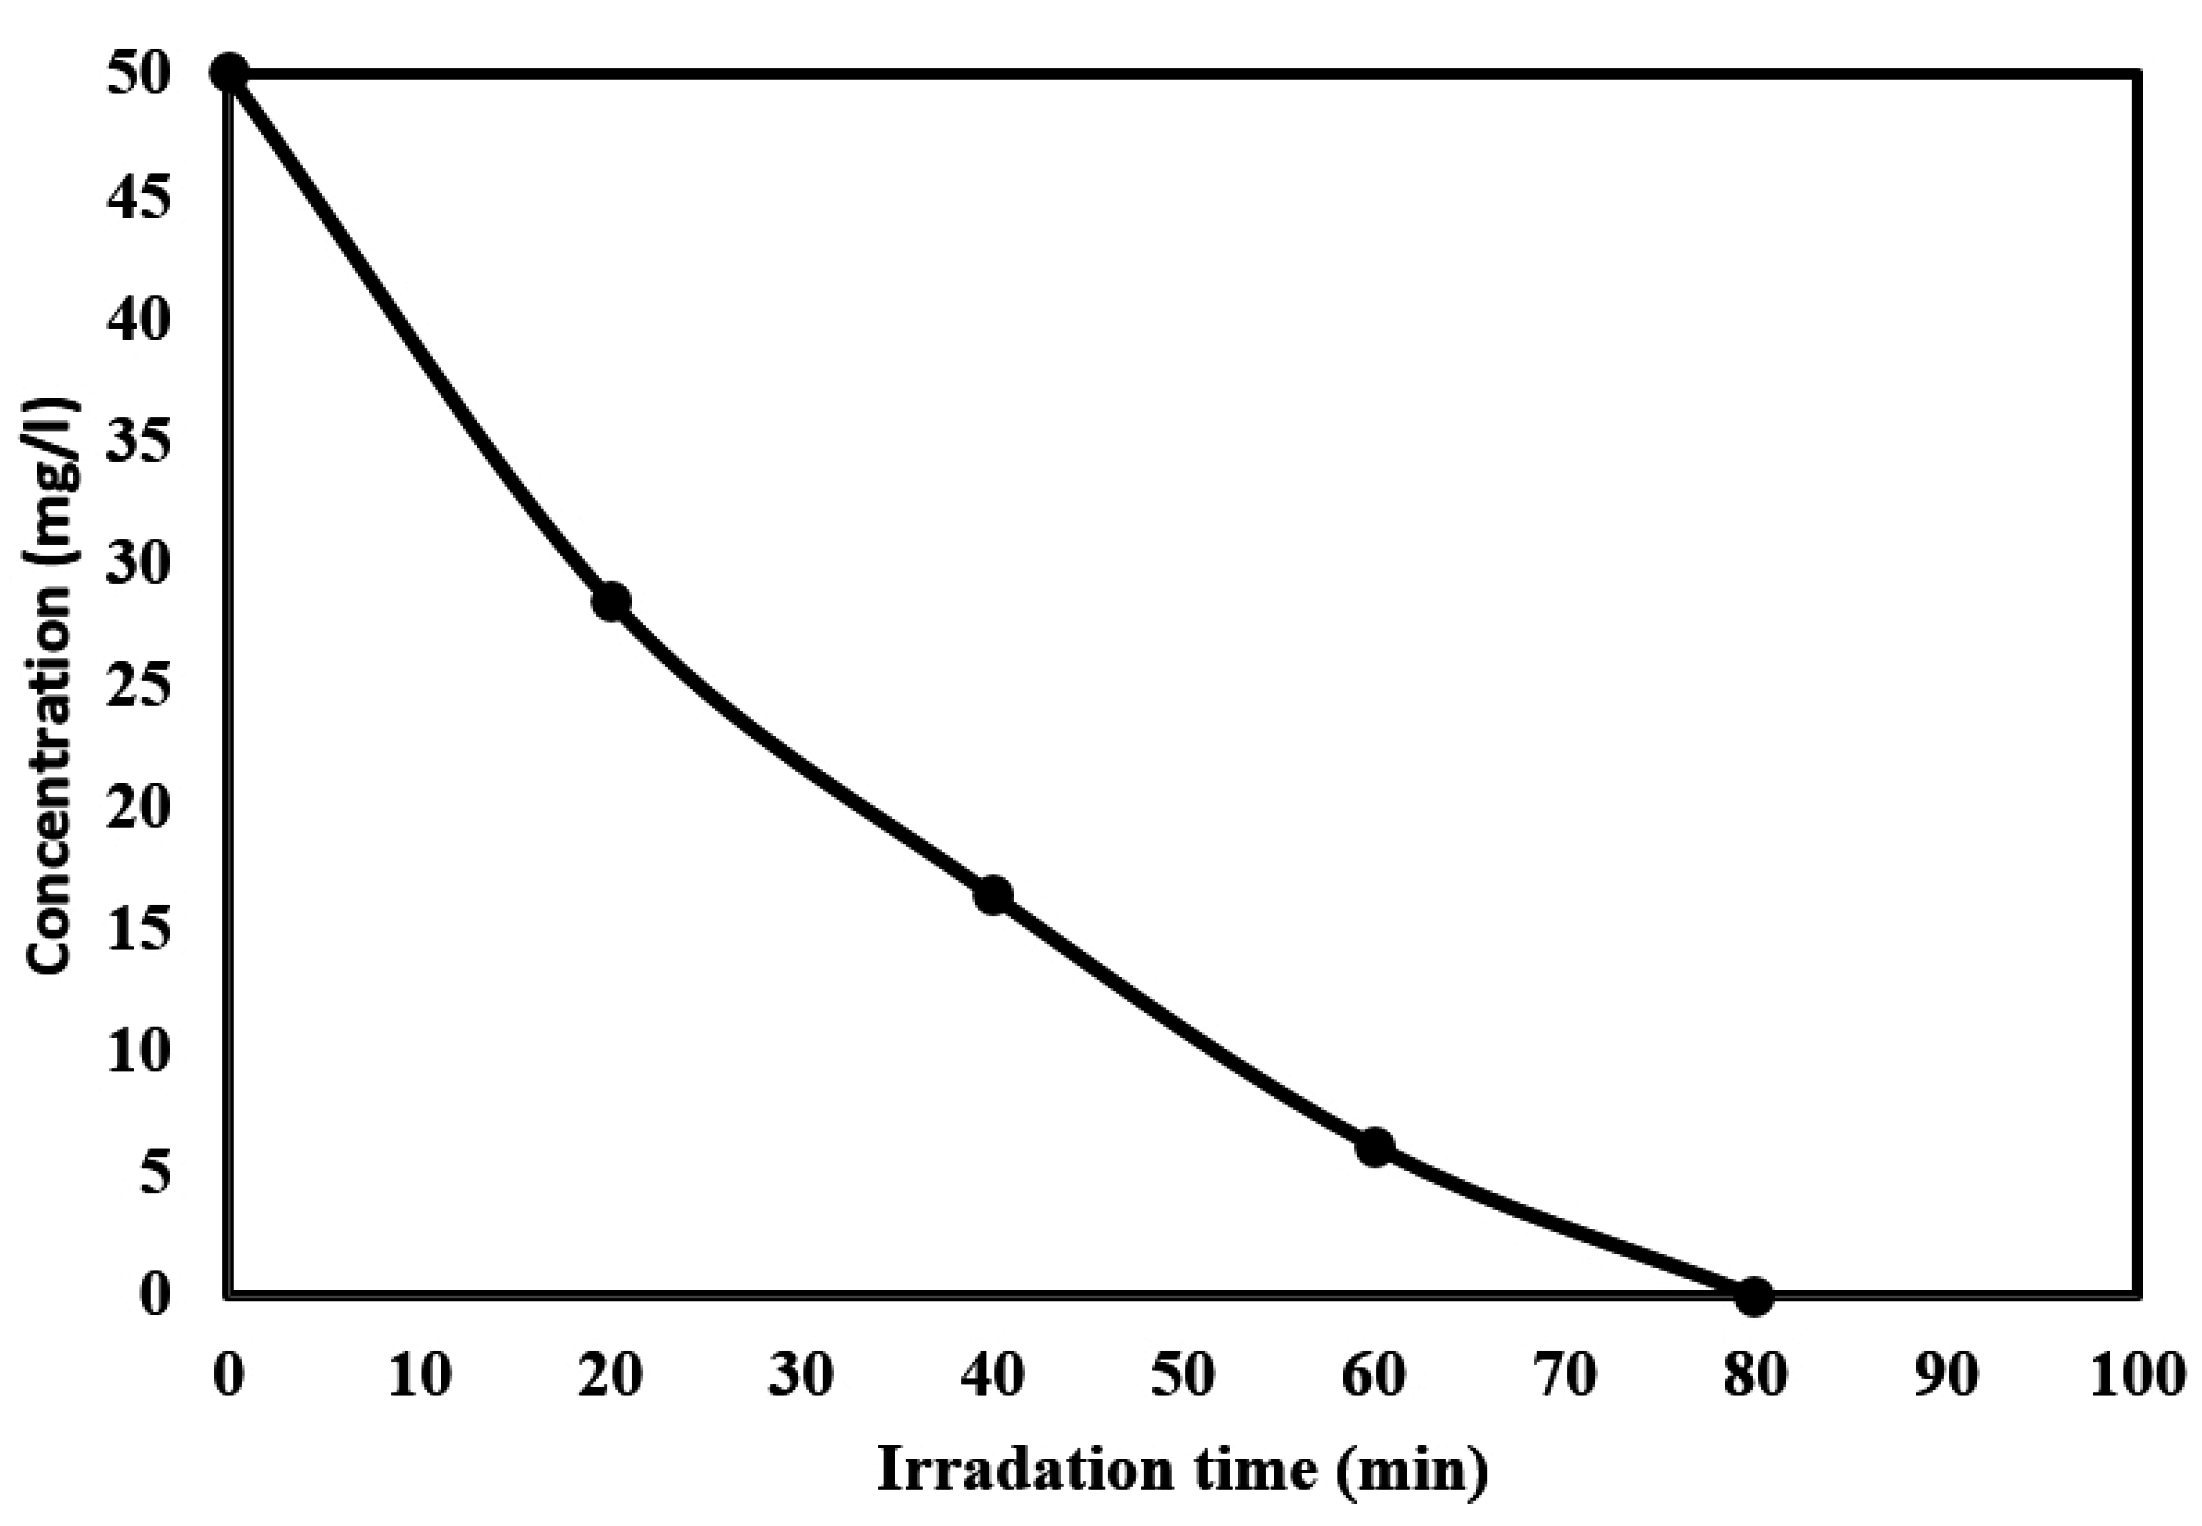
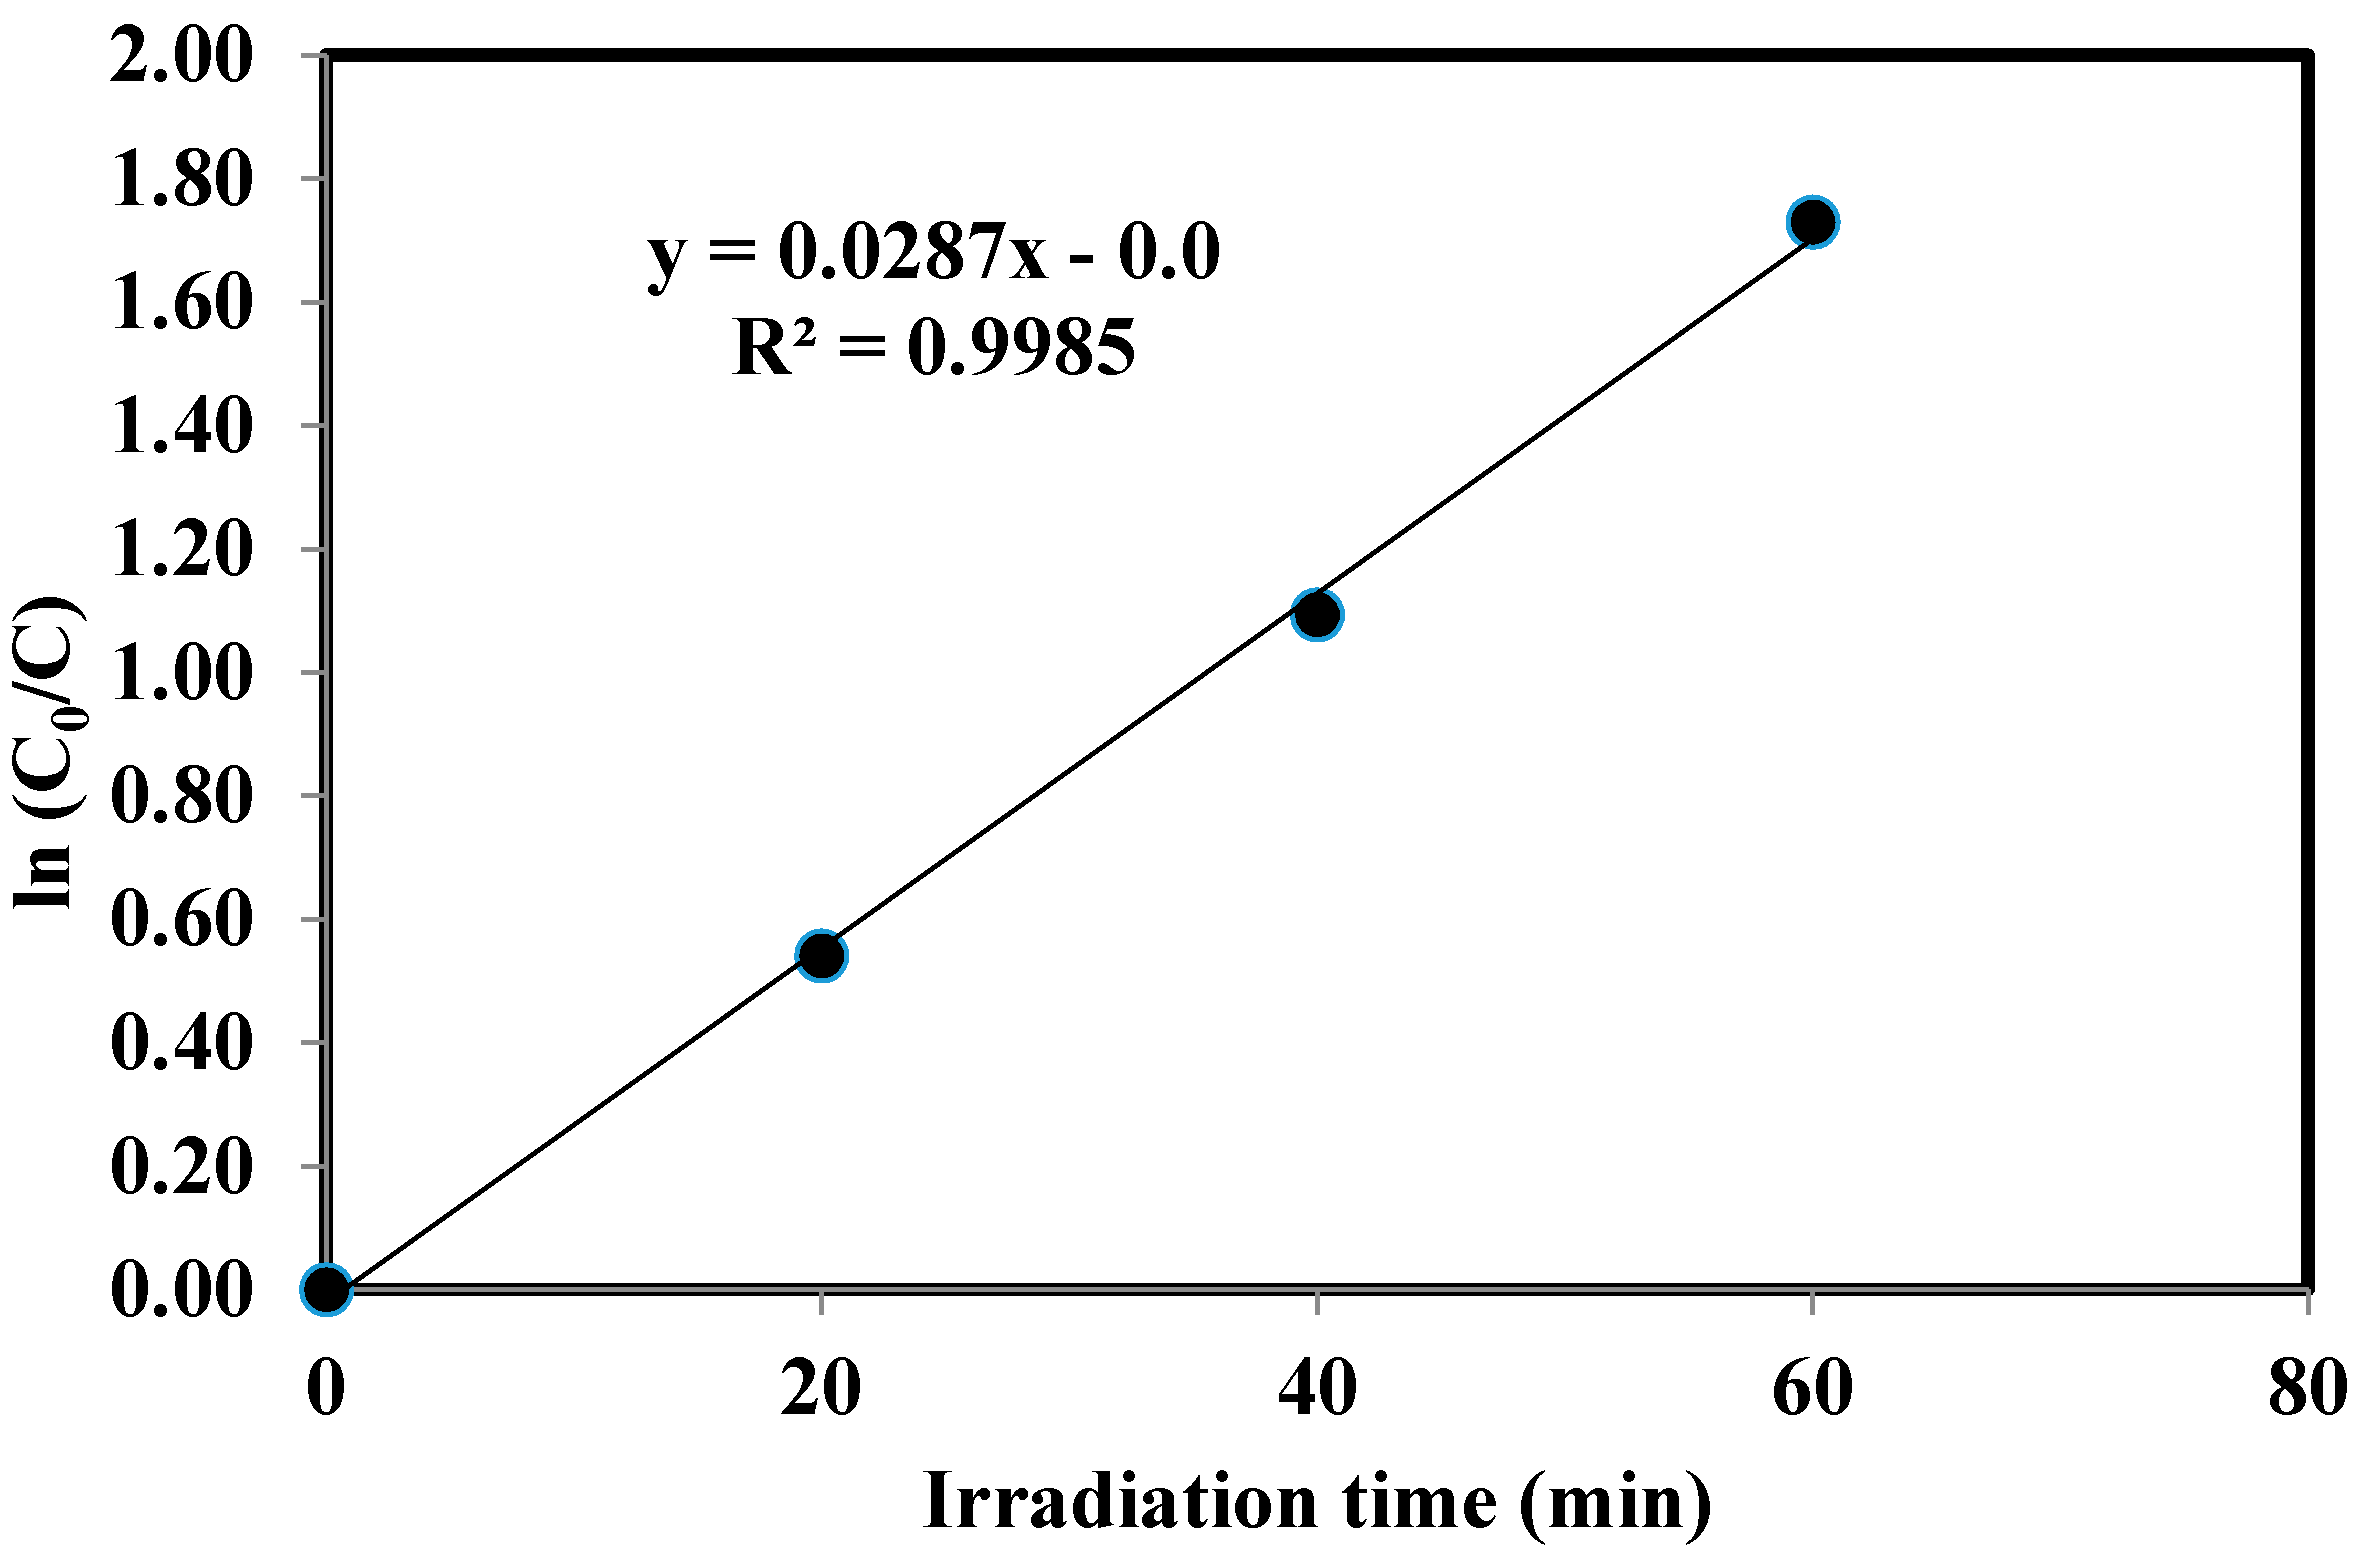
2.5. Kinetics of the Photocatalytic Degradation of Chloroxylenol Using TiO2 NPs

The experimental results of the photocatalytic degradation of chloroxylenol are shown in Figure 9. The reported results of the photocatalytic degradation of chloroxylenol show that the degradation rates of the photocatalytic oxidation using TiO2 NPs could be fit with the first-order kinetic model [19]. Figure 10 shows the plot of ln(C0/C) vs. the irradiation time for the degradation of chloroxylenol. The linearity of the plot suggests that the photodegradation reaction approximately follows the pseudo-first order kinetics with K = 0.0287 min−1.

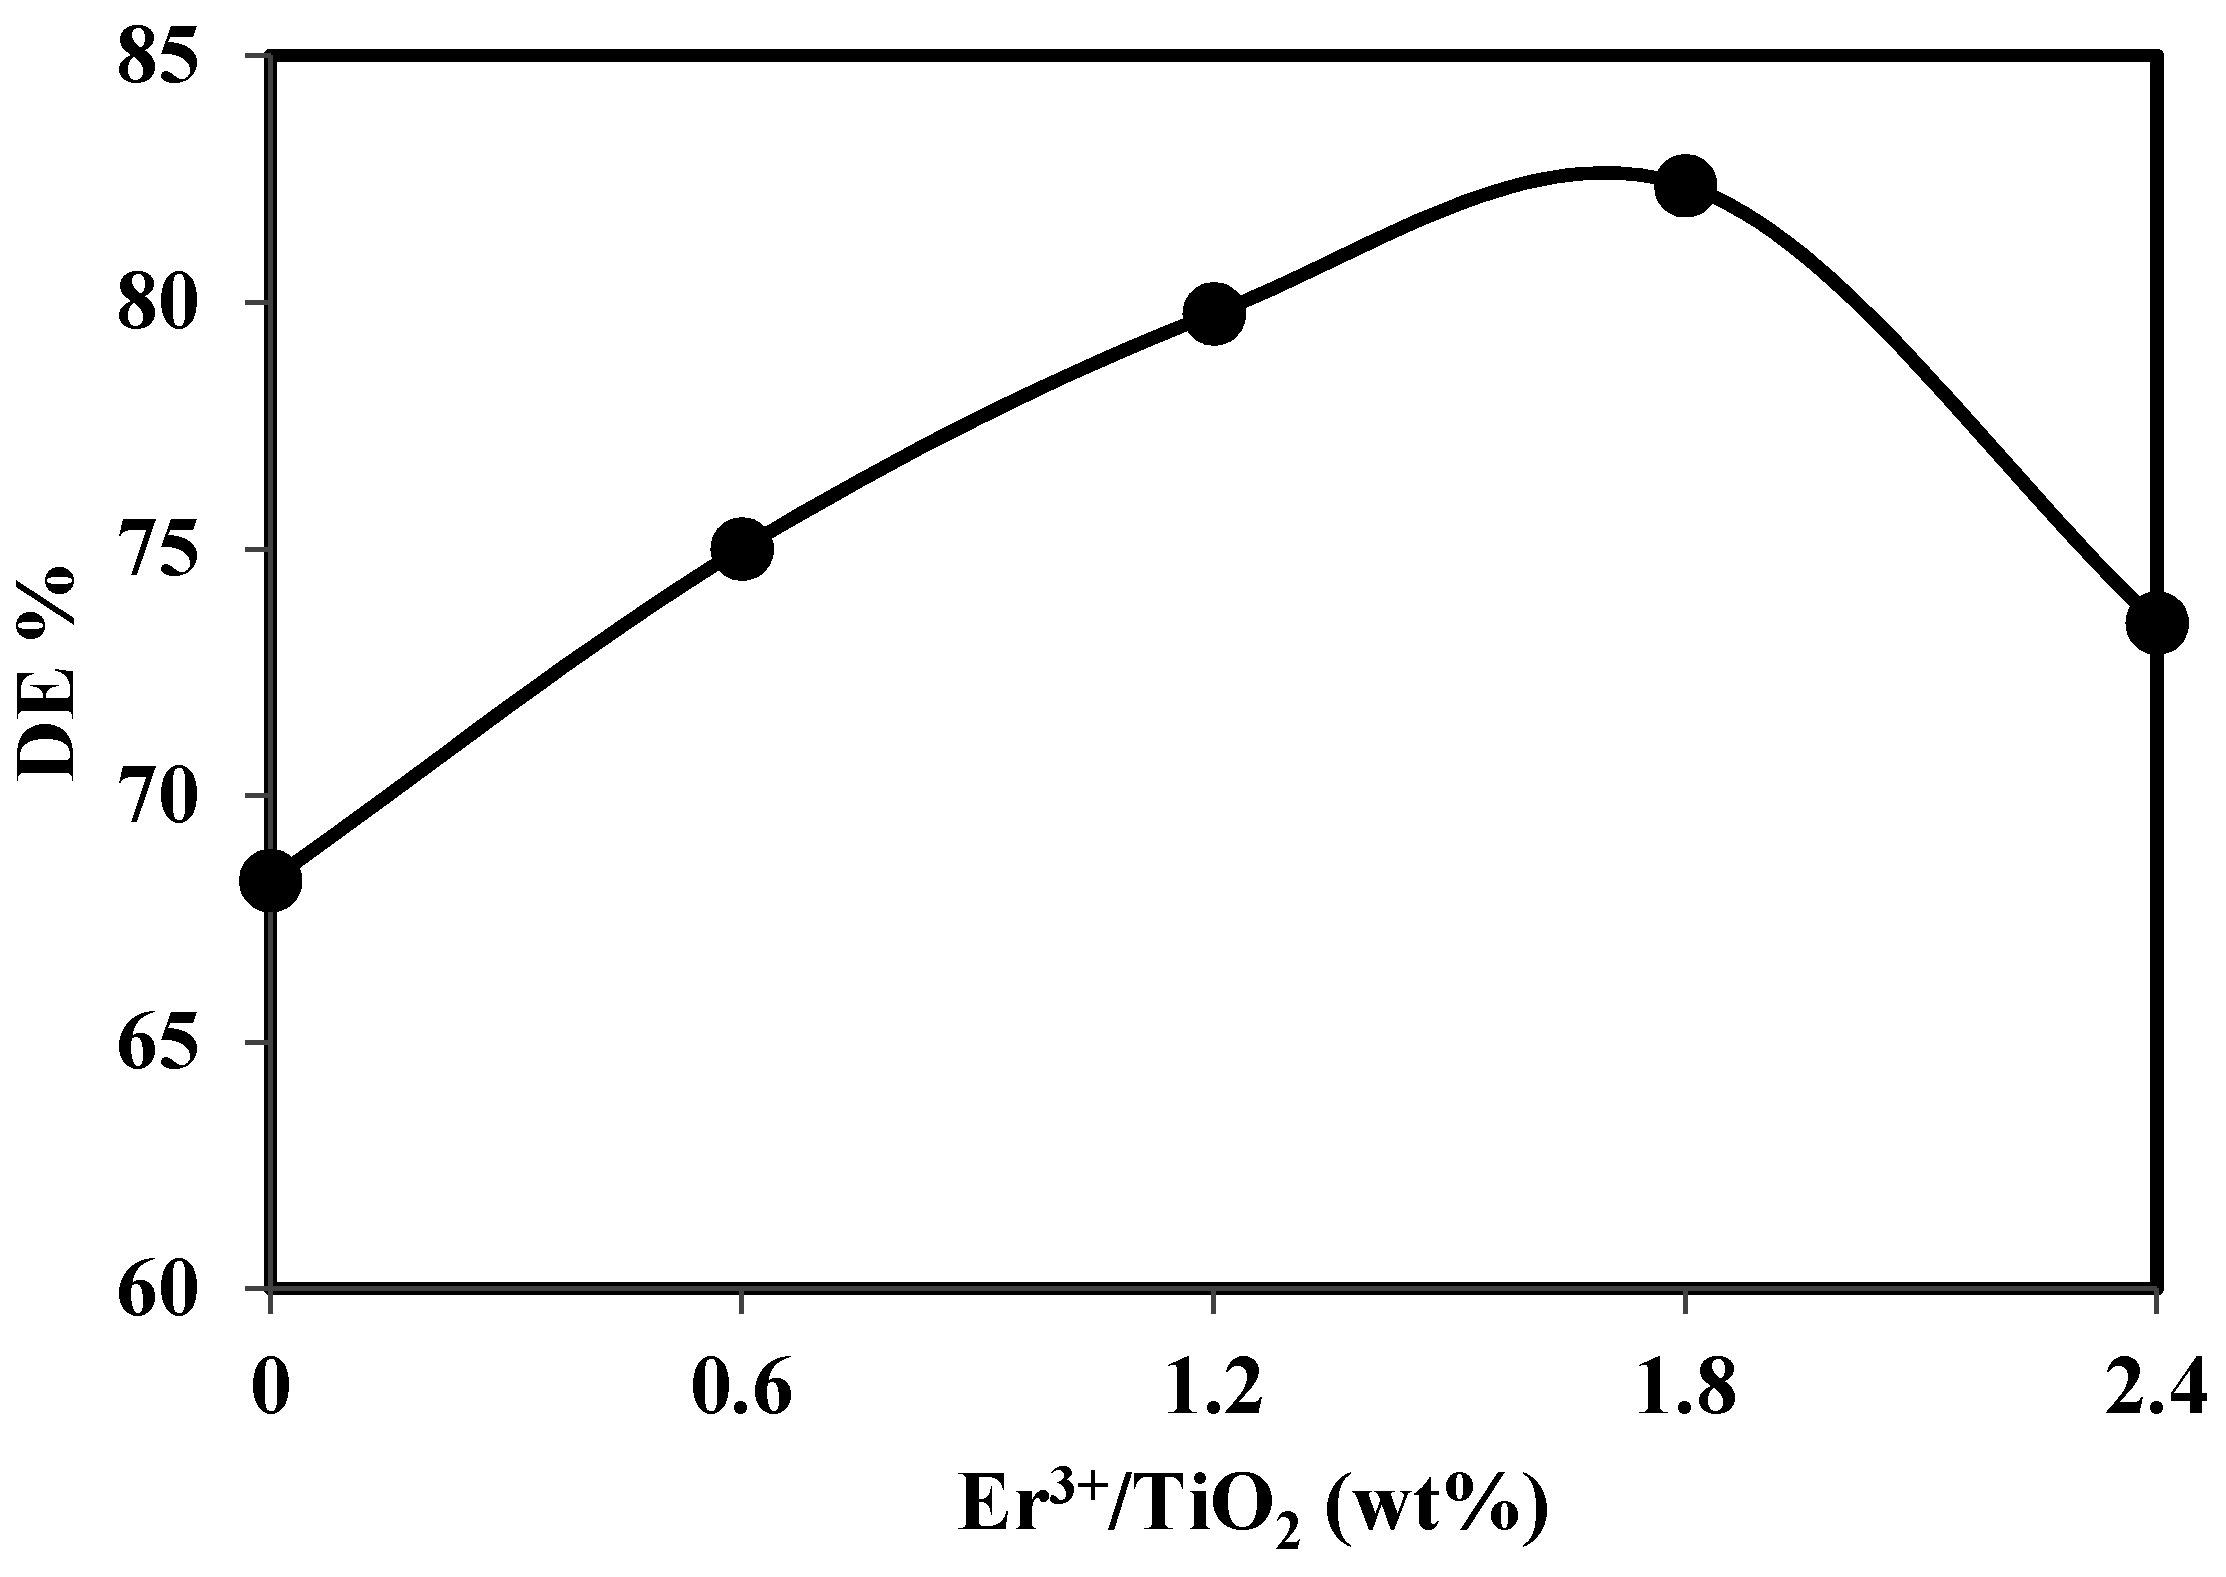
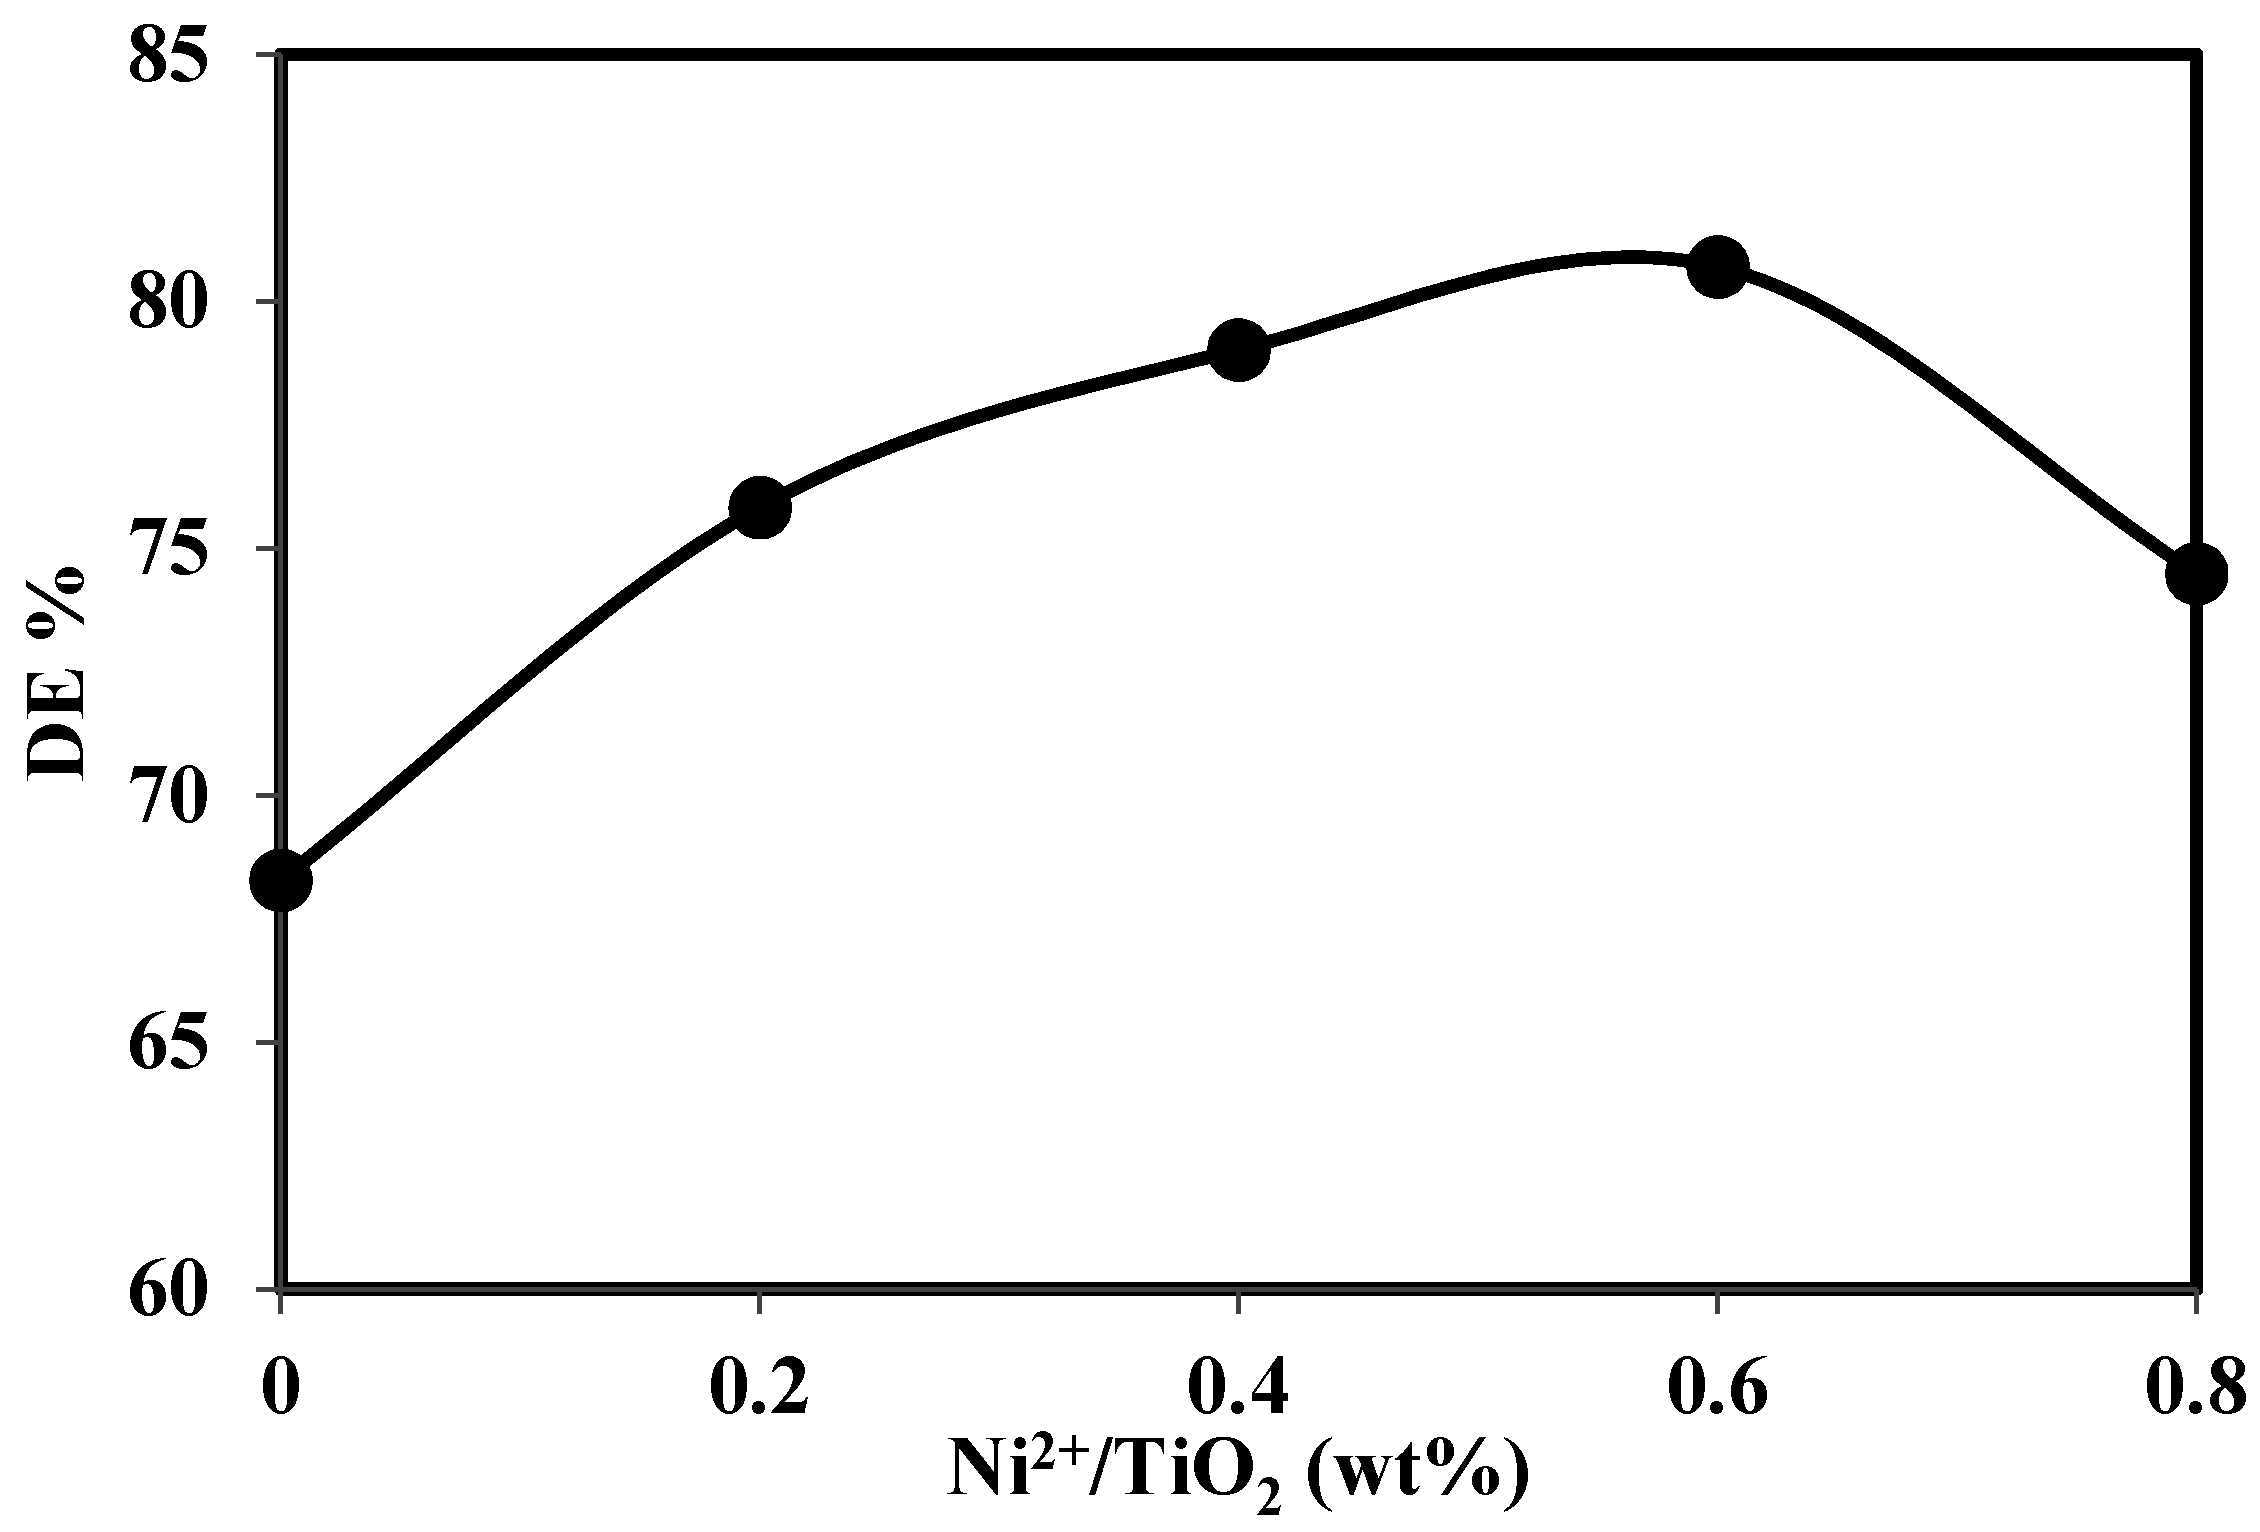
Application of Er3+/TiO2 and Ni2+/TiO2 NPs in the Photocatalytic Degradation of Chloroxylenol

To investigate the effects of the impregnation of TiO2 NPs with Er3+ and Ni2+ on the DE%, experiments were performed using the optimal conditions shown in Table 8 on a semi-cloudy day (solar radiation 600 W/m2) with a constant reaction time of 60 min using different wt % of Er3+/iO2 and Ni2+/TiO2 NPs. The results for the DE% using Er3+/TiO2 and Ni2+/TiO2 NPs are shown in Figure 11 and Figure 12, respectively. Figure 11 shows the maximum DE% of 82.38% obtained at a 1.8 wt % of Er3+/TiO2 provides a 14.10% increase compared with that of the intrinsic TiO2 NPs at 68.28%. The maximum DE% of 80.70% obtained at a 0.6 wt % of Ni2+/TiO2 showed an increase of 12.42% compared with that intrinsic TiO2 NPs, as shown in Figure 12.
In general, the DE% increased with the increasing concentration of both Er3+ and Ni2+ relative to the intrinsic TiO2. The DE% increased up to an optimal concentration for both Er3+ and Ni2+ over intrinsic TiO2 at 1.8 and 0.60 wt %, respectively. This result is attributed to the decrease in the band gap because of the shifting absorbance to the visible region. The band gaps of Er3+ and Ni2+, compared with intrinsic TiO2, at 1.8 and 0.60 wt % were found to be 2.63 and 2.47 eV, respectively. These results were compared to intrinsic TiO2 at 3.13 eV in Table 5. This shifting is attributed to the incorporation of Er3+ and Ni2+ into the surface of the TiO2 nanoparticles [34]. After the optimal doping concentrations of Er3+ and Ni2+ for TiO2, a decrease in the DE% was observed, which is attributed to the excess Er3+ and Ni2+ ions working as a recombination center within the degradation process [35]. However, the electron-hole recombination is faster in the presence of Er3+ and Ni2+ ions due to the unstable Er4+ and Ni3+ ions that can easily transfer electrons to the oxygen molecules [36].

3. Materials and Methods

3.1. Materials

All chemicals were purchased from Sigma Aldrich (St. Louis, MO, USA), including erbium (III) acetylacetonate hydrate, CAS grade, 97% purity; nickel (II) acetate tetrahydrate, 98% purity; 99.5% titanium oxide nano-powder (P25) with a diameter of 21 nm using transmission electron microscope TEM, (Philips, Eindhoven, The Netherlands); and chloroxylenol, 98% purity. All chemicals were used without further purification. Deionized water was used for the preparation of the chloroxylenol standard solution, as well as for dilutions.

3.2. Preparation of Er3+/TiO2 and Ni2+/TiO2 NPs

To impregnate the TiO2 NPs with Er3+ and Ni2+ ions in different wt % of Er/TiO2 (0.6, 1.2, 1.8, and 2.4 wt %) and Ni/TiO2 (0.2, 0.4, 0.6, and 0.8 wt %), an 80-mL glass beaker was used. In total, 3 g TiO2 powder was placed in the beaker. Particular amounts (60, 120, 180, and 240 mg) of erbium (III) acetylacetonate hydrate or nickel (II) acetate tetrahydrate were dissolved in 10 mL of deionized water and sonicated for 10 min. These solutions were then added to the TiO2 powder dropwise under well-mixing conditions with a glass rod. The mixture was then stirred at 1300 rpm for 2 h, and the mixture was dried overnight at 80 °C, then calcined at 500 °C for 2 h.

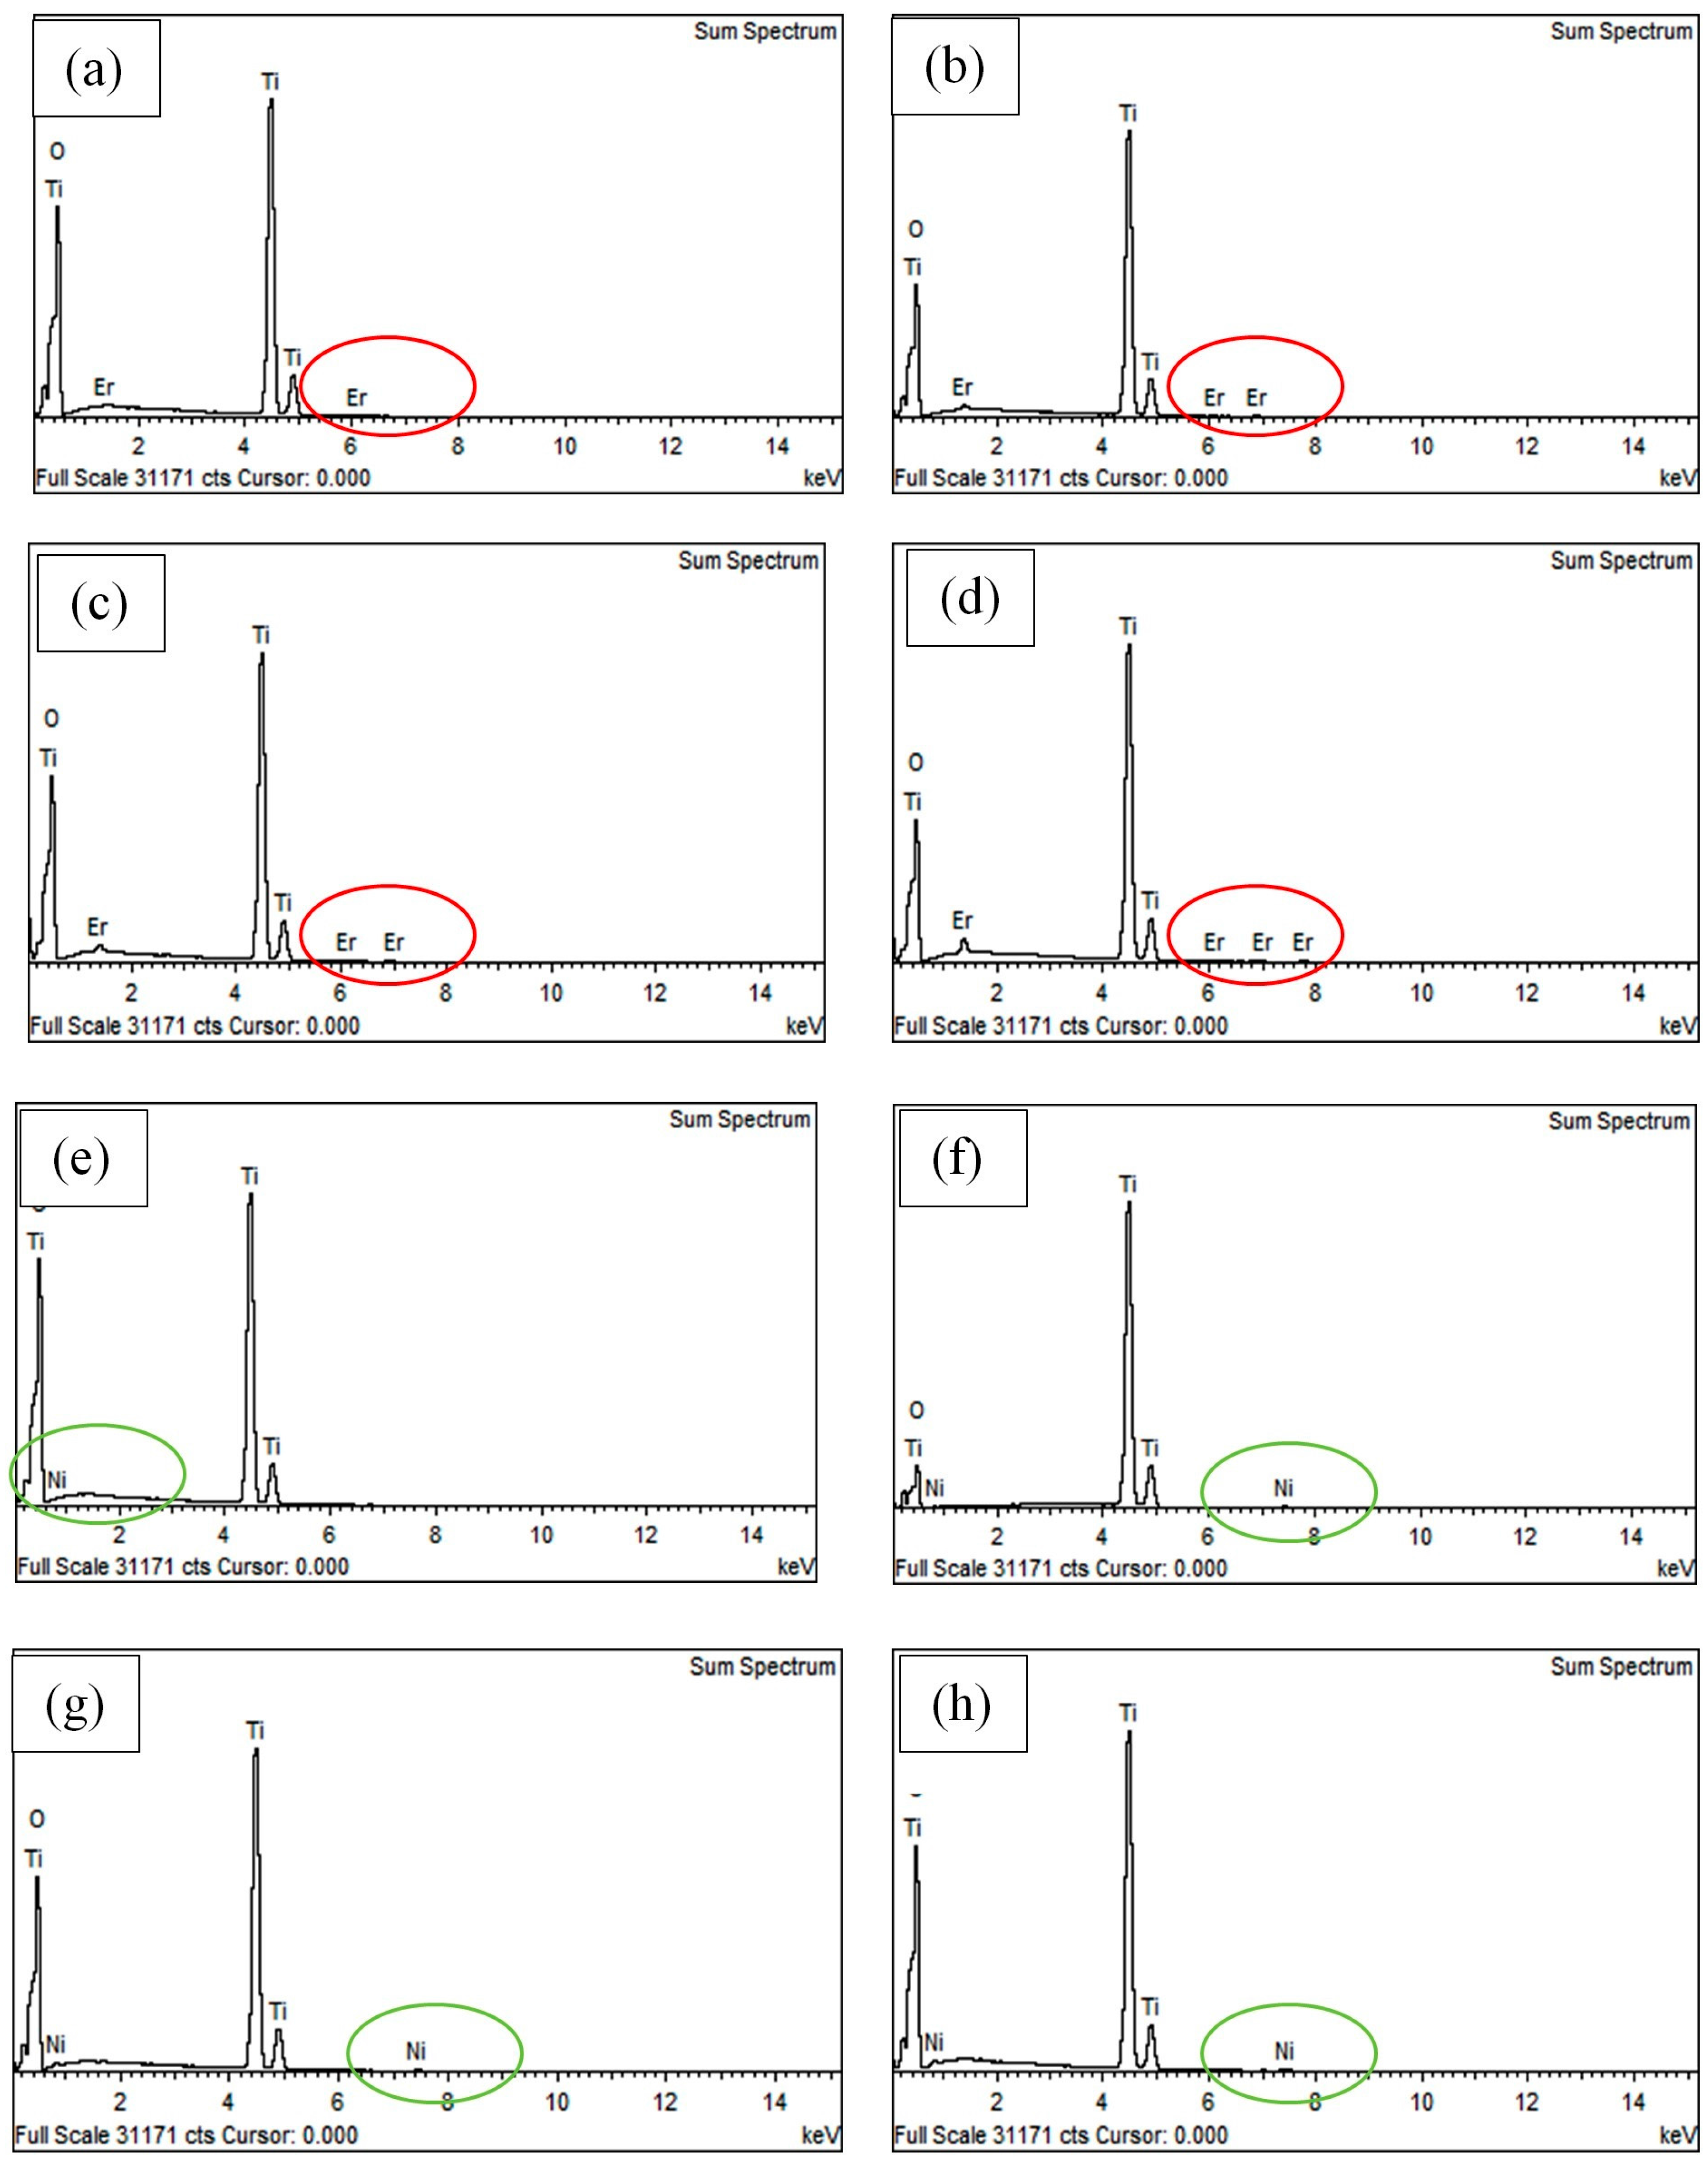
3.3. Characterization of Er3+/TiO2 and Ni2+/TiO2 NPs

The crystallite size and phase composition of the Er3+/TiO2 and Ni2+/TiO2 NPs samples were determined using X-ray diffractometer (XRD) model D8 Advance Bruker AXS X-ray (Bruker, Karlsruhe, Germany) with Cu Kα radiation (1.5406 Å) in a 2θ scan range of 20°–80°.The morphology of the Er3+/TiO2 and Ni2+/TiO2 NPs was investigated using a field emission scanning electron microscope, model SUPRA 55 VP (Carl Zesis AG, Munich, Germany), under high resolution, supplied with the energy dispersive X-ray analysis (EDX) system and metal mapping model OXFORD INCA Penta FETx3 (Carl Zesis AG). The zeta potential of the Er3+/TiO2 and Ni2+/TiO2 NPs was measured using a Malvern Zeta sizer, model Nano-ZS (Malvern instruments Inc. Worcestershire, UK). A Perkin Elmer (lambda35) UV–Vis spectrophotometer (Perkin Elmer, Waltham, MA, USA) equipped with an integrating sphere was used to record the UV–Vis absorption spectra of the Er3+/TiO2 and Ni2+/TiO2 NPs. The spectra were recorded at room temperature with a wavelength range of 200–1100 nm.

3.4. Design of Experiment Using Taguchi Orthogonal Array L9 (34)

The purpose of using the Taguchi Orthogonal Array design of experiment is to determine the optimum process conditions to obtain the maximum degradation efficiency (DE%) of chloroxylenol with the minimum number of experiments. In this study, Design Expert software version 6.0.10 was used. Three factors affecting the degradation efficiency of the chloroxylenol were investigated at three levels, as shown in Table 9.
The orthogonal array L9 (34) experimental design method was chosen to determine the experimental plan as given in Table 10.

3.5. Photocatalytic Reactor and Experimental Procedures

A glass cylindrical slurry batch reactor with a 6.5-cm diameter, 3.8-cm height, 125-mL volume, and a 110-cm2 radiation area was used to conduct the experiments of solar photocatalytic degradation of chloroxylenol. A 100-mL aqueous solution of a known concentration of chloroxylenol was mixed in the dark with a certain amount of TiO2 NPs for 60 min to achieve adsorption-desorption equilibrium. The pH was adjusted using HCl and NaOH according to the experimental plan shown in Table 10. Most of the photocatalytic experiments were carried out under similar conditions on clear sunny days from 11:00 am to 2:00 pm with the ambient temperature between 28 and 40 °C, with the exception of those conducted to study kinetics that were run during semi-cloudy days. In each experiment, a sample was withdrawn every 15 min, centrifuged, and then filtered using a 0.22 μm filter to remove the catalyst particles prior to analysis.

3.6. Analytical Method

The UV–Vis spectrophotometer equipped with an integrating sphere was used to determine the concentration of chloroxylenol at λ = 297 nm. Five standard concentrations of chloroxylenol, 12.5, 25, 50, 100 and 150 mg/L, were used to determine the calibration curve. The calibration curve was defined by plotting the concentration versus its absorbance for the five standard concentrations. Then, the absorbance values of the chloroxylenol sample before and after degradation were recorded and compared with the calibration curve to determine their concentrations. The photocatalytic degradation efficiency (DE%) was calculated using the following Equation (4):
D E % = ( C 0 C ) C 0   x
where C0 is the initial concentration and C is the concentration of the chloroxylenol at different time intervals.

4. Conclusions

The TiO2 nanoparticles were impregnated with various wt % of erbium and nickel ions using the impregnation method followed by calcination at 500 °C. The Er3+ and Ni2+ impregnated TiO2 samples indicated that the band gap energy decreases as the wt % values of the Er3+ and Ni2+ increase up to 1.8 wt % for the Er3+/TiO2 and 0.6 wt % for the Ni2+/TiO2. Agglomeration and particle sizes increased as the ions’ wt % increased. The use of Design Expert software and the Taguchi OA method decreased the number of experiments required to predict the optimal conditions. The optimal conditions for solar photocatalytic degradation of chloroxylenol in an aqueous solution include a pH of 4, a TiO2 loading of 3 g/L, and a concentration of 50 mg/L. The photocatalytic activity of TiO2 showed obvious enhancements with only a small wt % increase upon impregnation with Er3+ and Ni2+ ions. This result was attributed to the decrease in the band gap energy. As a result, there is significant enhancement in the DE% of chloroxylenol by using the impregnated Er3+/TiO2 and Ni2+/TiO2.

Acknowledgments

The authors are thankful to the Universiti Kebangsaan Malaysia for the financial support. Also authors would like to thank CRIM (Center for Research and Instrumentation Management UKM).

Author Contributions

Ahmed J. Mohammed did all the experiment as part of his project. Muneer M. Ba-Abbad helped in characterization of the nonmaterial. Abdul Amir H. Kadhum is the principle investigator while Ahmed A. Al-Amiery is a co-investigator. All authors are aware of this manuscript and have agreed to its publication.

Conflicts of Interest

The authors declare no conflict of interest.

References

  1. Bruch, M.K. Chloroxylenol: An old–new antimicrobial. In Handbook of Disinfectants and Antiseptics; Marcel Dekker: New York, NY, USA, 1996; pp. 265–294. [Google Scholar]
  2. Wilson, M.; Mowad, C. Chloroxylenol. Dermatitis 2007, 18, 120–121. [Google Scholar] [PubMed]
  3. Kim, B.; Anderson, J.; Mueller, S.; Gaines, W.; Kendall, A. Literature review-efficacy of various disinfectants against Legionella in water systems. Water Res. 2002, 36, 4433–4444. [Google Scholar] [CrossRef]
  4. Yamano, T.; Shimizu, M.; Noda, T. Allergenicity evaluation of Bioban CS-1135 in experimental animals. Contact Dermat. 2004, 50, 339–343. [Google Scholar] [CrossRef] [PubMed]
  5. Kupper, T.; Plagellat, C.; Brändli, R.; de Alencastro, L.F.; Grandjean, D.; Tarradellas, J. Fate and removal of polycyclic musks, UV filters and biocides during wastewater treatment. Water Res. 2006, 40, 2603–2612. [Google Scholar] [CrossRef] [PubMed]
  6. Zhang, G.; Liu, Z.; Song, L.; Hu, J.; Ong, S.; Ng, W. Post-treatment of banknote printing works wastewater ultrafiltration concentrate. Water Res. 2004, 38, 3587–3595. [Google Scholar] [CrossRef] [PubMed]
  7. Kestioglu, K.; Yonar, T.; Azbar, N. Feasibility of physico-chemical treatment and advanced oxidation processes (AOPs) as a means of pretreatment of olive mill effluent (OME). Process Biochem. 2005, 40, 2409–2416. [Google Scholar] [CrossRef]
  8. Song, S.; Liu, Z.; He, Z.; Li, Y.; Chen, J.; Li, C. Degradation of the biocide 4-chloro-3, 5-dimethylphenol in aqueous medium with ozone in combination with ultraviolet irradiation: Operating conditions influence and mechanism. Chemosphere 2009, 77, 1043–1051. [Google Scholar] [CrossRef] [PubMed]
  9. Ghanem, K.M.; Al-Fassi, F.A.; Al-Hazmi, N.M. Optimization of chloroxylenol degradation by Aspergillus niger using Plackett-Burman design and response surface methodology. Rom. Biotechnol. Lett. 2013, 18, 7983–7994. [Google Scholar]
  10. Ibhadon, A.O.; Fitzpatrick, P. Heterogeneous photocatalysis: Recent advances and applications. Catalysts 2013, 3, 189–218. [Google Scholar] [CrossRef]
  11. Estrellan, C.R.; Salim, C.; Hinode, H. Photocatalytic activity of sol–gel derived TiO2 Co-doped with iron and niobium. React. Kinet. Catal. Lett. 2009, 98, 187–192. [Google Scholar] [CrossRef]
  12. Yu, C.L.; Yang, K.; Yu, J.; Peng, P.; Cao, F.; Li, X.; Zhou, X.C. Effects of rare earth Ce doping on the structure and photocatalytic performance of ZnO. Acta Phys. Chim. Sin. 2011, 27, 505–512. [Google Scholar]
  13. Minero, C.; Pelizzatti, E.; Sega, M.; Friberg, S.E.; Sjoblom, J. The role of humic substances in photocatalytic degradation of water contaminants. J. Dispers. Sci. Technol. 1999, 20, 643–661. [Google Scholar] [CrossRef]
  14. Ba-Abbad, M.M.; Kadhum, A.H.; Mohamad, A.B.; Takriff, M.S.; Sopian, K. Optimization of process parameters using D-optimal design for synthesis of ZnO nanoparticles via sol–gel technique. J. Ind. Eng. Chem. 2013, 19, 99–105. [Google Scholar] [CrossRef]
  15. Ba-Abbad, M.M.; Chai, P.V.; Takriff, M.S.; Benamor, A.; Mohammad, A.W. Optimization of nickel oxide nanoparticle synthesis through the sol–gel method using Box–Behnken design. Mater. Des. 2015, 86, 948–956. [Google Scholar] [CrossRef]
  16. Chung, T.; Ba-Abbad, M.M.; Mohammad, A.W.; Hairom, N.H.; Benamor, A. Synthesis of minimal-size ZnO nanoparticles through sol–gel method: Taguchi design optimization. Mater. Des. 2015, 87, 780–787. [Google Scholar] [CrossRef]
  17. Hong, G.B.; Ma, C.M. Photocatalytic degradation of indoor air pollutants by Pt-TiO2. J. Nanomater. 2012, 2012, 88–93. [Google Scholar] [CrossRef]
  18. Chong, M.N.; Lei, S.; Jin, B.; Saint, C.; Chow, C.W. Optimisation of an annular photoreactor process for degradation of Congo Red using a newly synthesized titania impregnated kaolinite nano-photocatalyst. Sep. Purif. Technol. 2009, 67, 355–363. [Google Scholar] [CrossRef]
  19. Nikazar, M.; Farahani, S.J.; Soltani, M.R. Photocatalytic degradation of ethylene dichloride in water using nano TiO2 supported on clinoptilolite as a photocatalyst. Adv. Mater. Phys. Chem. 2013, 2, 274–276. [Google Scholar] [CrossRef]
  20. Marandi, R.; Sharif, A.A.M.; Olya, M.E.; Moradi, R. Preparation, characterization of NiFe2O4 nanoparticles supported on clinoptilolite and optimization of photocatalytic degradation of pollutants in textile wastewater by Taguchi experimental design. J. Basic. Appl. Sci. Res. 2013, 3, 443–456. [Google Scholar]
  21. Asghar, A.; Raman, A.A.A.; Daud, W.M.A.W. A comparison of central composite design and Taguchi method for optimizing fenton process. Sci. World J. 2014, 2014, 1–14. [Google Scholar] [CrossRef] [PubMed]
  22. Mohammad, G.; Mohammed, W.; Marzoog, T.R.; Al-Amiery, A.; Kadhumc, A.; Mohamad, A. Green synthesis, antimicrobial and cytotoxic effects of silver nanoparticles using Eucalyptus chapmaniana leaves extract. Asian Pac. J. Trop. Biomed. 2013, 3, 58–63. [Google Scholar]
  23. Gaaz, T.S.; Sulong, A.B.; Kadhum, A.A.H.K.; Nassir, M.H.; Al-Amiery, A.A. Impact of sulfuric acid treatment of halloysite on physico-chemic property modification. Materials 2016, 9, 620. [Google Scholar] [CrossRef]
  24. Gaaz, T.S.; Sulong, A.B.; Akhtar, M.N.; Kadhum, A.A.H.; Mohamad, A.B.; Al-Amiery, A.A. Properties and applications of polyvinyl alcohol, halloysite nanotubes and their nanocomposites. Molecules 2015, 20, 22833–22847. [Google Scholar] [CrossRef] [PubMed]
  25. Wasmi, W.; Al-Amiery, A.; Kadhum, A.; Takriff, M.; Mohamad, A. Synthesis of vanadium pentoxide nanoparticles as catalysts for the ozonation of palm oil. Ozone Sci. Eng. 2016, 38, 36–41. [Google Scholar] [CrossRef]
  26. Obayes, H.; Al-Gebori, A.; Khazaal, S.; Jarad, A.; Alwan, G.; Al-Amiery, A. Hypothetical design of carbon nanotube materials based on [8] circulene. J. Nanoelectron. Optoelectron. 2015, 10, 711–716. [Google Scholar] [CrossRef]
  27. Obayes, H.; Al-Amiery, A.; Jaffar, H.; Musa, A.; Kadhum, A.; Mohamad, A. Theoretical study for the preparation of sub-carbon nano tubes from the cyclic polymerization reaction of two molecules from corannulene, coronene and circulene aromatic compounds. J. Comput. Theor. Nanosci. 2013, 10, 2453–2457. [Google Scholar] [CrossRef]
  28. Wasmi, W.; Al-Amiery, A.; Kadhum, A.; Mohamad, A. Novel approach: Tungsten oxide nanoparticle as a catalyst for malonic acid ester synthesis via ozonolysis. J. Nanomater. 2014, 2014, 1–7. [Google Scholar] [CrossRef]
  29. Seery, M.K.; George, R.; Floris, P.; Pillai, S.C. Silver doped titanium dioxide nanomaterials for enhanced visible light photocatalysis. J. Photochem. Photobiol. A 2007, 189, 258–263. [Google Scholar] [CrossRef]
  30. Pillai, S.C.; Periyat, P.; George, R.; McCormack, D.E.; Seery, M.K.; Hayden, H.; Colreavy, J.; Corr, D.; Hinder, S.J. Synthesis of high-temperature stable anatase TiO2 photocatalyst. J. Phys. Chem. C 2007, 111, 1605–1611. [Google Scholar] [CrossRef] [Green Version]
  31. Dahl, M.; Liu, Y.; Yin, Y. Composite titanium dioxide nanomaterials. Chem. Rev. 2014, 114, 9853–9889. [Google Scholar] [CrossRef] [PubMed]
  32. Vijayalakshmi, R.; Rajendran, V. Synthesis and characterization of nano-TiO2 via different methods. Arch. Appl. Sci. Res. 2012, 4, 1183–1190. [Google Scholar]
  33. Box, J.G.E.P.; Hunter, S.; Hunter, W.G. Statistics for Experimenters: Design, Innovation, and Discovery, 2nd ed.; Wiley Interscience: Hoboken, NJ, USA, 2005. [Google Scholar]
  34. Schleife, A.; Rinke, P.; Bechstedt, F.; Walle, C. Enhanced Optical Absorption Due to Symmetry Breaking in TiO2(1−x) S2x Alloys. J. Phys. Chem. C 2013, 117, 4189–4193. [Google Scholar] [CrossRef]
  35. Karunakaran, C.; Dhanalakshmi, R. Semiconductor-catalyzed degradation of phenols with sunlight. Sol. Energy Mater. Sol. Cells 2008, 92, 1315–1321. [Google Scholar] [CrossRef]
  36. Hassan, M.M.; Ahmed, A.S.; Chaman, M.; Khan, W.; Naqvi, A.H.; Azam, A. Structural and frequency dependent dielectric properties of Fe3+ doped ZnO nanoparticles. Mater. Res. Bull. 2012, 47, 3952–3958. [Google Scholar] [CrossRef]
Figure 1. X-ray diffraction pattern: (a) TiO2; (b) 0.6 wt % Er3+/TiO2; (c) 1.2 wt % Er3+/TiO2; (d) 1.8 wt % Er3+/TiO2; and (e) 2.4 wt % Er3+/TiO2.
Catalysts 06 00163 g001
Figure 2. X-ray diffraction pattern: (a) TiO2; (b) 0.2 wt % Ni2+/TiO2; (c) 0.4 wt % Ni2+/TiO2; (d) 0.6 wt % Ni2+/TiO2; and (e) 0.8 wt % Ni2+/TiO2.
Catalysts 06 00163 g002
Figure 3. Field emission scanning electron microscopy images: (a) TiO2; (b) 0.6 wt % Er3+/TiO2; (c) 1.2 wt % Er3+/TiO2; (d) 1.8 wt % Er3+/TiO2; (e) 2.4 wt % Er3+/TiO2; (f) 0.2 wt % Ni2+/TiO2; (g) 0.4 wt % Ni2+/TiO2; (h) 0.6 wt % Ni2+/TiO2; and (i) 0.8 wt % Ni2+/TiO2.
Catalysts 06 00163 g003
Figure 4. Energy dispersive X-ray spectra: (a) 0.6 wt % Er3+/TiO2; (b) 1.2 wt % Er3+/TiO2; (c) 1.8 wt % Er3+/TiO2; (d) 2.4 wt % Er3+/TiO2; (e) 0.2 wt % Ni2+/TiO2; (f) 0.4 wt % Ni2+/TiO2; (g) 0.6 wt % Ni2+/TiO2; and (h) 0.8 wt % Ni2+/TiO2. Red circle: Er3+; green circle: Ni2+.
Catalysts 06 00163 g004
Figure 5. Metal mapping (a) Er3+/TiO2 and (b) Ni2+/TiO2.
Catalysts 06 00163 g005
Figure 6. Ultraviolet visible spectra: (a) Er3+/TiO2 nano-particles (NPs) and (b) Ni2+/TiO2 NPs.
Catalysts 06 00163 g006
Figure 7. Direct band gap energy (Eg) calculation.
Catalysts 06 00163 g007
Figure 8. Diagnostic plots of the photocatalytic degradation efficiency percentage (DE%) for the optimization process. (a) Studentized residual; (b) Residual vs. predicted; (c) Outlier; (d) Actual vs. predicted; and (e) Residual vs. Run.
Catalysts 06 00163 g008
Figure 9. Photocatalytic degradation of chloroxylenol using TiO2 NPs under optimal conditions.
Catalysts 06 00163 g009
Figure 10. Plot of the pseudo-first order rate constant of photocatalytic degradation of chloroxylenol using TiO2 NPs under optimal conditions.
Catalysts 06 00163 g010
Figure 11. DE% of chloroxylenol using different wt % of Er3+/TiO2.
Catalysts 06 00163 g011
Figure 12. DE% of chloroxylenol using different wt % of Ni2+/TiO2.
Catalysts 06 00163 g012
Table 1. Intensity of all peaks of TiO2 and Er/TiO2.
Intensity (Arbitrary Unit, a.u.)
TiO20.6 wt % Er/TiO21.2 wt % Er/TiO21.8 wt % Er/TiO22.4 wt % Er/TiO2
25.271221581984191118791855
27.4136515498493481474
37.30381271051009090
48.0908555536481478473
53.8206311310288262230
53.97379368351346336
55.116367340313291283
62.7142292285272249241
68.8675165149143131120
70.2128145114109108104
75.0956185164163151147
Table 2. Intensity of all peaks of TiO2 and Ni/TiO2.
Intensity (Arbitrary Unit, a.u.)
TiO20.2 wt % Ni/TiO20.4 wt % Ni/TiO20.6 wt % Ni/TiO20.8 wt % Ni/TiO2
25.271221581964192218661834
27.4136515504464440410
37.3038127110100108108
48.0908555536514509483
53.8206311284284282270
53.9700379348347343316
55.1160367334329319294
62.7142292254254253242
68.8675165144138133108
70.2128145122113111106
75.0956185178160156141
Table 3. Catalyst crystallite size of TiO2 with several wt % of Er3+ and Ni2+.
SampleCrystallite (nm)
TiO228.72
0.6 wt % Er3+/TiO228.84
1.2 wt % Er3+/TiO231.53
1.8 wt % Er3+/TiO233.93
2.4 wt % Er3+/TiO235.93
0.2 wt % Ni2+/TiO228.98
0.4 wt % Ni2+/TiO230.84
0.6 wt % Ni2+/TiO231.10
0.8 wt % Ni2+/TiO231.51
Table 4. Calculated and actual wt % of Er and Ni on TiO2 surface using energy dispersive X-ray (EDX).
SampleCalculated Metal (wt %)Actual Metal (wt %) by EDX
0.6 wt % Er3+/TiO20.60.72
1.2 wt % Er3+/TiO21.21.31
1.8 wt % Er3+/TiO21.82.06
2.4 wt % Er3+/TiO22.42.45
0.2 wt % Ni2+/TiO20.20.16
0.4 wt % Ni2+/TiO20.40.31
0.6 wt % Ni2+/TiO20.60.59
0.8 wt % Ni2+/TiO20.80.74
Table 5. Band gap (Eg) of TiO2 with several wt % of Er3+ and Ni2+
SampleBand Gap Energy (eV)
TiO23.13 ± 0.02
0.6 wt % Er3+/TiO23.20 ± 0.02
1.2 wt % Er3+/TiO23.00 ± 0.02
1.8 wt % Er3+/TiO22.63 ± 0.02
2.4 wt % Er3+/TiO22.70 ± 0.02
0.2 wt % Ni2+/TiO22.60 ± 0.02
0.4 wt % Ni2+/TiO22.50 ± 0.02
0.6 wt % Ni2+/TiO22.47 ± 0.02
0.8 wt % Ni2+/TiO22.61 ± 0.02
Table 6. Actual and predicted values of photocatalytic degradation efficiency percentage (DE%) of chloroxylenol.
StandardRun NumberA: Catalyst Loading (g/L)B: pHC: Concentartion (mg/L)DE% (Actual)DE% (Predicted)
18145086.7584.48
291610050.1249.99
331815042.945.29
422410054.5556.94
562615049.6547.38
65285087.6987.56
743415052.3152.18
87365085.187.49
913810060.1357.86
Table 7. ANOVA analysis results for photocatalytic degradation of chloroxylenol 1.
SourceSum of SquaresDegree of FreedomMean SquareF-Valuep-Value
Model2570.936428.4926.250.0371
A54.95227.481.680.3722
B13.2226.610.400.7120
C2502.7521251.3876.660.0129
Residual32.65216.32
1 Significant at p-value < 0.05, R 2 = 0.9875, R adj 2 = 0.9499, Standard Deviation = 4.04, mean = 63.25, Coefficient of Variation = 6.39, press = 660.50, adequacy precision = 11.87. ANOVA, analysis of variance.
Table 8. Results of experimental runs for model validation.
Number of ExperimentCatalyst Loading (g/L)pHConcentration (mg/L)DE%
1345089.57
2345088.21
3345087.67
Table 9. Factors and their levels.
Independent VariableFactorLevel
−10+1
Catalyst loadingA123
pHB468
Initial concentrationC50100150
Table 10. Experimental plan using the L9 (34) orthogonal array.
StandardRun NumberA: Catalyst Loading (g/L)B: pHC: Concentration (mg/L)
181450
2916100
3318150
4224100
5626150
652850
7434150
873650
9138100

