
Pt/MOx/SiO2, Pt/MOx/TiO2, and Pt/MOx/Al2O3 Catalysts for CO Oxidation


Abstract
:1. Introduction
2. Results and Discussion
2.1. Effect of Pretreatment in 4% H2/He
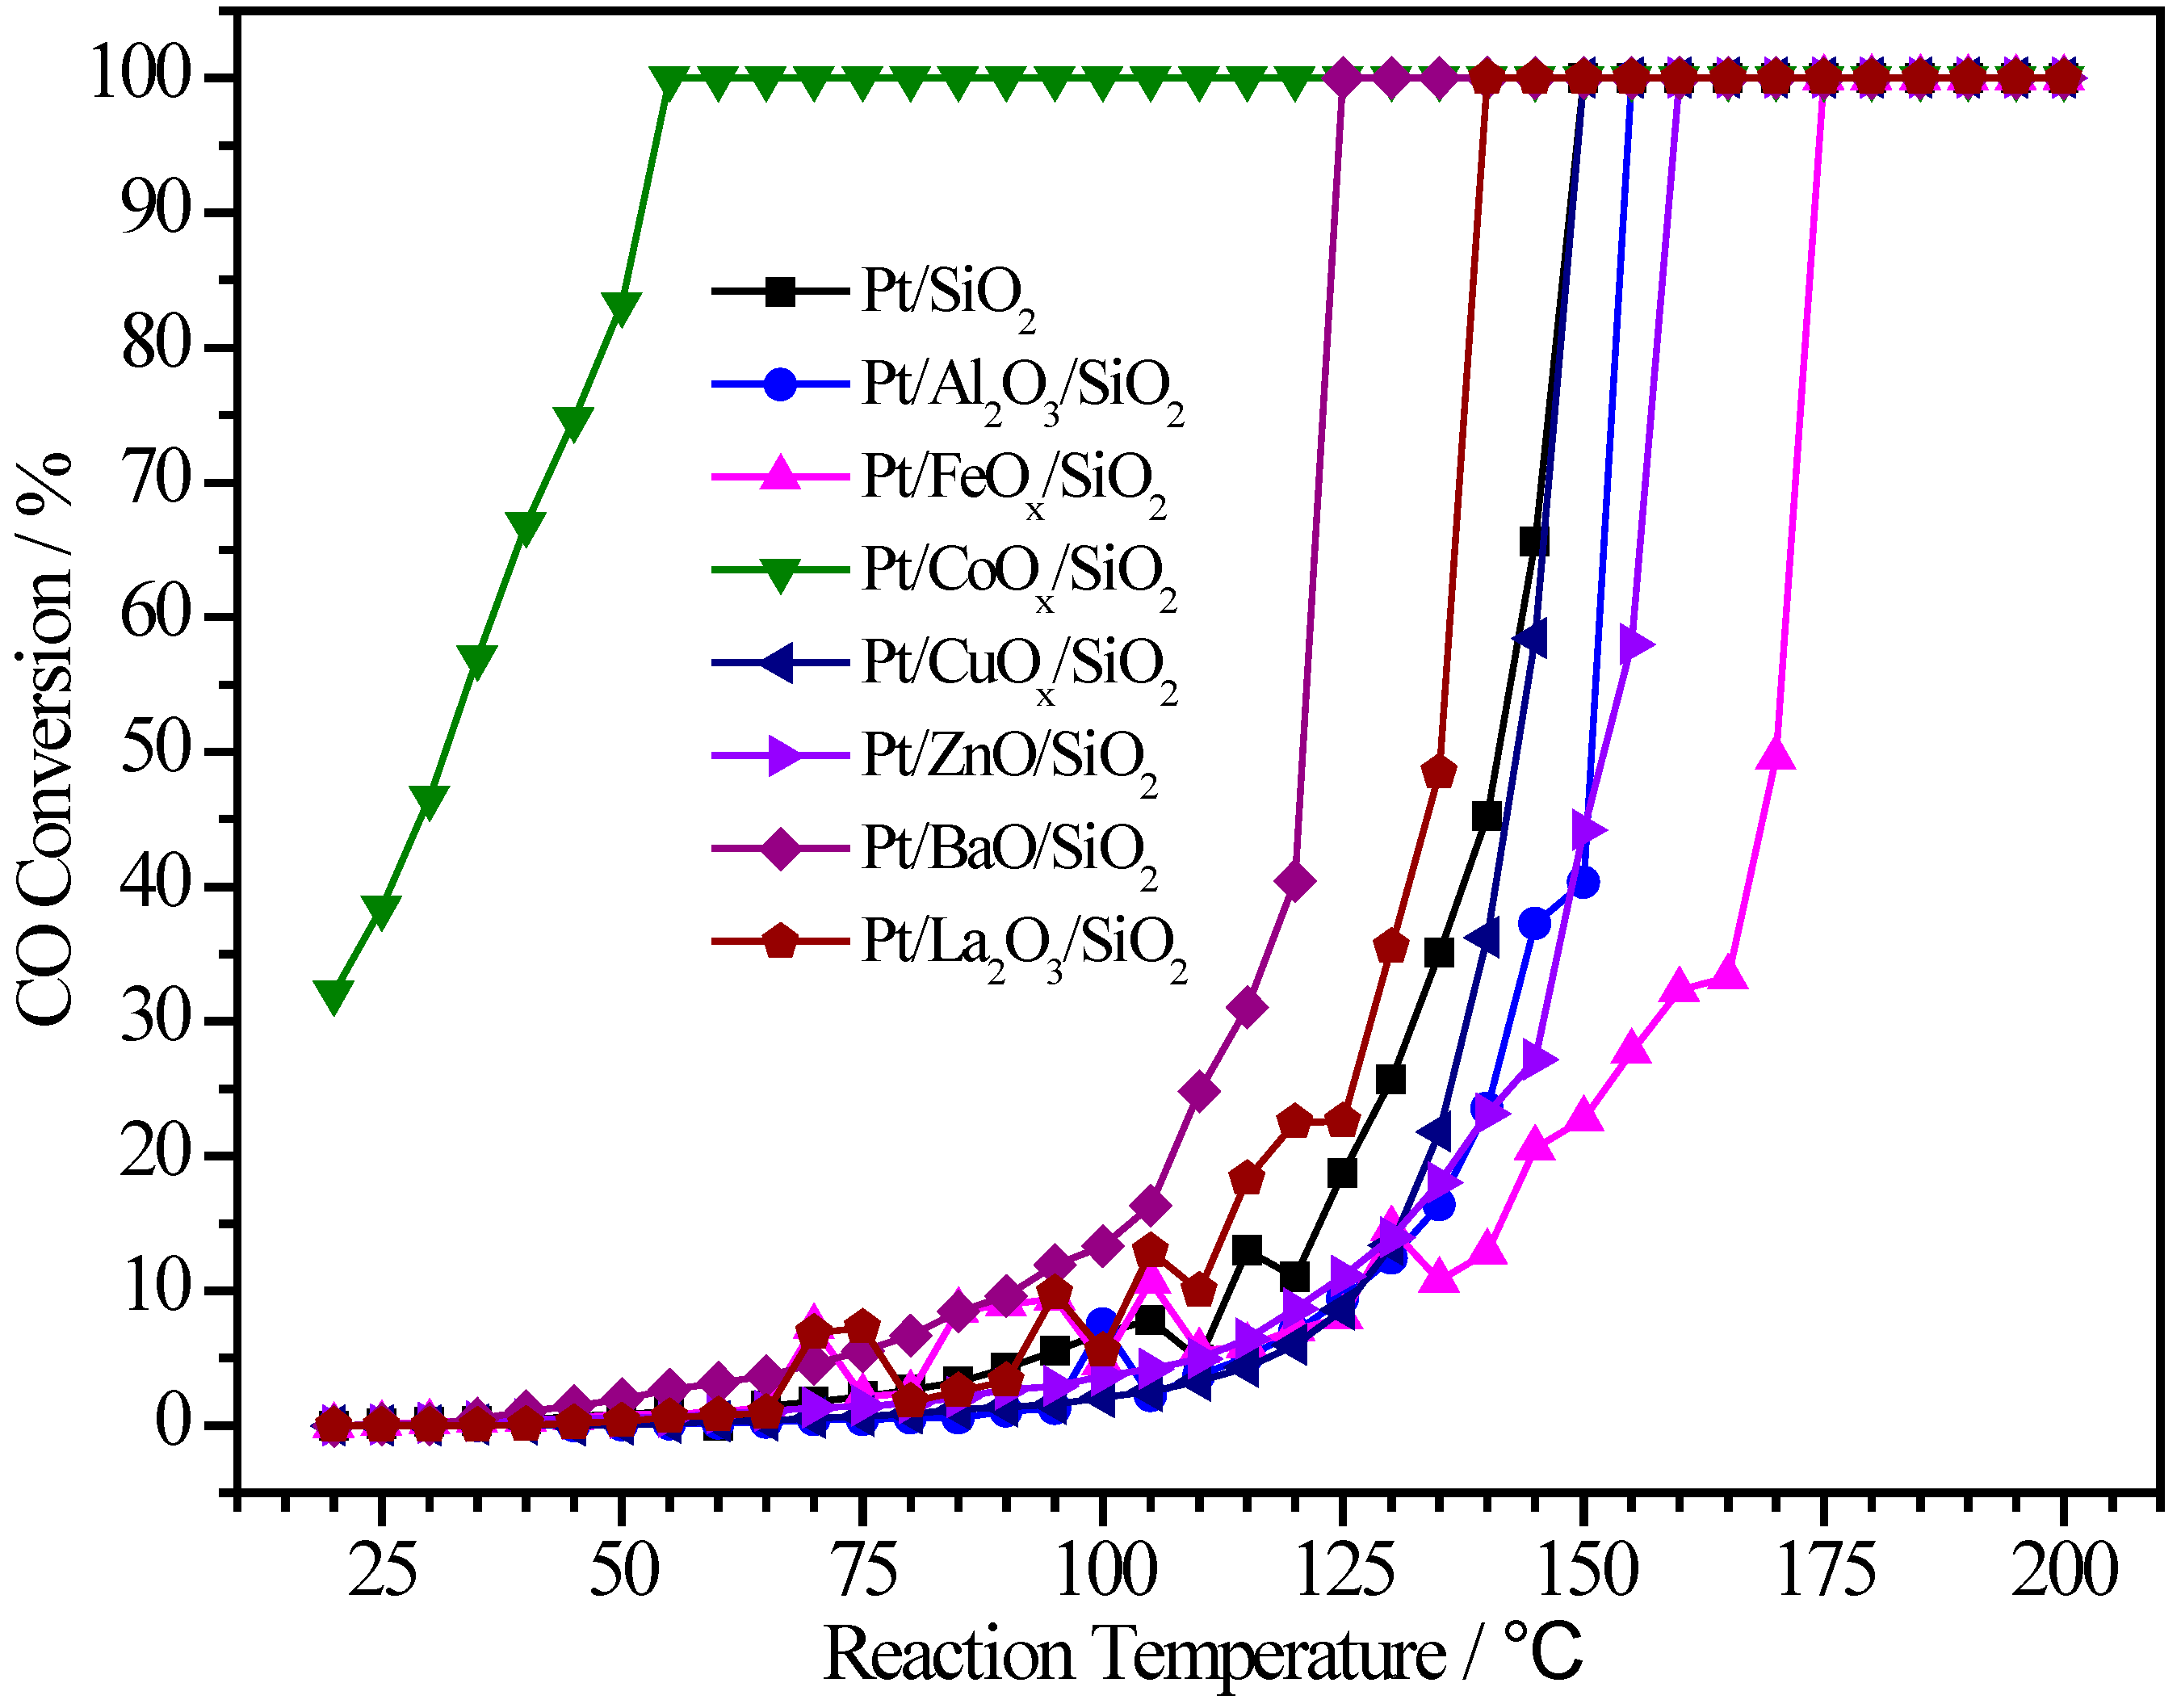
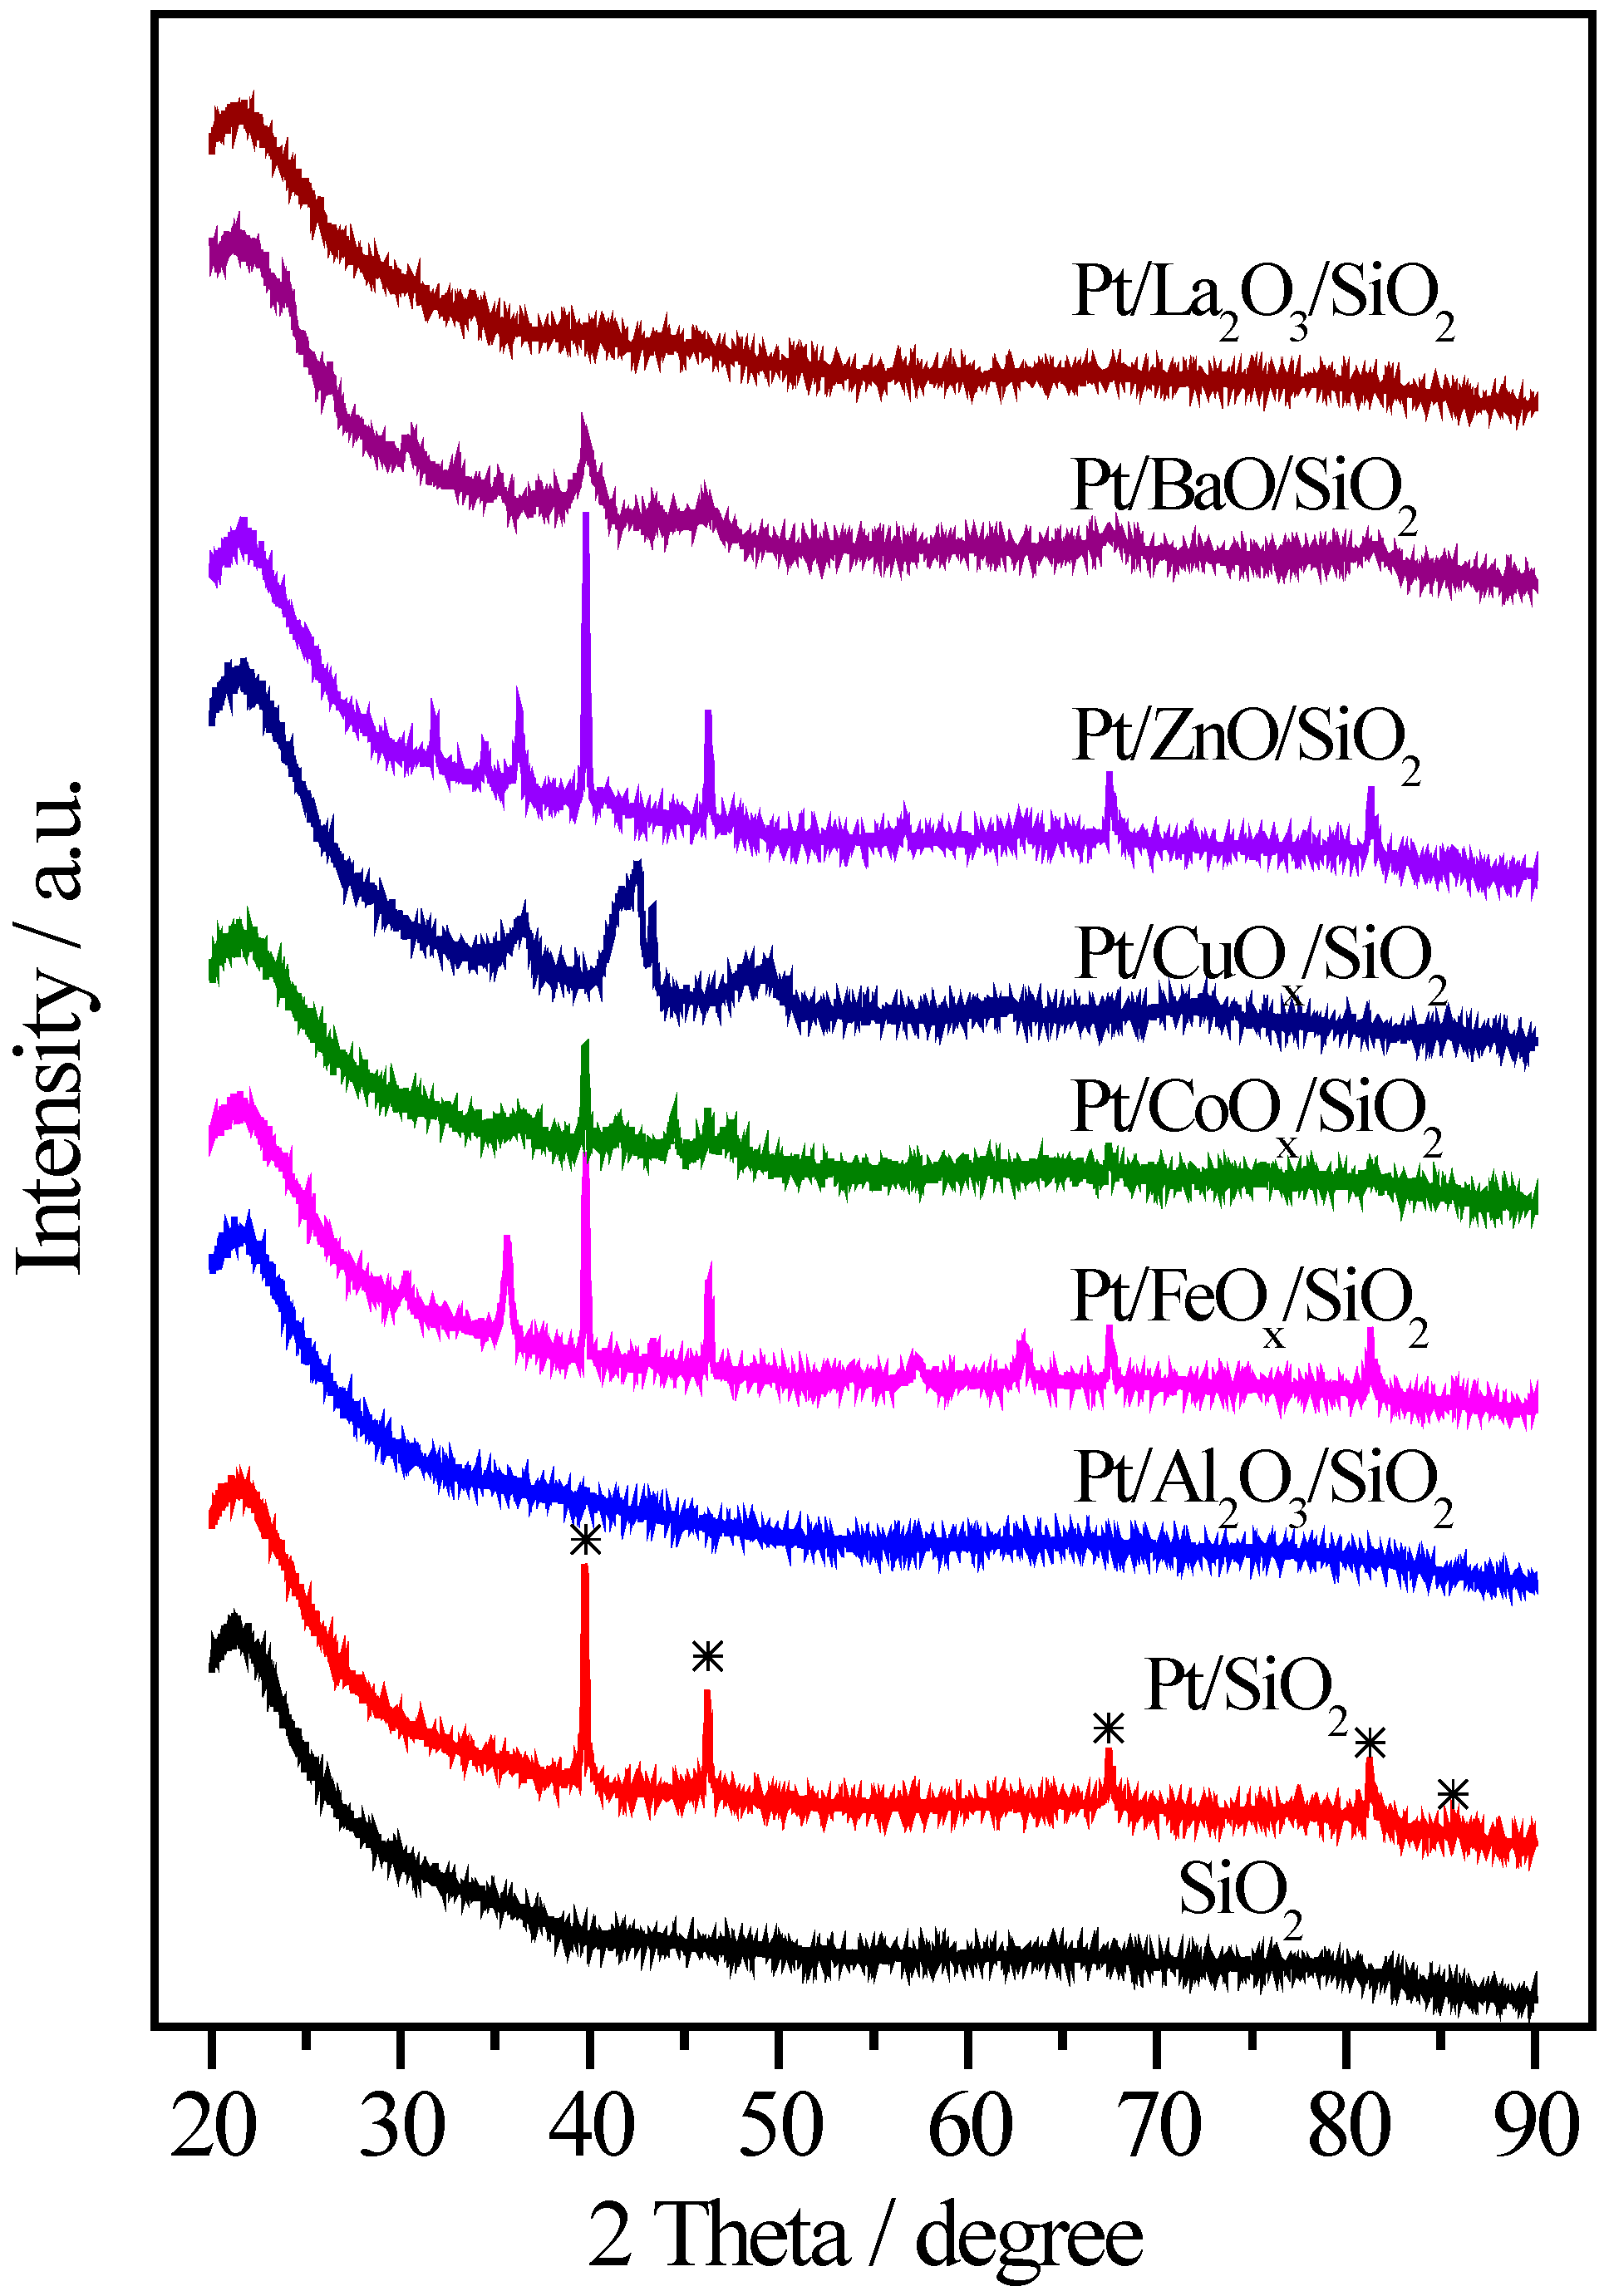
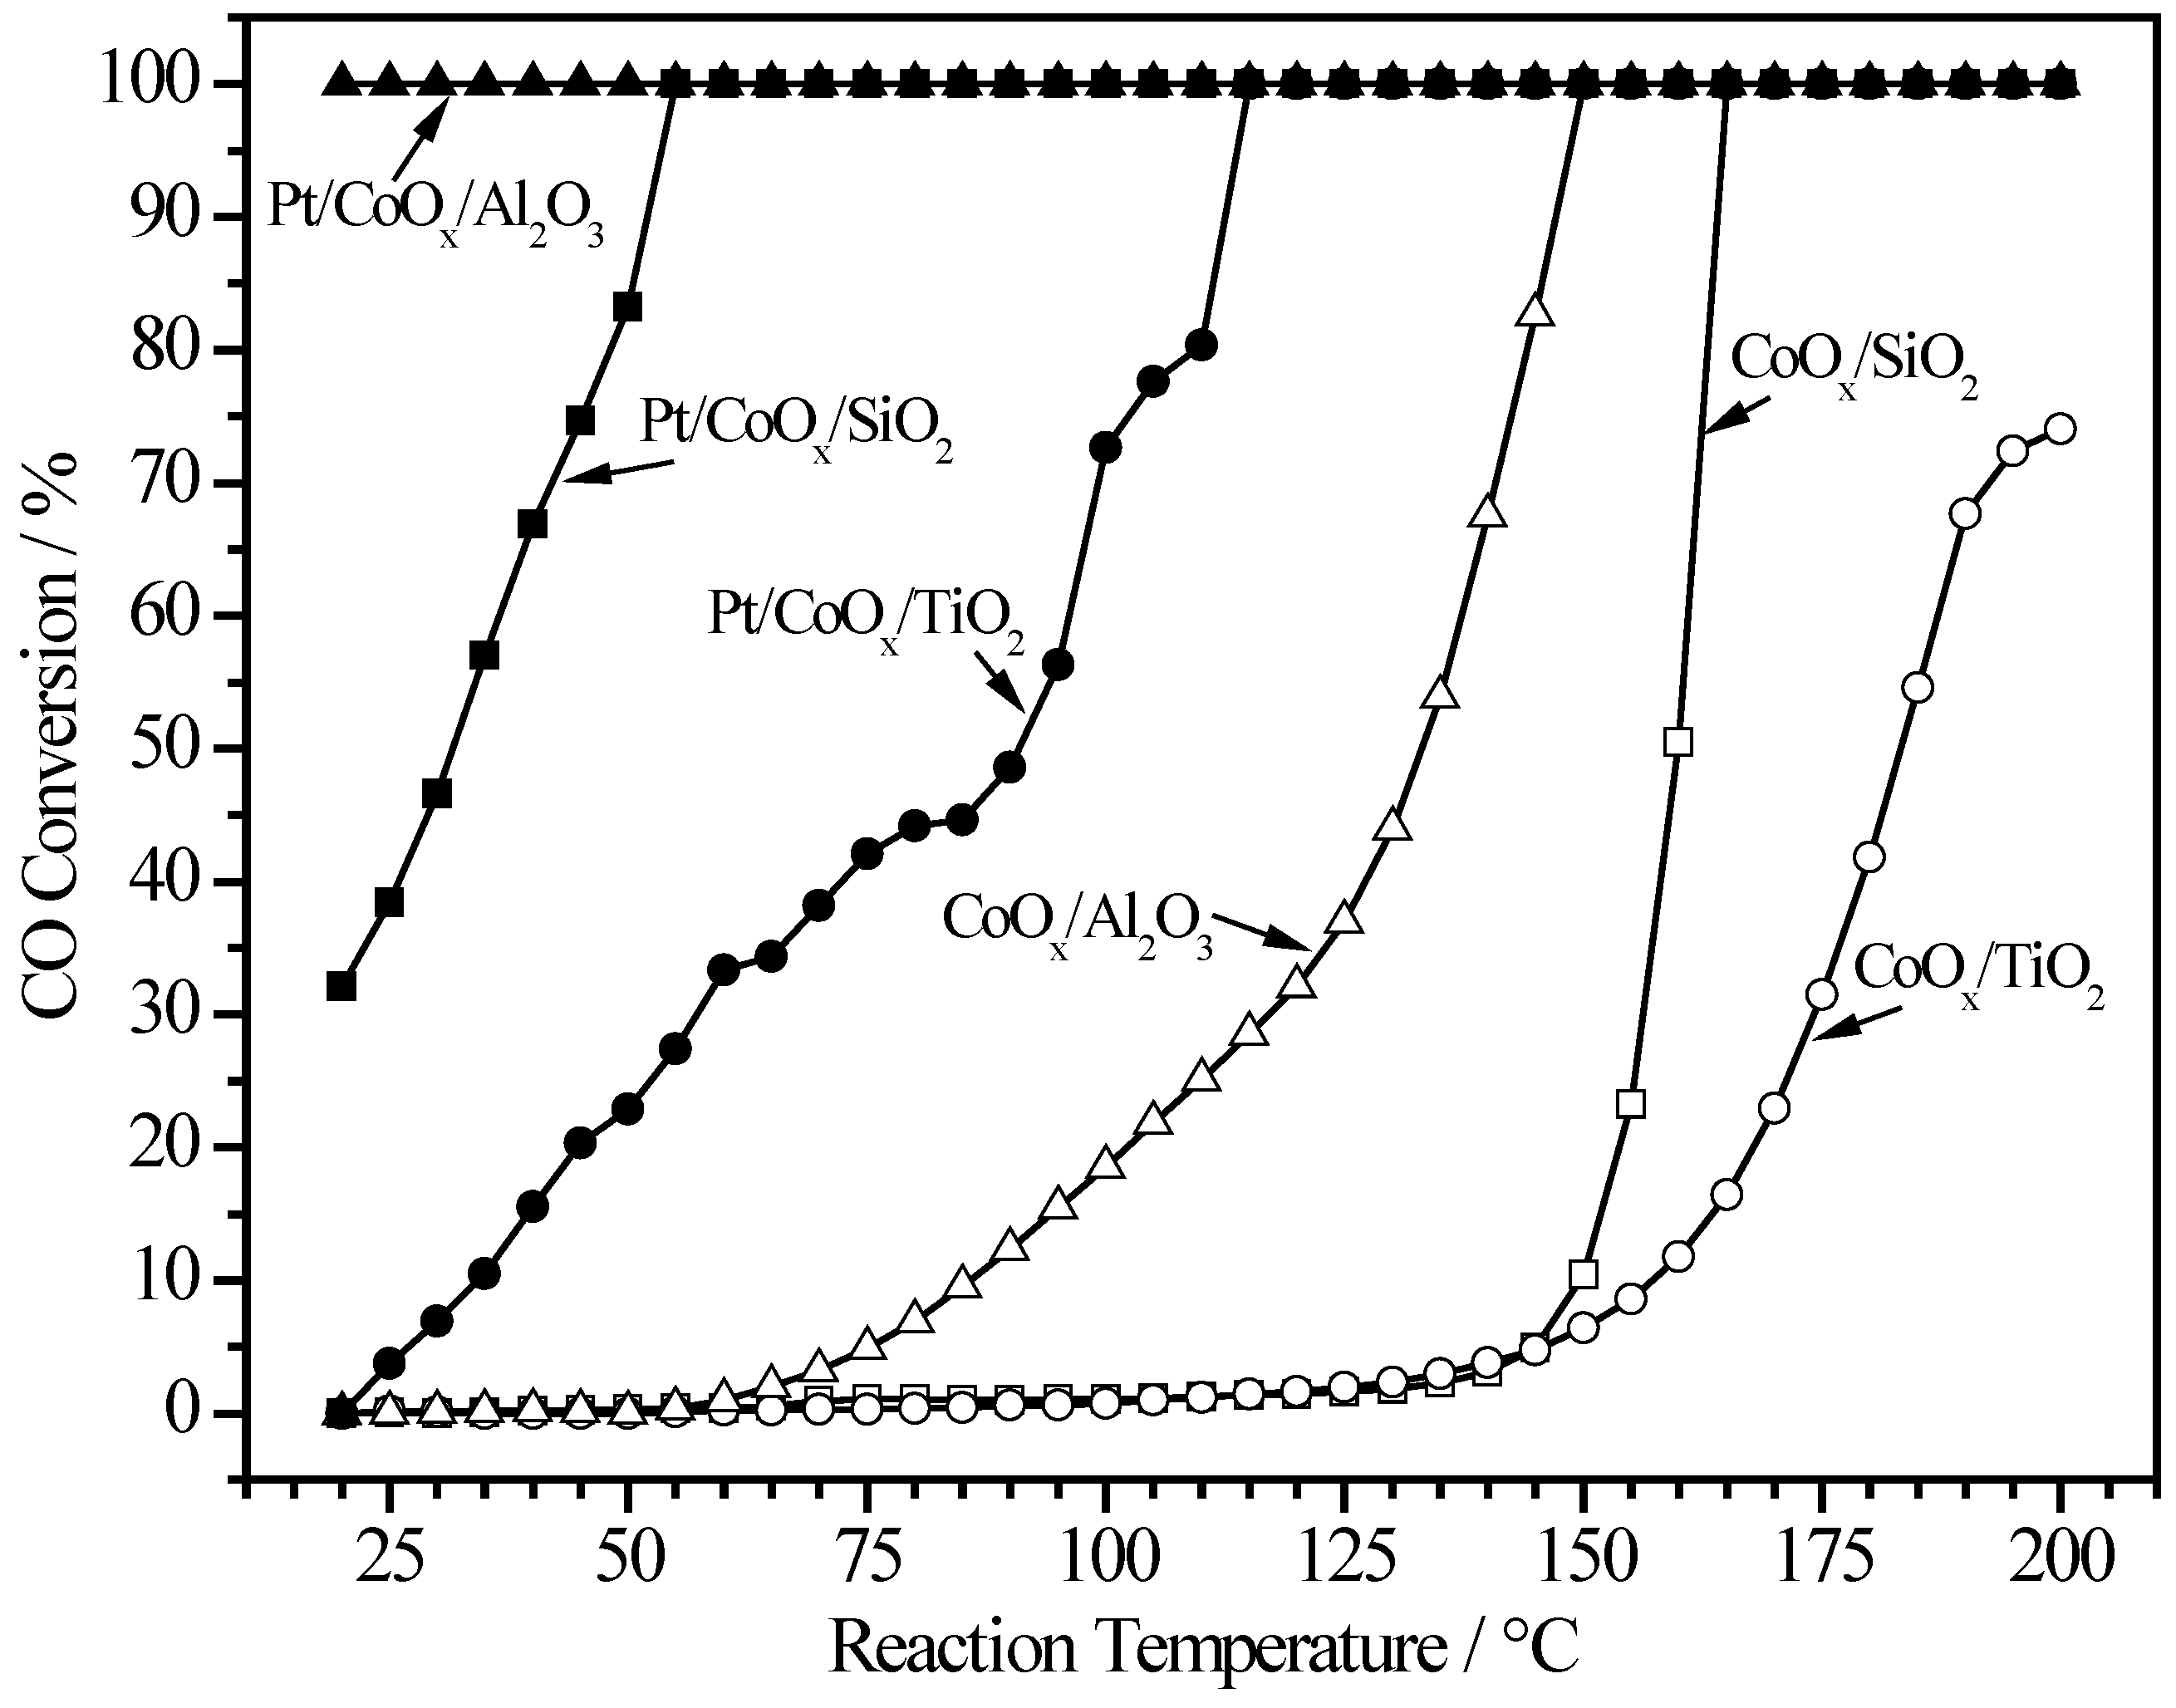
2.2. Pt/MOx/SiO2 Catalysts


| Sample | Pt (wt.%) | M (wt.%) | Atomic Pt:M | T50 (°C) | T100 (°C) |
|---|---|---|---|---|---|
| Pt/SiO2 | 0.90 | - | 1:0 | 141 | 150 |
| Pt/Al2O3/SiO2 | 1.78 | 2.34 | 1:9.5 | 151 | 155 |
| Pt/FeOx/SiO2 | 0.95 | 1.14 | 1:4.2 | 170 | 175 |
| Pt/CoOx/SiO2 | 0.48 | 1.80 | 1:12.4 | 32 | 55 |
| Pt/CuOx/SiO2 | 0.31 | 2.42 | 1:24 | 143 | 150 |
| Pt/ZnO/SiO2 | 0.96 | 2.65 | 1:8.2 | 151 | 160 |
| Pt/BaO/SiO2 | 0.46 | 4.40 | 1:13.6 | 121 | 125 |
| Pt/La2O3/SiO2 | 1.00 | 2.34 | 1:3.3 | 136 | 140 |
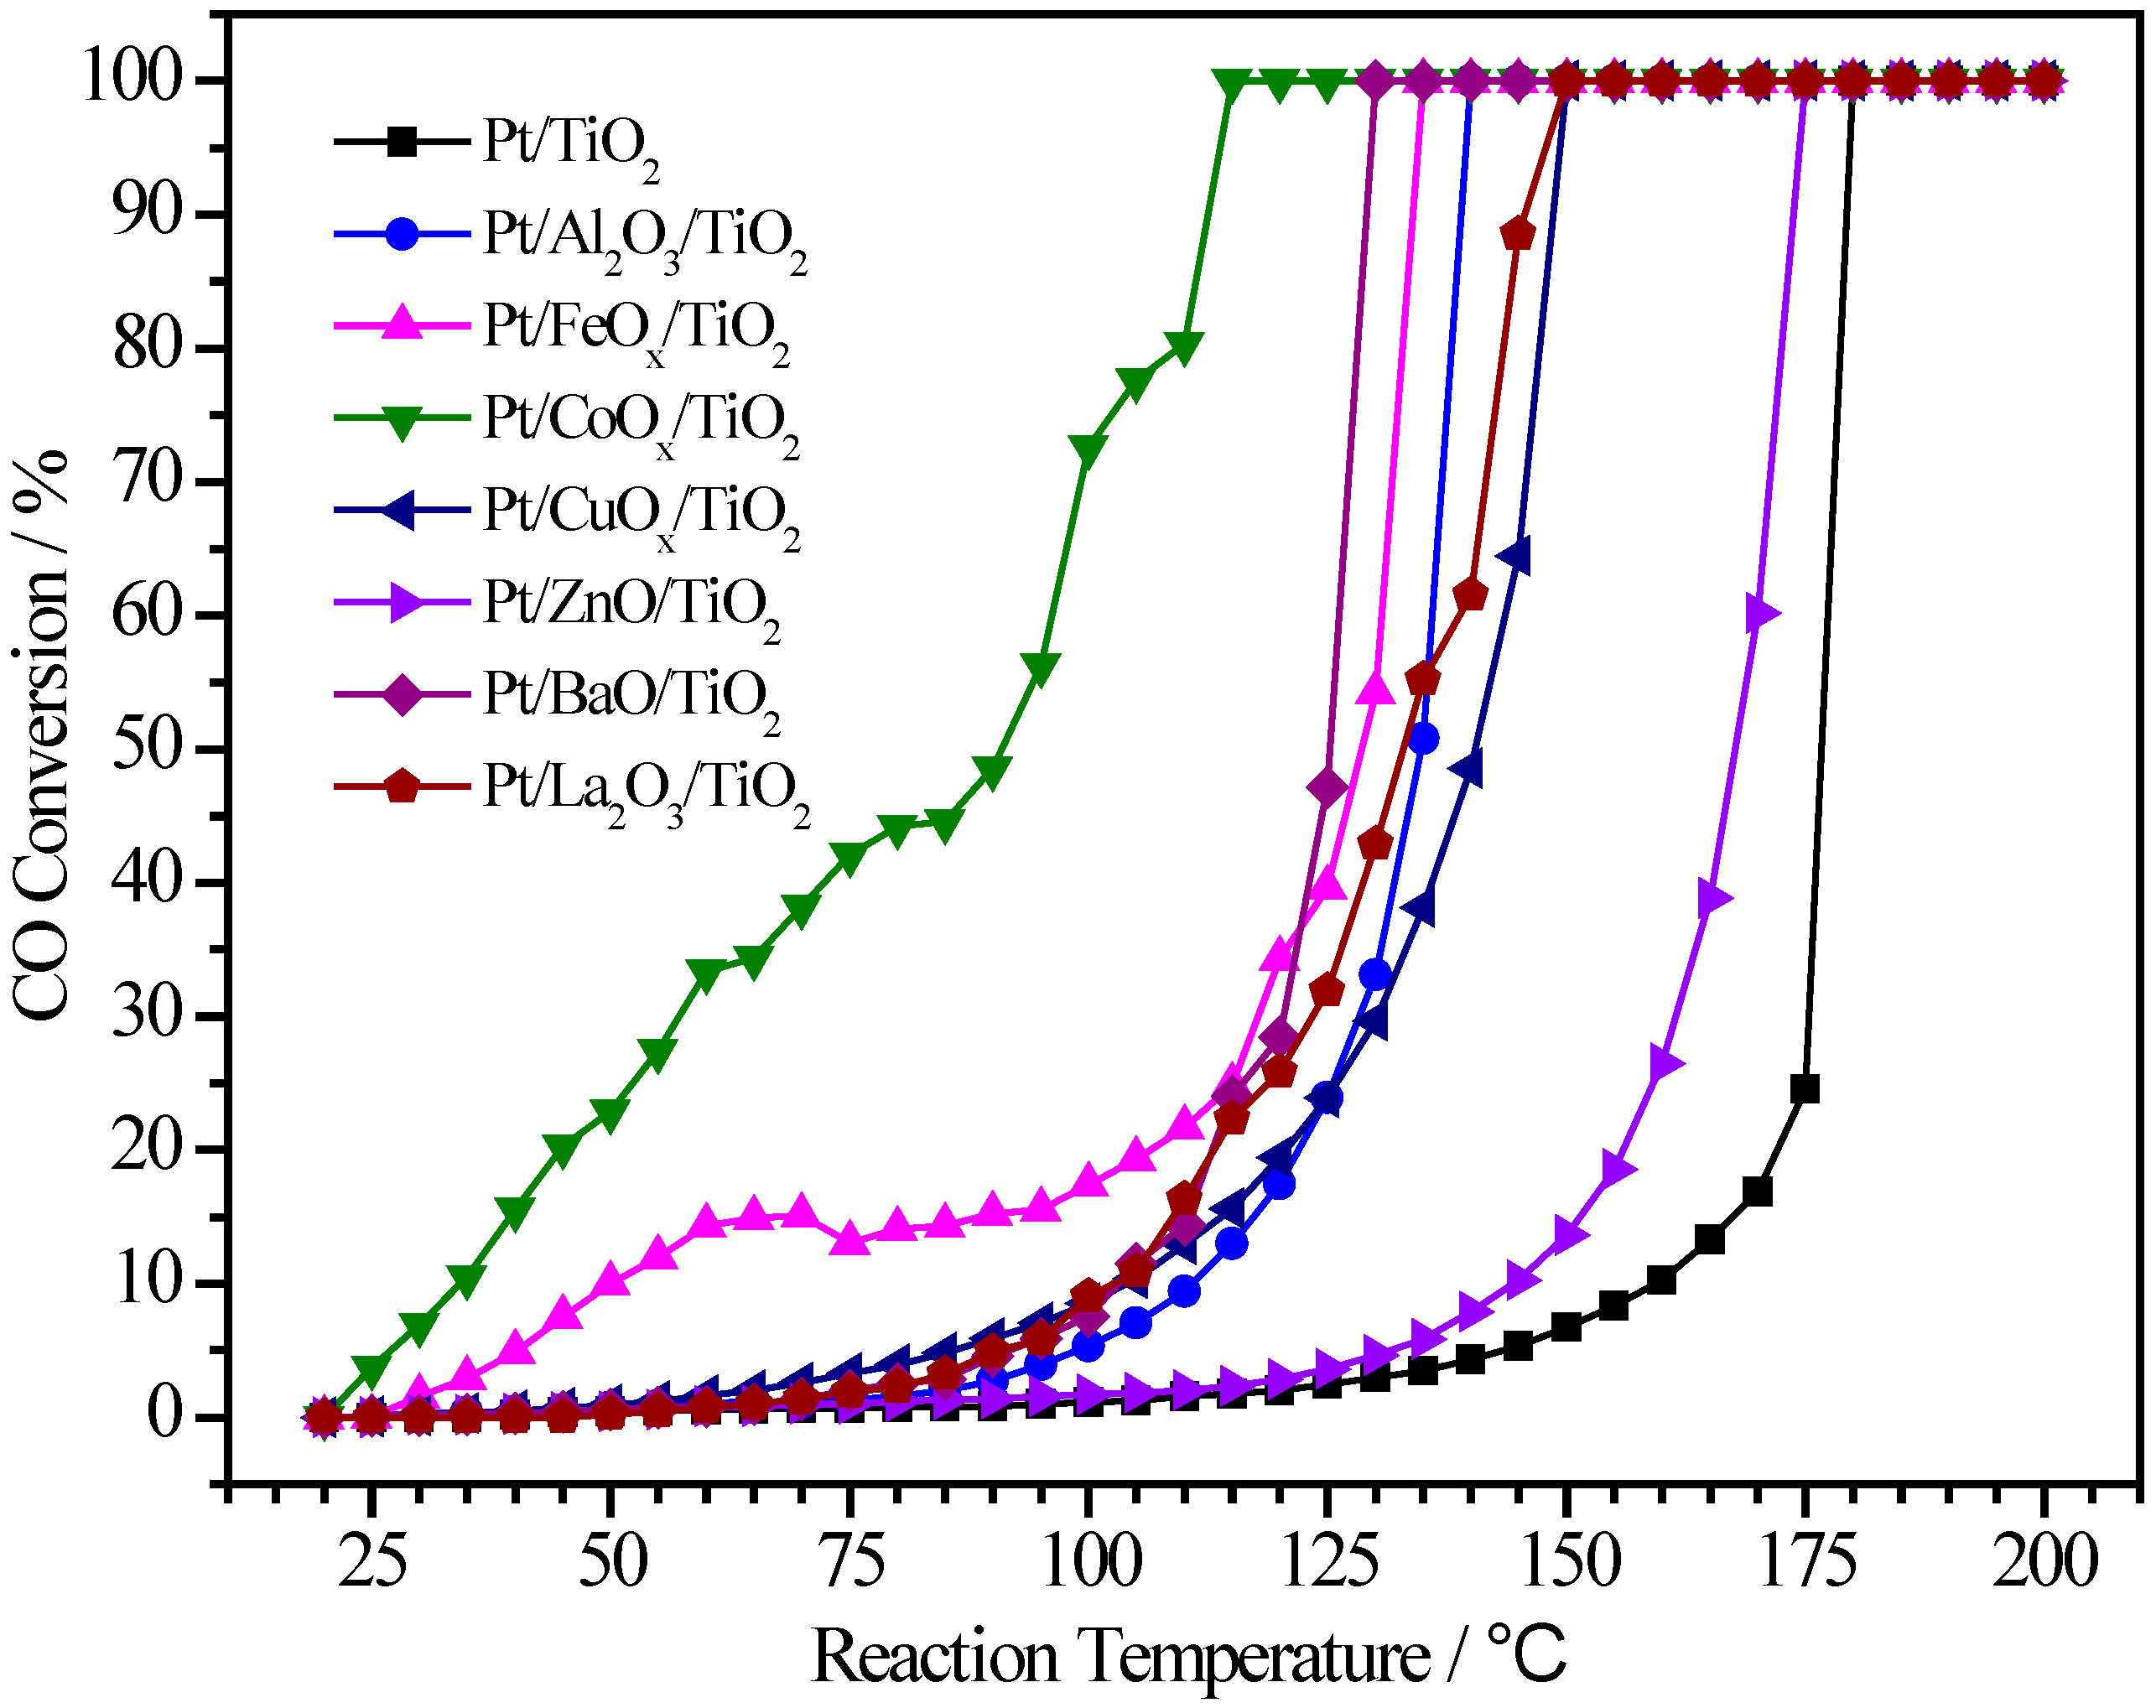
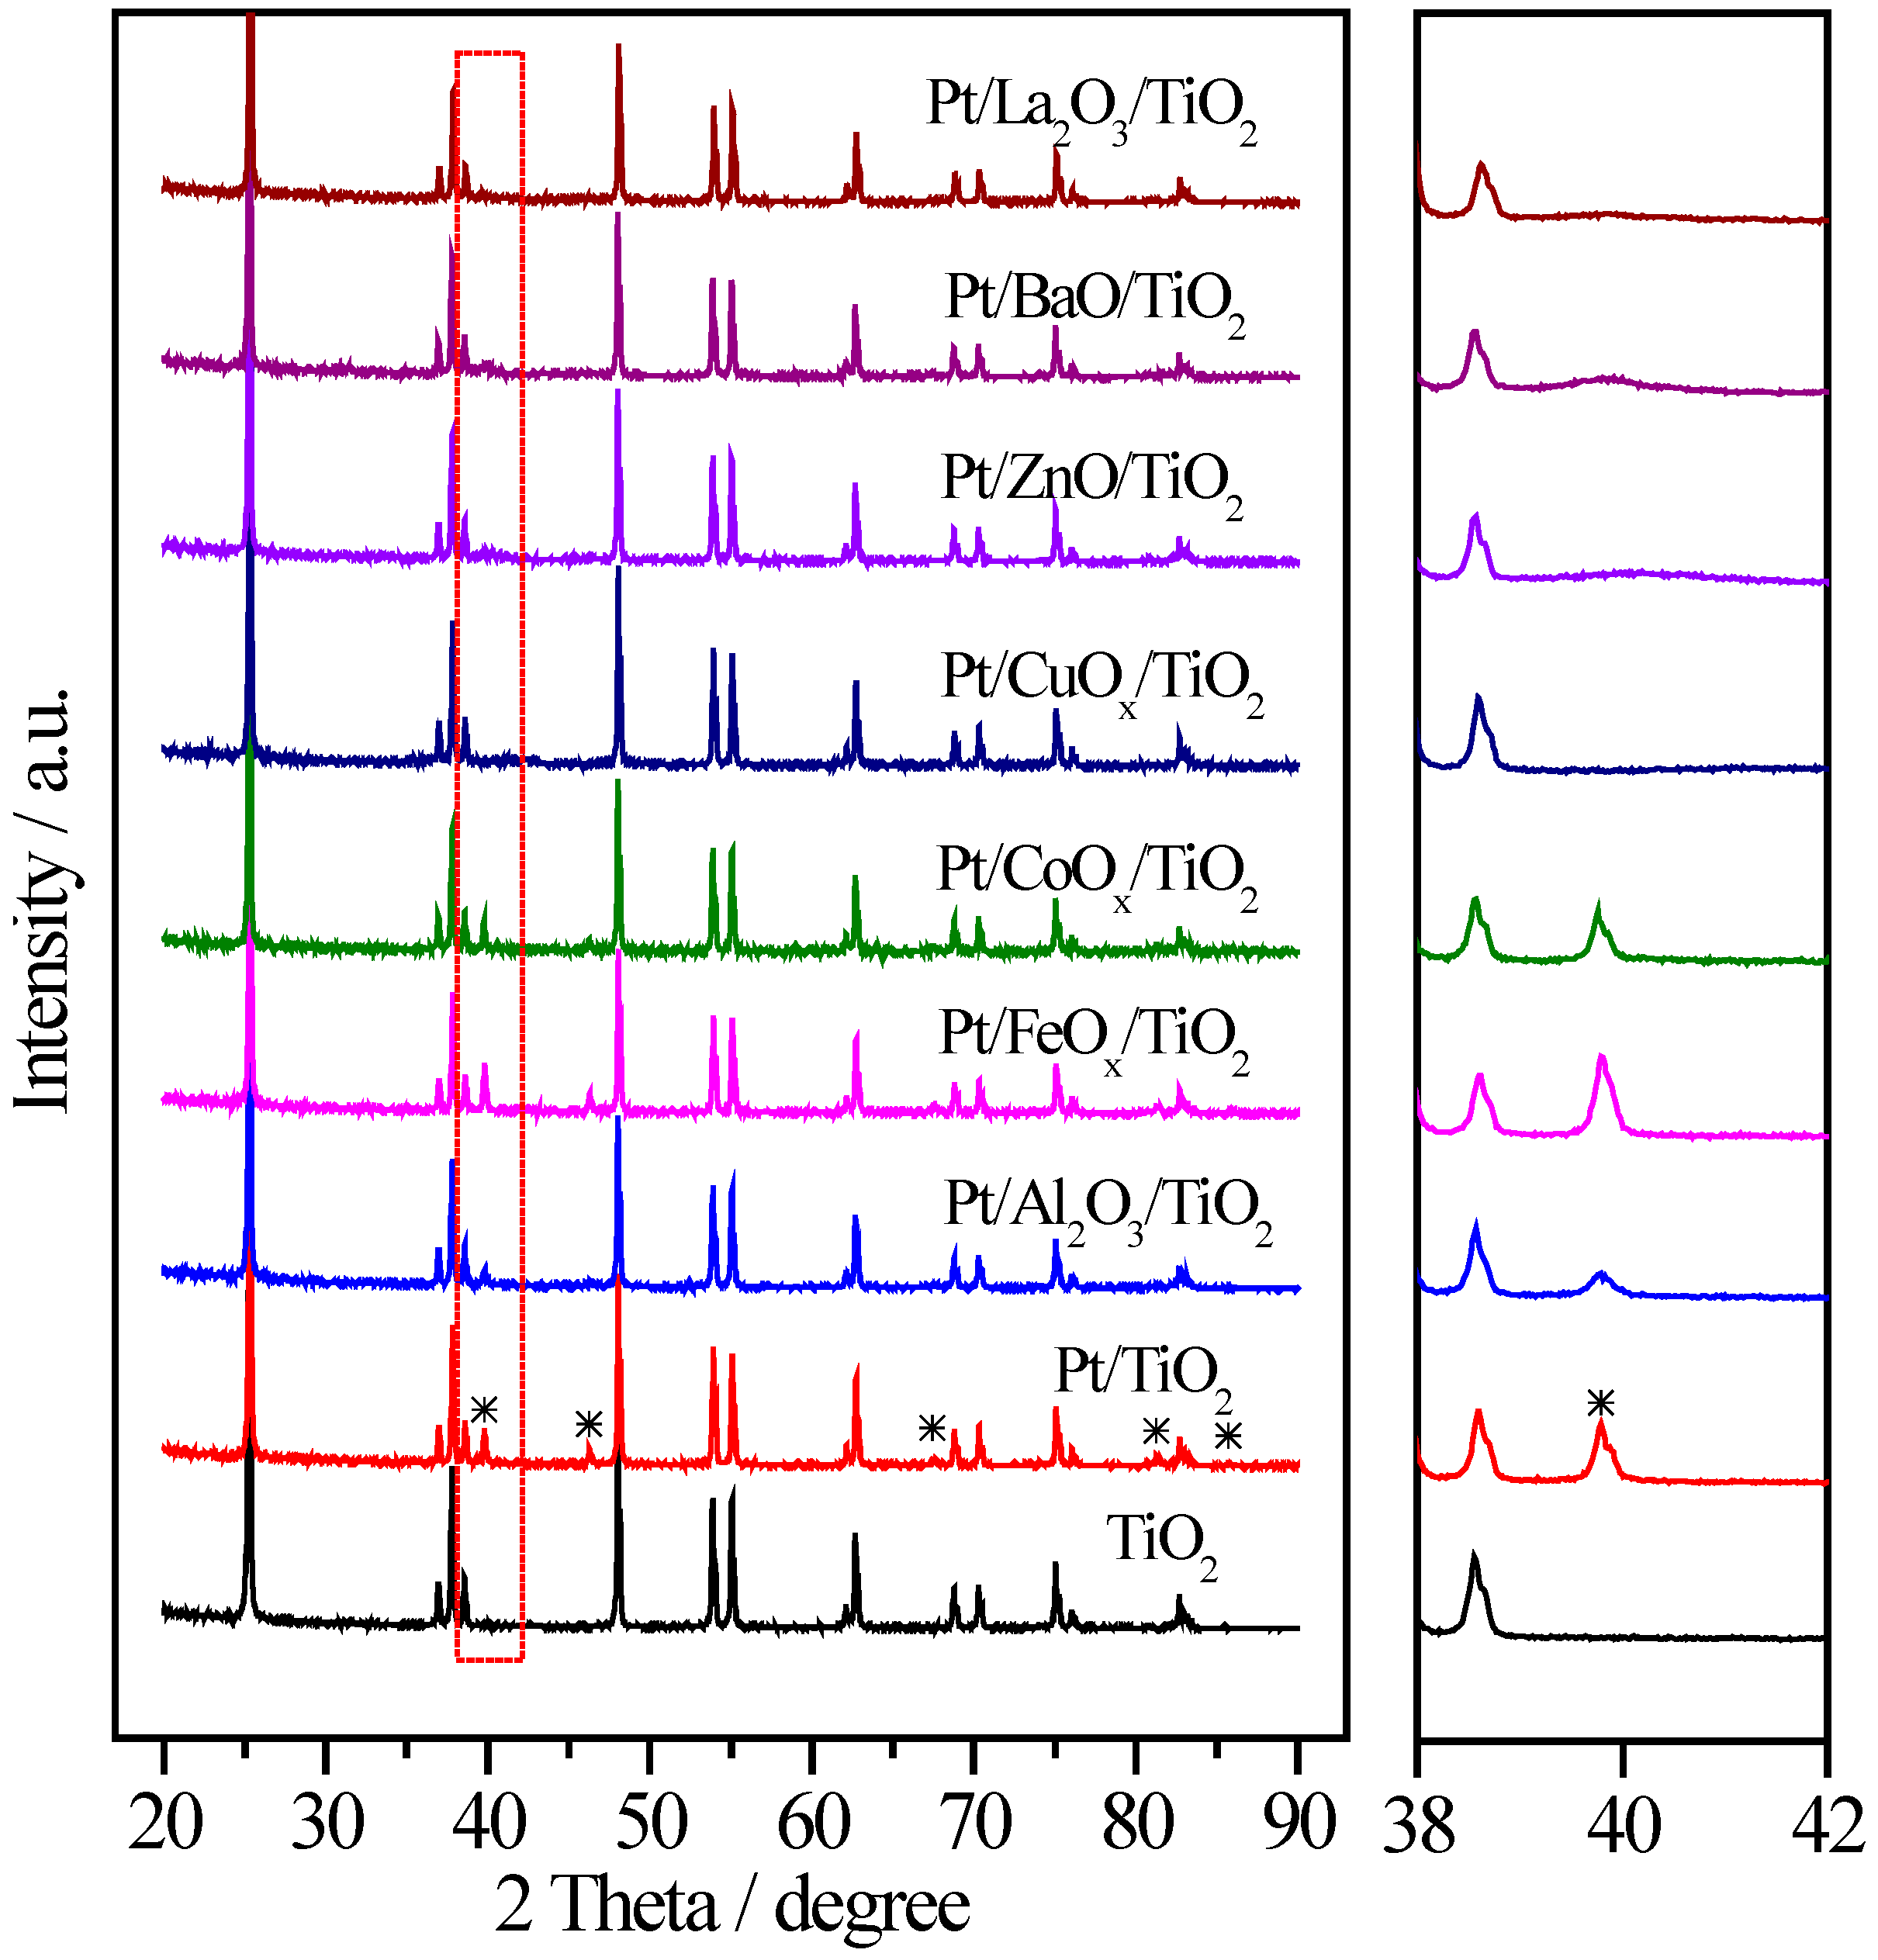
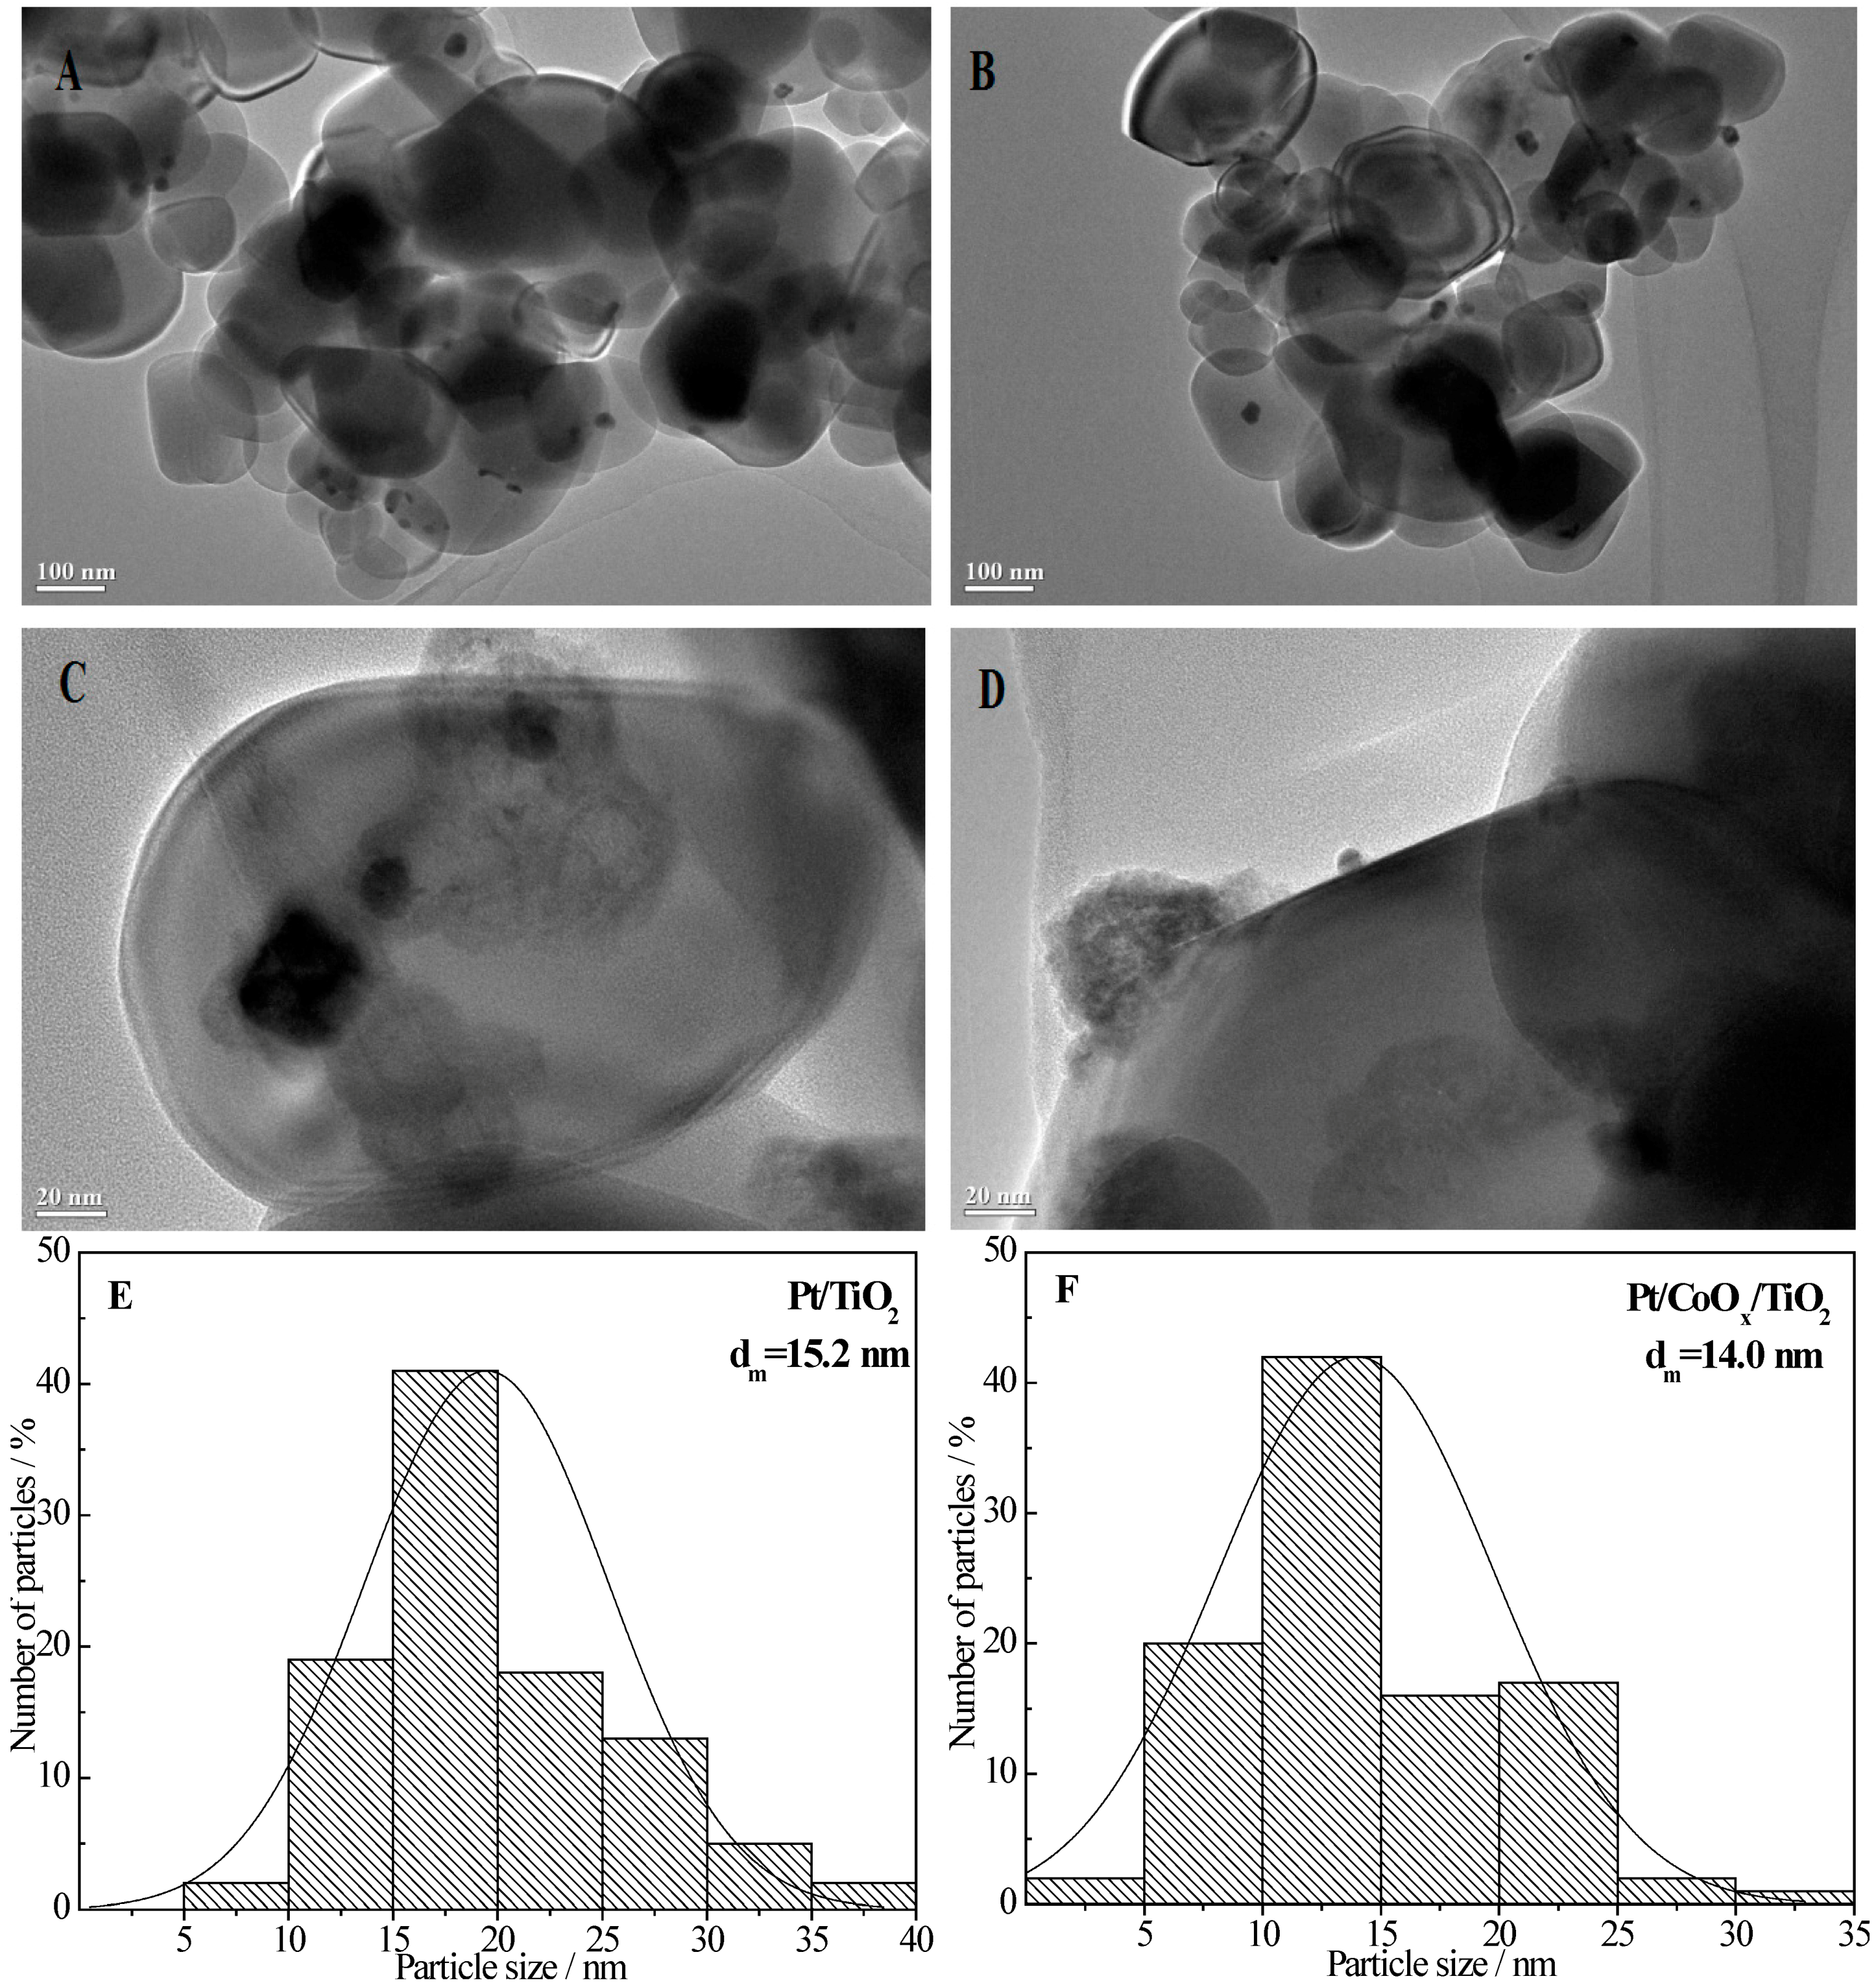
2.3. Pt/MOx/TiO2 Catalysts


| Sample | Pt (wt.%) | M (wt.%) | Atomic Pt:M | T50 (°C) | T100 (°C) |
|---|---|---|---|---|---|
| Pt/TiO2 | 1.20 | - | 1:0 | 176 | 180 |
| Pt/Al2O3/TiO2 | 1.50 | 2.40 | 1:11.6 | 135 | 140 |
| Pt/FeOx/TiO2 | 1.74 | 2.90 | 1:5.8 | 128 | 135 |
| Pt/CoOx/TiO2 | 0.90 | 2.79 | 1:10.2 | 91 | 115 |
| Pt/CuOx/TiO2 | 1.64 | 3.66 | 1:6.8 | 140 | 150 |
| Pt/ZnO/TiO2 | 1.68 | 3.26 | 1:5.8 | 167 | 175 |
| Pt/BaO/TiO2 | 1.67 | 3.54 | 1:3.0 | 126 | 130 |
| Pt/La2O3/TiO2 | 1.20 | 3.02 | 1:3.5 | 133 | 150 |
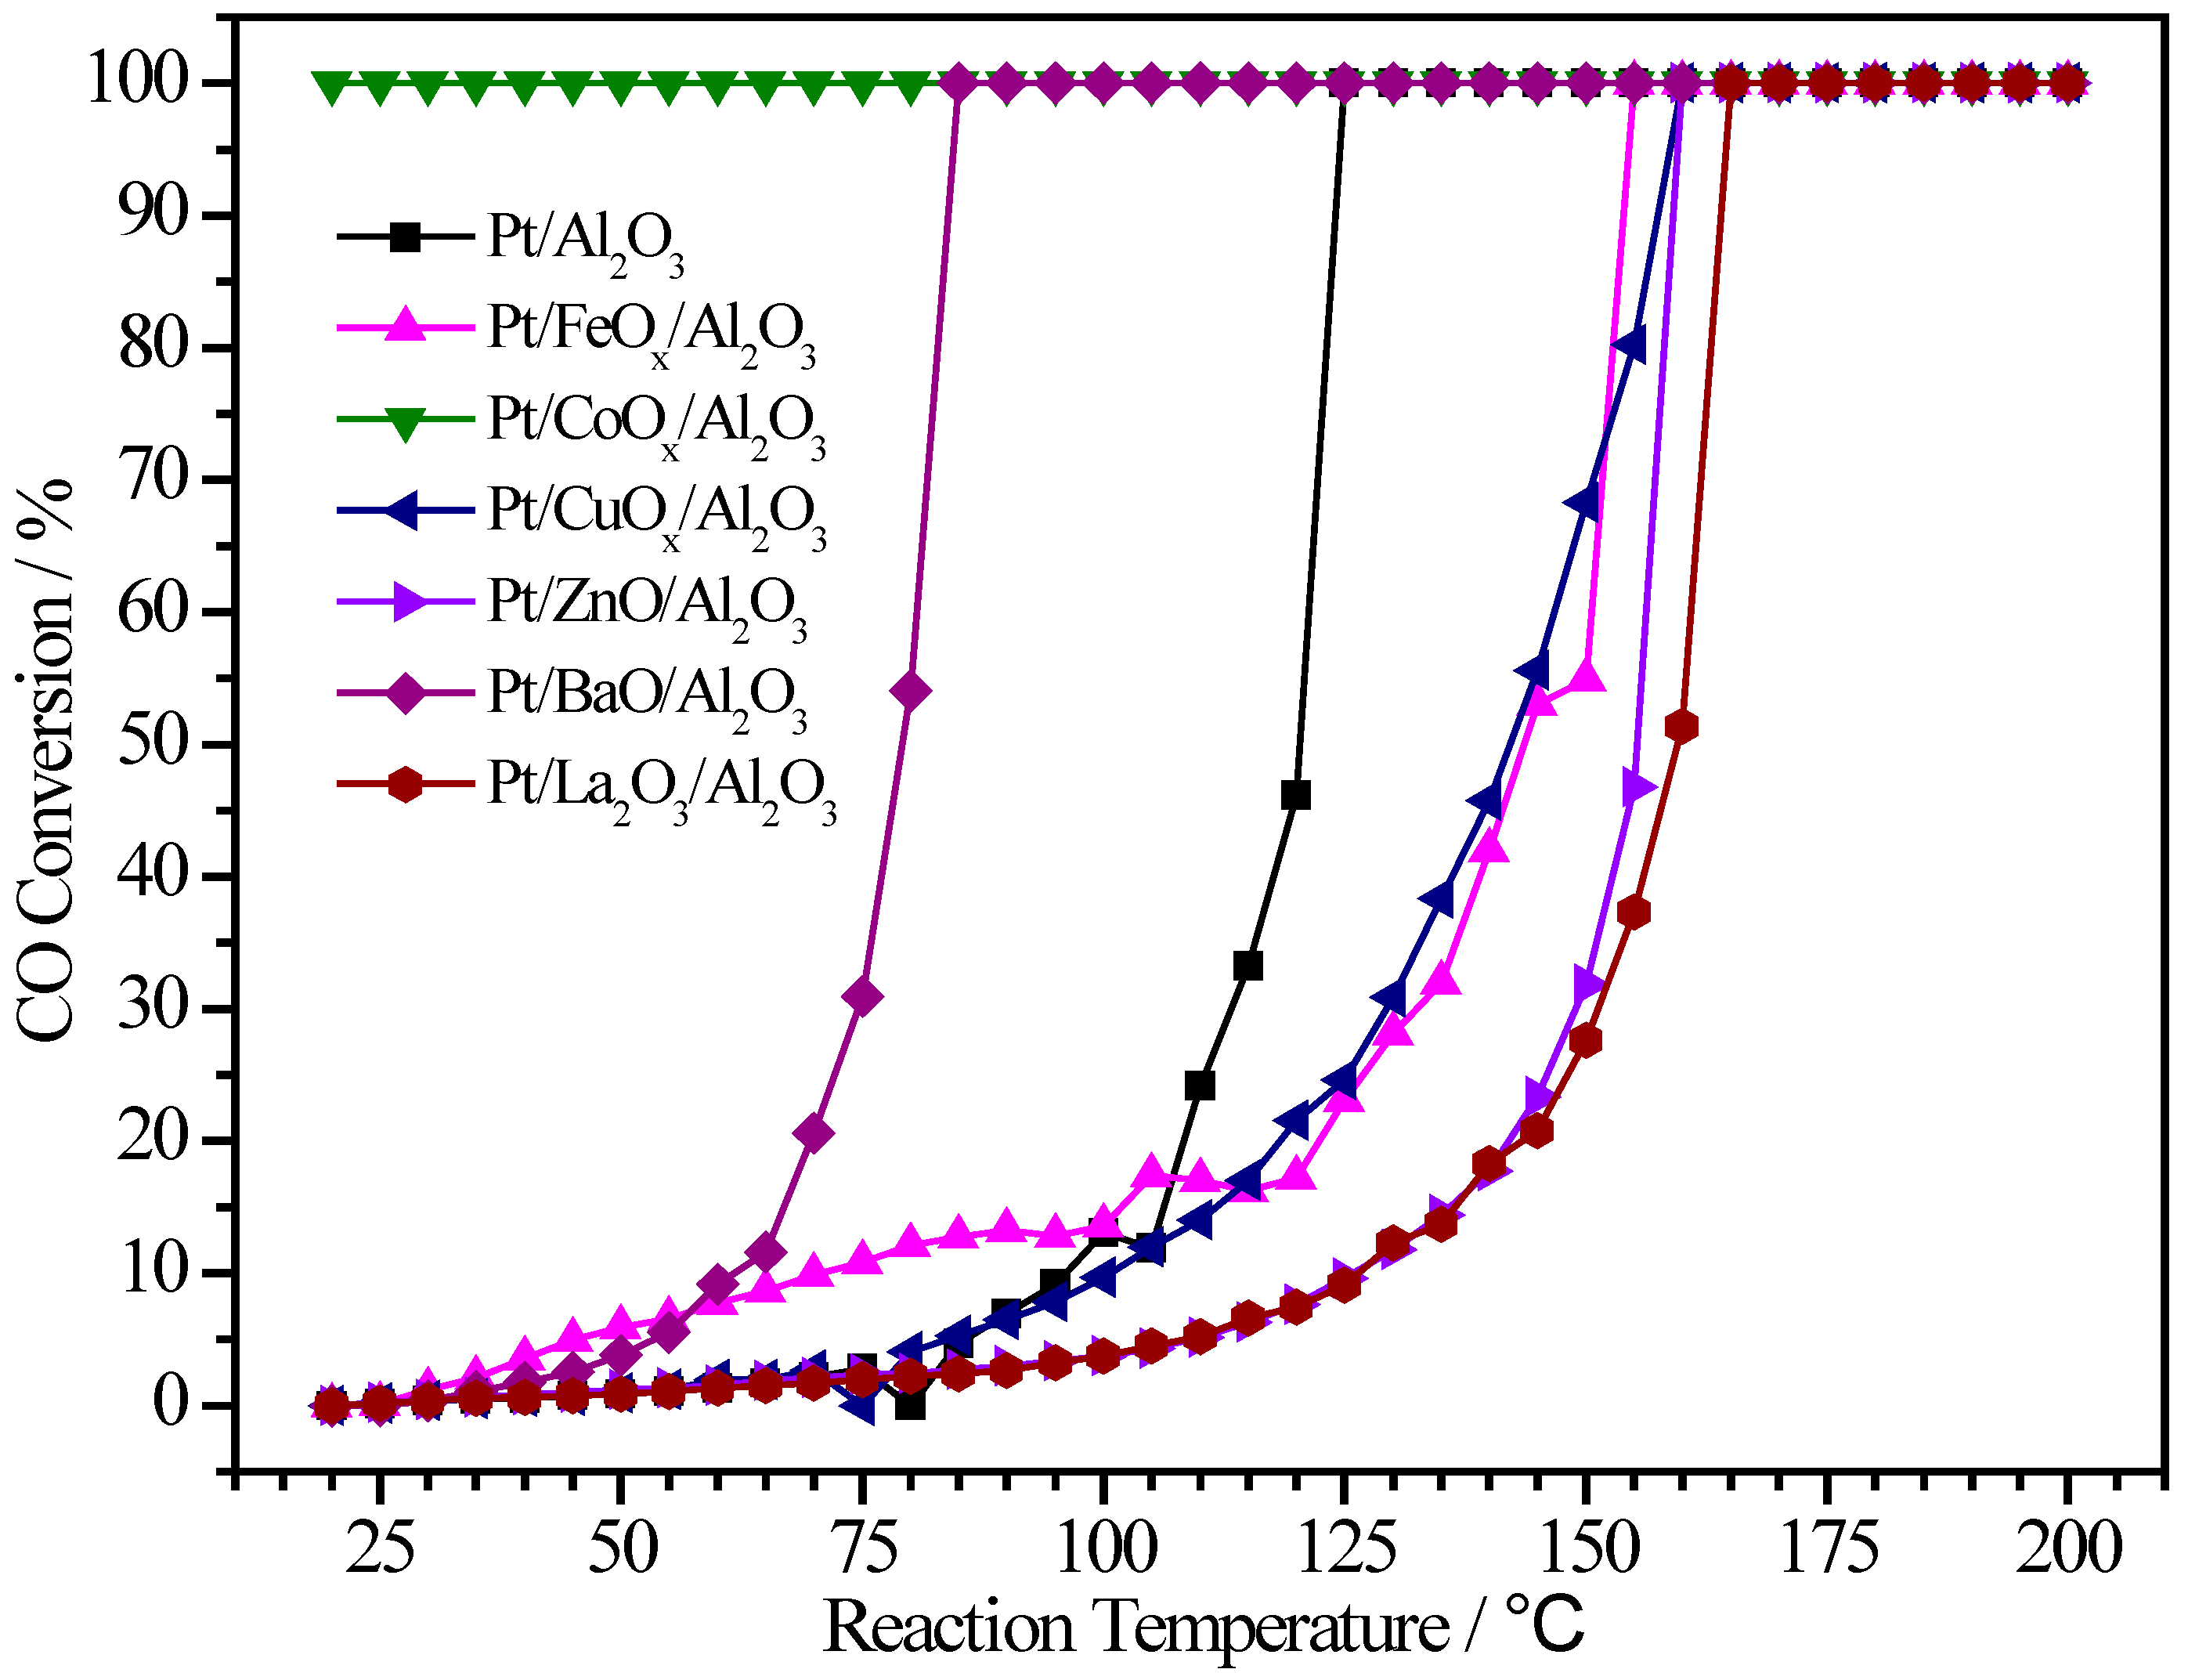
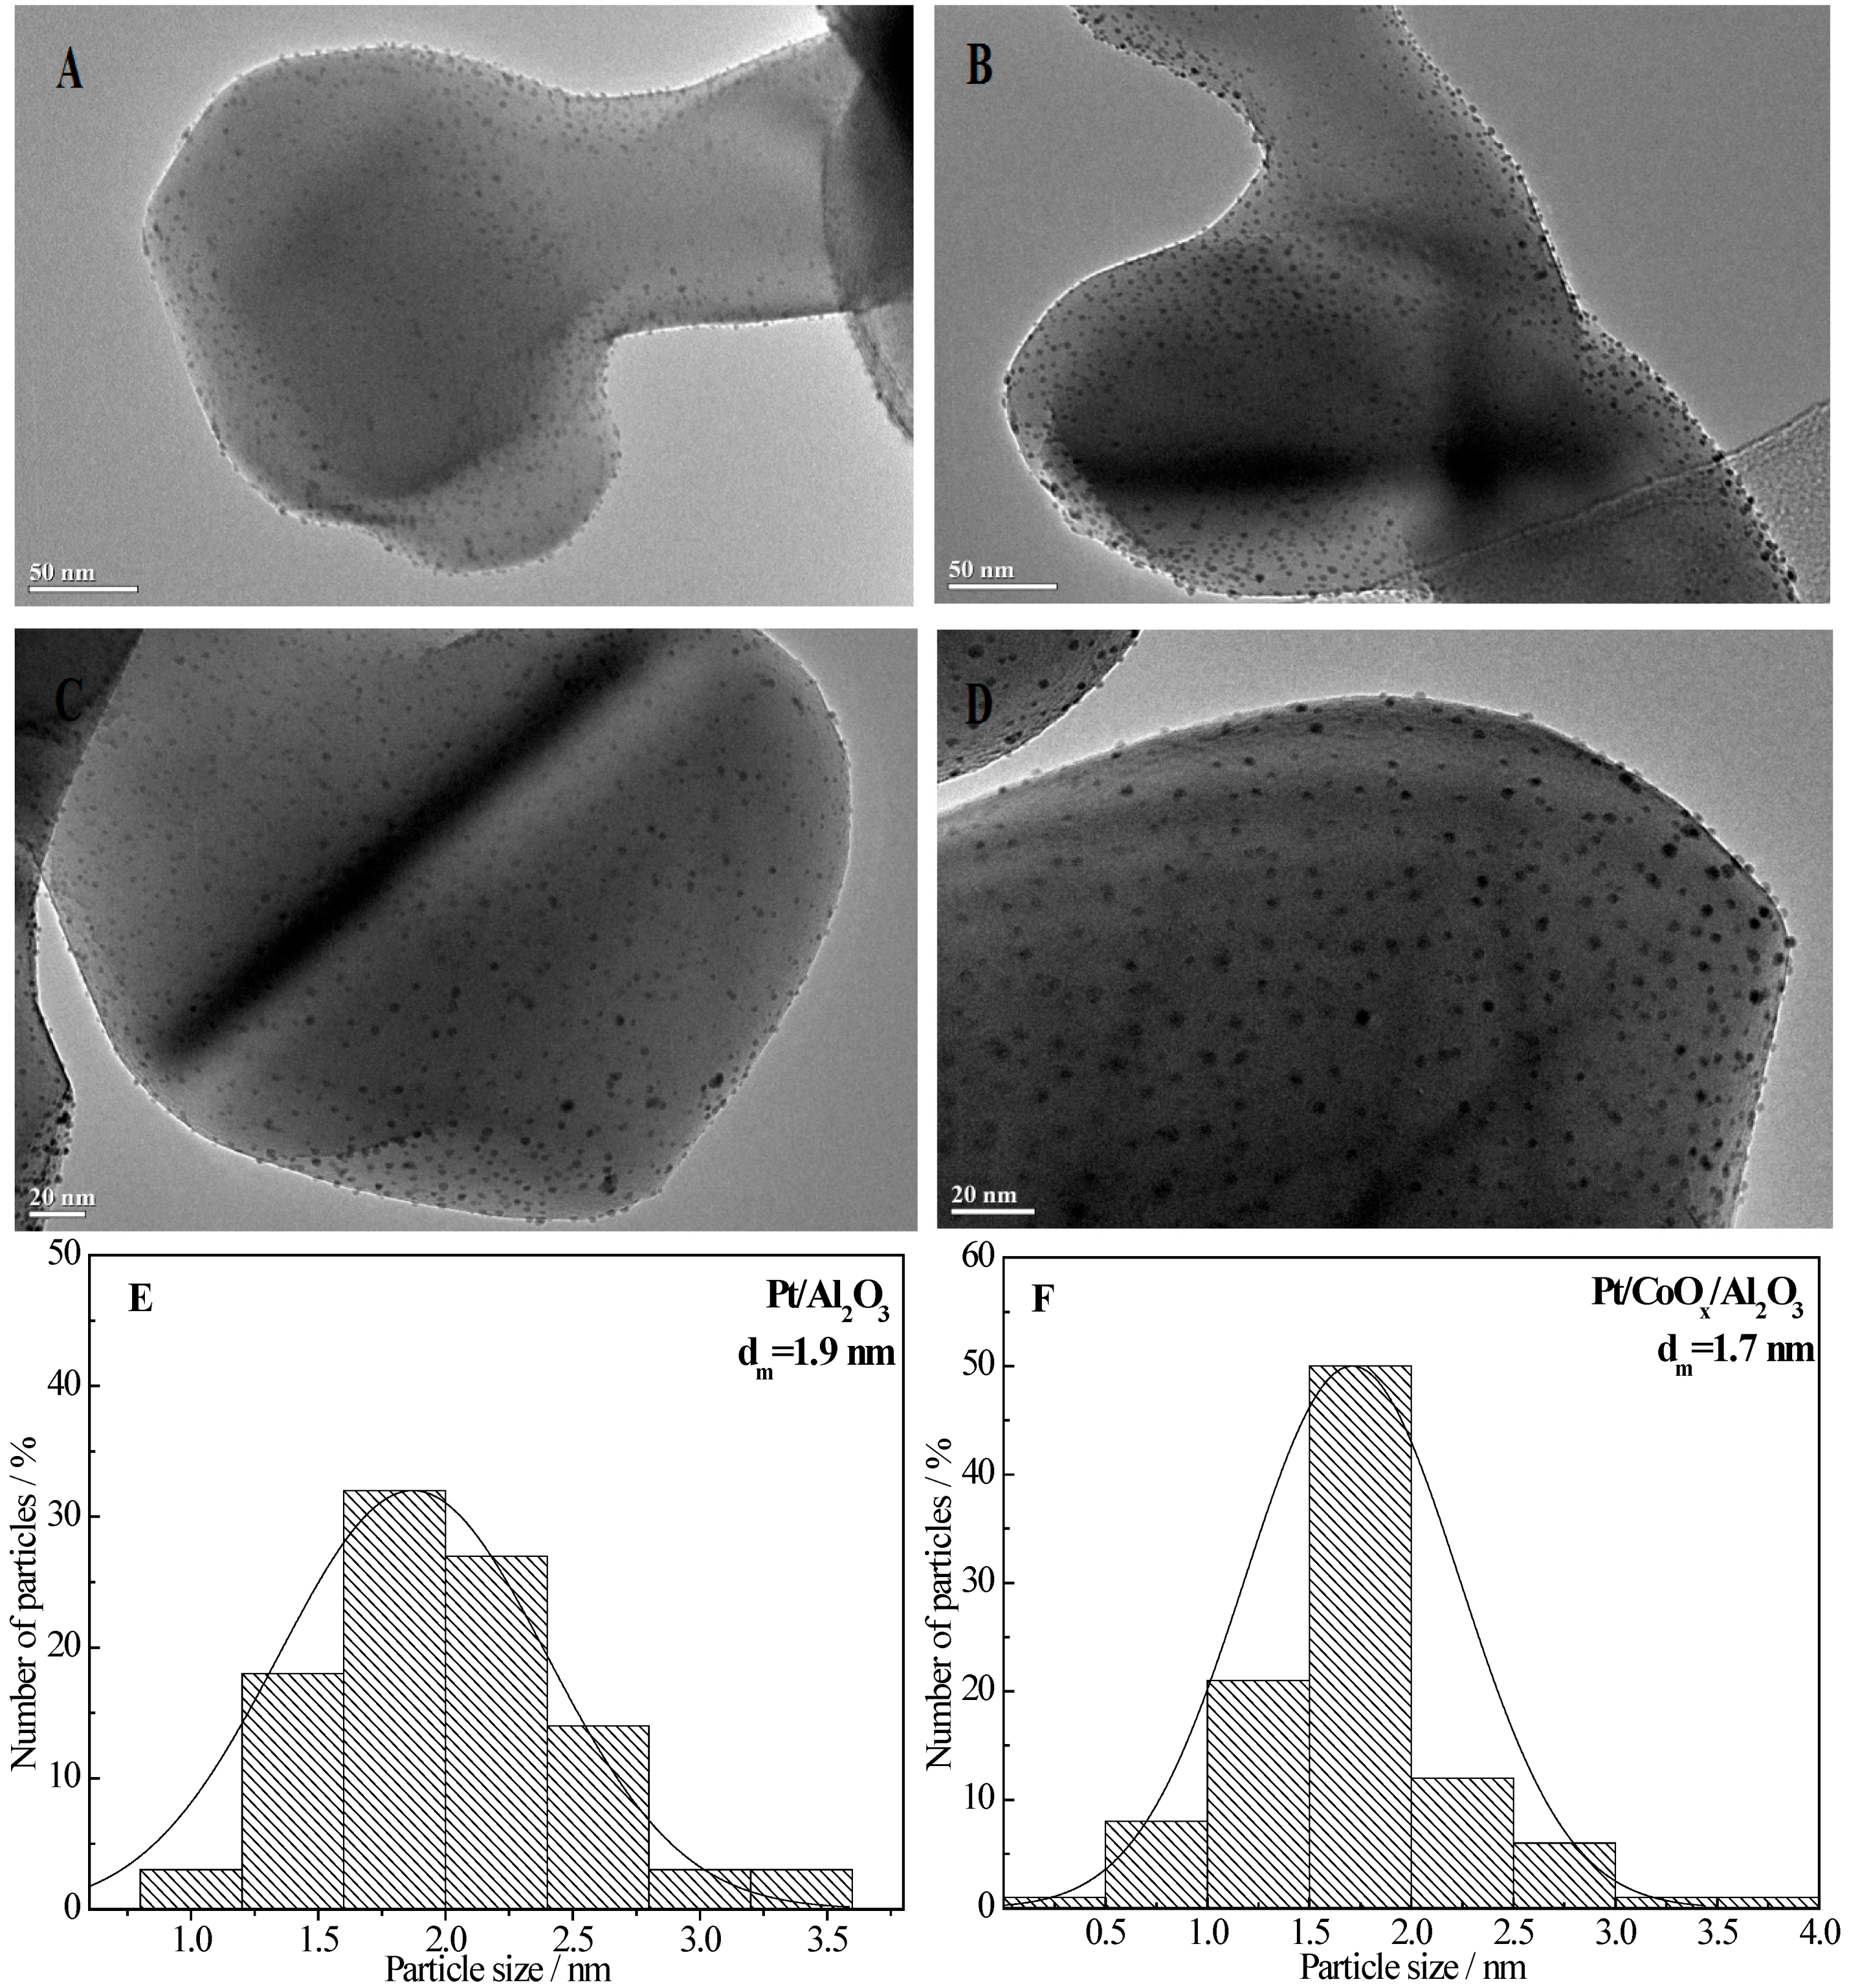
2.4. Pt/MOx/Al2O3 Catalysts


| Sample | Pt (wt.%) | M (wt.%) | Atomic Pt:M | T50 (°C) | T100 (°C) |
|---|---|---|---|---|---|
| Pt/Al2O3 | 0.75 | - | 1:0 | 121 | 125 |
| Pt/FeOx/Al2O3 | 0.69 | 0.08 | 1:0.4 | 143 | 155 |
| Pt/CoOx/Al2O3 | 0.33 | 0.39 | 1:3.9 | <RT | <RT |
| Pt/CuOx/Al2O3 | 0.38 | 3.73 | 1:30.1 | 142 | 160 |
| Pt/ZnO/Al2O3 | 0.92 | 2.79 | 1:9.0 | 156 | 160 |
| Pt/BaO/Al2O3 | 0.41 | 4.00 | 1:13.9 | 79 | 85 |
| Pt/La2O3/Al2O3 | 0.80 | 2.42 | 1:4.2 | 159 | 165 |
2.5. Control Experiments

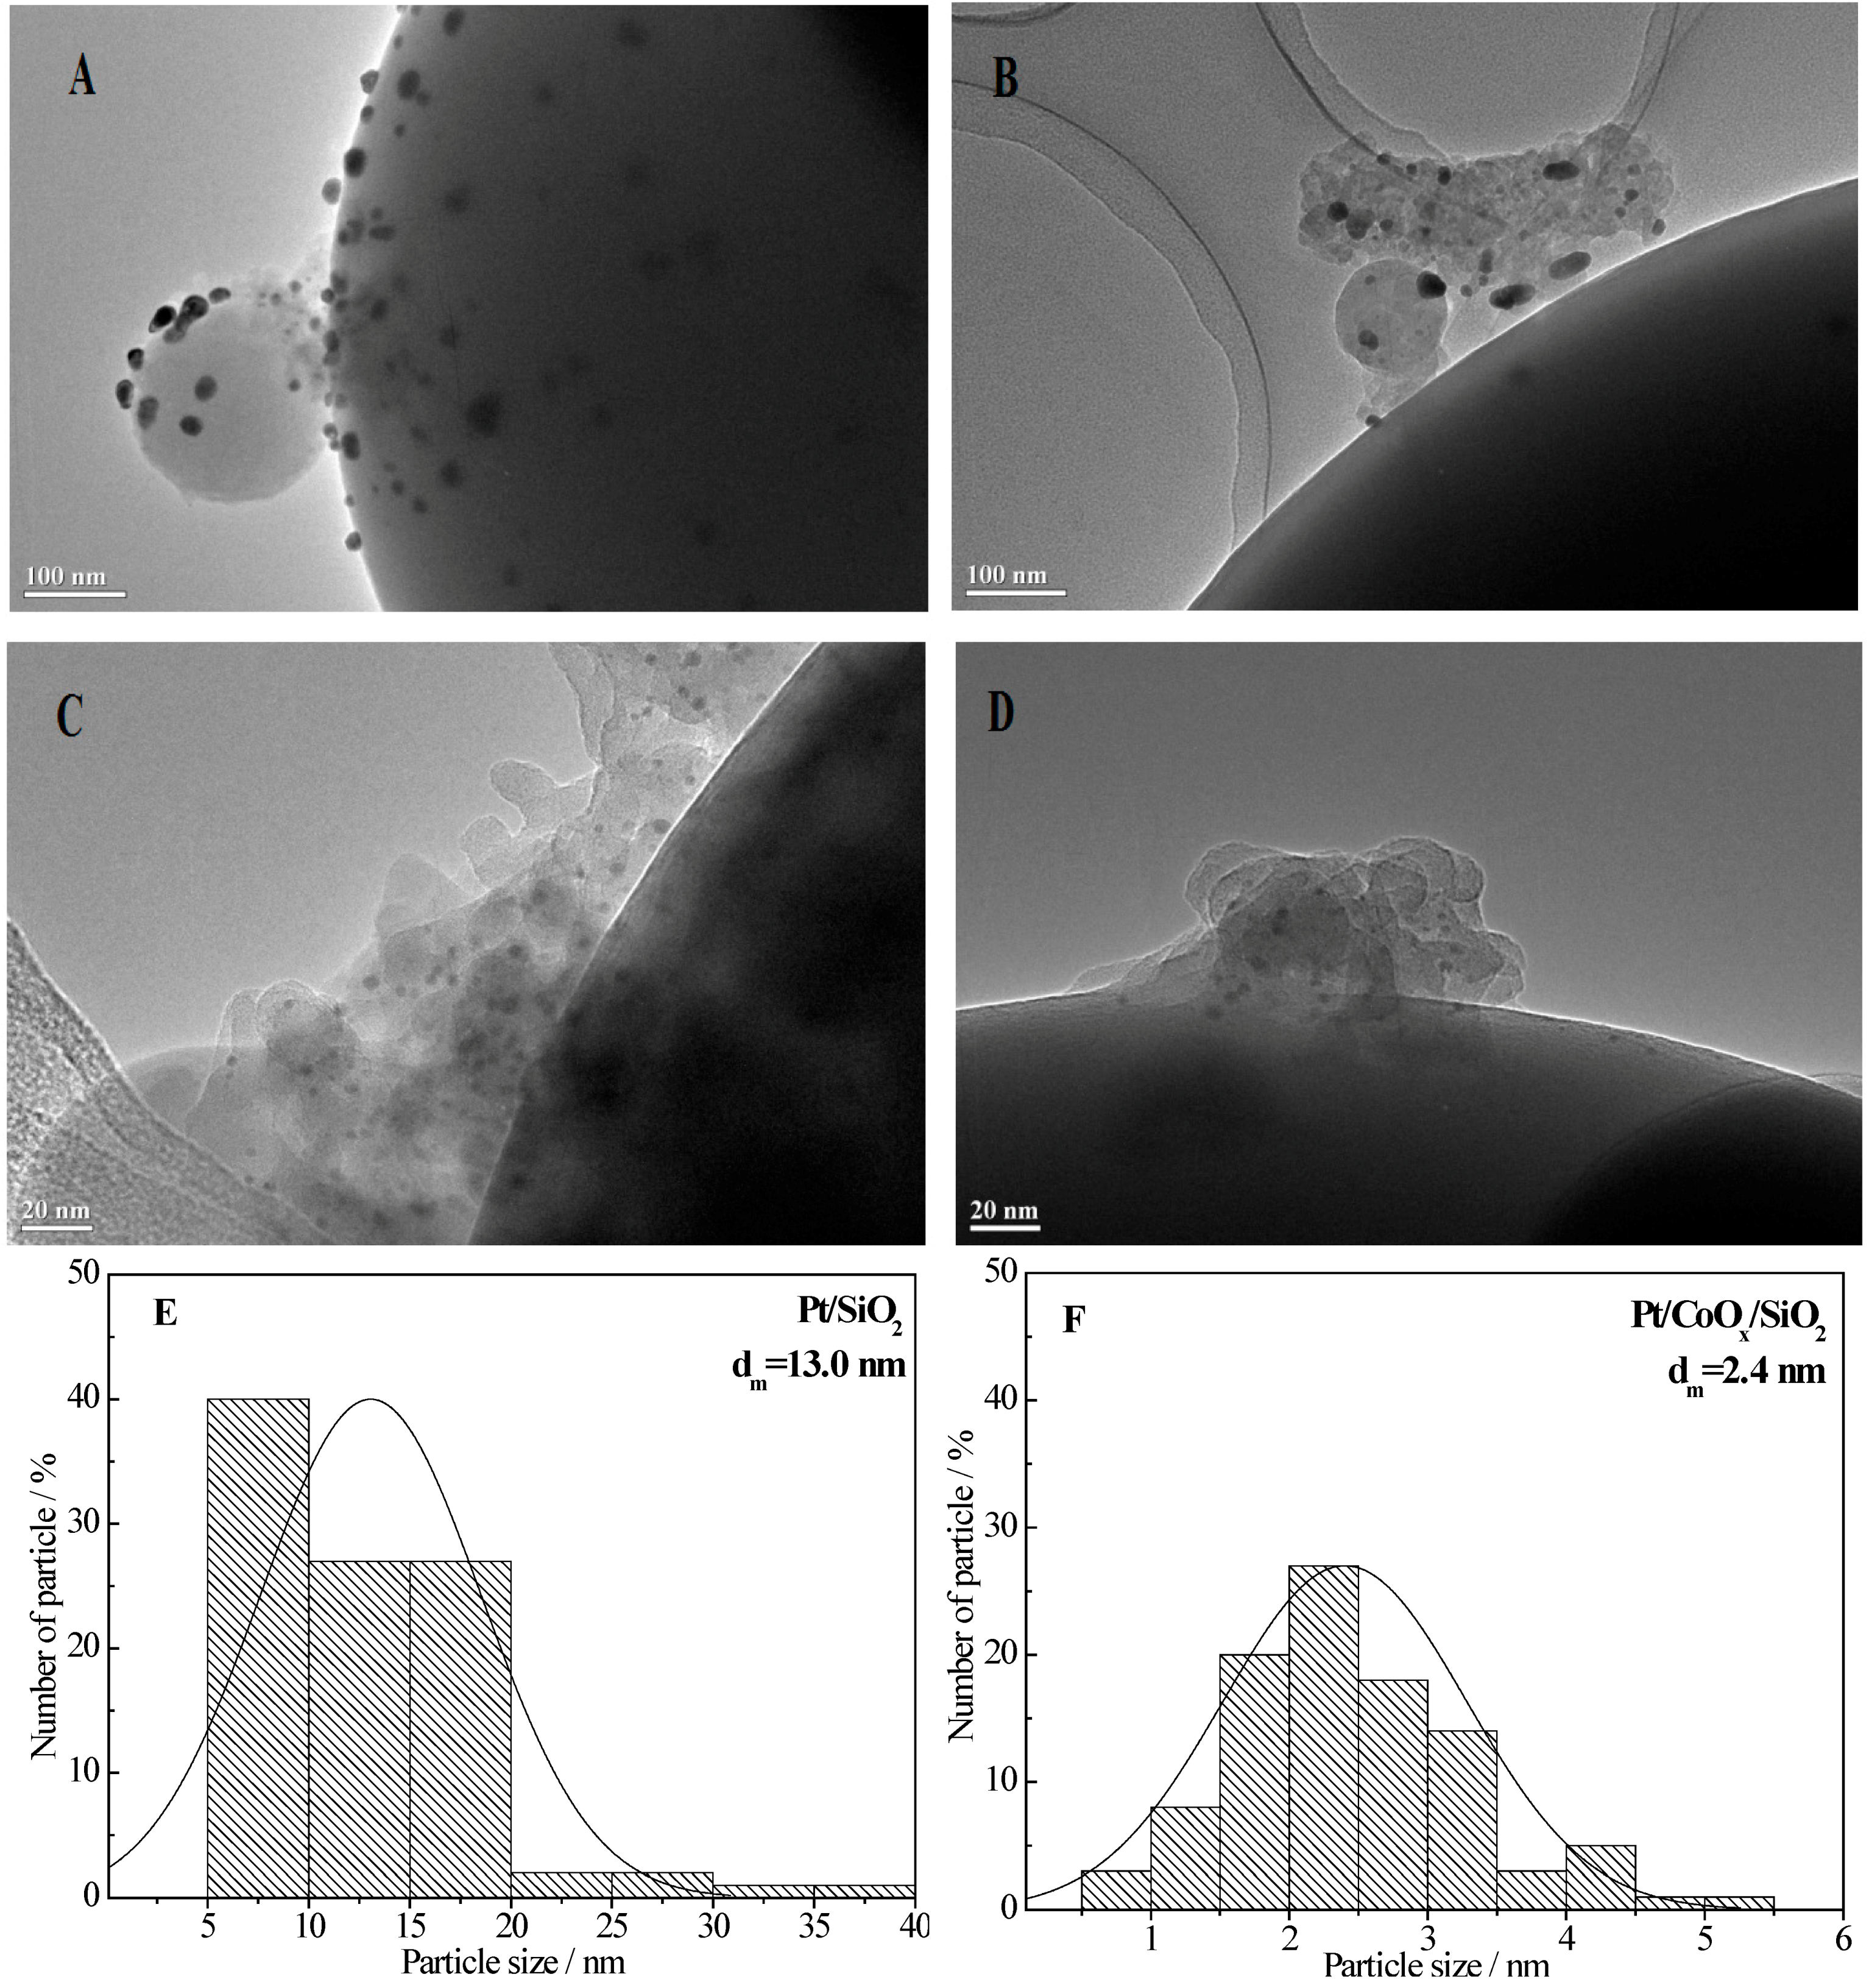
2.6. More Characterization of CoOx-Promoted Pt Catalysts
2.6.1. TEM Data


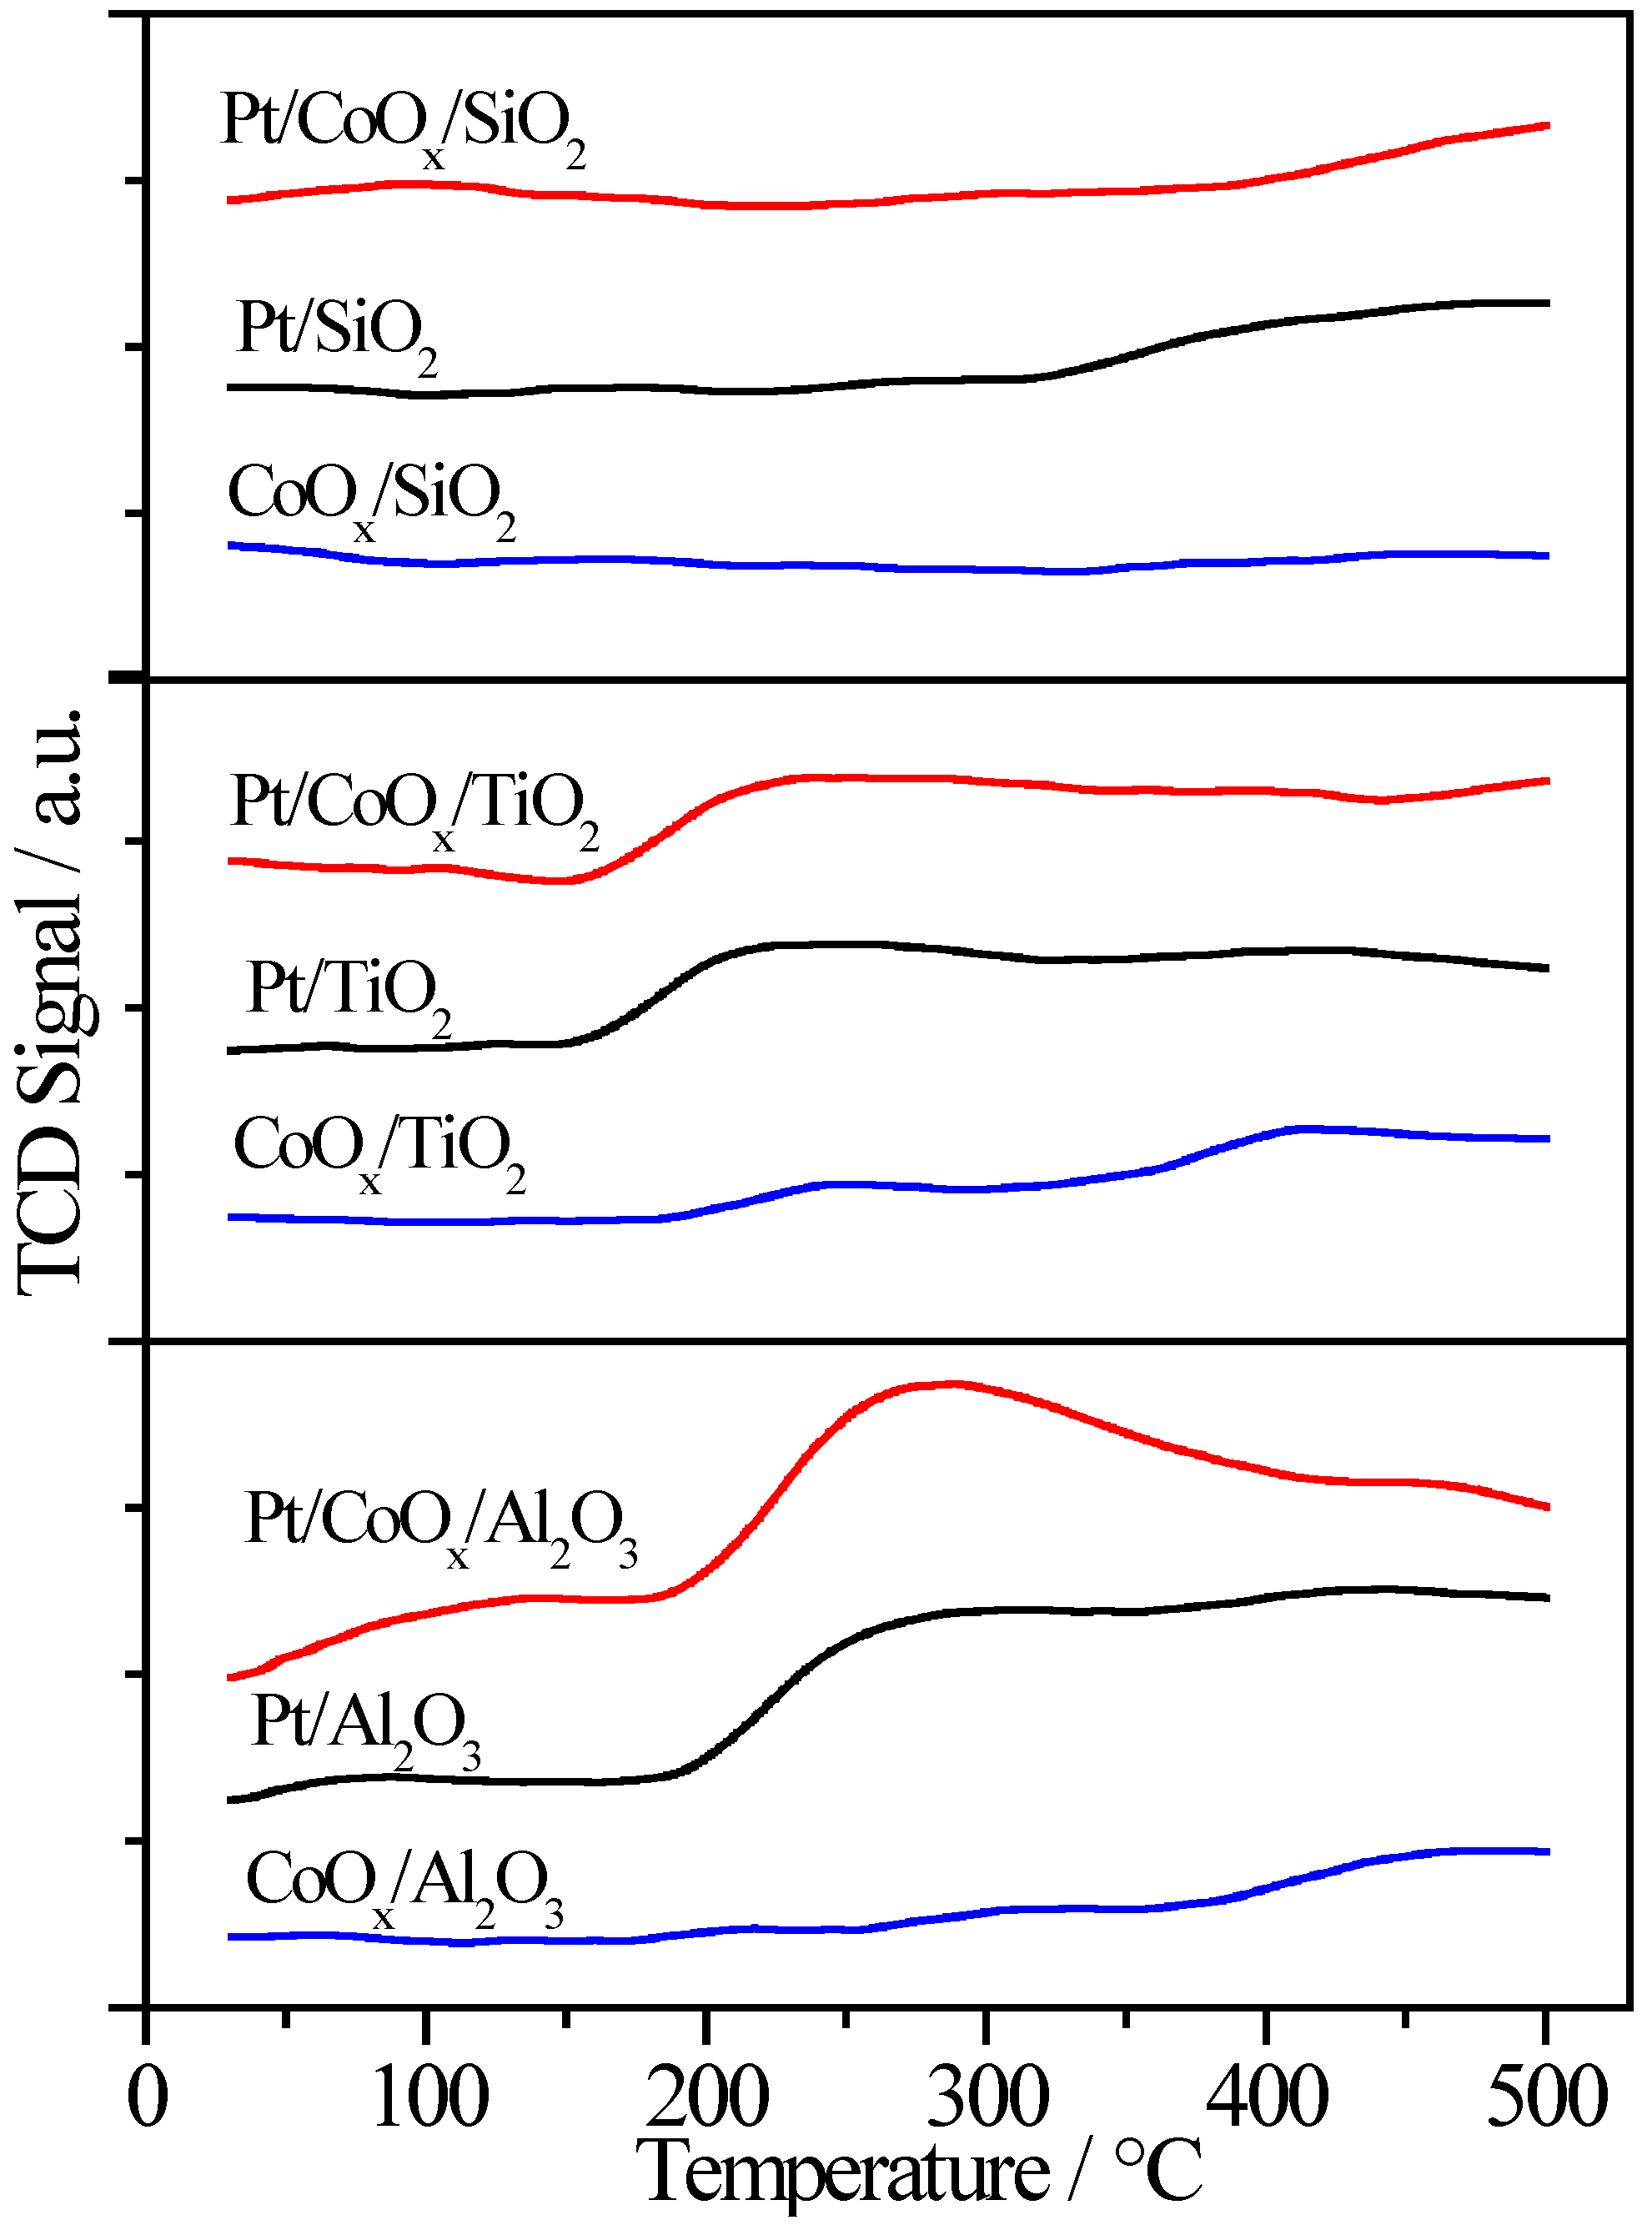
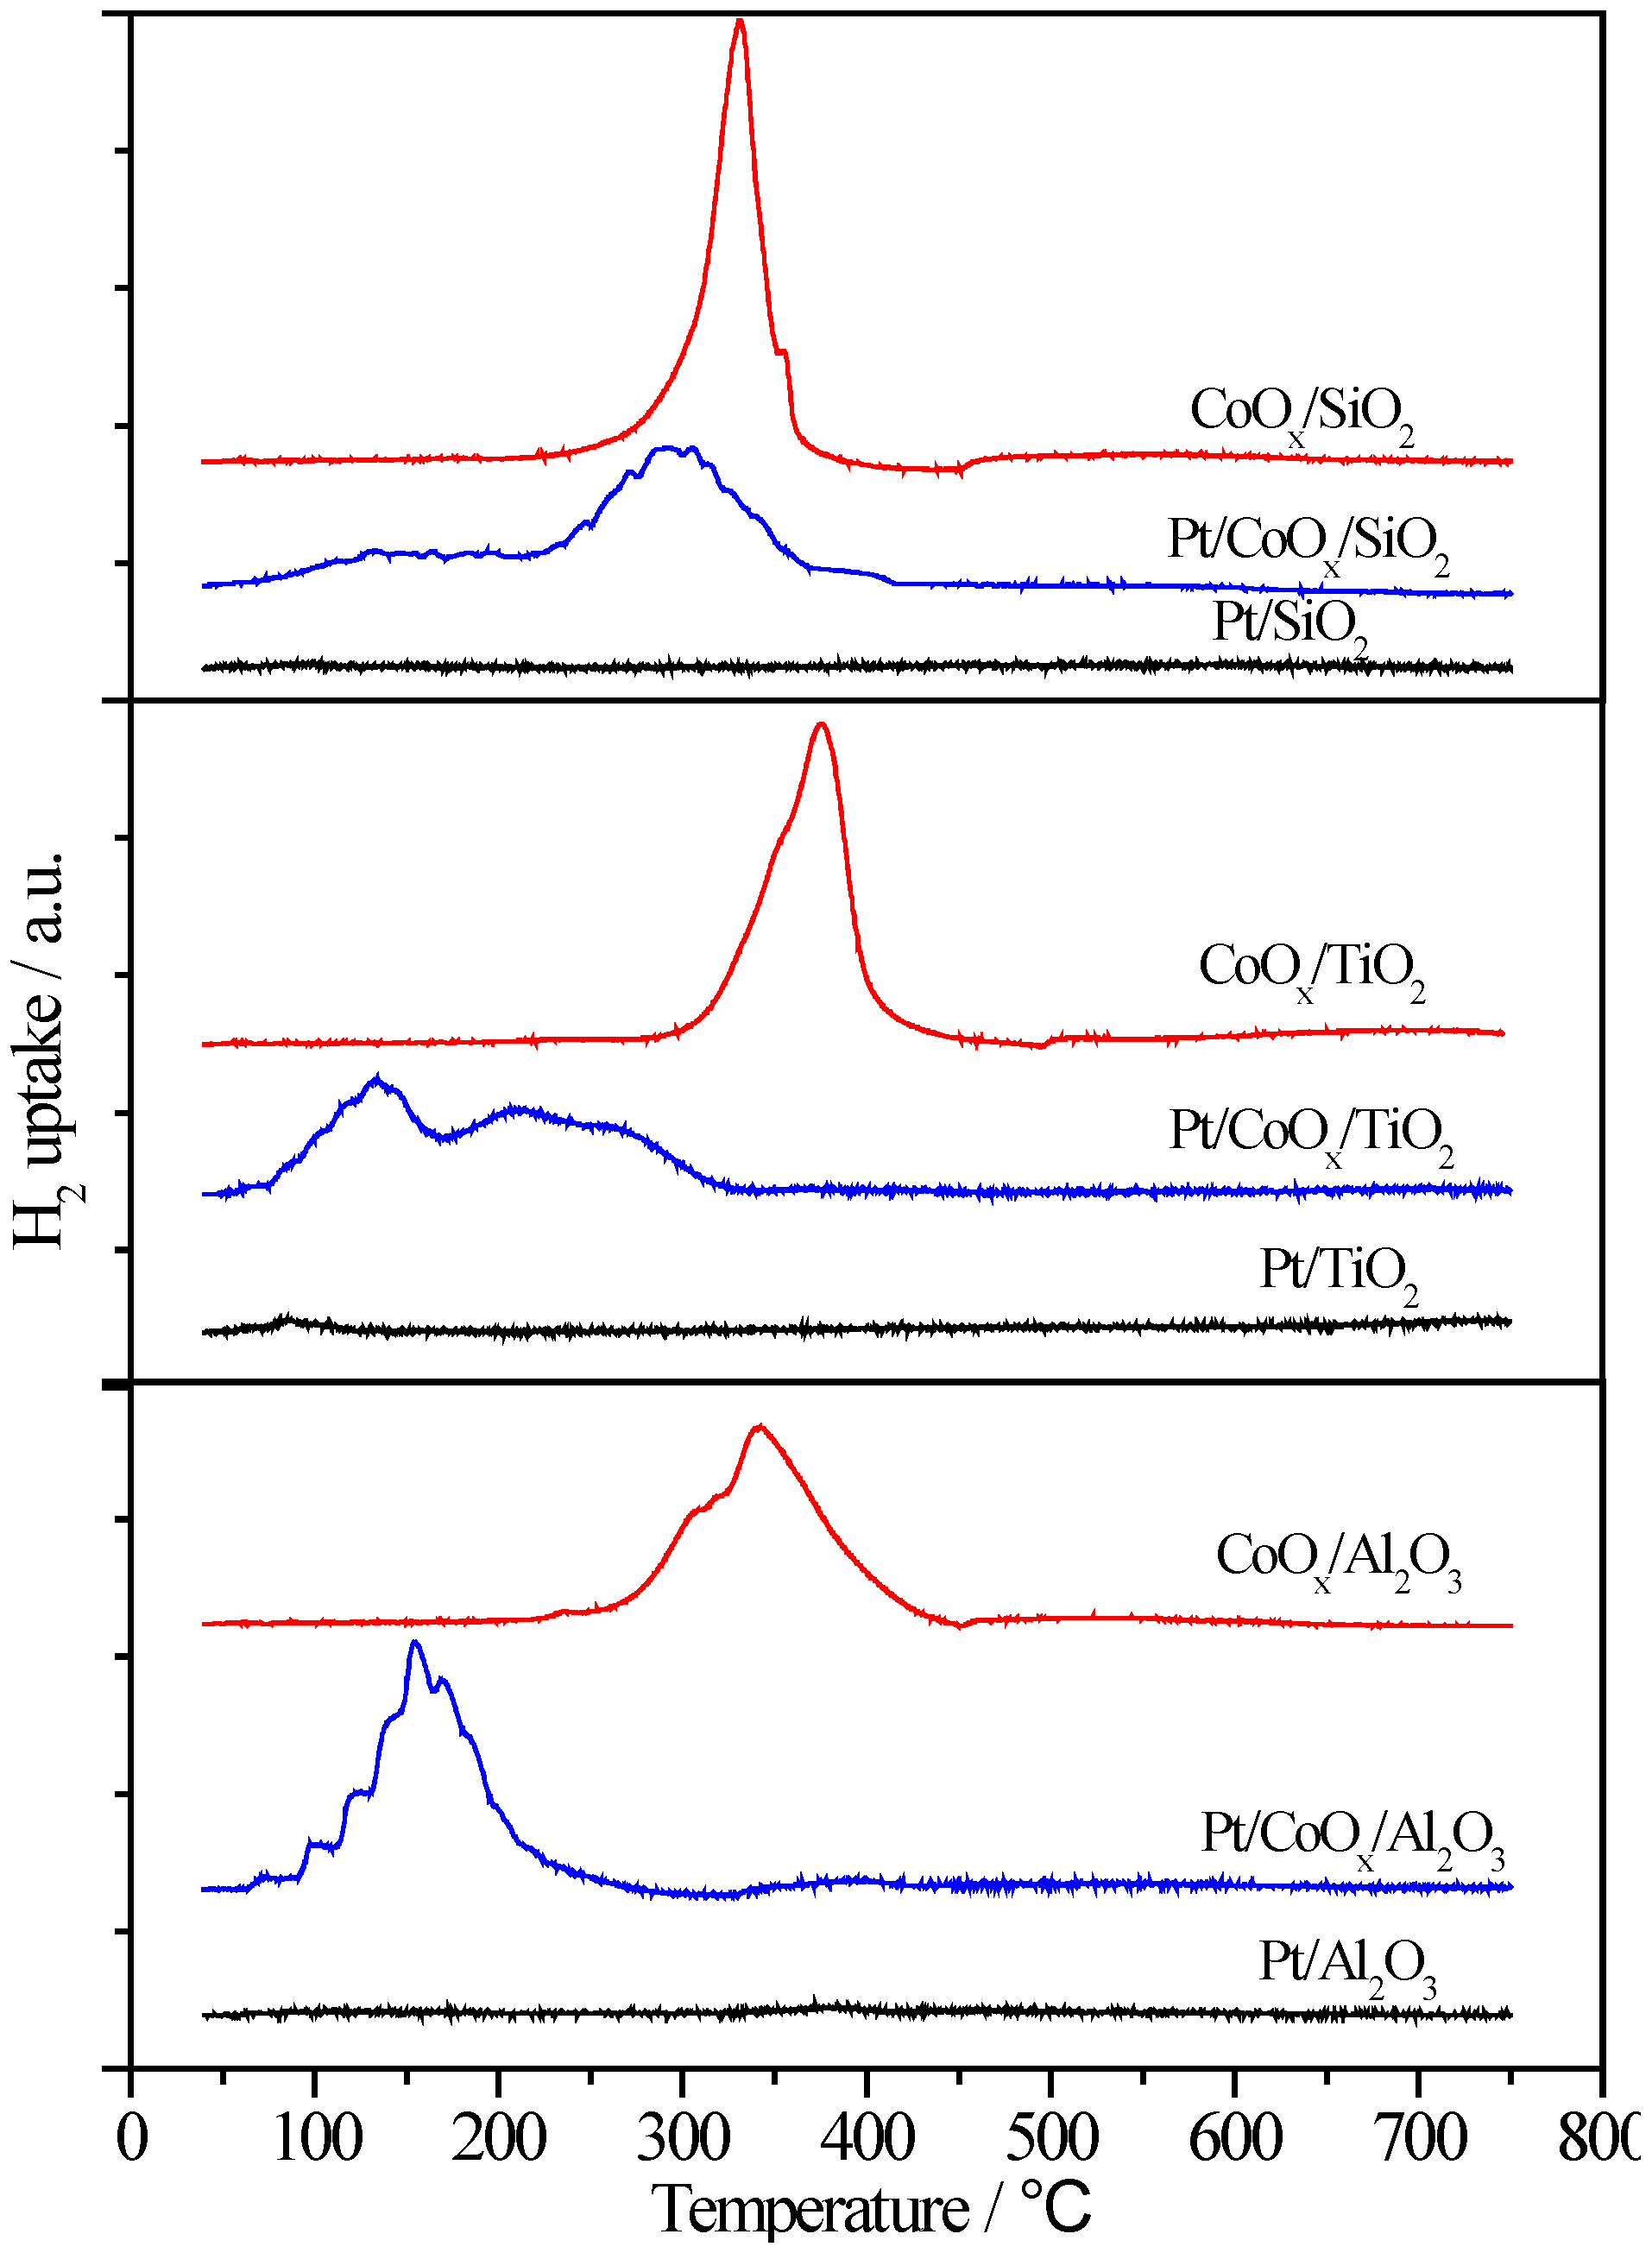
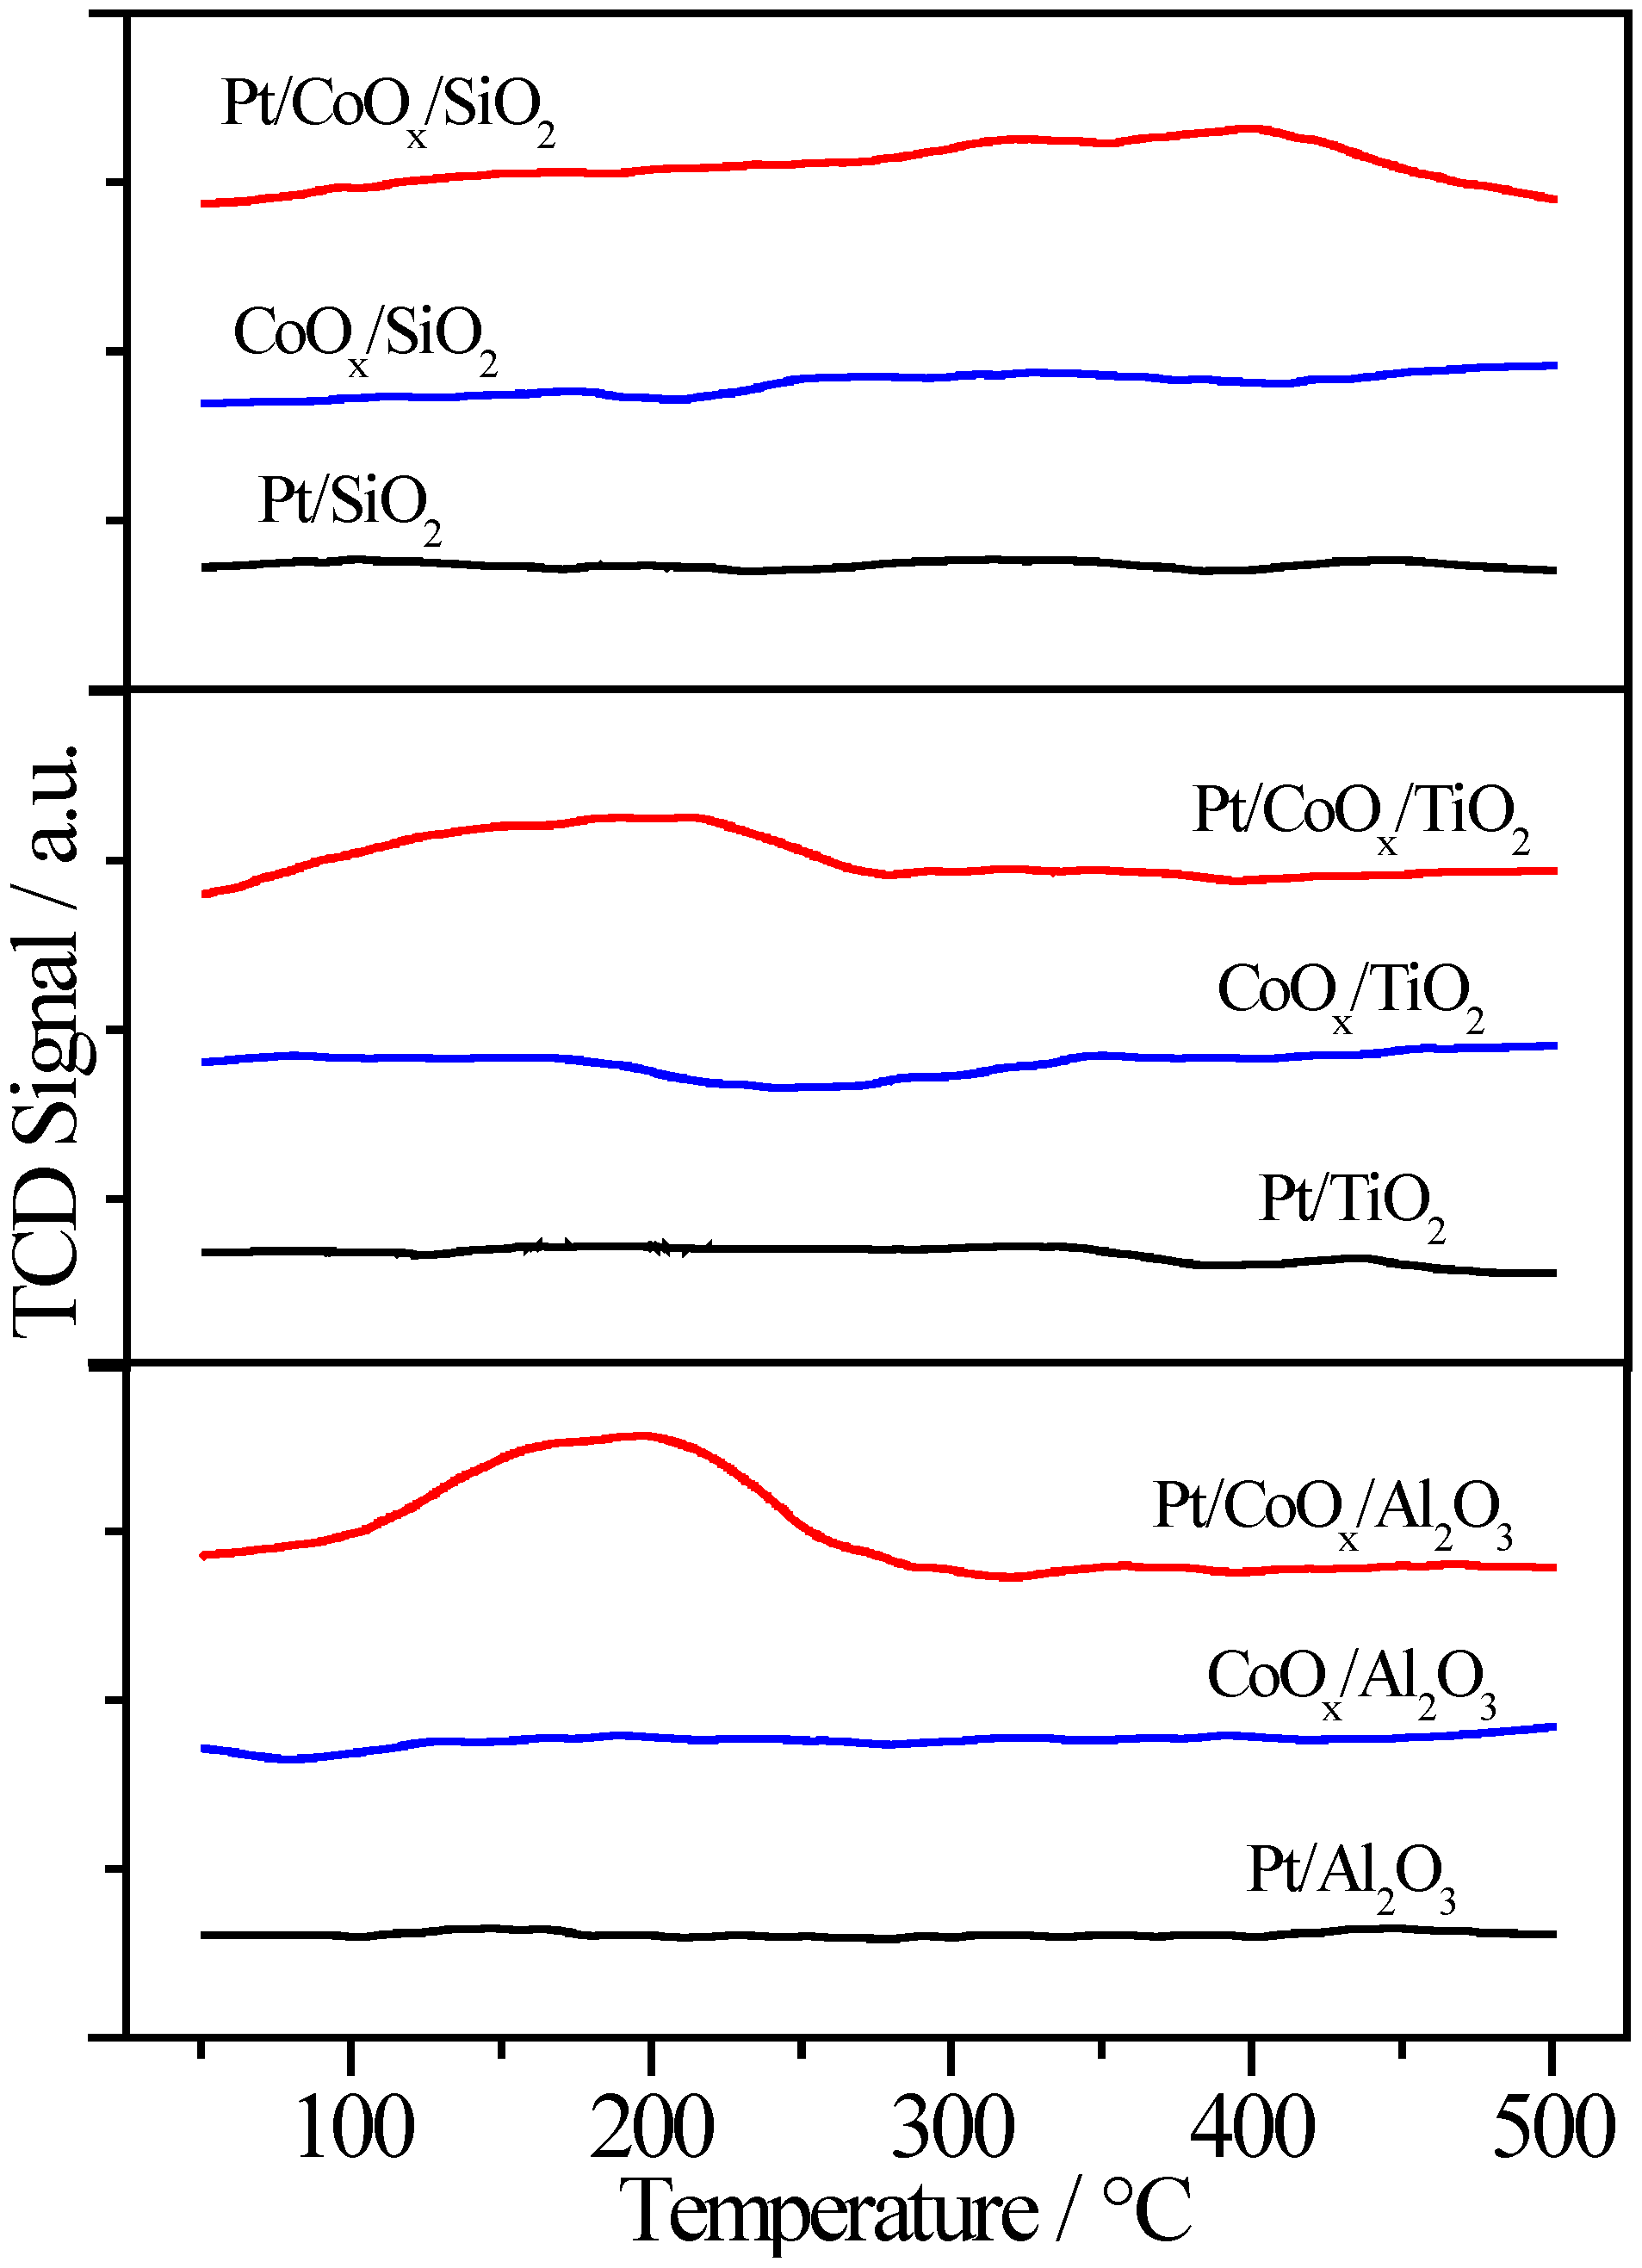
2.6.2. H2-TPR
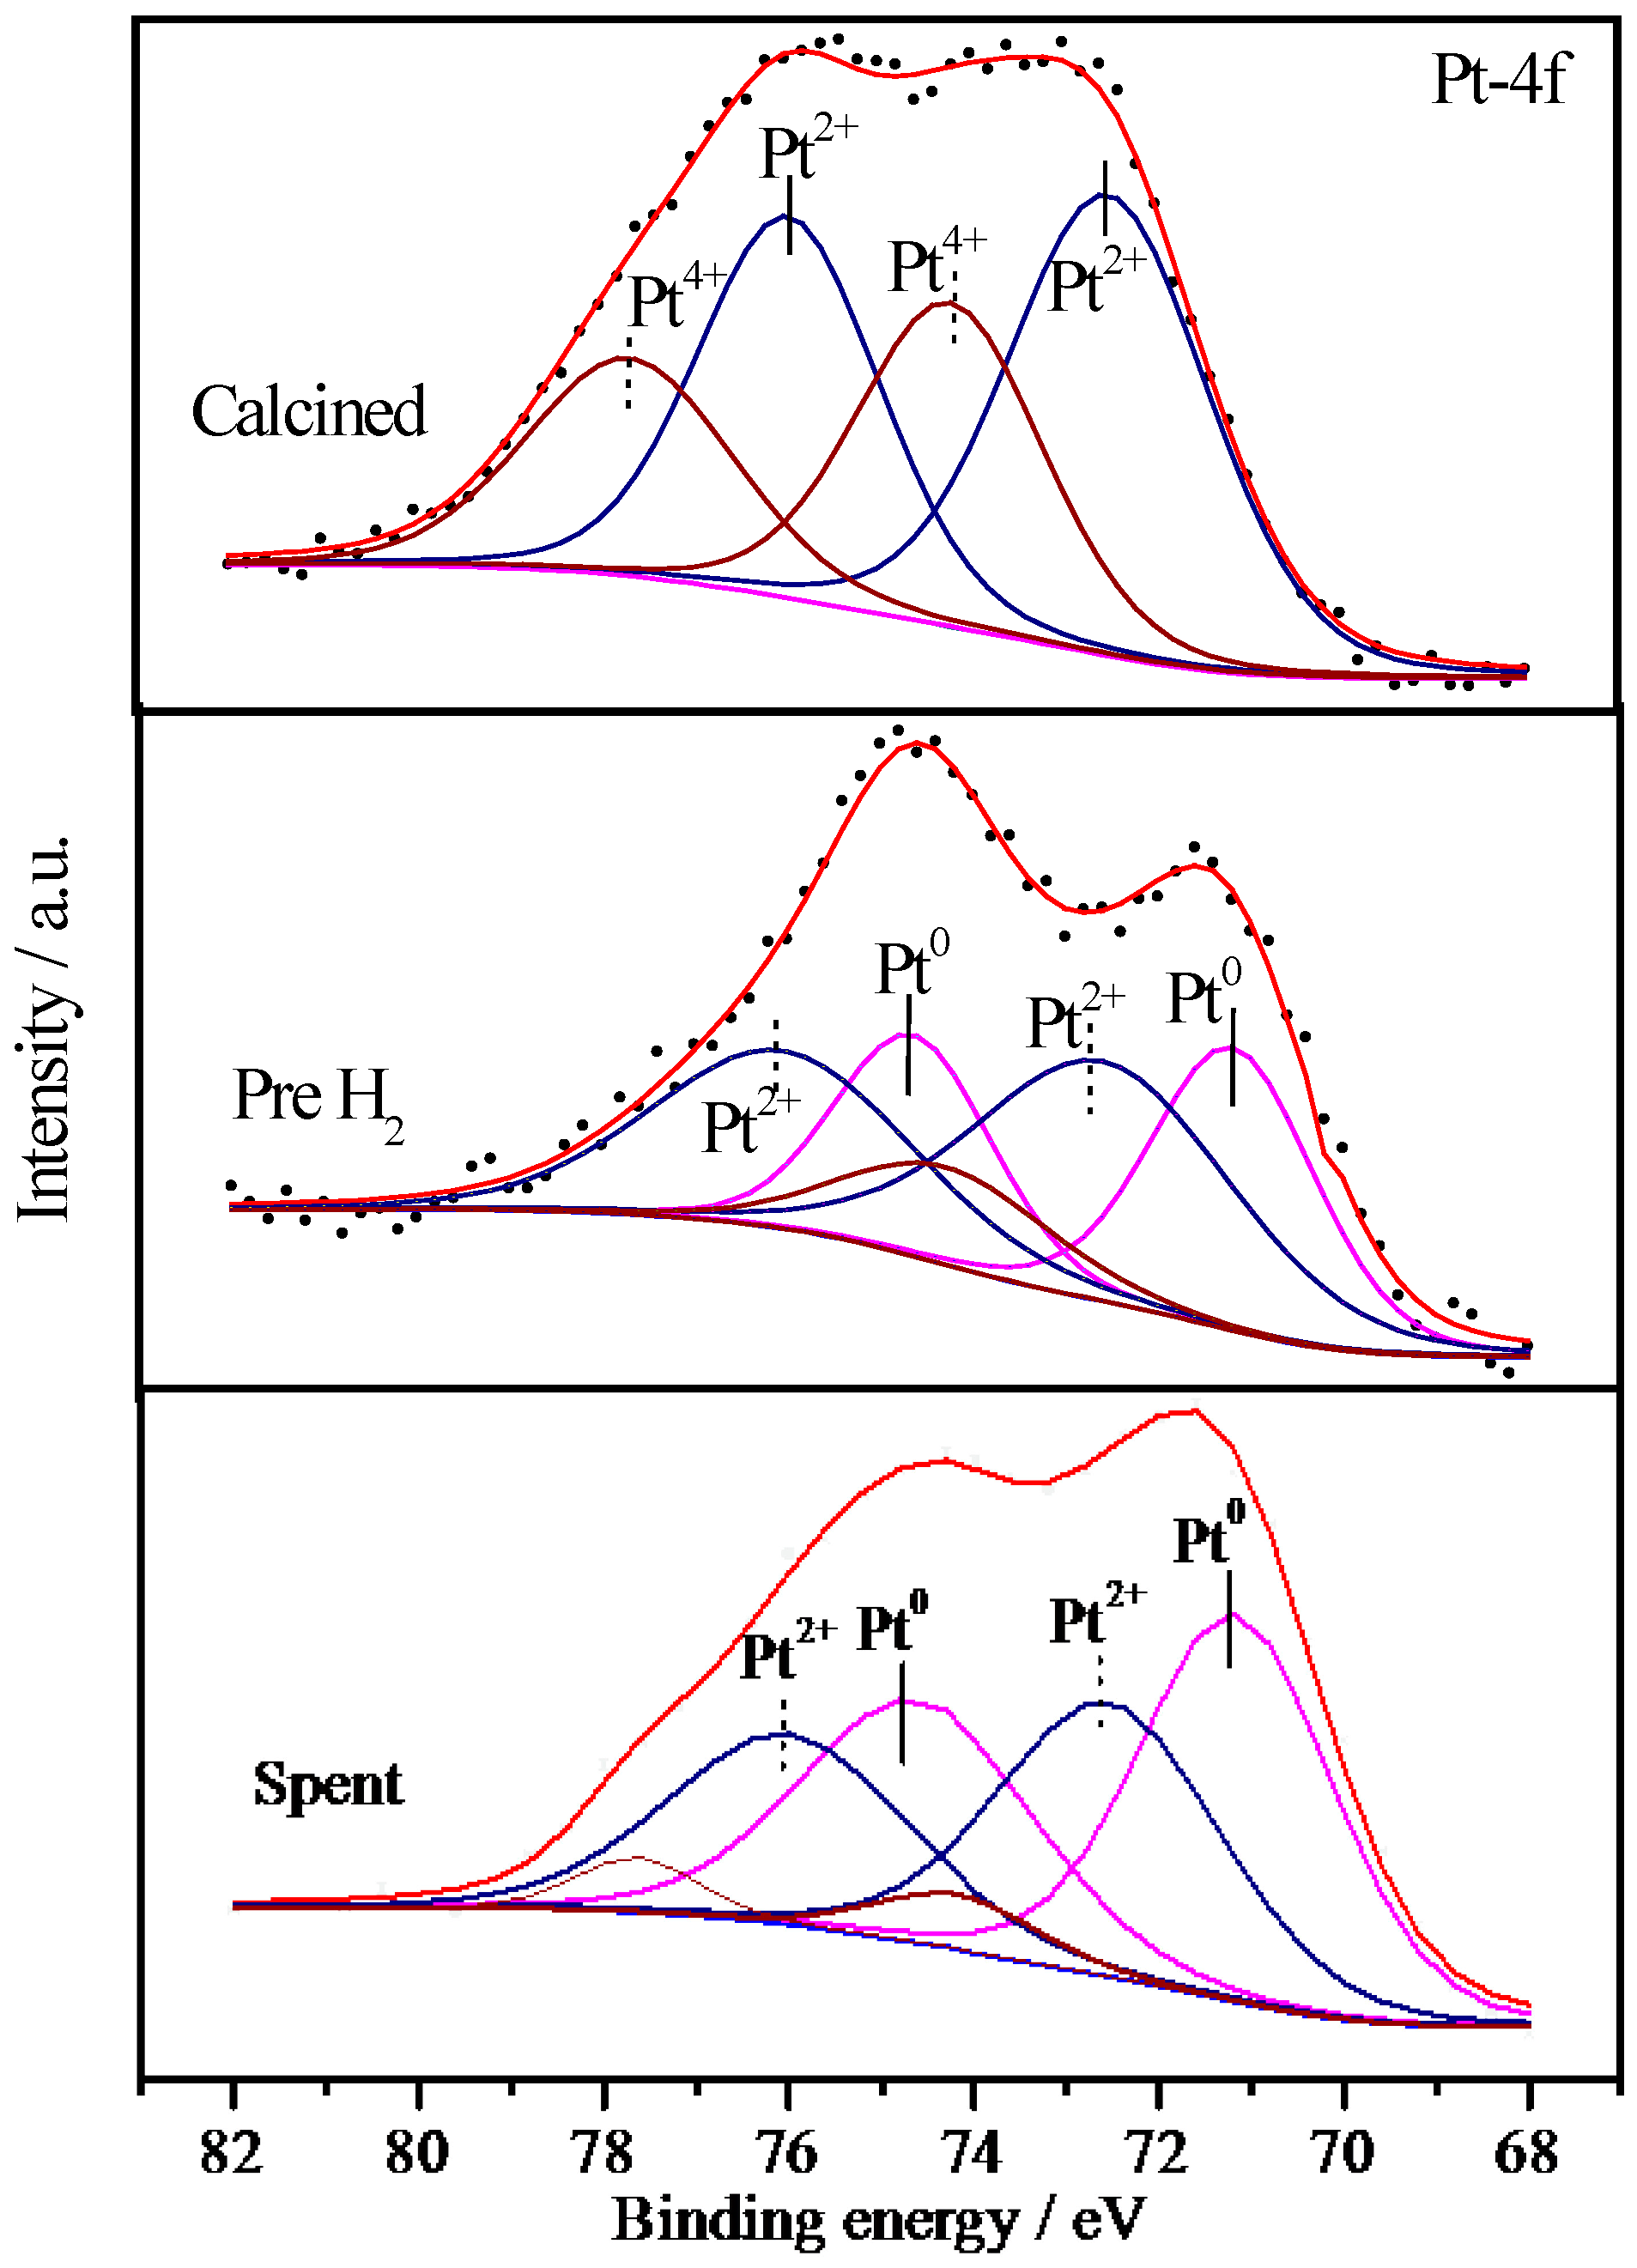
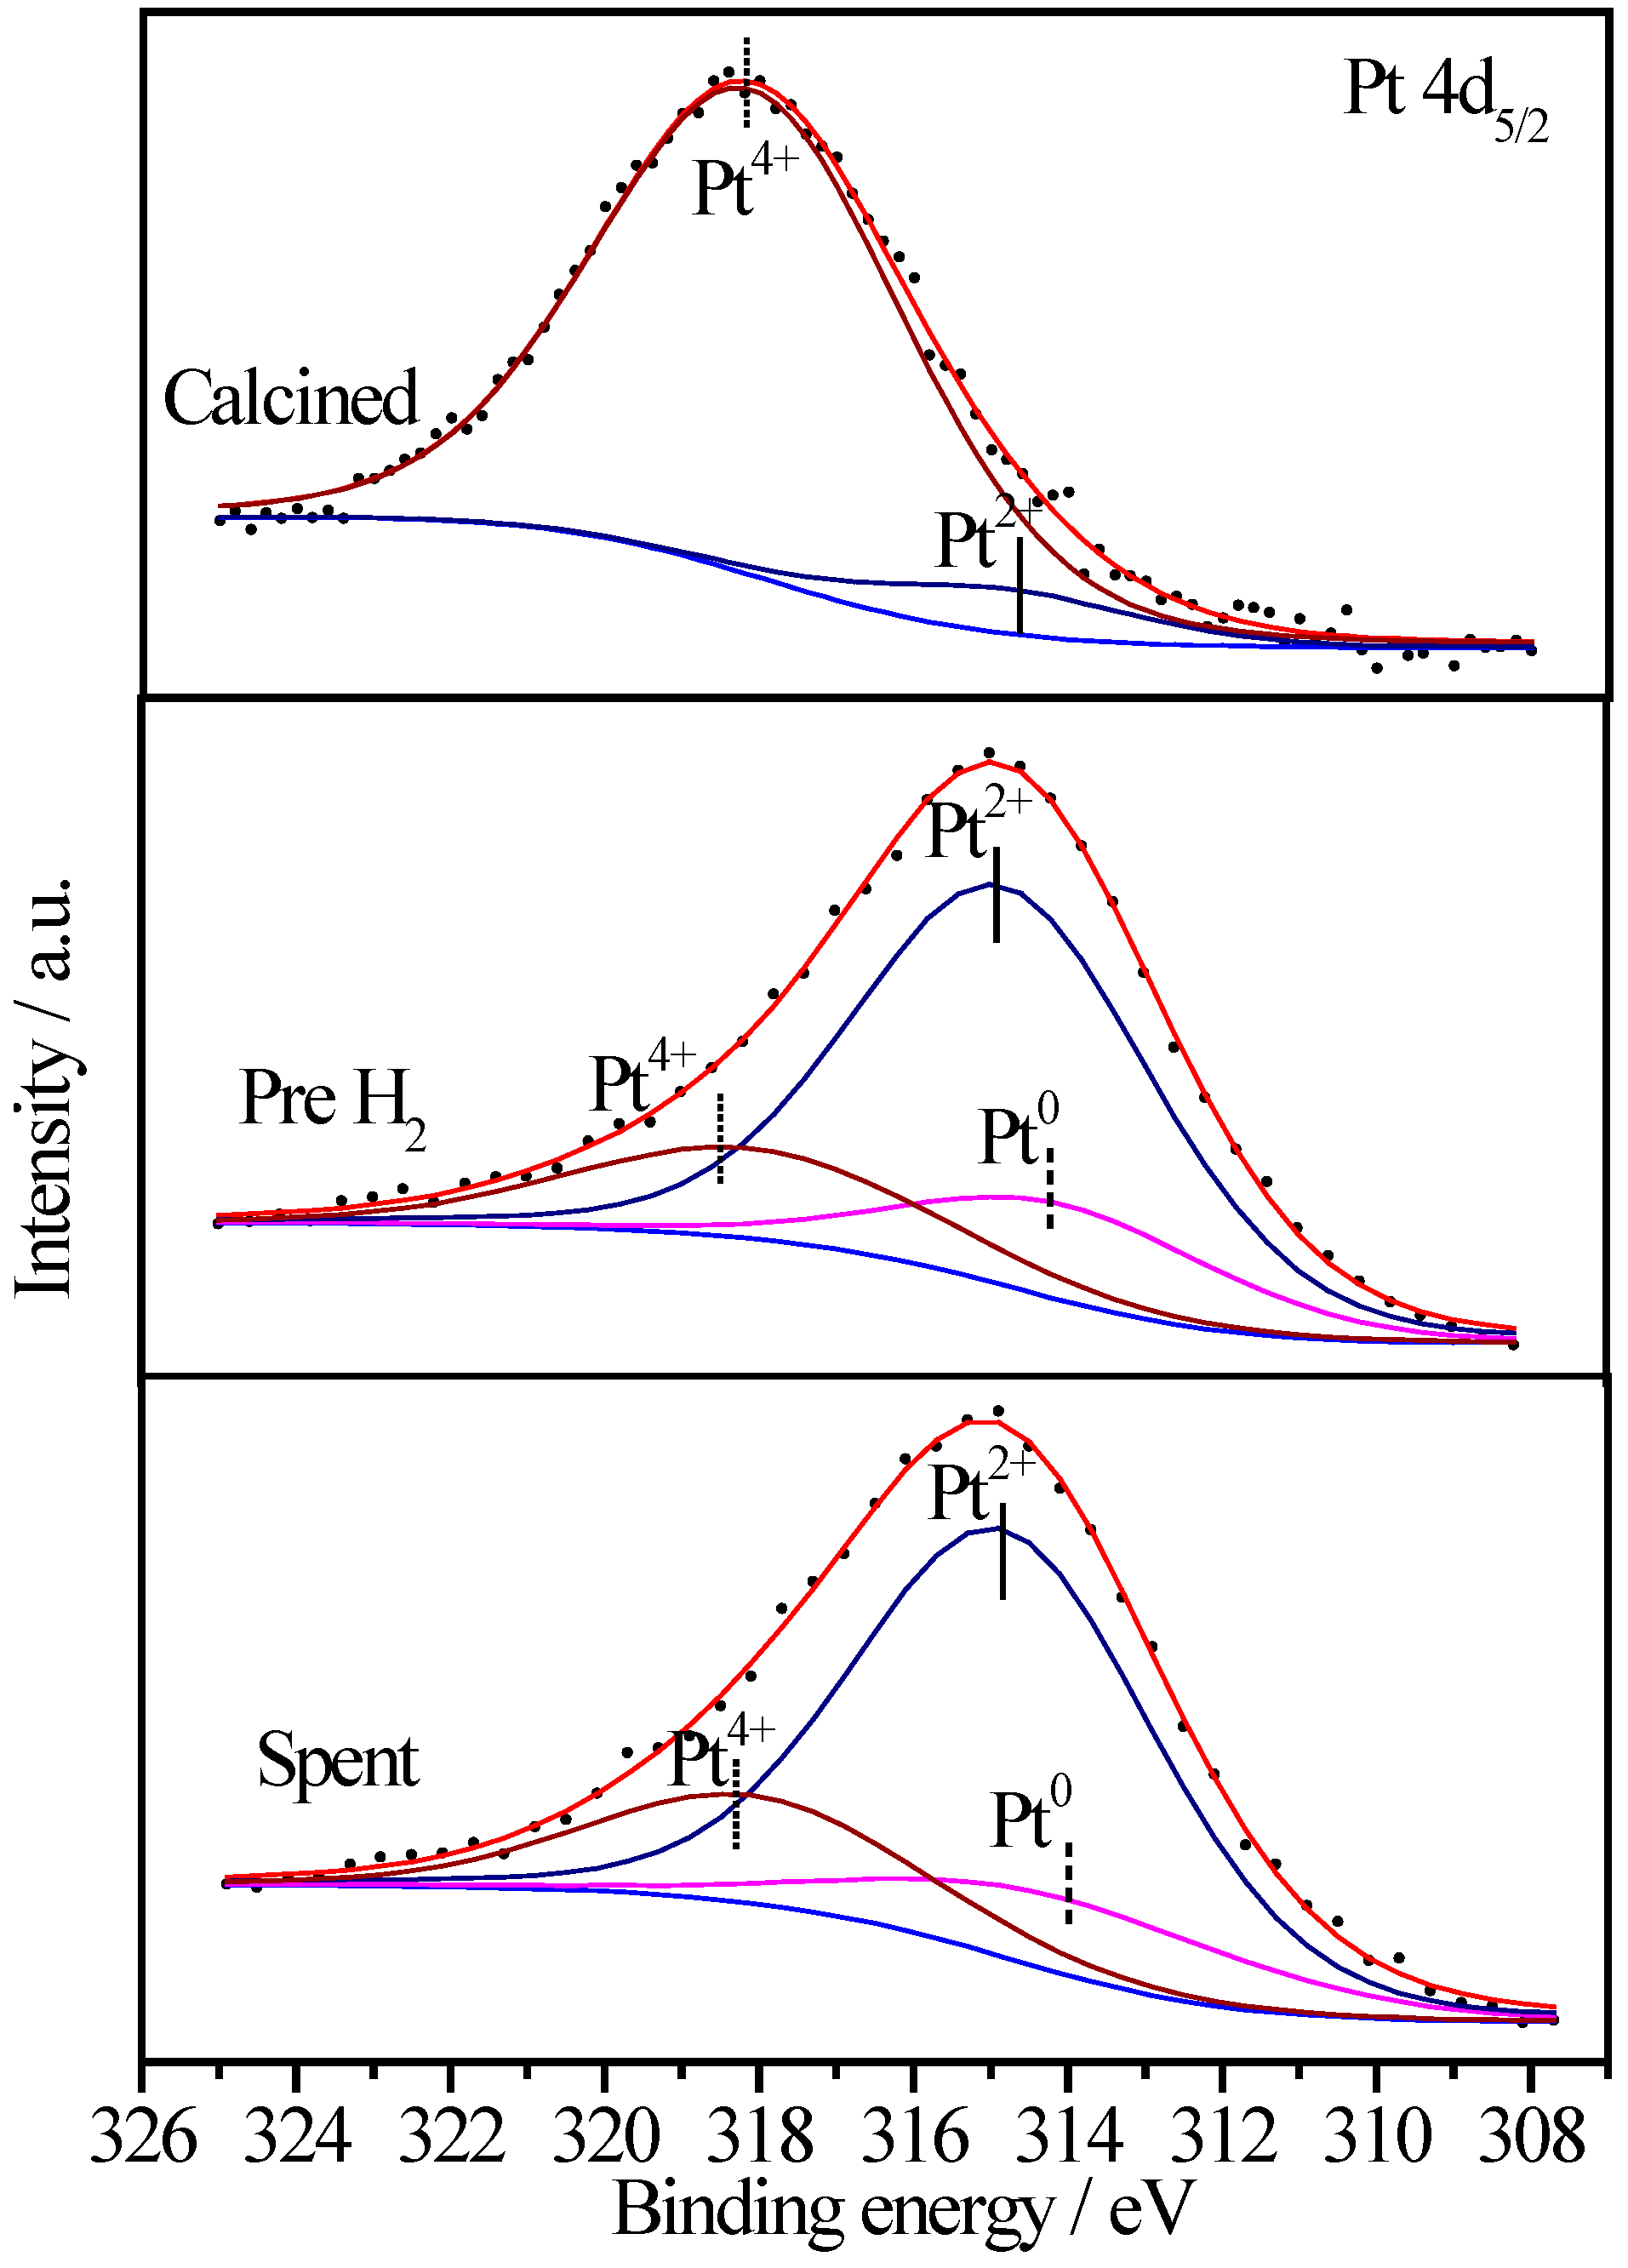
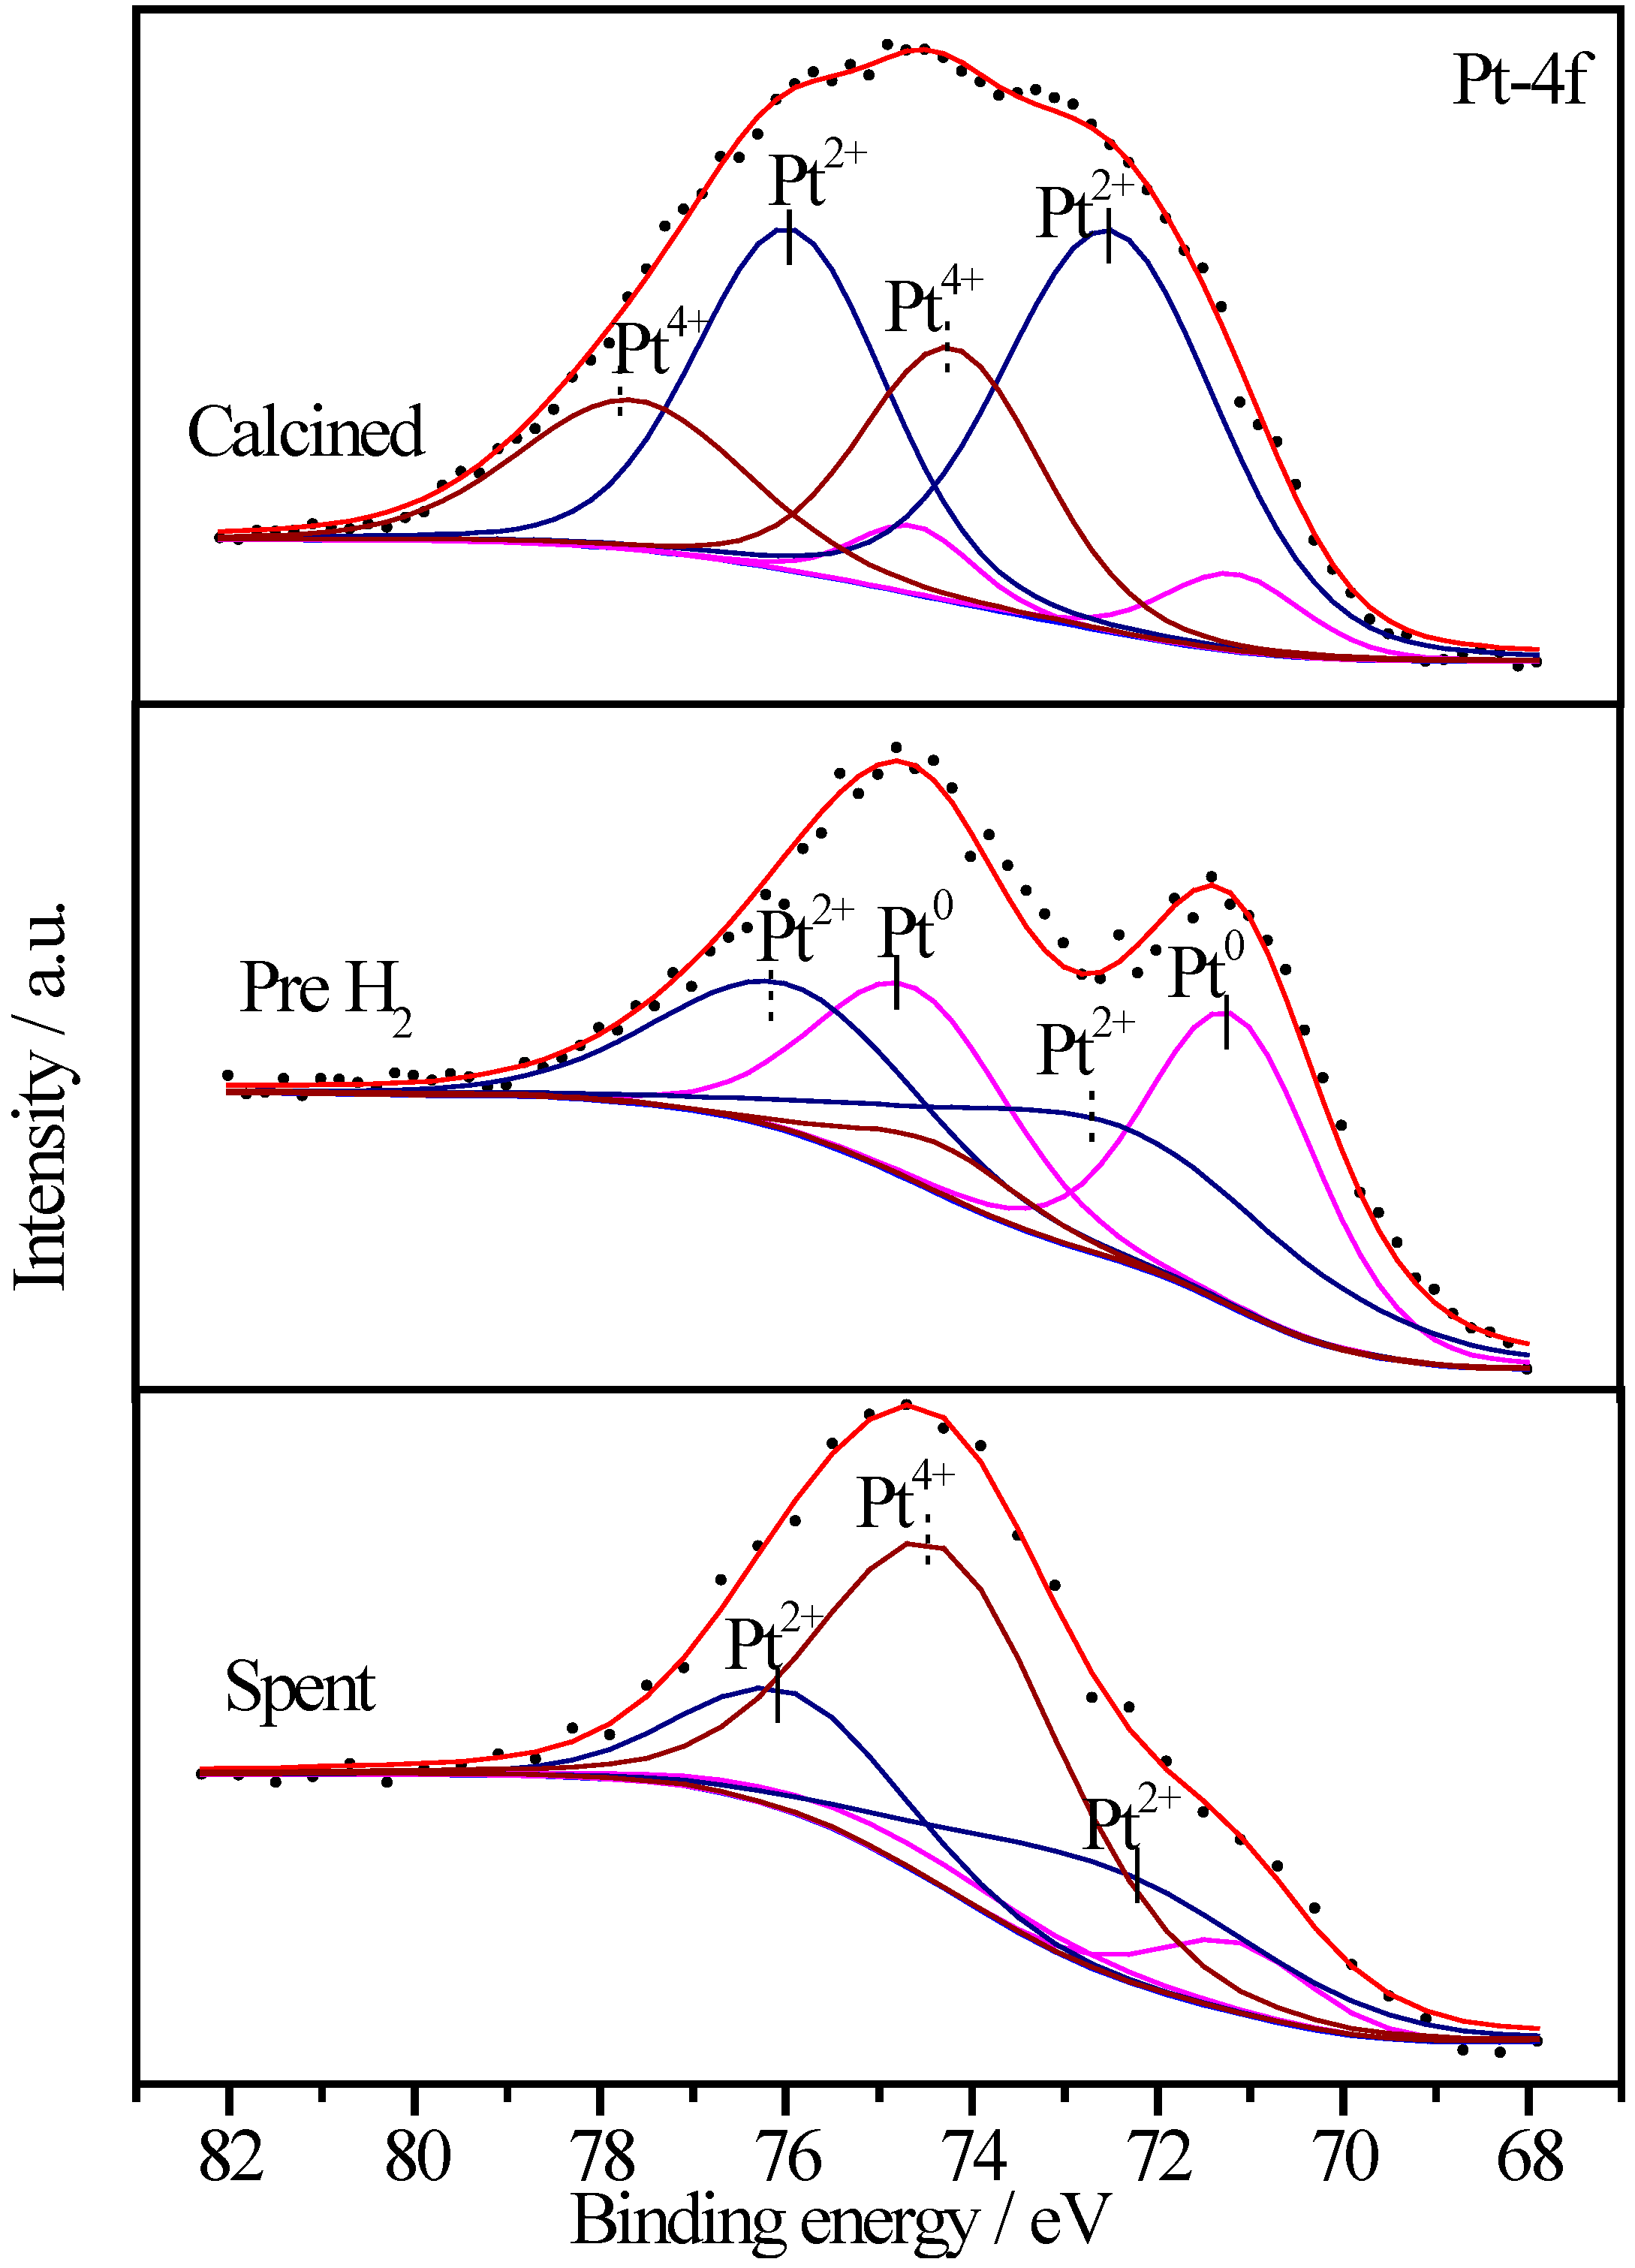
2.6.3. XPS Characterization of Pt Species

| Sample | Treatment State | Relative Proportions (%) | ||
|---|---|---|---|---|
| Pt0 | Pt2+ | Pt4+ | ||
| Pt/CoOx/SiO2 | I | - | 60.5 | 39.5 |
| II | 35.9 | 48.1 | 16.0 | |
| III | 51.6 | 42.2 | 6.2 | |
| Pt/CoOx/TiO2 | I | 7.6 | 60.5 | 31.9 |
| II | 46.2 | 46.1 | 7.7 | |
| III | 8.8 | 27.2 | 64.0 | |
| Pt/CoOx/Al2O3 | I | - | 7.3 | 92.7 |
| II | 16.6 | 65.5 | 17.9 | |
| III | 14.8 | 66.9 | 18.3 | |

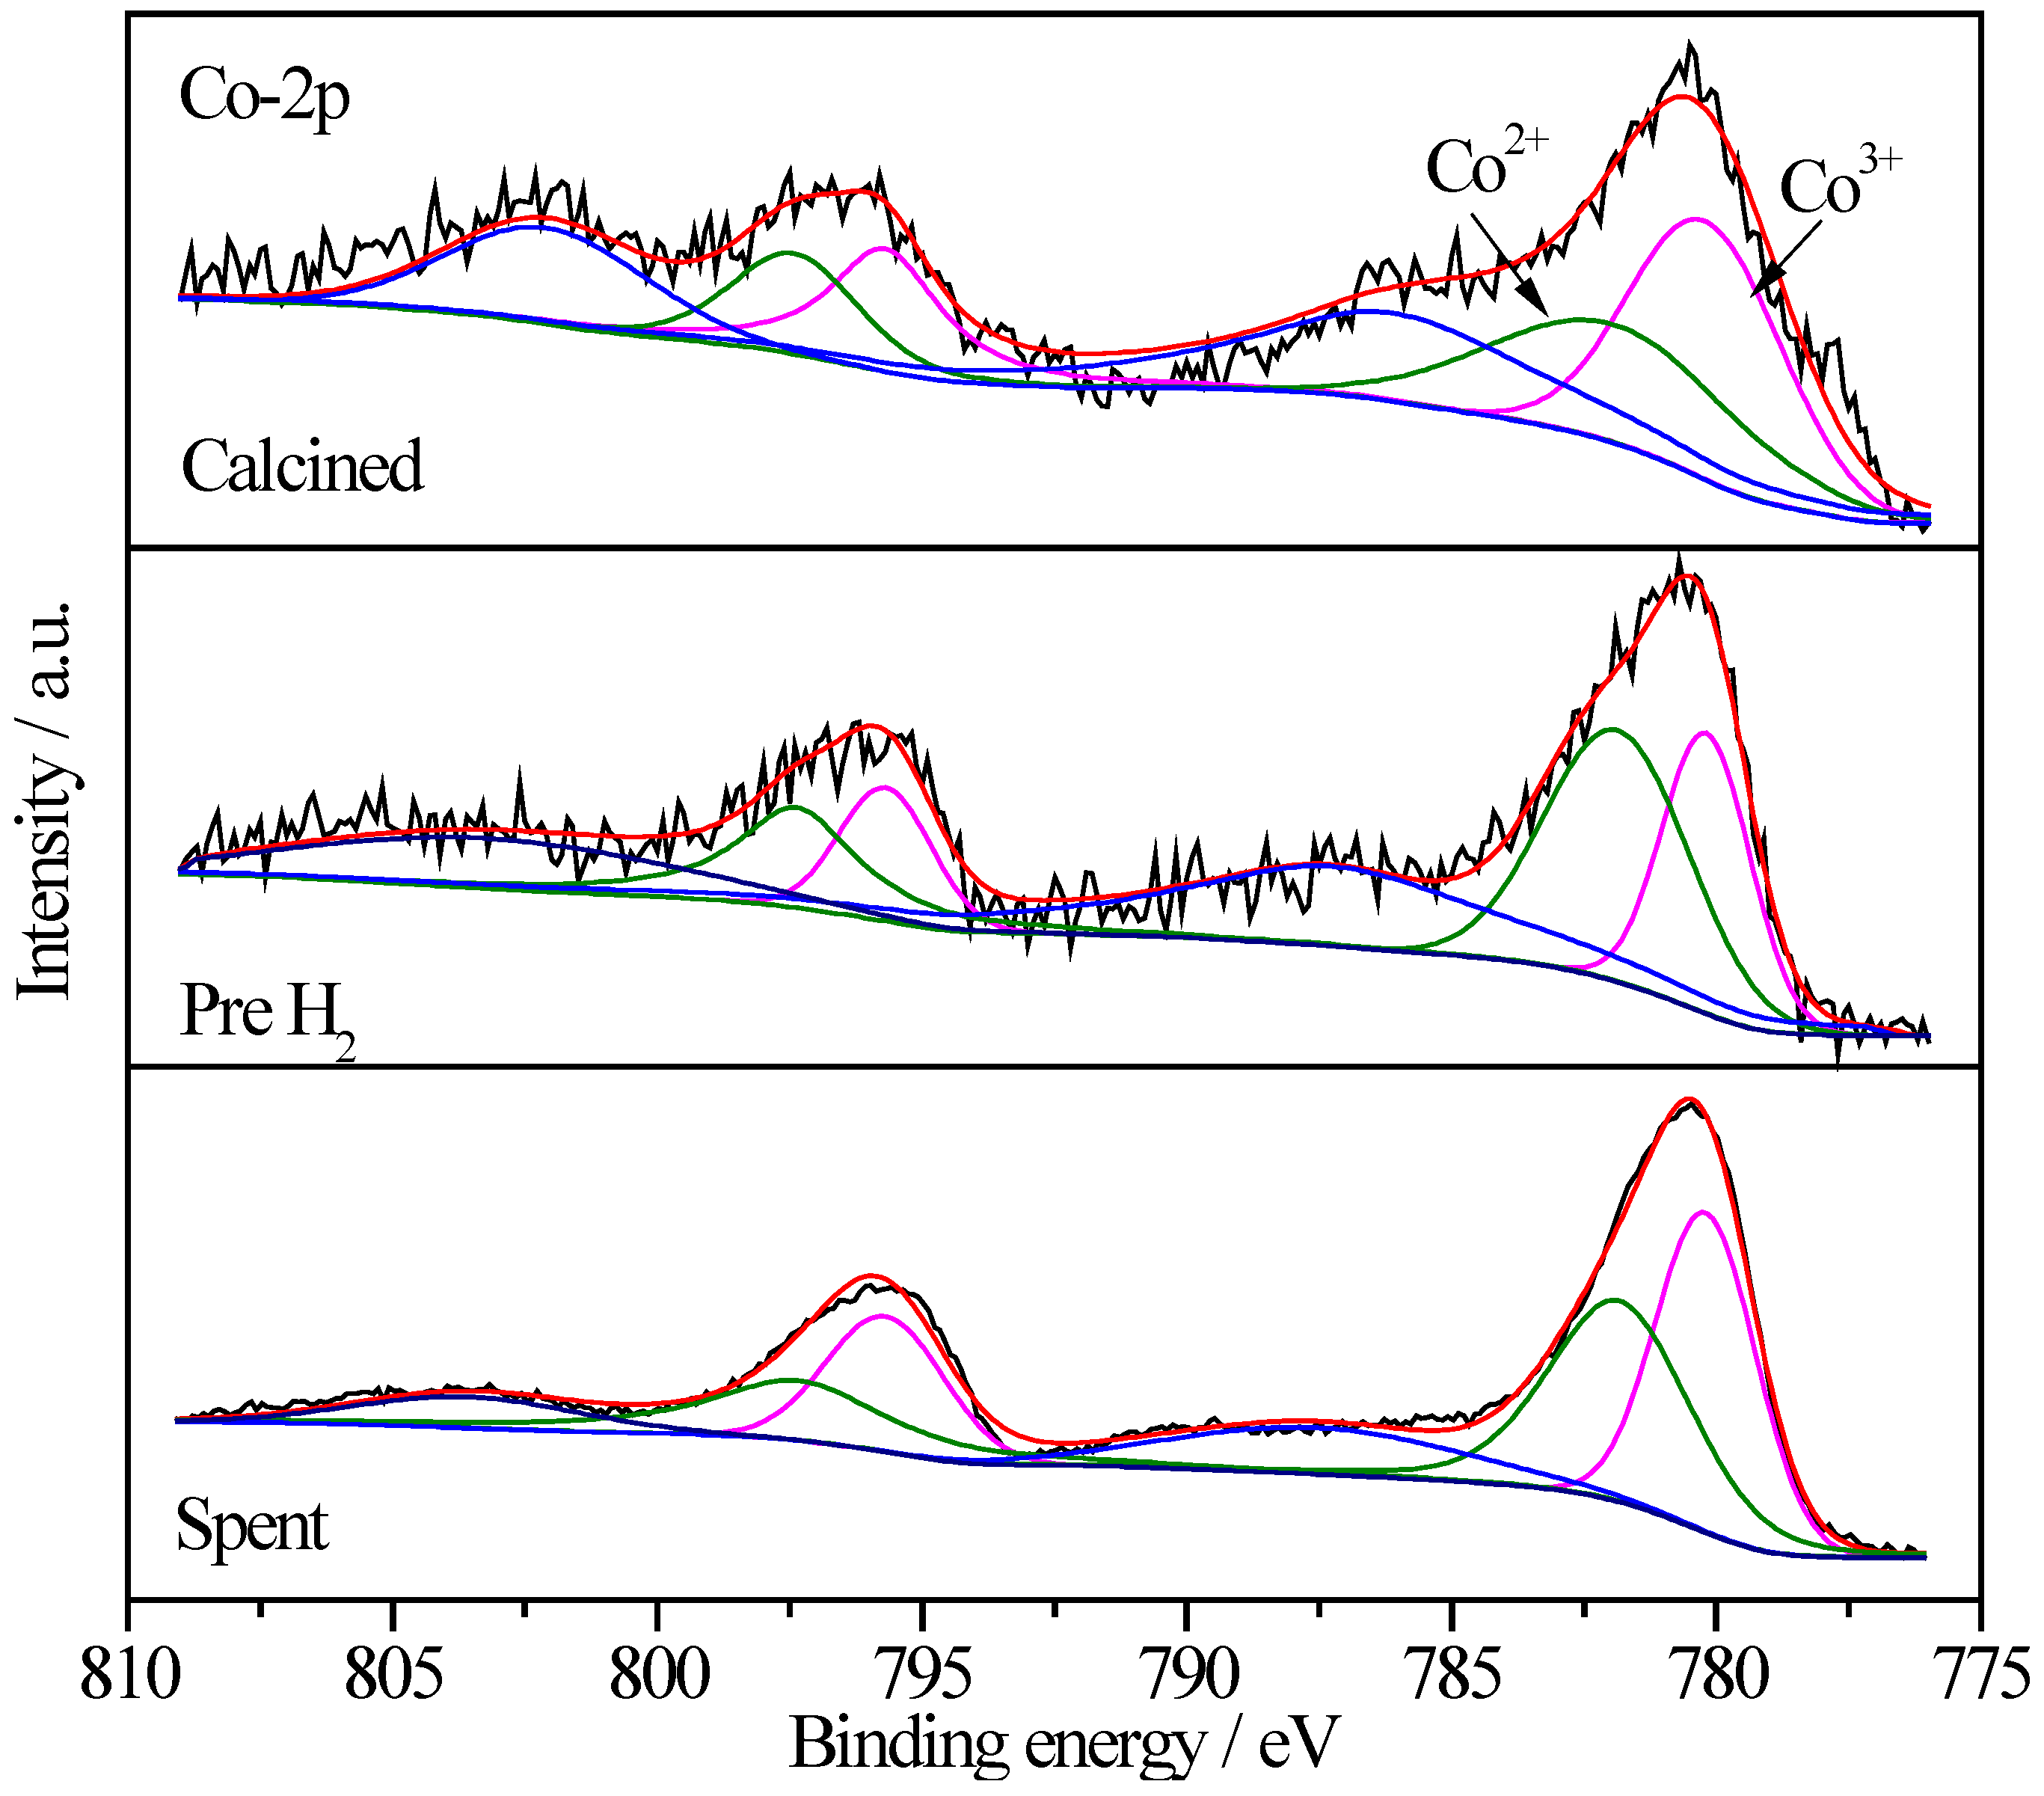
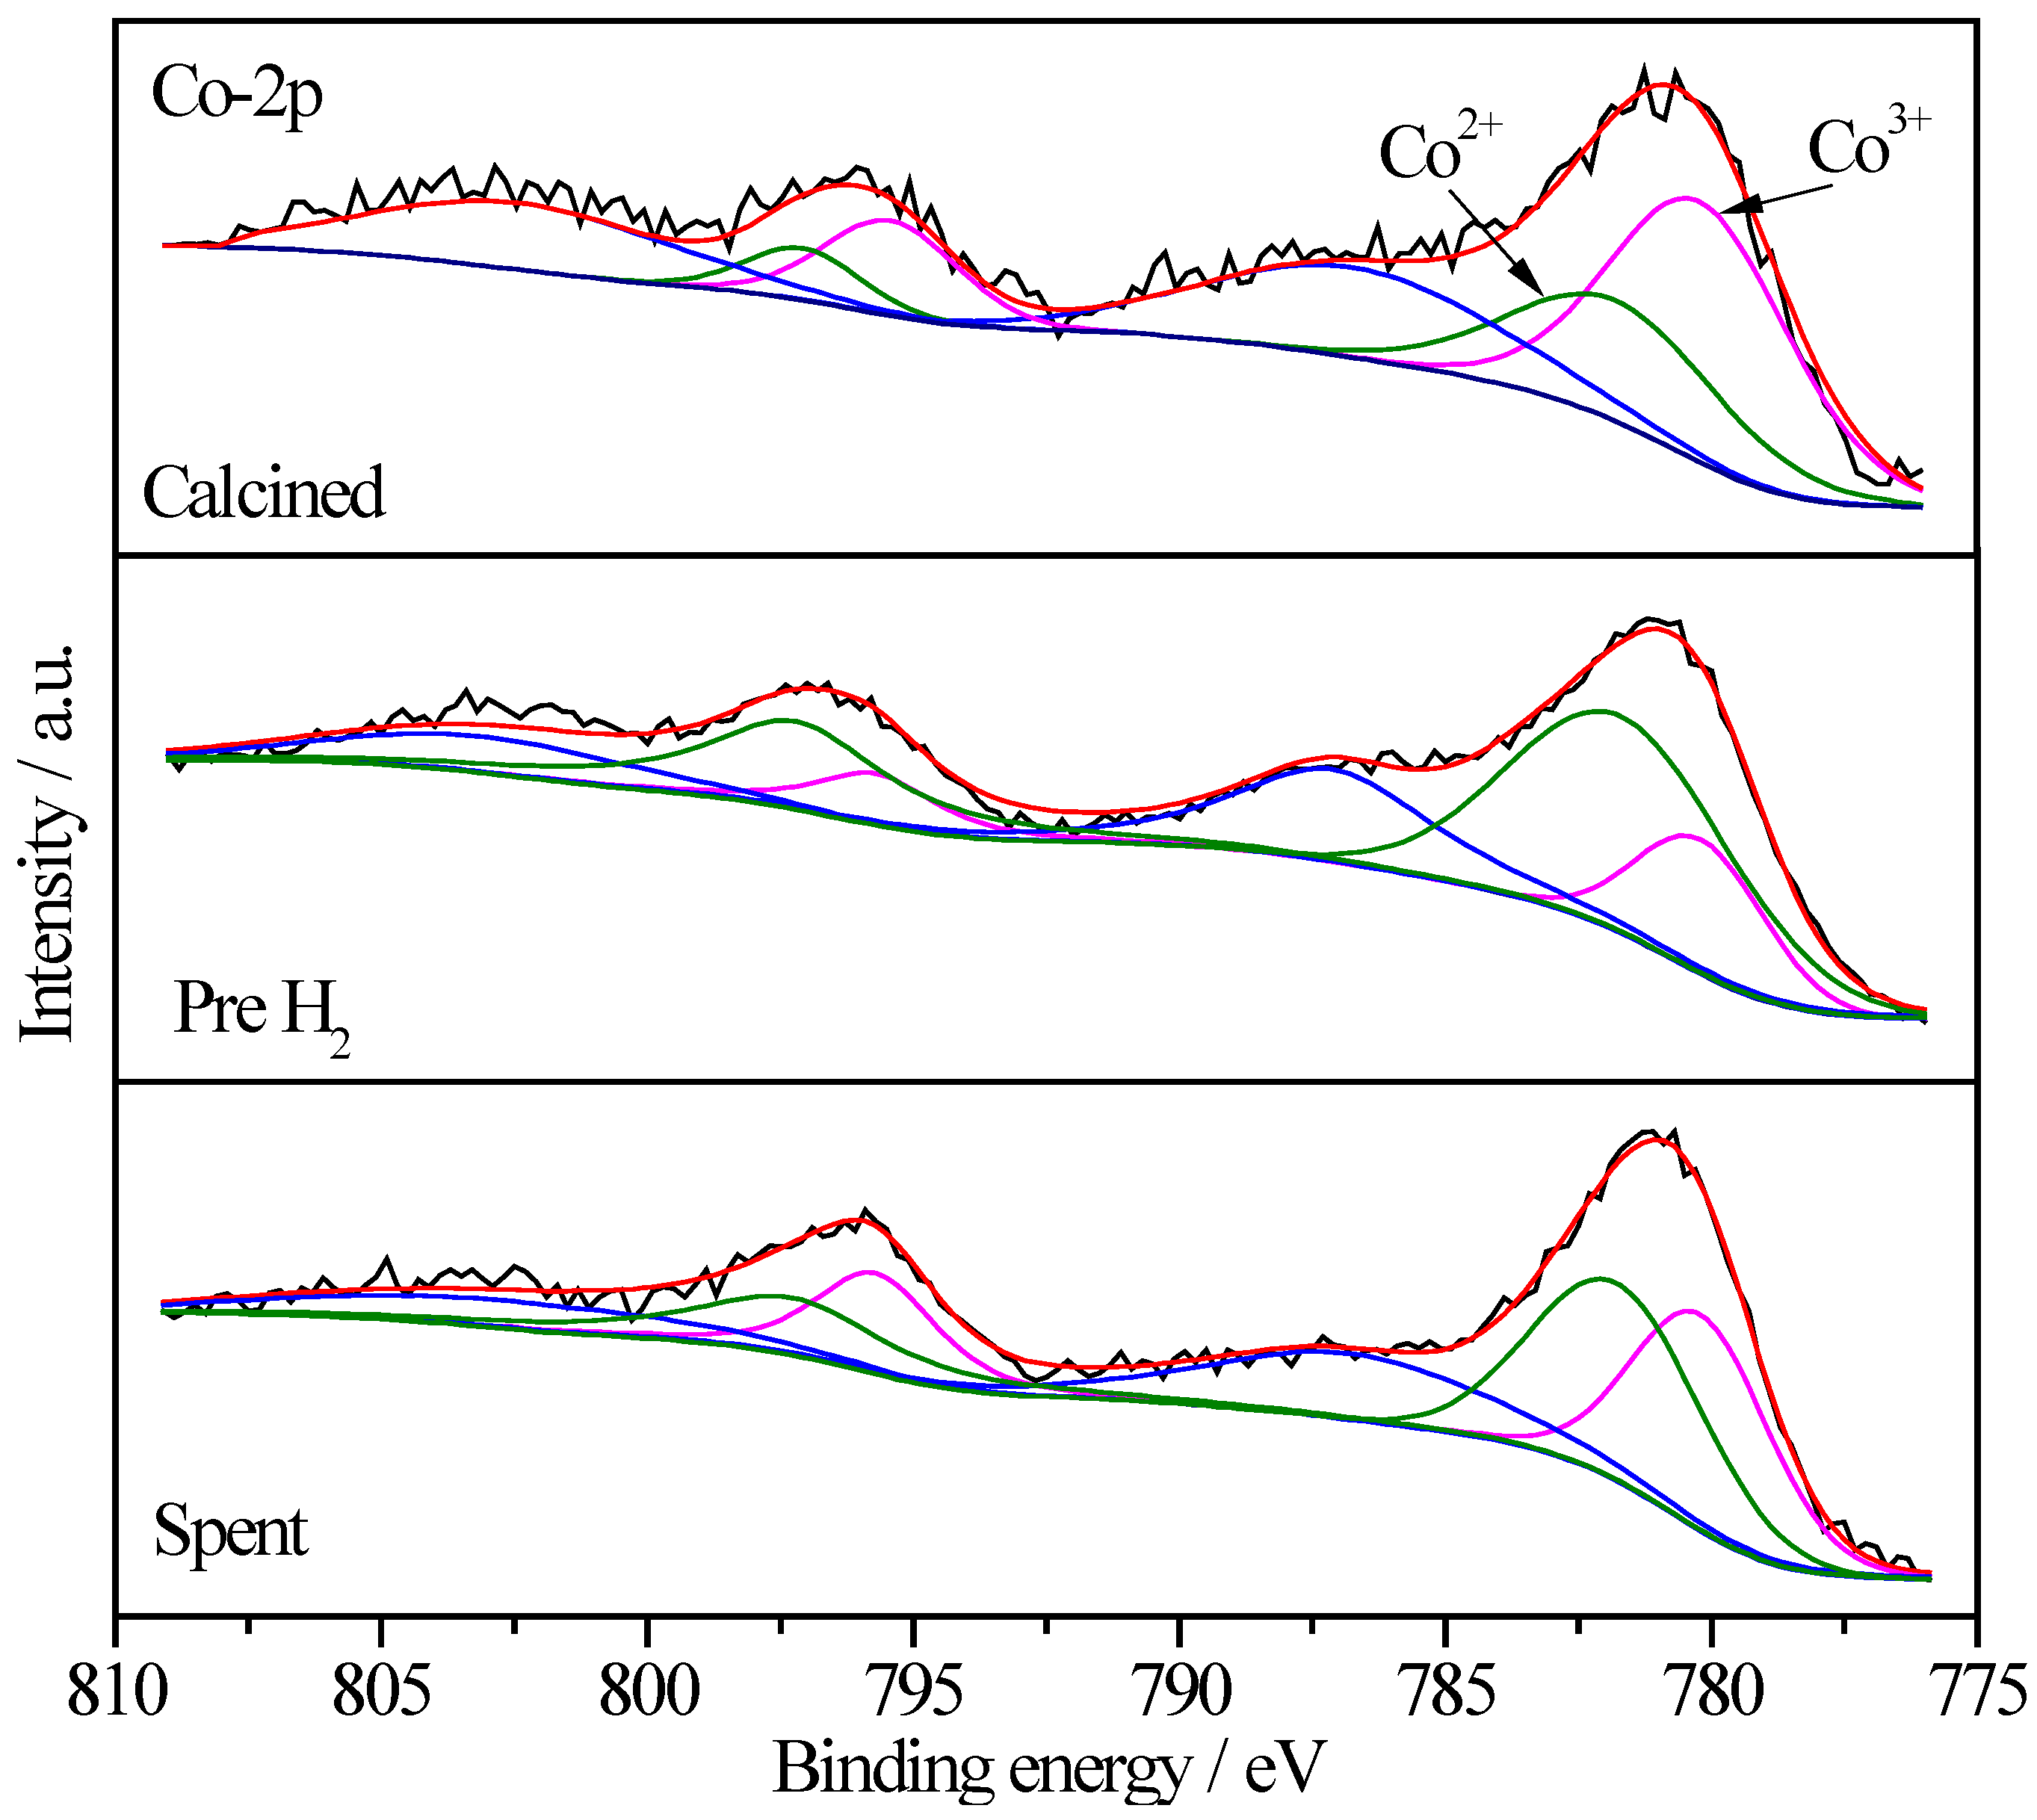
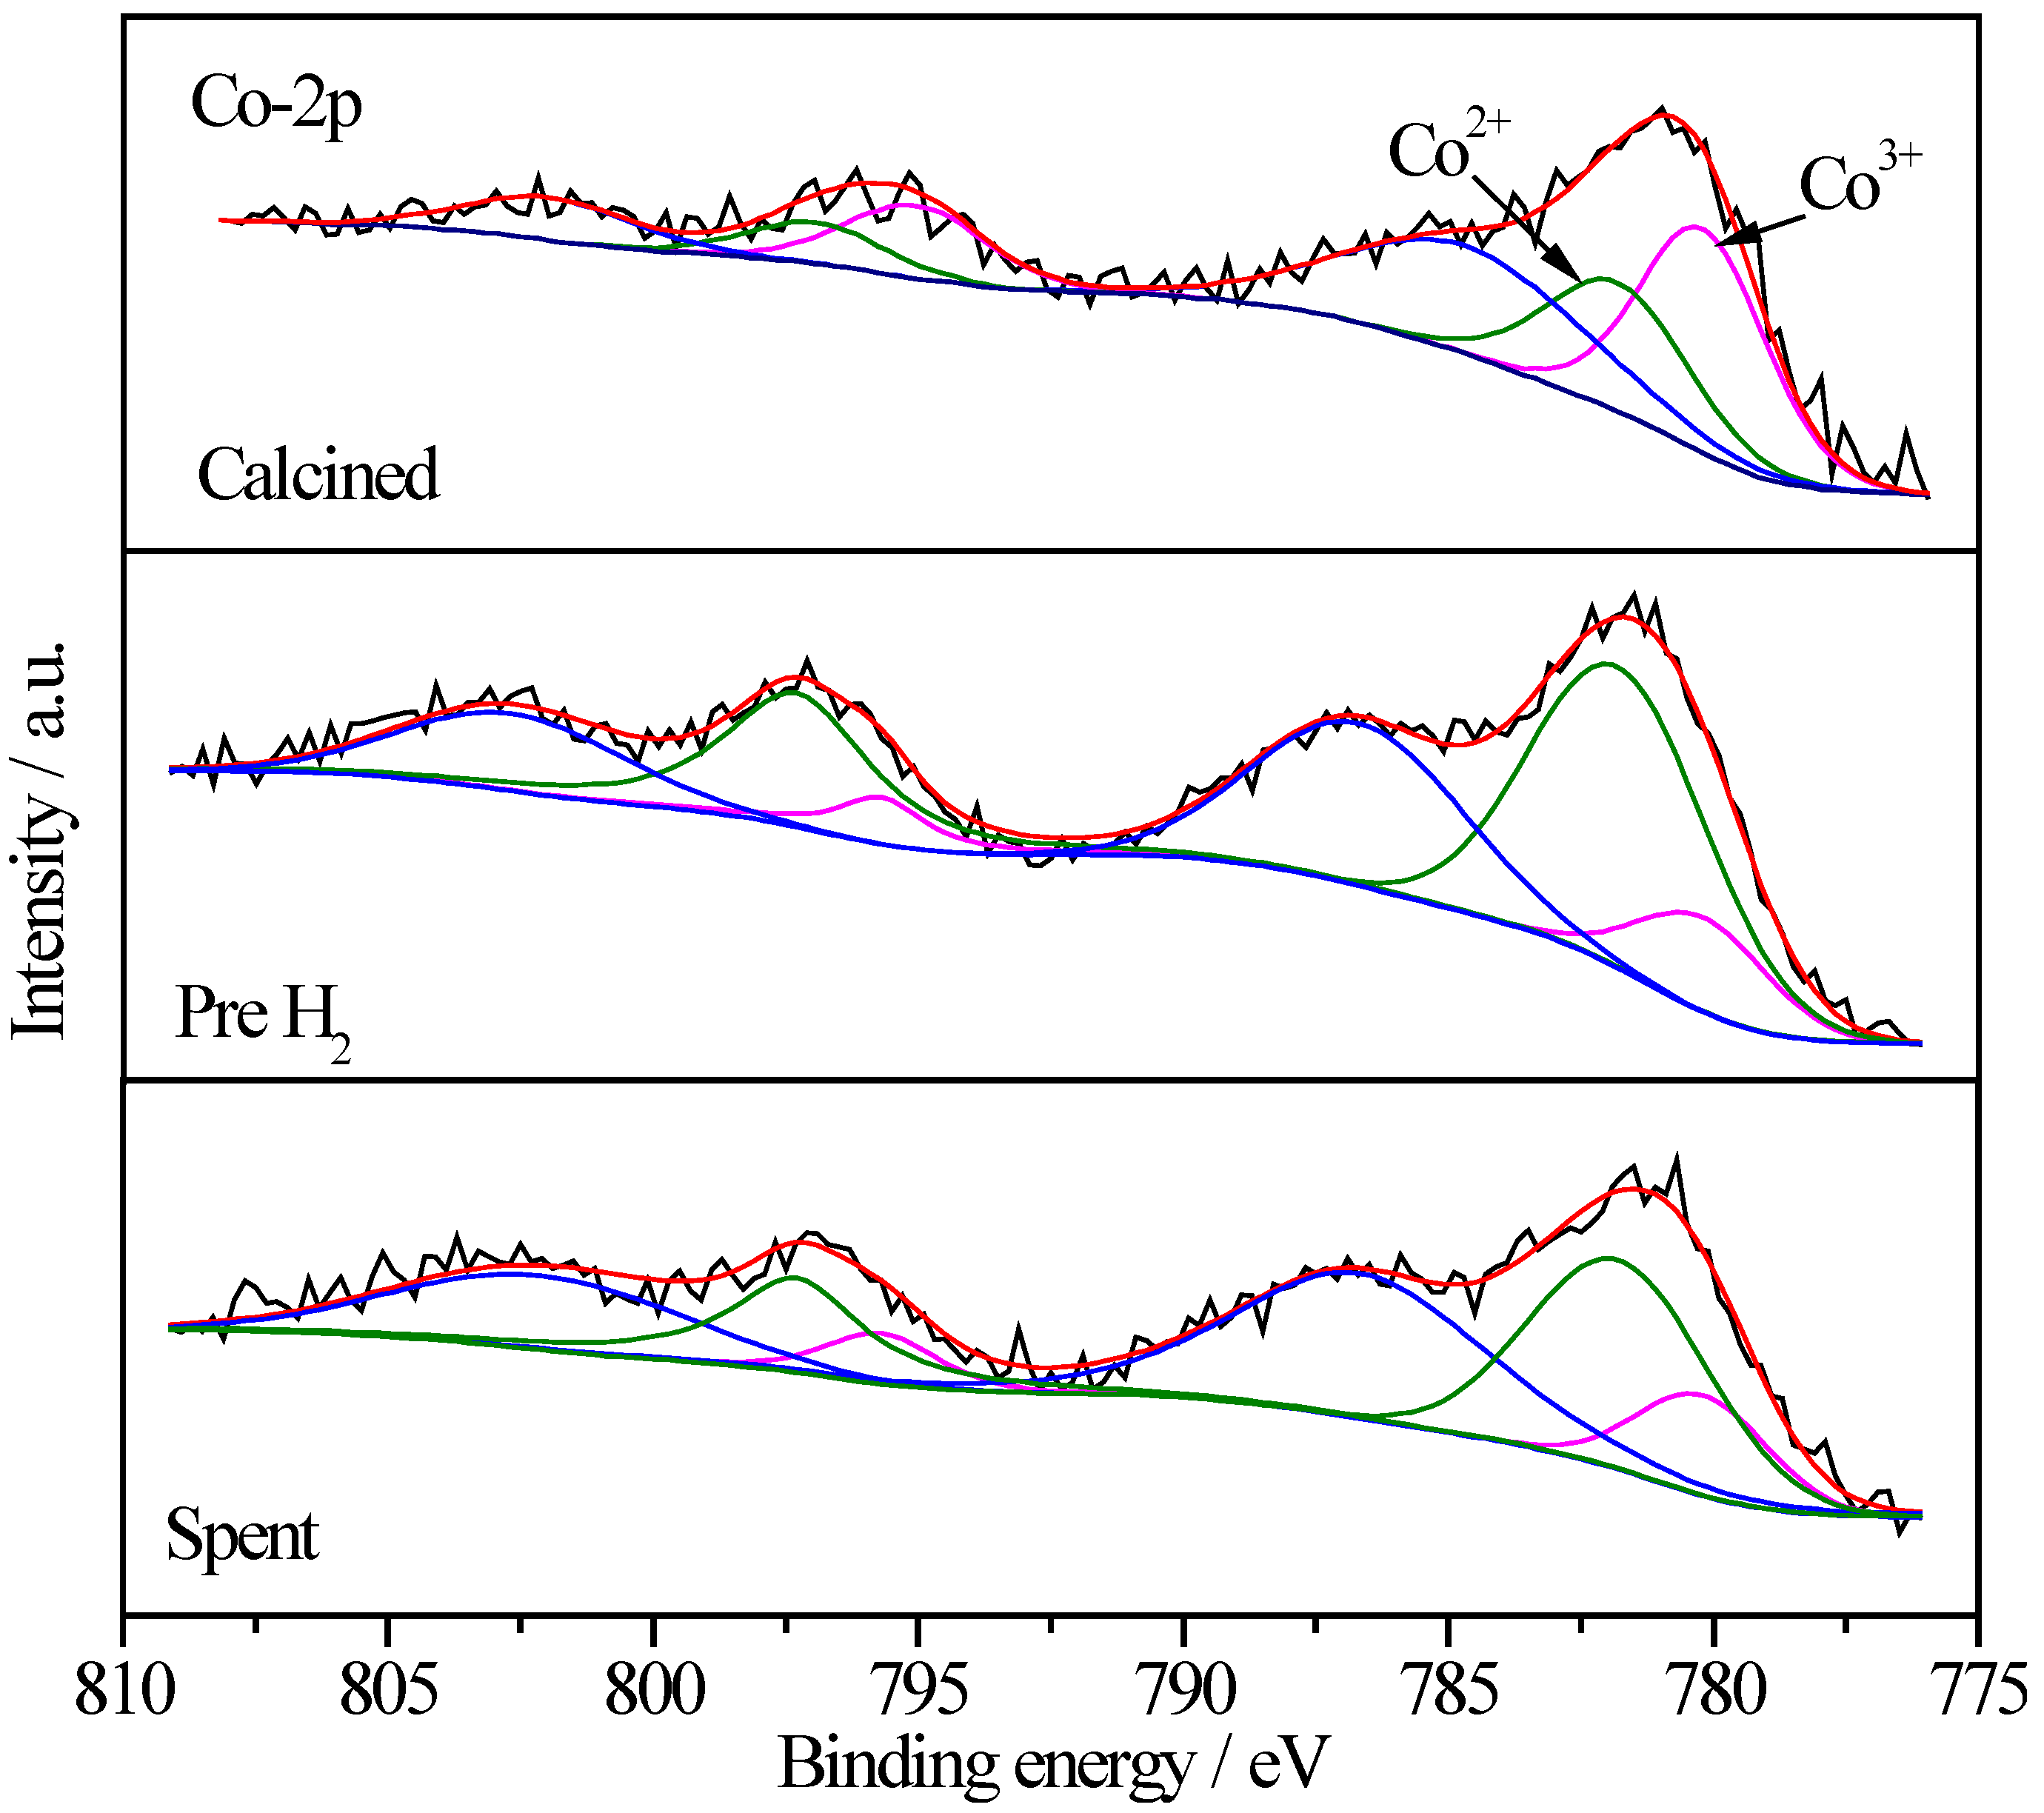
2.6.4. XPS Characterization of Co Species

| Sample | Treatment State | Relative Proportions (%) | |
|---|---|---|---|
| Co3+ | Co2+ | ||
| Pt/CoOx/SiO2 | I | 57.4 | 42.6 |
| II | 40.5 | 59.5 | |
| III | 49.8 | 50.2 | |
| Pt/CoOx/TiO2 | I | 64.5 | 35.5 |
| II | 18.8 | 81.2 | |
| III | 26.0 | 74.0 | |
| Pt/CoOx/Al2O3 | I | 65.0 | 35.0 |
| II | 26.4 | 73.6 | |
| III | 44.3 | 55.7 | |
2.6.5. CO-TPD


2.6.6. O2-TPD
2.6.7. CO2-TPD
2.6.8. Catalyst Stability
2.7. Discussion
3. Experimental Section
3.1. Synthesis of Modified Supports
3.2. Synthesis of Catalysis
3.3. Characterization
3.4. Catalytic Testing
4. Conclusions
Acknowledgments
Author Contributions
Conflicts of Interest
References
- Ma, Z.; Zaera, F. Heterogeneous catalysis by metals. In Encyclopedia of Inorganic Chemistry; Scott, R.A., Ed.; John Wiley & Sons: Chichester, UK, 2014. [Google Scholar] [CrossRef]
- Cao, A.M.; Lu, R.W.; Veser, G. Stabilizing metal nanoparticles for heterogeneous catalysis. Phys. Chem. Chem. Phys. 2010, 12, 13499–13510. [Google Scholar] [CrossRef] [PubMed]
- Ma, Z.; Dai, S. Development of novel supported gold catalysts: A materials perspective. Nano Res. 2011, 4, 3–32. [Google Scholar] [CrossRef]
- Wu, B.H.; Zheng, N.F. Surface and interface control of noble metal nanocrystals for catalytic and electrocatalytic applications. Nano Today 2013, 8, 168–197. [Google Scholar] [CrossRef]
- Yan, W.F.; Mahurin, S.M.; Pan, Z.W.; Overbury, S.H.; Dai, S. Ultrastable Au nanocatalyst supported on surface-modified TiO2 nanocrystals. J. Am. Chem. Soc. 2005, 127, 10480–10481. [Google Scholar] [CrossRef] [PubMed]
- Ma, Z.; Overbury, S.H.; Dai, S. Au/MxOy/TiO2 catalysts for CO oxidation: Promotional effect of main-group, transition, and rare-earth metal oxide additives. J. Mol. Catal. A 2007, 273, 186–197. [Google Scholar] [CrossRef]
- Ma, Z.; Yin, H.F.; Dai, S. Performance of Au/MxOy/TiO2 catalysts in water-gas shift reaction. Catal. Lett. 2010, 136, 83–91. [Google Scholar] [CrossRef]
- Grisel, R.J.H.; Weststrate, C.J.; Goossens, A.; Craje, M.W.J.; van der Kraan, A.M. Oxidation of CO over Au/MOx/Al2O3 multi-component catalysts in a hydrogen-rich environment. Catal. Today 2002, 72, 123–132. [Google Scholar] [CrossRef]
- Qian, K.; Huang, W.X.; Jiang, Z.Q.; Sun, H.X. Anchoring highly active gold nanoparticles on SiO2 by CoOx additive. J. Catal. 2007, 248, 137–141. [Google Scholar] [CrossRef]
- Yan, W.F.; Ma, Z.; Mahurin, S.M.; Jiao, J.; Hagaman, E.W.; Overbury, S.H. Novel Au/TiO2/Al2O3·xH2O catalysts for CO oxidation. Catal. Lett. 2008, 121, 209–218. [Google Scholar] [CrossRef]
- Guczi, L.; Beck, A.; Frey, K. Role of promoting oxide morphology dictating the activity of Au/SiO2 catalyst in CO oxidation. Gold Bull. 2009, 42, 5–12. [Google Scholar] [CrossRef]
- Qian, K.; Lv, S.S.; Xiao, X.Y.; Sun, H.X.; Lu, J.Q.; Luo, M.F.; Huang, W.X. Influences of CeO2 microstructures on the structure and activity of Au/CeO2/SiO2 catalysts in CO oxidation. J. Mol. Catal. A 2009, 306, 40–47. [Google Scholar] [CrossRef]
- Törncrona, A.; Skoglundh, M.; Thormählen, P.; Fridell, E.; Jobson, E. Low temperature catalytic activity of cobalt oxide and ceria promoted Pt and Pd: Influence of pretreatment and gas composition. Appl. Catal. B 1997, 14, 131–145. [Google Scholar] [CrossRef]
- Thormählen, P.; Skoglundh, M.; Fridell, E.; Andersson, B. Low-temperature CO oxidation over platinum and cobalt oxide catalysts. J. Catal. 1999, 188, 300–310. [Google Scholar] [CrossRef]
- Navarro, R.M.; Álvarez-Galván, M.C.; Sánchez-Sánchez, M.C.; Rosa, F.; Fierro, J.L.G. Production of hydrogen by oxidative reforming of ethanol over Pt catalysts supported on Al2O3 modified with Ce and La. Appl. Catal. B 2005, 55, 229–241. [Google Scholar] [CrossRef]
- Jain, S.K.; Crabb, E.M.; Smart, L.E.; Thompsett, D.; Steele, A.M. Controlled modification of Pt/Al2O3 for the preferential oxidation of CO in hydrogen: A comparative study of modifying element. Appl. Catal. B 2009, 89, 349–355. [Google Scholar] [CrossRef]
- Tomita, A.; Shimizu, K.; Kato, K.; Tai, Y. Pt/Fe-containing alumina catalysts prepared and treated with water under moderate conditions exhibit low-temperature CO oxidation activity. Catal. Commun. 2012, 17, 194–199. [Google Scholar] [CrossRef]
- Kim, M.Y.; Choi, J.S.; Toops, T.J.; Jeong, E.S.; Han, S.W.; Schwartz, V.; Chen, J.H. Coating SiO2 support with TiO2 or ZrO2 and effects on structure and CO oxidation performance of Pt catalysts. Catalysts 2013, 3, 88–103. [Google Scholar] [CrossRef]
- Tomita, A.; Shimizu, K.; Tai, Y. Effect of metal oxide promoters on low temperature CO oxidation over water-pretreated Pt/alumina catalysts. Catal. Lett. 2014, 144, 1689–1695. [Google Scholar] [CrossRef]
- Mergler, Y.J.; van Aalst, A.; van Delft, J.; Nieuwenhuys, B.E. Promoted Pt catalysts for automotive pollution control: Characterization of Pt/SiO2, Pt/CoOx/SiO2, and Pt/MnOx/SiO2 Catalysts. J. Catal. 1996, 161, 310–318. [Google Scholar] [CrossRef]
- Mergler, Y.J.; van Aalst, A.; van Delft, J.; Nieuwenhuys, B.E. CO oxidation over promoted Pt catalysts. Appl. Catal. B 1996, 10, 245–261. [Google Scholar] [CrossRef]
- Mergler, Y.J.; Nieuwenhuys, B.E. NO reduction by H2 over promoted Pt catalysts. Appl. Catal. B 1997, 12, 95–110. [Google Scholar] [CrossRef]
- Panagiotopoulou, P.; Kondarides, D.I. A comparative study of the water-gas shift activity of Pt catalysts supported on single (MOx) and composite (MOx/Al2O3, MOx/TiO2). Catal. Today 2007, 127, 319–329. [Google Scholar] [CrossRef]
- Lieske, H.; Lietz, G.; Spindler, H.; Völterb, J. Reactions of platinum in oxygen- and hydrogen-treated Pt/γ-Al2O3 catalysts: I. Temperature-programmed reduction, adsorption, and redispersion of platinum. J. Catal. 1983, 81, 8–16. [Google Scholar] [CrossRef]
- Gardner, S.D.; Hoflund, G.B.; Schryer, D.R.; Upchurch, B.T. Characterization study of silica-supported platinized tin oxide catalysts used for low-temperature carbon monoxide oxidation: Effect of pretreatment temperature. J. Phys. Chem. 1991, 95, 835–838. [Google Scholar] [CrossRef]
- Gracia, F.J.; Miller, J.T.; Kropf, A.J.; Wolf, E.E. Kinetics, FTIR, and controlled atmosphere EXAFS study of the effect of chlorine on Pt-supported catalysts during oxidation reactions. J. Catal. 2002, 209, 341–354. [Google Scholar] [CrossRef]
- Arnoldy, P.; Moulijn, J.A. Temperature programmed reduction of CoO/Al2O3 catalysts. J. Catal. 1985, 93, 38–54. [Google Scholar] [CrossRef]
- Huizinga, T.; Vangrondelle, J.; Prins, R. A temperature programmed reduction study of Pt on Al2O3 and TiO2. Appl. Catal. 1984, 2, 199–213. [Google Scholar] [CrossRef]
- Sun, S.; Tsubaki, K.; Fujimoto, K. The reaction performances and characterization of Fischer–Tropsch synthesis Co/SiO2 catalysts prepared from mixed cobalt salts. Appl. Catal. A 2000, 202, 121–131. [Google Scholar] [CrossRef]
- Tiernan, M.J.; Fesenko, E.A.; Barnes, P.A.; Parkes, G.M.B.; Ronane, M. The application of CRTA and linear heating thermoanalytical techniques to the study of supported cobalt oxide methane combustion catalysts. Thermochim. Acta 2001, 379, 163–175. [Google Scholar] [CrossRef]
- Xue, L.; Zhang, C.B.; He, H.; Teraoka, Y. Catalytic decomposition of N2O over CeO2 promoted Co3O4 spinel catalyst. Appl. Catal. B 2007, 75, 167–174. [Google Scholar] [CrossRef]
- Liu, Y.Y.; Hanaoka, T.; Miyazawa, T.; Murata, K.; Okabe, K.; Sakanishi, K. Fischer–Tropsch synthesis in slurry-phase reactors over Mn- and Zr-modified Co/SiO2 catalysts. Fuel Process. Technol. 2009, 90, 901–908. [Google Scholar] [CrossRef]
- Matolin, V.; Matolinova, I.; Vaclavu, M.; Khalakhan, I.; Vorokhta, M.; Fiala, R.; Pis, I.; Sofer, Z.; Poltierova-Vejpravova, J.; Mori, T.; et al. Platinum-doped CeO2 thin film catalysts prepared by magnetron sputtering. Langmuir 2010, 26, 12824–12831. [Google Scholar] [CrossRef] [PubMed]
- Kiss, G.; Josepovits, V.K.; Kovacs, K.; Ostrickb, B.; Fleischerb, M.; Meixnerb, H.; Réti, F. CO sensitivity of the PtO/SnO2 and PdO/SnO2 layer structures: Kelvin probe and XPS analysis. Thin Solid Films 2003, 436, 115–118. [Google Scholar] [CrossRef]
- Wu, G.; Chen, Y.S.; Xu, B.Q. Remarkable support effect of SWNTs in Pt catalyst for methanol electro oxidation. Electrochem. Commun. 2005, 7, 1237–1243. [Google Scholar] [CrossRef]
- Wang, D.L.; Lu, S.F.; Jiang, S.P. Tetrahydrofuran-functionalized multi-walled carbon nanotubes as effective support for Pt and PtSn electrocatalysts of fuel cells. Electrochim. Acta 2010, 55, 2964–2971. [Google Scholar] [CrossRef]
- Şen, F.; Gökağaç, G. Different sized platinum nanoparticles supported on carbon: An XPS study on these methanol oxidation catalysts. J. Phys. Chem. C 2007, 111, 5715–5720. [Google Scholar] [CrossRef]
- Riguetto, B.A.; Damyanova, S.; Gouliev, G.; Marques, C.M.P.; Petrov, L.; Bueno, J.M.C. Surface behavior of alumina-supported Pt catalysts modified with cerium as revealed by X-ray diffraction, X-ray photoelectron spectroscopy, and Fourier transform infrared spectroscopy of CO adsorption. J. Phys. Chem. B 2004, 108, 5349–5358. [Google Scholar] [CrossRef]
- Bouwman, R.; Biloen, P. Valence state and interaction of platinum and germanium on γ-Al2O3 investigated by X-ray photoelectron spectroscopy. J. Catal. 1977, 48, 209–216. [Google Scholar] [CrossRef]
- Shyu, J.Z.; Otto, K. Identification of platinum phases on γ-alumina by XPS. Appl. Surf. Sci. 1988, 32, 246–252. [Google Scholar] [CrossRef]
- Serrano-Ruiza, J.C.; Huberb, G.W.; Sánchez-Castillob, M.A.; Dumesicb, J.A.; Rodríguez-Reinosoa, F.; Sepúlveda-Escribanoa, A. Effect of Sn addition to Pt/CeO2-Al2O3 and Pt/Al2O3 catalysts: An XPS, 119Sn Mössbauer and microcalorimetry study. J. Catal. 2006, 241, 378–388. [Google Scholar] [CrossRef]
- Wang, X.D.; Yu, H.B.; Hua, D.Y.; Zhou, S.H. Enhanced catalytic hydrogenation activity and selectivity of Pt-MxOy/Al2O3 (M = Ni, Fe, Co) heteroaggregate catalysts by in situ transformation of PtM alloy nanoparticles. J. Phys. Chem. C 2013, 117, 7294–7302. [Google Scholar] [CrossRef]
- Epling, W.S.; Hoflund, G.B.; Weaver, J.F. Surface characterization study of Au/α-Fe2O3 and Au/Co3O4 low-temperature CO oxidation catalysts. J. Phys. Chem. 1996, 100, 9929–9934. [Google Scholar] [CrossRef]
- Pietrogiacomi, D.; Tuti, S.; Campa, M.C.; Indovina, V. Cobalt supported on ZrO2: Catalysts characterization and their activity for the reduction of NO with C3H6 in the presence of excess O2. Appl. Catal. B 2000, 28, 43–54. [Google Scholar] [CrossRef]
- Kang, M.; Song, M.W.; Lee, C.H. Catalytic carbon monoxide oxidation over CoOx/CeO2 composite catalysts. Appl. Catal. A 2003, 251, 143–156. [Google Scholar] [CrossRef]
- Xie, S.H.; Dai, H.X.; Deng, J.G.; Liu, Y.X.; Yang, H.G.; Jiang, Y.; Tan, W.; Ao, A.S.; Guo, G.S. Au/3DOM Co3O4: Highly active nanocatalysts for the oxidation of carbon monoxide and toluene. Nanoscale 2013, 5, 11207–11219. [Google Scholar] [CrossRef] [PubMed]
- Li, J.; Lu, G.Z.; Wu, G.S.; Mao, D.S.; Guo, Y.L.; Wang, Y.Q.; Guo, Y. Effect of TiO2 crystal structure on the catalytic performance of Co3O4/TiO2 catalyst for low-temperature CO oxidation. Catal. Sci. Technol. 2014, 4, 1268–1275. [Google Scholar] [CrossRef]
- Lee, C.H.; Chen, Y.W. Effect of basic additives on Pt/Al2O3 for CO and propylene oxidation under oxygen deficient conditions. Ind. Eng. Chem. Res. 1997, 36, 1498–1506. [Google Scholar] [CrossRef]
- Chen, G.X.; Zhao, Y.; Fu, G.; Duchesne, P.N.; Gu, L.; Zheng, Y.P.; Weng, X.F.; Chen, M.S.; Zhang, P.; Pao, C.W.; et al. Interfacial effects in iron-nickel hydroxide-platinum nanoparticles enhance catalytic oxidation. Science 2014, 344, 495–499. [Google Scholar] [CrossRef] [PubMed]
- Qian, X.S.; Qin, H.M.; Meng, T.; Lin, Y.; Ma, Z. Metal phosphate-supported Pt catalysts for CO oxidation. Materials 2014, 7, 8105–8130. [Google Scholar] [CrossRef]
- Arteaga, G.J.; Anderson, J.A.; Rochester, C.H. Effects of oxidation-reduction and oxychlorination-reduction cycles on CO adsorption by Pt-Sn/Al2O3 catalysts. J. Catal. 2000, 184, 268–279. [Google Scholar] [CrossRef]
- Chong, F.K.; Anderson, J.A.; Rochester, C.H. Effects of oxidation/reduction and oxychlorination/reduction cycles on CO adsorption by Pt-Re/Al2O3 catalysts. J. Catal. 2000, 190, 327–337. [Google Scholar] [CrossRef]
- Shen, S.A.; Wang, X.L.; Ding, Q.; Jin, S.Q.; Feng, Z.C.; Li, C. Effect of Pt cocatalyst in Pt/TiO2 studied by in situ FTIR of CO adsorption. Chin. J. Catal. 2014, 35, 1900–1906. [Google Scholar] [CrossRef]
- Vicerich, M.A.; Oportus, M.; Benitez, V.M.; Reyes, P.; Pieck, C.L. Influence of Na content on the catalytic properties of Pt-Ir/Al2O3 catalysts for selective ring opening of decalin. Appl. Catal. A 2014, 480, 42–49. [Google Scholar] [CrossRef]
- Meunier, G.; Garin, F.; Schmitt, J.; Maire, G.; Roche, R. Reactivity studies of automobile exhaust catalysts in presence of oxidizing or reducing conditions. Stud. Surf. Sci. Catal. 1987, 30, 243–255. [Google Scholar]
© 2015 by the authors; licensee MDPI, Basel, Switzerland. This article is an open access article distributed under the terms and conditions of the Creative Commons Attribution license (http://creativecommons.org/licenses/by/4.0/).
Share and Cite
Qin, H.; Qian, X.; Meng, T.; Lin, Y.; Ma, Z. Pt/MOx/SiO2, Pt/MOx/TiO2, and Pt/MOx/Al2O3 Catalysts for CO Oxidation. Catalysts 2015, 5, 606-633. https://doi.org/10.3390/catal5020606
Qin H, Qian X, Meng T, Lin Y, Ma Z. Pt/MOx/SiO2, Pt/MOx/TiO2, and Pt/MOx/Al2O3 Catalysts for CO Oxidation. Catalysts. 2015; 5(2):606-633. https://doi.org/10.3390/catal5020606
Chicago/Turabian StyleQin, Hongmei, Xiaoshuang Qian, Tao Meng, Yi Lin, and Zhen Ma. 2015. "Pt/MOx/SiO2, Pt/MOx/TiO2, and Pt/MOx/Al2O3 Catalysts for CO Oxidation" Catalysts 5, no. 2: 606-633. https://doi.org/10.3390/catal5020606
APA StyleQin, H., Qian, X., Meng, T., Lin, Y., & Ma, Z. (2015). Pt/MOx/SiO2, Pt/MOx/TiO2, and Pt/MOx/Al2O3 Catalysts for CO Oxidation. Catalysts, 5(2), 606-633. https://doi.org/10.3390/catal5020606