1. Introduction
The cost of eliminating organic waste contaminants, mainly dyes in water, has become a major challenge for many textile industries. This results in disposal of these compounds and contamination of a large quantity of water. Conventional methods for the renewal of contaminated water add considerable cost and delay to the production system. These processes include the use of filtration and activated carbon and the photo-fenton reaction.
The photocatalysis field has proven to be a very promising technology for the elimination of pollutants in wastewater [
1,
2]. UV light chemically activates photocatalytic materials, usually composed by wide band gap semiconductor, the mechanism seem to occur when those materials are exposed to UV light they go into an oxidant state and thus eliminate water borne contaminants. From the literature, it was found that most commonly employed photocatalyst in industrial processes is TiO
2 in mixed phase (70% anatase and 30% rutile) [
3,
4]. However, a fundamental problem when using this kind of material is that particle size seems to be relatively small provoking agglomeration and consequently damaging of filters easily by clogging [
5].
Consequently, cost-efficiency is compromised because of the inability to remove TiO2 from filters. Because of the mentioned reason, nowadays, a search for better structure/function materials that acts as photocatalyst has been an active field of study. An ideal photocatalytic material would be one that posses a high surface area and catalytic activity and strong morphological features (i.e., nanotubes, nanowires and laminar materials). Modern methods of synthesis are extremely important in order to achieve these properties with high precision.
Previous reports have shown that porous metal oxides made up of titanium and niobium metal oxide such as HTiNbO
5 with wide band gap (3.3 eV) can be separated easily from solution, and therefore prevent clogging problems as when using TiO
2 nanoparticles by itself [
6,
7]. The porous-like metal oxides made from Niobium such as H
4Nb
6O
17 can form a stacked nanosheet final structure, due to positive ions such as H
+ or K
+ which lay interstitially between each niobium oxide layer.
By adding a large molecule that possesses a high electron density, such as tetra (
n-butyl) ammonium hydroxide (TBA
+OH
−); the nanosheets can spread out and separate to form a colloidal solution [
5,
6]. Furthermore, such sheets can be converted into a nanotubular structure using exfoliation methods, in a process where TBA ions are removed, as described previously [
6]. It has been reported that monolayer (Nb
6O
17) in sheets are asymmetric [
7,
8] and causing tension to build up at the monolayer and eventually curving and rolling into a nanotube form, knowing that nano-scaled tubular structures possess a large surface in comparison with other bulk materials and might significantly improve the catalytic performance [
9].
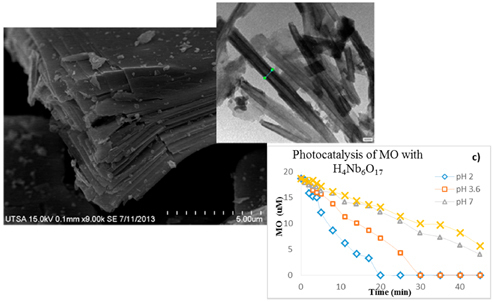
Consequently, a comprehensive evaluation of the photo-catalytic activity of H4Nb6O17 nanotubes seems to be of great interest. Here we present a room temperature synthesis of niobate nanosheets using TBA+OH− as an intercalating agent. The synthesized nanotube structures seem to form due to ion exchange with sulfuric acid at room temperature in atmospheric pressure. In our study, two model dyes Bromocresol Green (BG) and Methyl Orange (MO) were used as model contaminants, in order to test photocatalytic activity of synthesized nanotube catalyst, followed by an extensive morphological analysis using field emission gun STEM/SEM and powder X-ray diffraction (XRD).
2. Results and Discussion
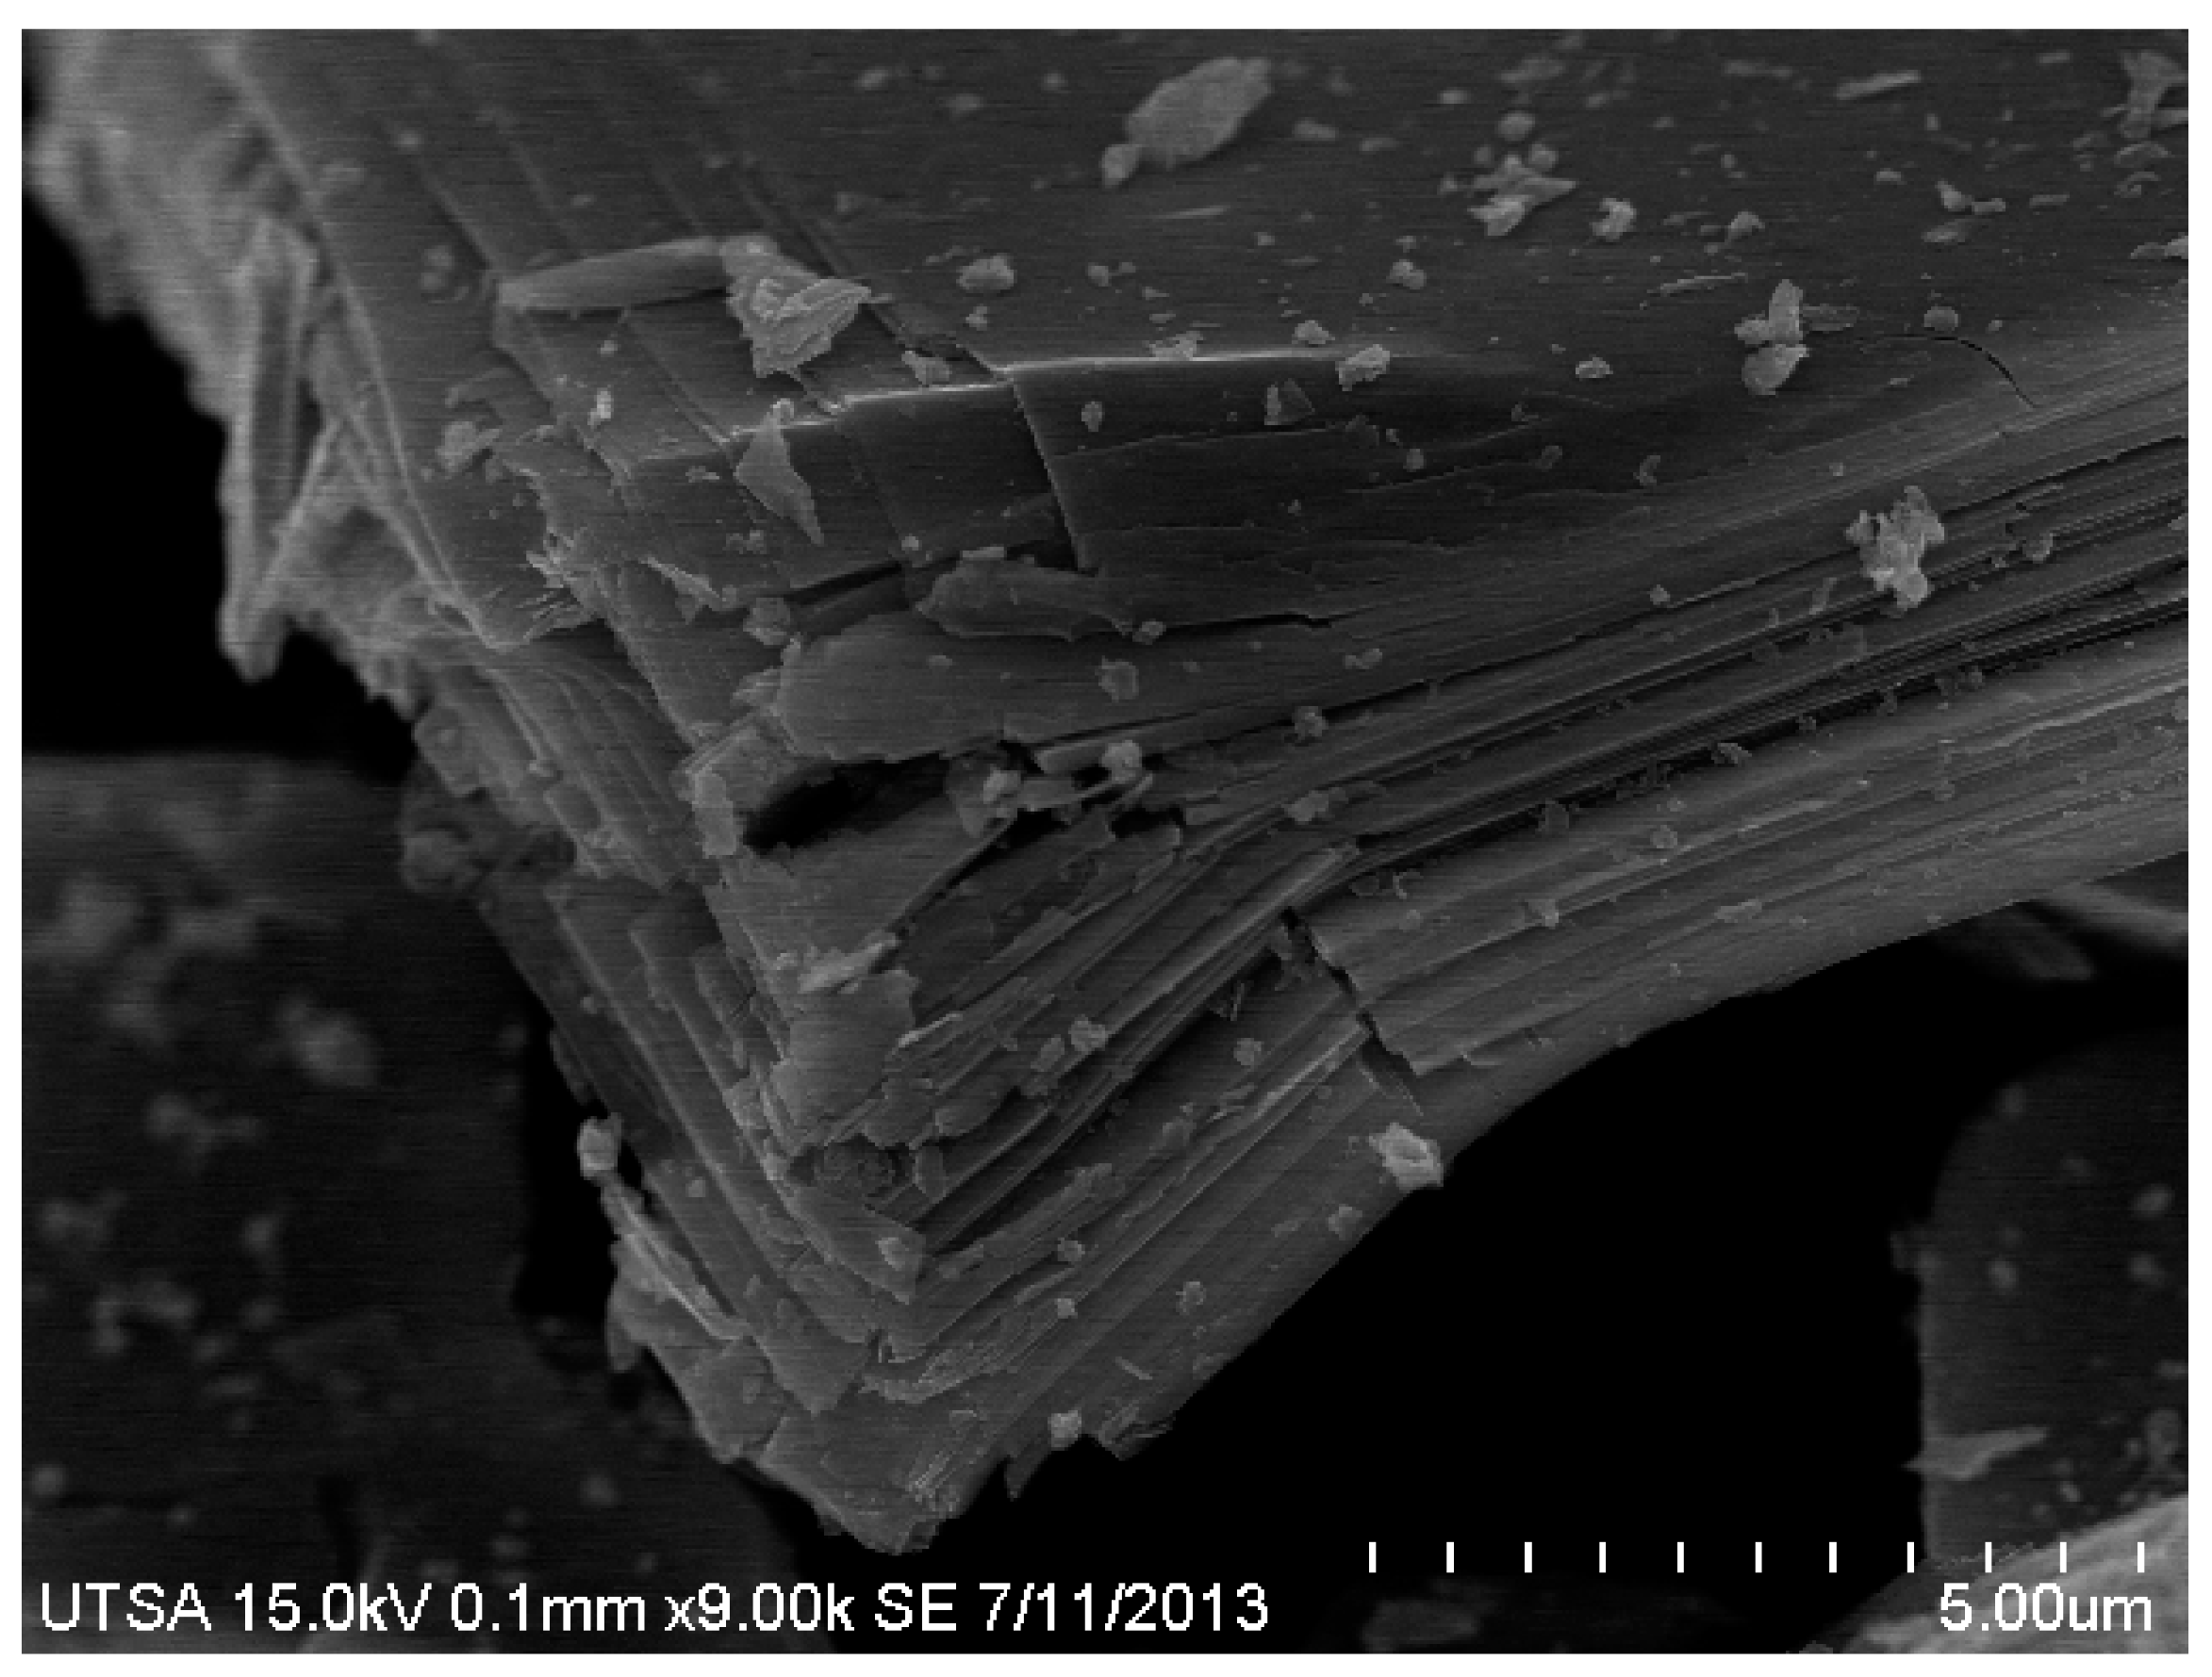
First, we present the morphological aspects using scanning electron microscope (SEM) and transmission electron microscope (TEM), which reveals stacking sheets of K
4Nb6O
17 as shown in
Figure 1. Measurements indicate a 1 to 2 nm thickness on each sheet, which is in agreement with other previous results by Gaohui
et al. [
8].
Figure 1.
SEM image of the starting material K4Nb6O17, one can observed the nanosheets stacking.
Figure 1.
SEM image of the starting material K4Nb6O17, one can observed the nanosheets stacking.
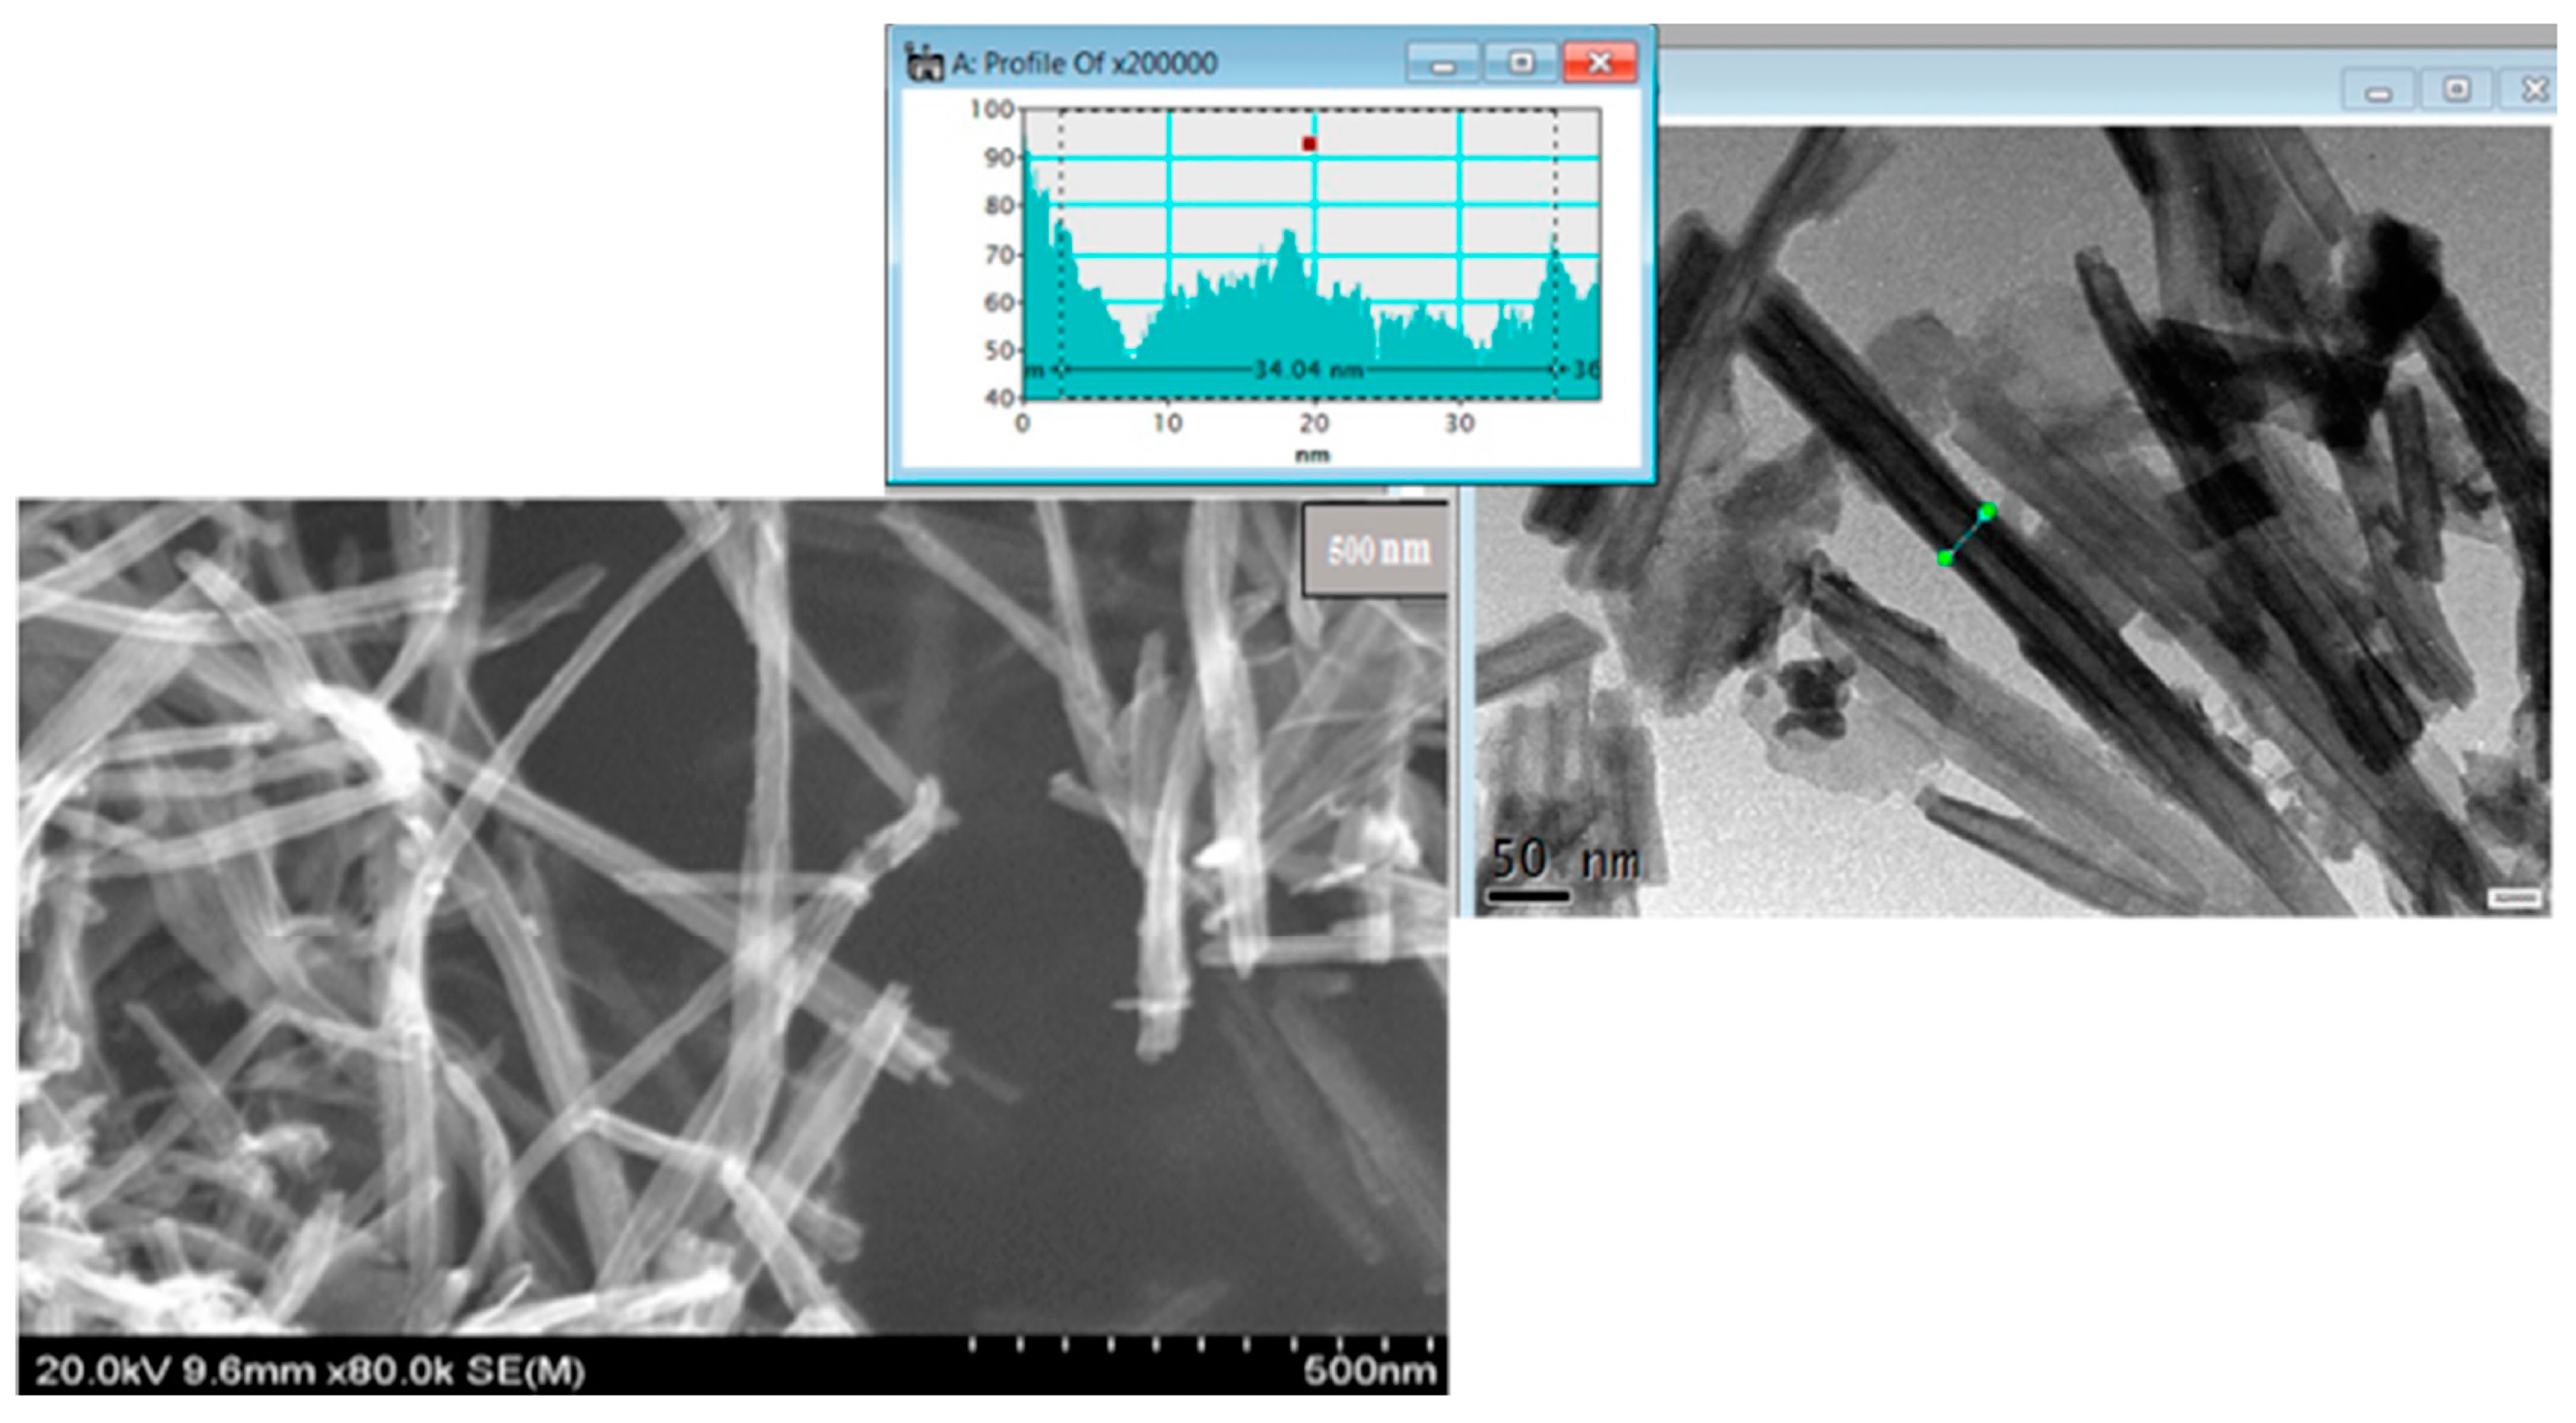
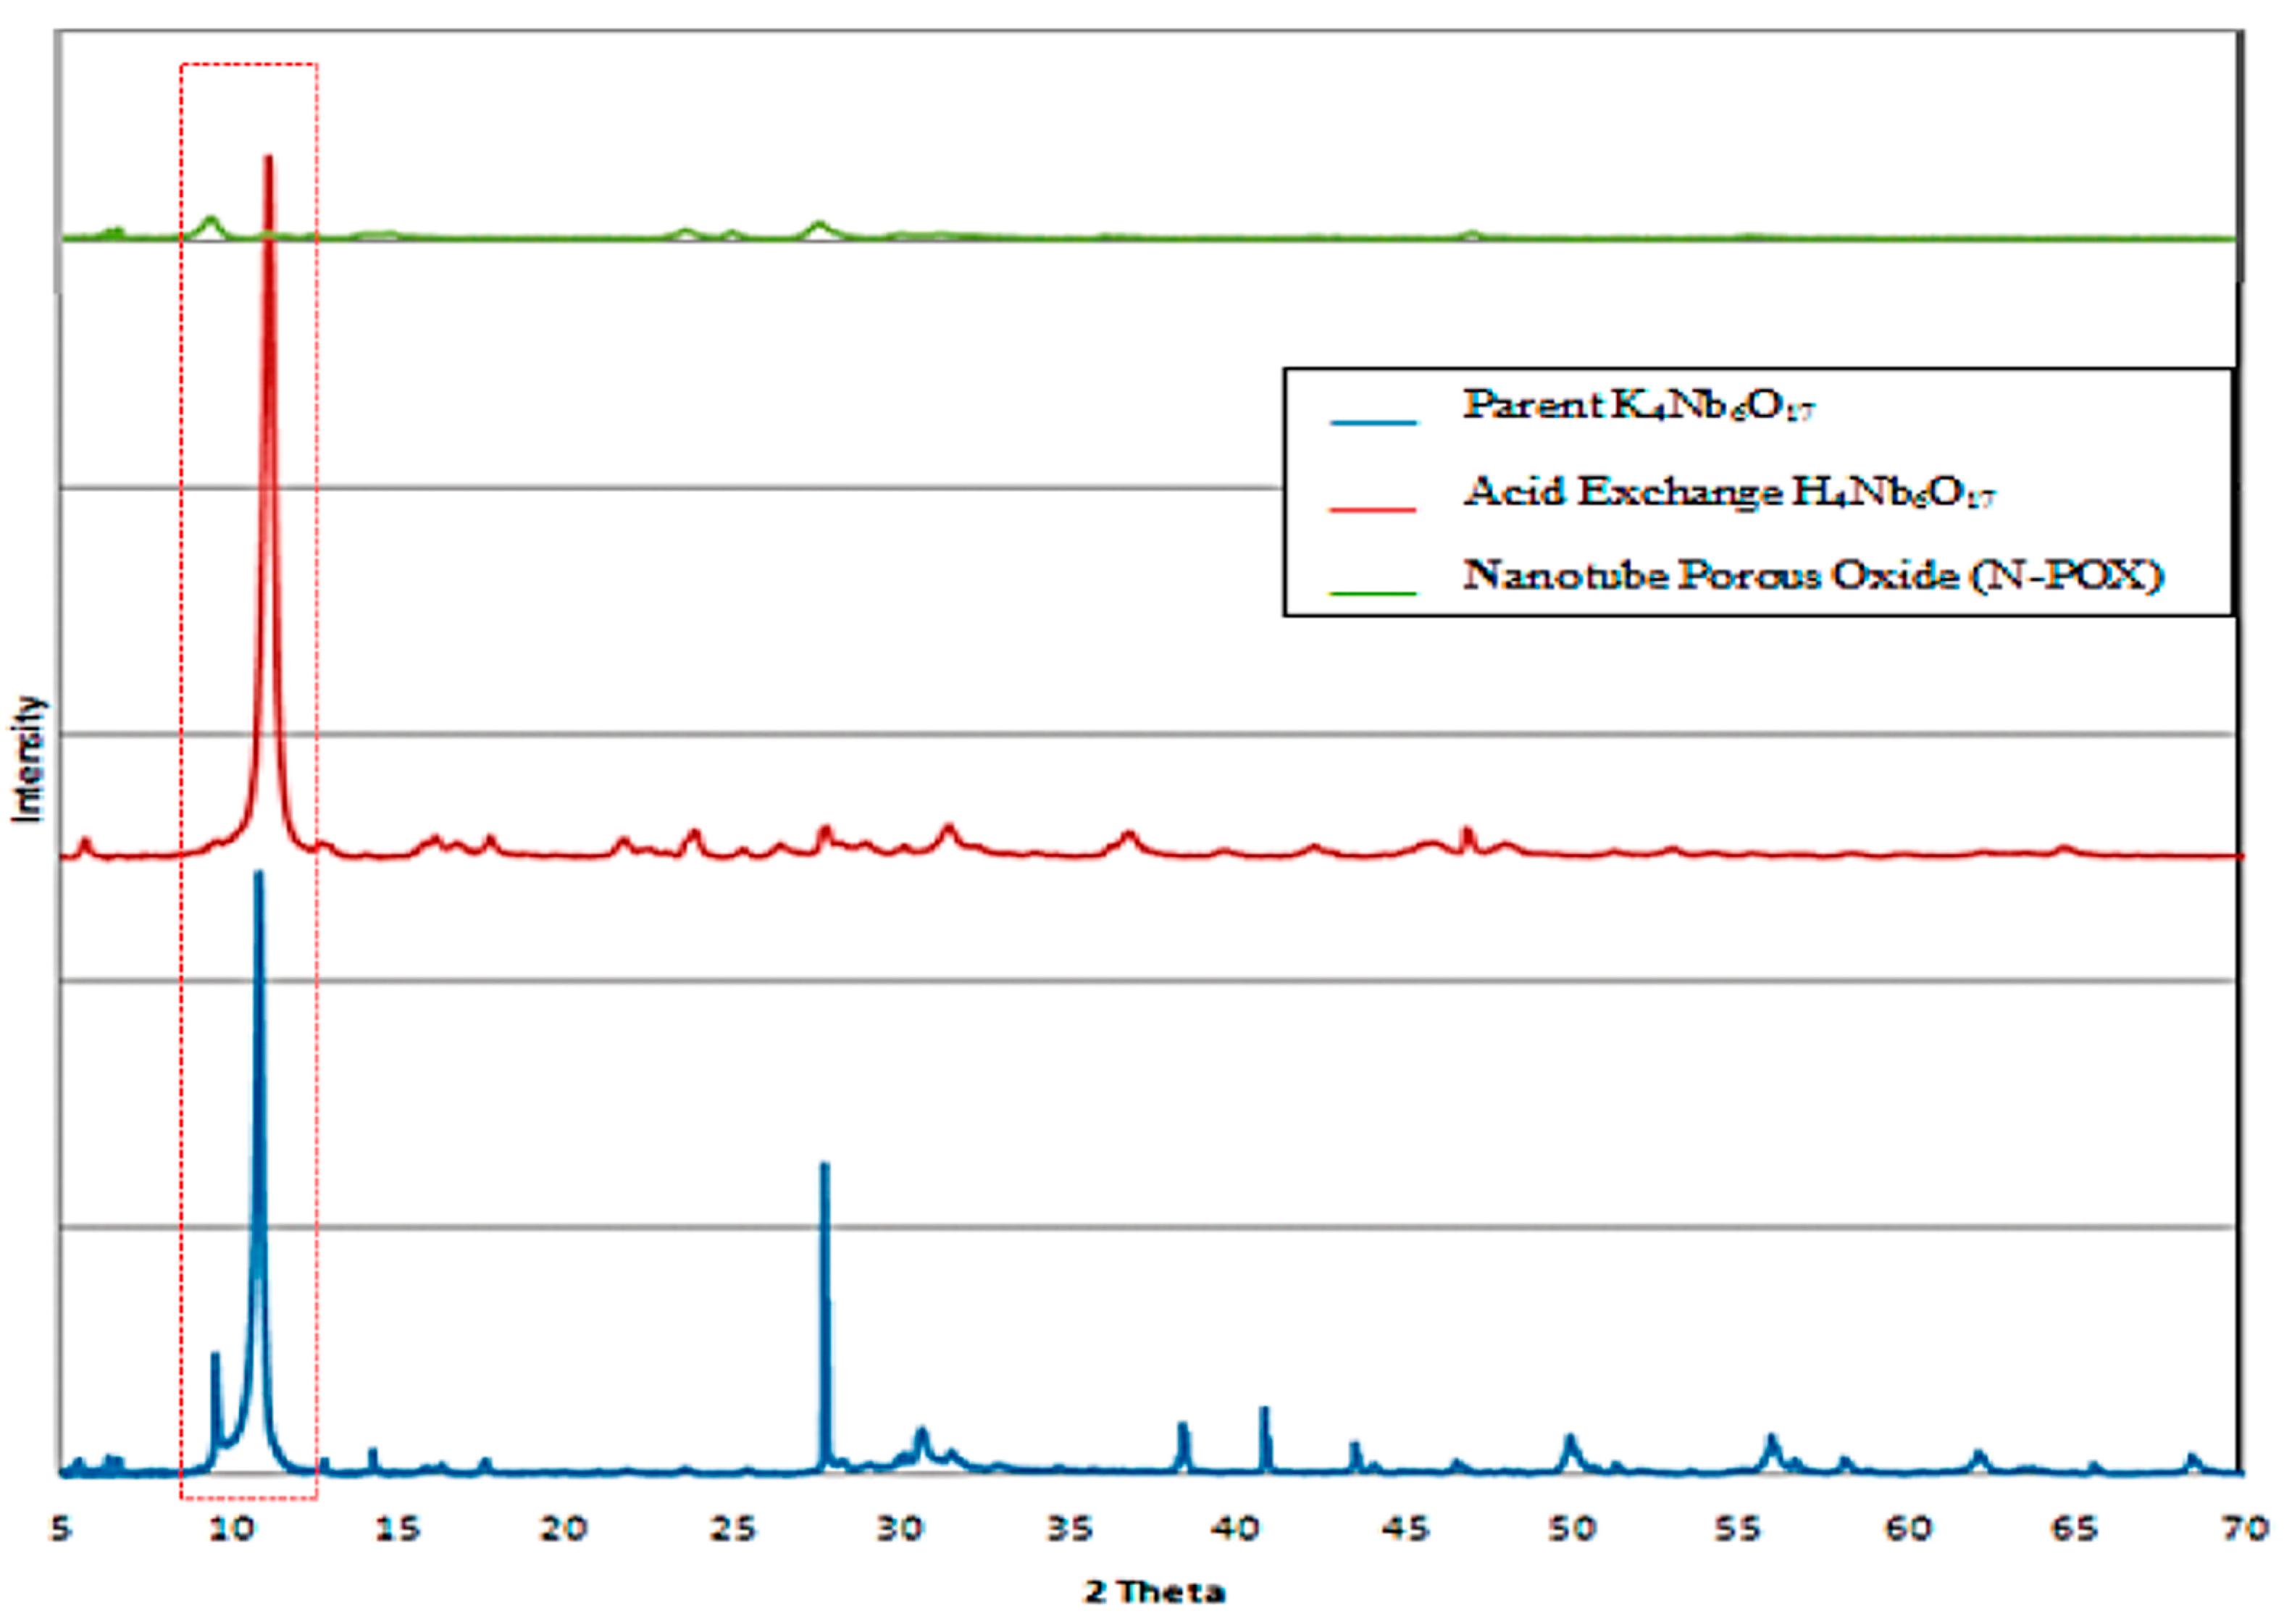
Aggregation of the sheets along with folding and rolling is observed which leads to a disordered porosity, with nanotubes average width at 30 to 35 nm, as presented in
Figure 2, in agreement with previous reports [
6]. From powder X-ray diffraction for parent material (K
4Nb
6O
17), acid exchanged material, and dried nanotube porous oxide (N-POX) hexaniobate, an intense peak was observed for the parent material and acid exchanged material at 2θ around 10° (
Figure 3) corresponding to the interlayer spacing of the sheets in agreement with Takahashi
et al. [
10], as presented in
Figure 3. Also nanotube porous oxide shows poor periodic layer structures when compared to acid exchanged materials, indicating a lower degree. This can be attributed to the random orientation of the restacked tubes and loss of periodicity as indicated by Houari
et al. [
11,
12,
13,
14] and Yang
et al. [
15].
Now, N-POX was found to have a BET surface area of about 172 m
2/g with an average pore diameter of 87 Å as presented in
Table 1. The band gap of hexaniobate materials was measured for acid exchanged and nanotube porous oxide (N-POX) using a UV-Vis Reflectance Spectrometry (UV-3101 PC). The onset of absorption was determined by extrapolating the steep part of the rising absorption curve and wavelength;
Figure 4 presents the data. The onset of absorbance is energy where electrons and holes separate from each other. At this point, the light starts to be absorb and band gap energy is calculated using the equation
E =
hc/λ, where
c is the speed of light (2.99 × 10
8 m/s),
h is Plank’s constant (6.626 × 10
−34 j/s) and λ is the wavelength. The onset of absorption of hexaniobate samples was extrapolated and the energy band gap for each one of them was calculated, as presented in
Table 2.
Figure 2.
STEM (Dark Field and Bright Field) images of nanotube structures of H4Nb6O17, one can observed a homogeneous dispersion of nanotubes, profile of nanotube width is presented also.
Figure 2.
STEM (Dark Field and Bright Field) images of nanotube structures of H4Nb6O17, one can observed a homogeneous dispersion of nanotubes, profile of nanotube width is presented also.
Figure 3.
XRD patterns of parent material K4Nb6O17, acid exchanged H4Nb6O17, and nanotube porous oxide (N-POX), One can observed the disappearance of crystallinity particularly at 2θ = 10° (red dashed box).
Figure 3.
XRD patterns of parent material K4Nb6O17, acid exchanged H4Nb6O17, and nanotube porous oxide (N-POX), One can observed the disappearance of crystallinity particularly at 2θ = 10° (red dashed box).
Table 1.
BET surface area measurement for nanotube porous oxide (N-POX).
Table 1.
BET surface area measurement for nanotube porous oxide (N-POX).
| Sample | Single Point Surface Area, (m2/g) | BET Surface Area, (m2/g) | Langmuir Surface Area, (m2/g) | BJH Desorption Pore Volume, (cm3/g) | BJH Desorption Average Pore Diameter, (Å) |
|---|
| H4Nb6O17 | 166.18 | 171.99 | 272.99 | 0.40 | 87.00 |
The energy band gap for the nanotube porous metal oxides (N-POX) was found to be the largest as compared to the acid exchanged material. There was a blue shift in the spectra of the N-POX material as compared to the acid exchanged compound. This blue shift may be due to the new morphology and structure of the materials.
Table 2.
Onset of absorbance and energy band gap for hexaniobate metal oxide.
Table 2.
Onset of absorbance and energy band gap for hexaniobate metal oxide.
| Sample | Absorbance Onset for Hexaniobate (nm) | Energy Bandgap (eV) E = hc/λ |
|---|
| Acid Exchanged | 360 | 3.447 |
| Nanotube POX | 355 | 3.495 |
In the acid exchanged materials, the sheets are stacked tightly together, making up a layered material. This causes absorption of lower energy and making a red shift. In comparison N-POX porous metal oxide tubules with acid exchanged materials, the N-POX material behaved like a nano particle composite because of single sheets that rolling to make nanotubes. Nanoparticles of sufficiently small dimensions are known to absorb higher energy and cause a blue shift in their spectra compared to the bulk samples. The absorption edge at about 360 nm in the acid exchanged material turned to lower wavelength of 355 nm for N-POX materials. This could be because of a transformation in the effective size of particles [
11]. It is not clear how much of the changes in the photo physical properties are due to particle size change and how much is due to the chemical changes and crystal structure. The quantum confinement and onset absorption can be affected by the size and shape of the particles [
16,
17]. Because the sheet particles in N-POX turn from bulk to nano scale, this could easily lead to electronic quantum confinement and cause an increase in the band gap.
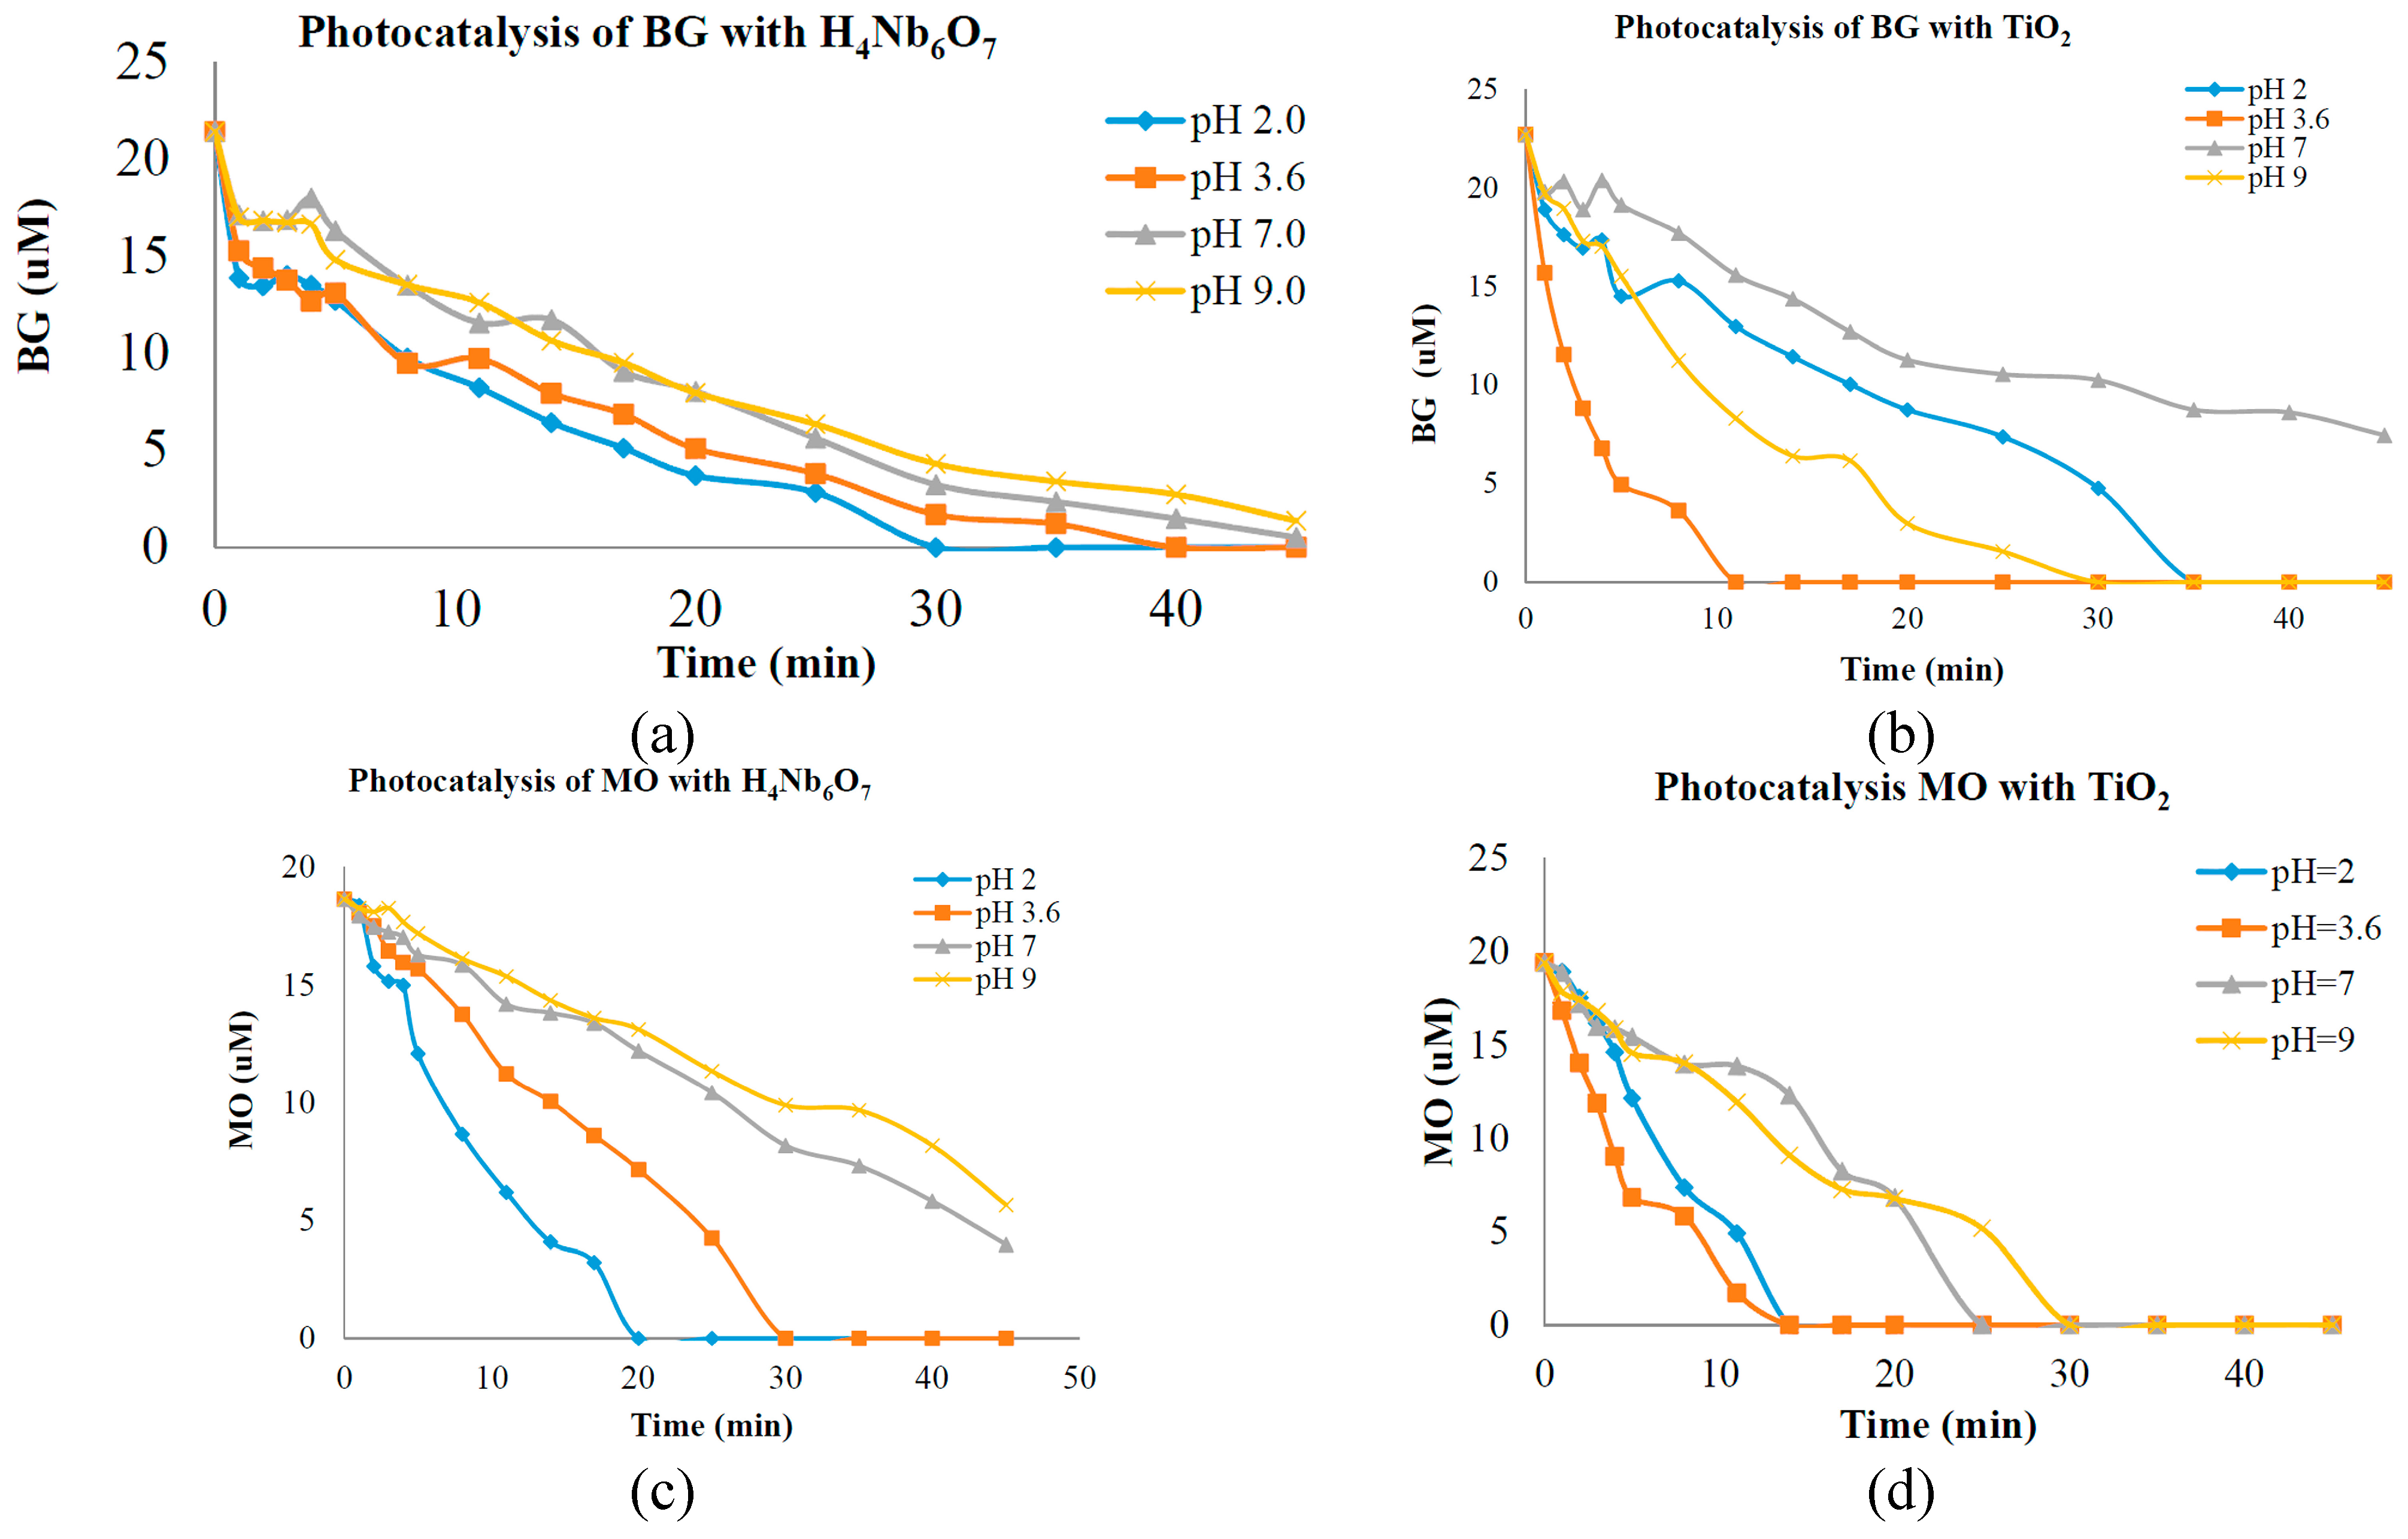
The tubular nanostructure H
4Nb
6O
17 prepared in this work is of highly photo-oxidative activity, stable phase at high temperatures, large surface area and highly photocatalytic activity, but has a slight pH dependence on the photo efficiency in contrast with other titanium and niobium metal oxide photocatalyst. In a previous study, preliminary photolysis tests were done to investigate the catalytic characteristics and suitability of a porous oxide semiconductor catalyst intended for the use in photolytic water decontamination systems [
5,
6]. Analysis of the optical absorbance at UV-Vis revealed that the hexaniobate nanotubes had high catalytic capacity at various pH concentrations. The nanotubes demonstrated good catalytic activity when compared to the commercial catalyst TiO
2 (70% anatase and 30% rutile) with BG and MO dyes. A good performance of photo-catalytic activity was observed at pH = 9 for BG and MO with TiO
2 and H
4Nb
6O
17 (hexaniobate nanotubes or N-POX). Photocatalysis of 20 µM aqueous solutions of the dyes BG and MO was separately carried out in the presence of the new nanotube porous semiconductor catalyst at pH 2.0, 3.6, 7.0 and 9.0 under ultraviolet light illumination. BG and MO have been chosen as model substances for organic pollutants because the majority of the dyes found in the wastewater under study have sulfonic (-SO
3)
− and [2-(sulfoxy) ethyl] sulfonyl groups as water reactive groups [
18]. Data of photo-catalytic activity is presented in
Figure 4a,b, which indicates the degradation of BG over time during UV illumination at pH 2.0, 3.6, 7.0 and 9.0 with H
4Nb
6O
17 and TiO
2. In
Figure 4c,d the degradation of MO over time during UV illumination at pH 2.0, 3.6, 7.0 and 9.0 with H
4Nb
6O
17 and TiO
2 is presented. The rates of dye degradation are interpreted to indicate the reactivity or destructive power of the particular catalyst, at experimental pH concentration. It has been reported previously that photocatalytic degradation efficiency is affected by surface charge property of the catalyst (charge of dye molecule) [
19,
20] and adsorption of dye on the catalyst surface [
21]. Since these properties seem to be pH dependent, we consider that pH plays an important role in the degradation of dye. In the case of BG and MO, these dyes are negatively charged in aqueous solution. Therefore, acidic conditions would favor the electrostatic attraction between the positively charged catalyst surface and the active dyes, which would result in increased adsorption and consequently in increased degradation rates at lower pH concentration. The difference between the photo degradation activities measured at those experimental pH conditions could correspond to the morphology and structure. Because TiO
2 has smaller particle size they present higher photolytic activity. Larger particles tend to decrease catalytic activity because light cannot penetrate inside the material, an effect known commonly as “shadow effect”. This may explain why the commercial catalyst degraded the dye faster than the nanotube shape. Another possible explanation could be that, since nanosheets roll into nanotubes, inner parts of the nanotube are not in contact with surface molecules and UV light. Therefore, they cannot participate in the photocatalytic activity. It is known that electronic conduction in layered materials is preferential within a layer plane of the solid but is less preferential perpendicular to the plane [
22]. Therefore, electronic conduction perpendicular to the layer planes is extremely sensitive to distance of the interlayer gap. The H
+ between the layers in nanotube POX material causes an interlayer spacing that translates into less effective electronic conduction and limitation of catalytic activity.
Figure 4.
(a) Photocatalytic activity of Bromocresol Green (BG) with nanotubes; (b) Photocatalytic activity of Methyl Orange (MO) with nanotubes; (c) Photocatalytic activity of BG with TiO2; (d) Photocatalytic activity of MO with TiO2.
Figure 4.
(a) Photocatalytic activity of Bromocresol Green (BG) with nanotubes; (b) Photocatalytic activity of Methyl Orange (MO) with nanotubes; (c) Photocatalytic activity of BG with TiO2; (d) Photocatalytic activity of MO with TiO2.
3. Experimental Section
3.1. Synthesis and Preparation of Hexaniobate K4Nb6O17
A stoichiometric mixture of K2CO3 and Nb2O5 was finely ground in a mortar into a fine powder. The finely ground mixture was transferred to an alumina crucible and was heated to 1100 °C for 20 h in an alumina crucible with no other special environment settings.
3.2. Synthesis of H4Nb6O17 via Ion Exchanged of K4Nb6O17
Synthesis of the H4Nb6O17 precursor involved stirring 5.0 g of powdered K4Nb6O17 with 250 mL of DI water. Exactly 100 mL of concentrated hydrochloric acid (Fischer Scientific, Pittsburgh, PA, USA, 12 M) was then added to the flask which was stirred for one day using a teflon stirrer at 40 °C. The slurries were centrifuged at 3000 rpm for 15 min. The supernatant liquid was then decanted and the solid acid exchanged material in the bottom of the centrifuge tube was recovered using DI water. After recovering the solid sample with DI water, the suspension was placed back in the flask. These steps were repeated every 24 h for three days for a total of four acid exchanges to ensure a complete acid exchange. The suspensions were finally centrifuged and the H4Nb6O17 solid product were rinsed twice with DI water and centrifuged again one more time. For the final and complete removal of solids from the bottom of the centrifuge tubes, disposable pipet and a few milli-Liters of alcohol (ethanol or methanol) was used to transfer the suspension to a glass Petri dish.
3.3. Exfoliation of H4Nb6O17 Sheets
Chemical transformation of lamellar metal oxides into single sheet colloids or individual metal oxide sheets occurs when the suspension of H4Nb6O17 reacts with tetra-n-butylammonium hydroxide (TBA+OH−) by acid base neutralization since the exfoliated metal oxide sheets (Nb6O174−) are negatively charged, so they allow TBA+ counter cations on their surface, thereby increasing the distance between the sheets. Therefore, exfoliation of the acid exchanged form of these compounds into Nb6O174− lamellar colloid solution was obtained by adding a solution of 40% TBA+OH− drop wise to an aqueous suspension of a solid stirring about 2 g of acid exchanged powder H4Nb6O17 in 100 mL of water. To minimize the need for constant pH meter use, phenolphthalein pH indicator dye was used (added in minimal amounts to create color). After one day, the pH was tested with a well rinsed special low-leakage pH meter designated for this job (Hanna instruments, 584 Park East Drive Woonsocket, RI, USA). If color was not pink anymore, drop of TBAOH was added at a time until the pH became above 9.0 again and color stayed pink.
3.4. Synthesis of the Nanotube of H4Nb6O17
In order to make the porous catalytic materials, the colloidal solutions have to be precipitated, or flocculated, using solutions that contain cations such as H+, K+ and Na+. In this method, the precipitation involved the addition of 6 M HCl into a dilute colloidal solution. Colloids of the hexaniobate particle was precipitated into porous solid by mixing 8 mL of a stock colloid solution (pH 9–10) with 16 mL of water for hexaniobate. The mixture was thoroughly stirred and three drops of 3 M hydrochloric acid were added uniformly to this mixture down each side of the vial. The vial was then closed with a cap and the sample was allowed to sit undisturbed for two days. During this period, the nanosheets formed aggregates, resulting in a nanotube porous solid. In this way nanosheet colloids were precipitated with concentrated hydrochloric acid to form agglomerates stable, ultra-porous, transition metal oxide tubules.
3.5. Solvent Replacement
After precipitating the colloidal nanosheets into porous aggregate, the water was replaced by dry acetone prior to the drying process, in a series of solvent exchange steps. Two vials of formed precipitate were placed in a 500 mL beaker filled with enough acetone to cover the vials. The acetone was stirred using a Teflon coated magnet bar (~500 rpm). The beaker was covered tightly with parafilm and rubber band to protect solution from absorbing moisture. Every two days acetone was replaced with a fresh solvent. This was repeated three times without heat. After that, the vials were placed in a warm beaker of acetone covered with aluminum foil (heated at 40 °C) containing dried molecular sieves or zeolite beads (dried at 280 °C) for two days, to remove the remaining water.
3.6. Photolysis Setup and Sampling Measurements
In each experimental measurement, 0.264 mL of nano porous oxide (d = 0.112 g/mL) was magnetically stirred in a total 25.00 mL of a 20 µM solution of Methyl Orange (MO) in water and a second solution of 25 µM Bromocresol Green, at the required pH and in the presence of ultraviolet light irradiation. All oxide particles were stirred in an upright 25 mm diameter customized quartz tube (16 cm long). The quartz tube (total volume was about 60 mL) was sealed at the bottom with a quartz plate was open at the top. A Penray (UVP LLC, 2066 W. 11th Street Upland, CA, USA) Hg light was used to irradiate the samples with UV light at a distance of 23 mm (face of bulb to face of quartz vessel). Air was not bubbled or mixed into the reaction solutions, but normal air (no vacuum, no gas added and at room tempertature) was present in the headspace of the reaction vessel. Each photolysis experiment for each pH was carried out three or more times. The pH of the solution was measured before irradiation. Samples from the photolyzed solution were taken at the indicated time intervals (for the first five samples, each sample was taken after 1 min, for the second five samples, each sample was taken after 3 min, and for the last five samples, each sample was taken after 5 min) using a glass syringe. The catalyst loading was kept constant for the entire time of photolysis. Samples were subsequently centrifuged in centrifuge tubes (rpm ≈ 3000–5000 depending on the nanoparticulate size), and the optical absorbance of the supernatant was analyzed with a Cary 300 spectrophotometer (200 nm–700 nm) in transmission mode (Varian Cary 300 Bio UV-Visible spectrophotometer (Santa Clara ,CA, USA) in a cuvette. Centrifugation is necessary to quickly remove particles that scatter the analyzing light and cause measurement errors.


 ,
, 
