Article

High-Performance Pd-Pt/α-MnO2 Catalysts for the Oxidation of Toluene

1
Beijing Huaneng Yangtze Environmental Technology Research Institute Co., Ltd., Beijing 102200, China
2
Key Laboratory of Beijing on Regional Air Pollution Control, Department of Environmental Science, College of Environmental Science and Engineering, Beijing University of Technology, Beijing 100124, China
3
Beijing Key Laboratory for Green Catalysis and Separation, State Key Laboratory of Materials Low-Carbon Recycling, Laboratory of Catalysis Chemistry and Nanoscience, Department of Chemical Engineering and Technology, College of Materials Science and Engineering, Beijing University of Technology, Beijing 100124, China
*
Authors to whom correspondence should be addressed.
Catalysts 2025, 15(8), 746; https://doi.org/10.3390/catal15080746
Submission received: 20 June 2025 / Revised: 24 July 2025 / Accepted: 31 July 2025 / Published: 5 August 2025
(This article belongs to the Section Environmental Catalysis)

Abstract

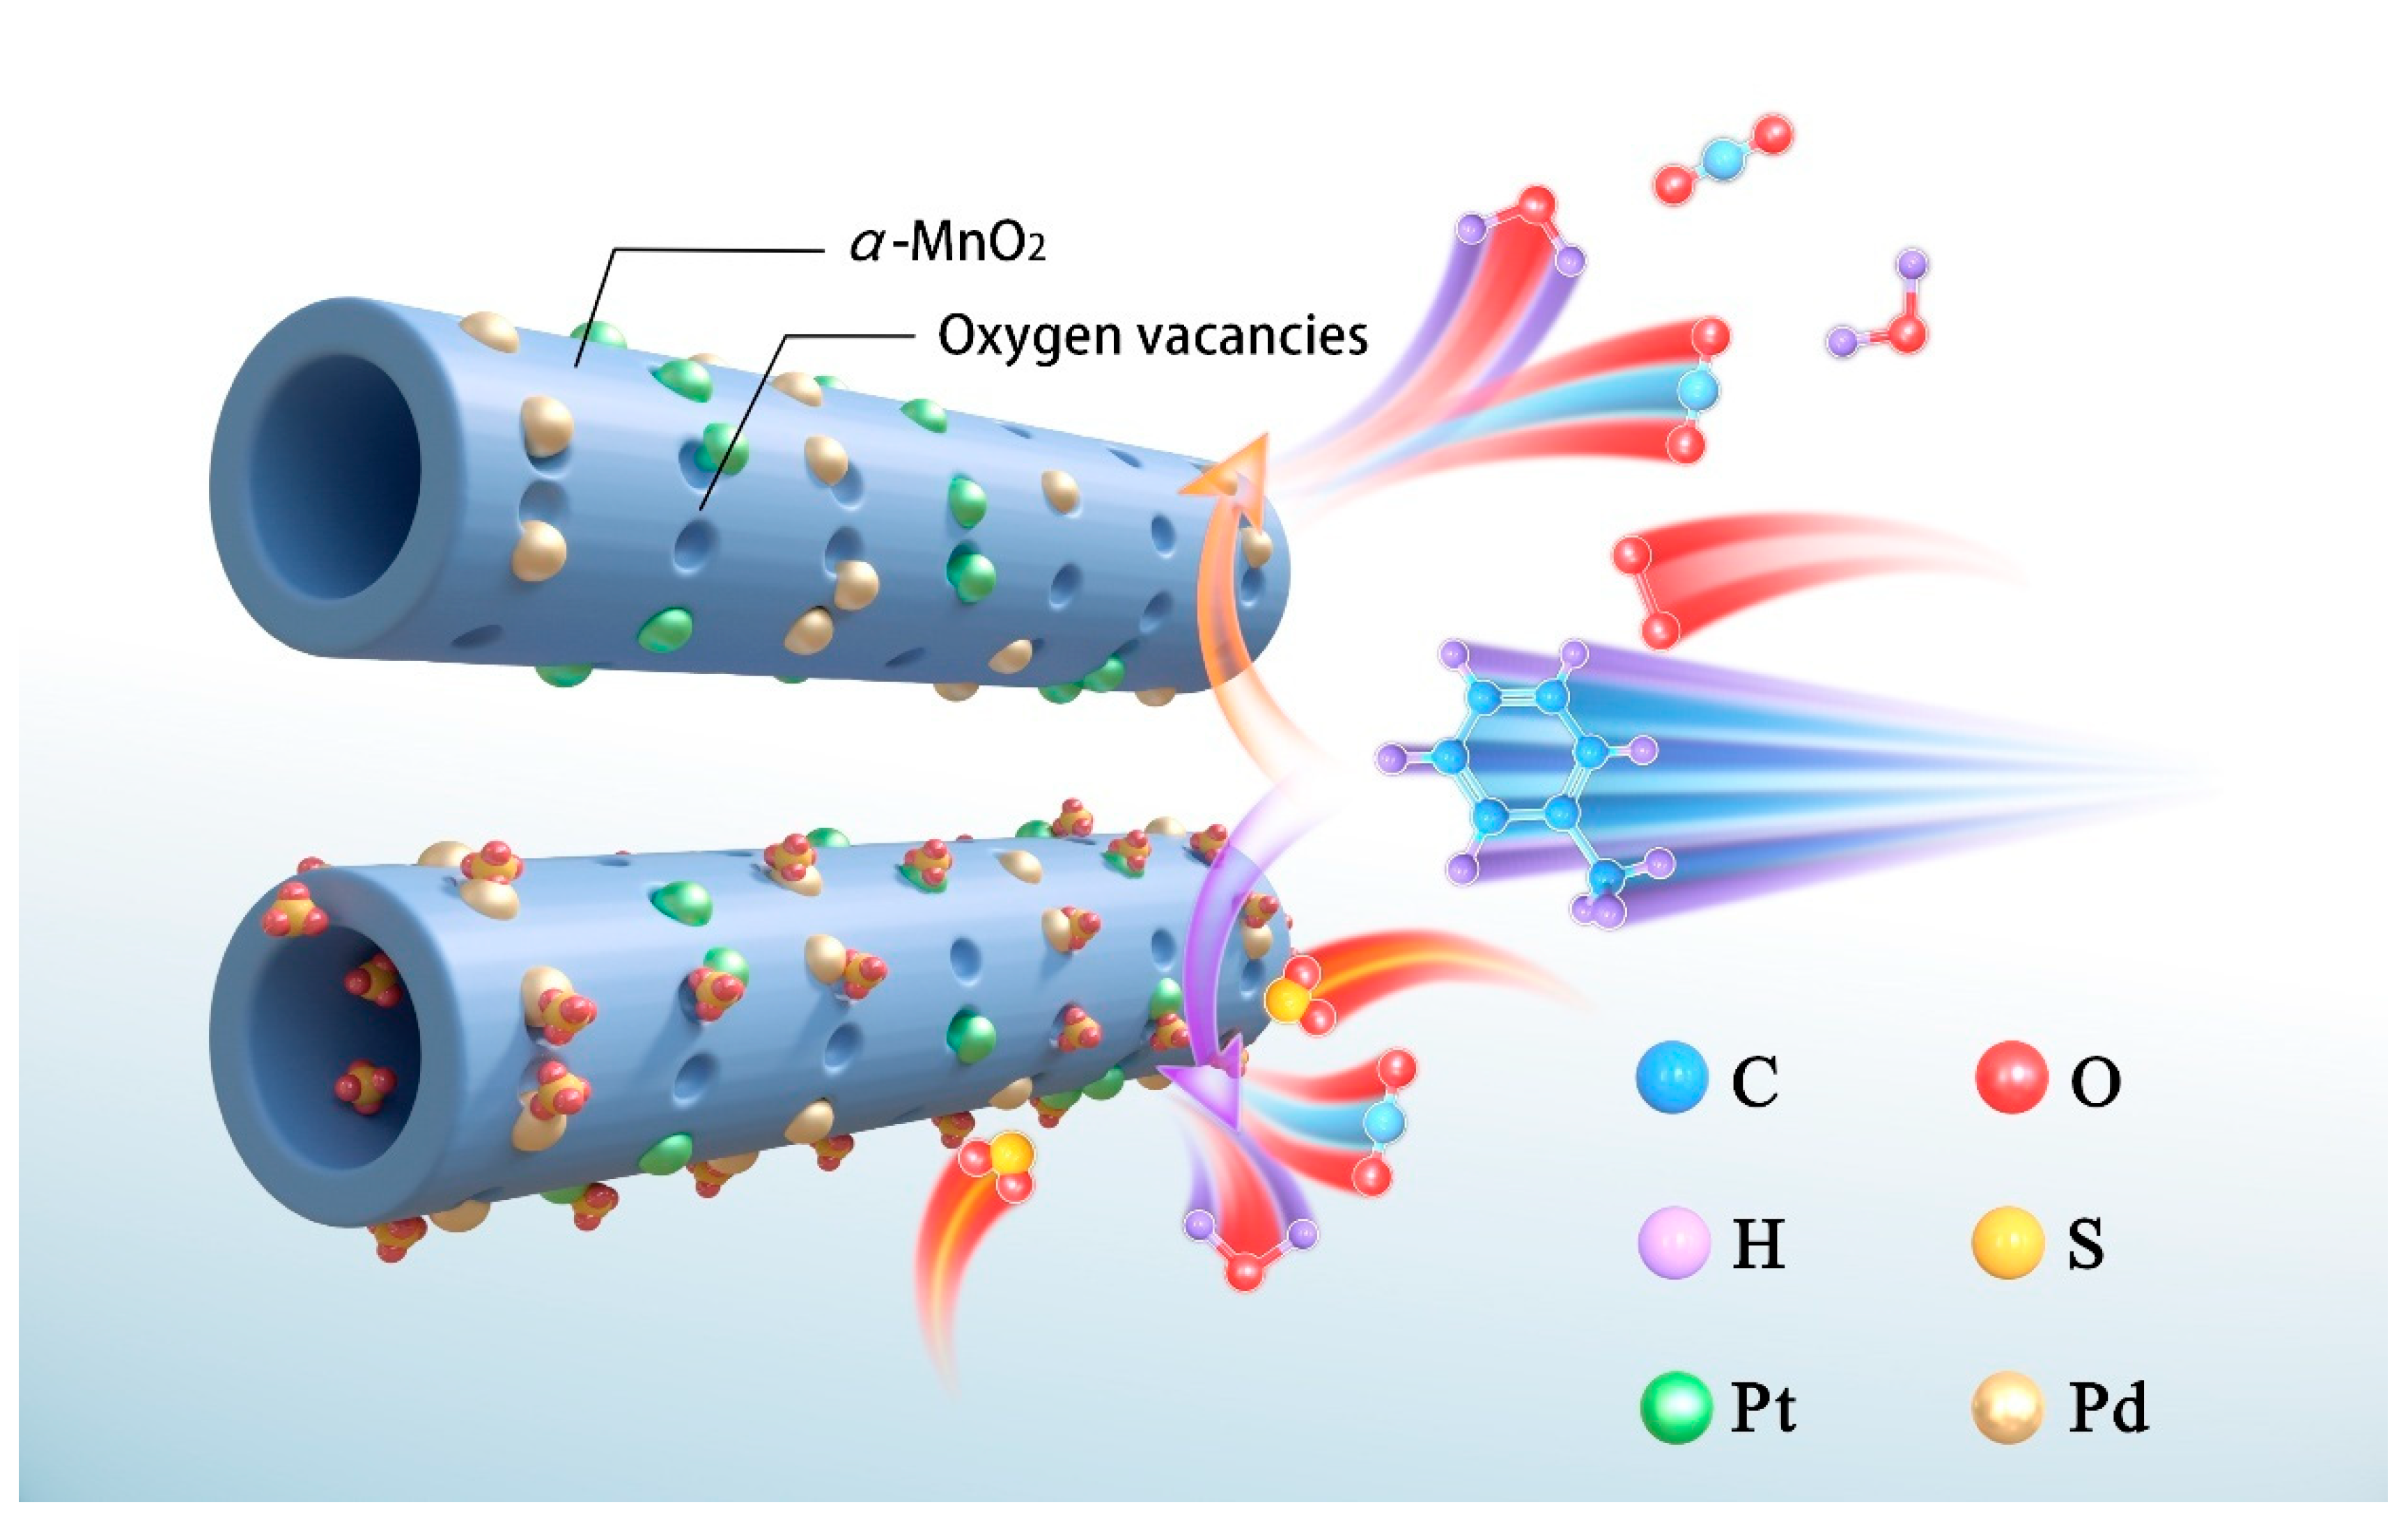
Herein, α-MnO2-supported Pt-Pd bimetal (xPd-yPt/α-MnO2; x and y are the weight loadings (wt%) of Pd and Pt, respectively; x = 0, 0.23, 0.47, 0.93, and 0.92 wt%; and y = 0.91, 0.21, 0.46, 0.89, and 0 wt%) catalysts were prepared using the polyvinyl alcohol-protected NaBH4 reduction method. The physicochemical properties of the catalysts were determined by means of various techniques and their catalytic activities for toluene oxidation were evaluated. It was found that among the xPd-yPt/α-MnO2 samples, 0.93Pd-0.89Pt/α-MnO2 showed the best catalytic performance, with the toluene oxidation rate at 156 °C (rcat) and space velocity = 60,000 mL/(g h) being 6.34 × 10⁻⁴ mol/(g s), much higher than that of 0.91Pt/α-MnO2 (1.31 × 10⁻⁴ mol/(g s)) and that of 0.92Pd/α-MnO2 (6.13 × 10⁻⁵ mol/(g s)) at the same temperature. The supported Pd-Pt bimetallic catalysts possessed higher Mn3+/Mn4+ and Oads/Olatt molar ratios, which favored the enhancement in catalytic activity of the supported Pd-Pt bimetallic catalysts. Furthermore, the 0.47Pd-0.46Pt/α-MnO2 sample showed better resistance to sulfur dioxide poisoning. The partial deactivation of 0.47Pd-0.46Pt/α-MnO2 was attributed to the formation of sulfate species on the sample surface, which covered the active site of the sample, thus decreasing its toluene oxidation activity. In addition, the in situ DRIFTS results demonstrated that benzaldehyde and benzoate were the intermediate products of toluene oxidation.

Graphical Abstract

1. Introduction

With the accelerating growth of the global economy, worldwide emissions of atmospheric pollutants have witnessed a concerning annual surge. Volatile organic compounds (VOCs), encompassing formaldehyde, benzene, toluene, and xylene derivatives, pose significant health risks through respiratory intake and dermal absorption, potentially triggering physiological distress and carcinogenic effects [1,2,3]. Furthermore, these compounds serve as key precursors in atmospheric photochemical reactions, substantially contributing to the formation of secondary pollutants (e.g., PM2.5 and O3) [4,5,6]. This dual environmental and public health impact underscores the critical need for advanced emission control technologies. Controlling VOCs emissions is thus imperative to mitigate both public health hazards and environmental problems.
Current VOC abatement technologies include physical adsorption, biodegradation, photocatalysis, and catalytic oxidation [7]. Among these methods, catalytic oxidation stands out due to its superior advantages, such as high degradation efficiency, operational feasibility at relatively low temperatures, and cost-effectiveness [8,9]. Unlike physical adsorption, which merely transfers pollutants to another medium, catalytic oxidation completely oxidizes VOCs into harmless CO2 and H2O [10]. However, the effectiveness of this VOC removal pathway depends upon the performance of the catalyst. Therefore, advancing the design of catalysts, especially optimizing their properties (e.g., low-temperature activity, thermal stability, and resistance to toxicity), has become a key research priority for sustainable air pollution control.
Precious metals (Au, Pt, Pd, and Rh) supported on metal oxides (CeO2, CexZr1−xO2, and Fe2O3) usually show good catalytic activities for VOC oxidation. However, precious metals are extremely limited in widespread and large-scale applications owing to their drawbacks of high price and scarcity. Therefore, it is important to design and explore low-cost catalysts with the same catalytic properties as those of noble metals. Various transition metal oxides (Co3O4, CuO, and MnO2) have been reported to exhibit good catalytic activities for the oxidation of VOCs in recent decades. Among them, MnO2 has been widely studied due to its advantages of low cost, environmental friendliness, and relatively high activity [11,12,13]. With the continuous research on MnO2 materials, it has been found that MnO2-based catalysts show good catalytic activities for the oxidation of VOCs, such as formaldehyde, toluene, acetone, and benzene ether [14,15]. For example, Cai et al. [16] prepared three different crystalline types of MnO2, and investigated their catalytic activities for acetone oxidation. The results showed that α-MnO2 possessed more acidic sites and reactive oxygen species, showing the best catalytic activity for acetone oxidation. After working on Pt/α-MnO2 catalysts derived from hydrothermal and impregnation routes, Li et al. [17] observed high o-xylene conversions and CO2 selectivity over Pt/α-MnO2 for o-xylene oxidation. Xuan et al. [18] investigated the effect of Au doping on the catalytic oxidation of methanol over Pt/MnO2 catalysts, and claimed that the interaction between Pt and MnO2 could increase the concentrations of Mn4+ species and surface reactive lattice oxygen on the catalyst surface, which were beneficial for the enhancement in methanol oxidation. Xia et al. [19] synthesized Au-Pd/α-MnO2 catalysts by loading Au-Pd nanoparticles on α-MnO2, evaluated their catalytic activities for the removal of typical VOCs (e.g., toluene, m-xylene, and ethyl pyruvate), and found that the strong interaction between Au-Pd alloy and α-MnO2 was favorable for the catalytic oxidation of VOCs. The supported bimetallic Pt-Pd catalysts showed enhanced catalytic activity compared to their supported monometallic Pt or Pd counterparts, since the interaction between Pt and Pd induced changes in electronic and geometrical properties [20,21,22]. Hence, it is necessary to investigate the interaction between Pt and Pd in supported dual-noble-metal catalysts for the low-temperature combustion of VOCs [23,24,25,26]. However, there are few studies on the effect of Pt-Pd bimetal content on the catalytic activity of α-MnO2-supported Pt-Pd catalysts for VOC oxidation.
For this purpose, we prepared xPd-yPt/α-MnO2 catalysts using the polyvinyl alcohol (PVA)-protected NaBH4 reduction method. The physicochemical properties of these materials were characterized, their catalytic activities were evaluated for the oxidation of toluene, and the involved reaction mechanism over the 0.47Pd-0.46Pt/α-MnO2 catalyst was probed. In addition, the effects of water vapor and sulfur dioxide on toluene oxidation over typical catalysts were also examined.

2. Results and Discussion

2.1. Catalytic Performance

Figure 1 shows the catalytic activities of the α-MnO2 and xPd-yPt/α-MnO2 samples for toluene oxidation. It is convenient to compare the catalytic activities of the samples by using reaction temperatures (T10%, T50%, and T90%) corresponding to 10, 50, and 90% toluene conversions, as summarized in Table 1. The catalytic activity at SV = 60,000 mL/(g h) decreased in the order of 0.93Pd-0.89Pt/α-MnO2 (T90% = 156 °C) > 0.47Pd-0.46Pt/α-MnO2 (T90% = 165 °C) > 0.91Pt/α-MnO2 (T90% = 178 °C) > 0.92Pd/α-MnO2 (T90% = 192 °C) > 0.23Pd-0.21Pt/α-MnO2 (T90% = 201 °C) > α-MnO2 (T90% = 252 °C). Obviously, the performance of the Pd-Pt bimetal samples with Pd and Pt loadings higher than 0.46 wt% was much better than that of the supported single-noble-metal Pd or Pt sample as well as that of the Pd-Pt bimetal samples with Pd and Pt loadings lower than 0.21 wt%. That is to say, a higher Pd-Pt loading resulted in better catalytic activity. Undoubtedly, the 0.93Pd-0.89Pt/α-MnO2 sample performed the best, and the T90% over 0.93Pd-0.89Pt/α-MnO2 was lower than those over 0.91Pt/α-MnO2, 0.92Pd/α-MnO2, and α-MnO2 by 22, 36, and 96 °C, respectively. From a practical application standpoint, an excessively high noble metal loading would limit the improvement in catalytic activity and increase the cost of the catalyst. Therefore, we used 0.47Pd-0.46Pt/α-MnO2 with a suitable Pd-Pt loading for the subsequent investigations.
The toluene oxidation rates or specific reaction rates at 156 °C (rcat) were also estimated based on the activity data and the amount of Pd and/or Pt in xPd-yPt/α-MnO2, as listed in Table 1. The rcat values at 156 °C (4.77 × 10⁻⁵–6.34 × 10⁻⁴ mol/(g s)) over xPd-yPt/α-MnO2 were much higher than that over the α-MnO2 sample (3.54 × 10⁻⁵ mol/(g s)). Clearly, the rcat (4.98 × 10⁻⁴ mol/(g s)) over 0.47Pd-0.46Pt/α-MnO2 was significantly higher than that over 0.37Pt-0.16MnOx/meso-CeO2 (4.05 × 10⁻⁴ mol/(g s)) [27], that over Pd-Pt/CeO2-10-γ-Al2O3 (2.95 × 10⁻⁶ mol/(g s)) [28], that over Ag@Pd/MnO2 (5.45 × 10⁻⁵ mol/(g s)) [29], and that over 2.3Pt/3DOM Mn2O3 (3.67 × 10⁻⁴ mol/(g s)) [30].
Shown in Figure S1 are the Arrhenius plots for toluene oxidation over the α-MnO2 and xPd-yPt/α-MnO2 samples, and their apparent activation energies (Ea) are listed in Table 1. The Ea decreased in the order of α-MnO2 (54.3 kJ/mol) > 0.23Pd-0.21Pt/α-MnO2 (46.9 kJ/mol) > 0.92Pd/α-MnO2 (41.5 kJ/mol) > 0.91Pt/α-MnO2 (37.3 kJ/mol) > 0.47Pd-0.46Pt/α-MnO2 (33.6 kJ/mol) > 0.93Pd-0.89Pt/α-MnO2 (31.9 kJ/mol), which was in good agreement with the sequence of catalytic activity. That is to say, toluene oxidation was more likely to occur over the xPd-yPt/α-MnO2 samples as compared with the α-MnO2 sample. Furthermore, the Ea value (33.6 kJ/mol) over 0.47Pd-0.46Pt/α-MnO2 was much lower than that over Pd-Pt-HMS (80.2 kJ/mol) [31], that over Pt/Al-NKM-5-5 (88.5 kJ/mol) [32], and that over Pd-Pt/CeO2-10-γ-Al2O3 (92.2 kJ/mol) [28]. These results fully explain why the 0.47Pd-0.46Pt/α-MnO2 sample showed the best catalytic performance for toluene oxidation.

2.2. Crystal Phase Composition, Textural Parameter, and Morphology

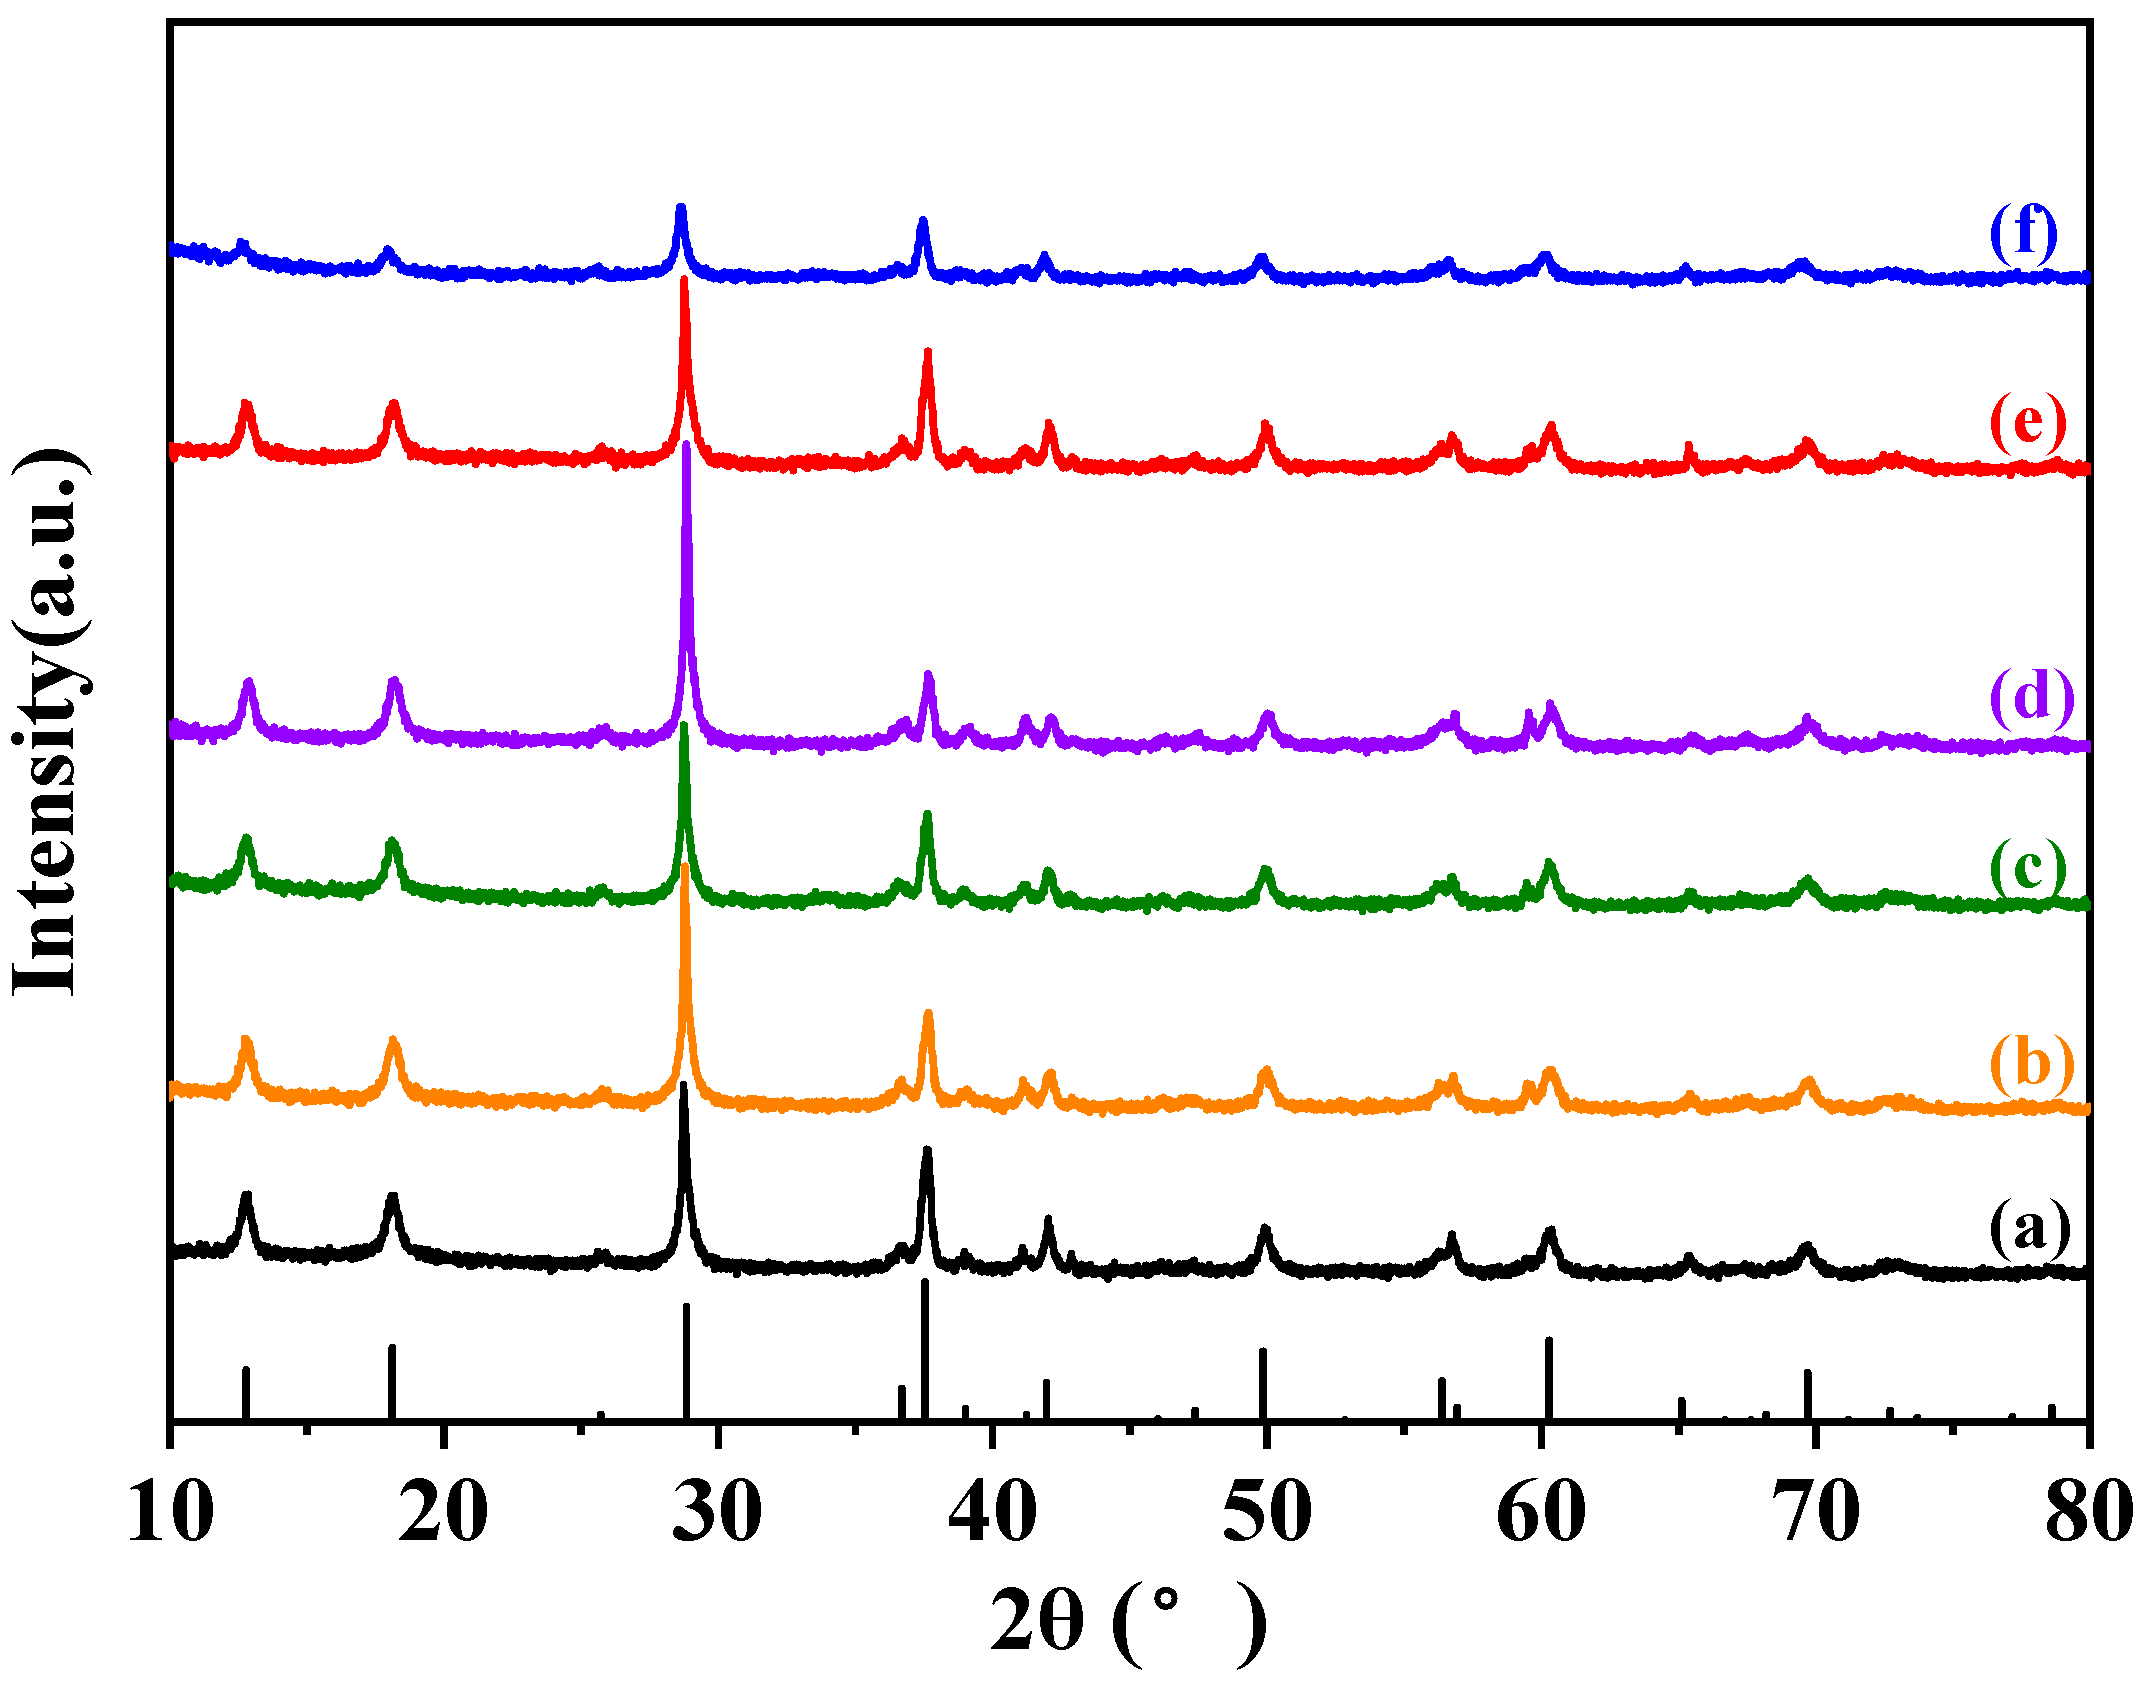
Figure 2 shows the XRD patterns of the samples. The diffraction peaks at 2θ = 12.5°, 18.3°, 28.6°, 37.2°, 49.8°, 60.7°, and 69.4° correspond to the (110), (200), (310), (211), (411), (521), and (541) crystal planes of the tetragonal-structured α-MnO2 crystal phase (JCPDS PDF# 44-0141). No other crystal phases (such as β-, γ-, and δ-MnO2) were detected, indicating that each of the samples prepared in this study was composed of high-purity α-MnO2 nanocrystals. It can be observed that all of the diffraction peaks of the xPd-yPt/α-MnO2 samples are consistent with the diffraction peaks of α-MnO2, indicating that the crystal structure of α-MnO2 did not change significantly after the loading of Pd and/or Pt. The average grain sizes of the catalysts calculated using the Scherrer formula and the full widths at half maximum (FWHM) of the (110) crystal planes are listed in Table 2. The average grain sizes of α-MnO2, 0.92Pd/α-MnO2, 0.91Pt/α-MnO2, 0.23Pd-0.21Pt/α-MnO2, 0.47Pd-0.46Pt/α-MnO2, and 0.93Pd-0.89Pt/α-MnO2 were 28 ± 1.8, 30 ± 1.7, 28 ± 1.2, 29 ± 1.6, 30 ± 1.3, and 32 ± 1.1 nm, respectively.
Figure S2 shows the N2 adsorption–desorption isotherms and pore size distributions of the α-MnO2 and xPd-yPt/α-MnO2 samples, and their pore parameters are summarized in Table 2. Each sample displayed a type IV adsorption–desorption isotherm with a type H3 hysteresis loop at the higher relative pressure (p/p0 = 0.6–1.0) (Figure S2A), which indicates the presence of a mesoporous structure in α-MnO2 or xPd-yPt/α-MnO2. Figure S2B exhibits the corresponding pore size distributions (6.8–9.0 nm) obtained using the BJH calculation of the adsorption data, which further confirms that the as-prepared samples are mesoporous. The average pore diameters of xPd-yPt/α-MnO2 were in the range of 6.8–7.3 nm, which are slightly smaller than that of α-MnO (9.0 nm)2. The surface areas of all of the samples are also listed in Table 2. It can be seen that the xPd-yPt/α-MnO2 samples display similar surface areas (41–43 m2/g), slightly higher than that of α-MnO2(39 m2/g). Specifically, the loading of noble metals did not significantly change the structure of the α-MnO2 sample. The increased surface area could provide more active sites for the adsorption and activation of reactant molecules in the oxidation of toluene.
The morphological changes before and after the loading of Pd and/or Pt were observed using the SEM technique, and their corresponding images are shown in Figure 3. As shown in Figure 3a, α-MnO2 possessed a uniform nanorod-like morphology. In general, a single nanorod was above 600 nm in length and 40–50 nm in width. When the noble metal was loaded, the morphology of the sample did not alter significantly, and the uniform nanorod-like structure was still maintained. This might be due to the high dispersion of Pd and/or Pt, which was consistent with the XRD characterization results (Figure 2).
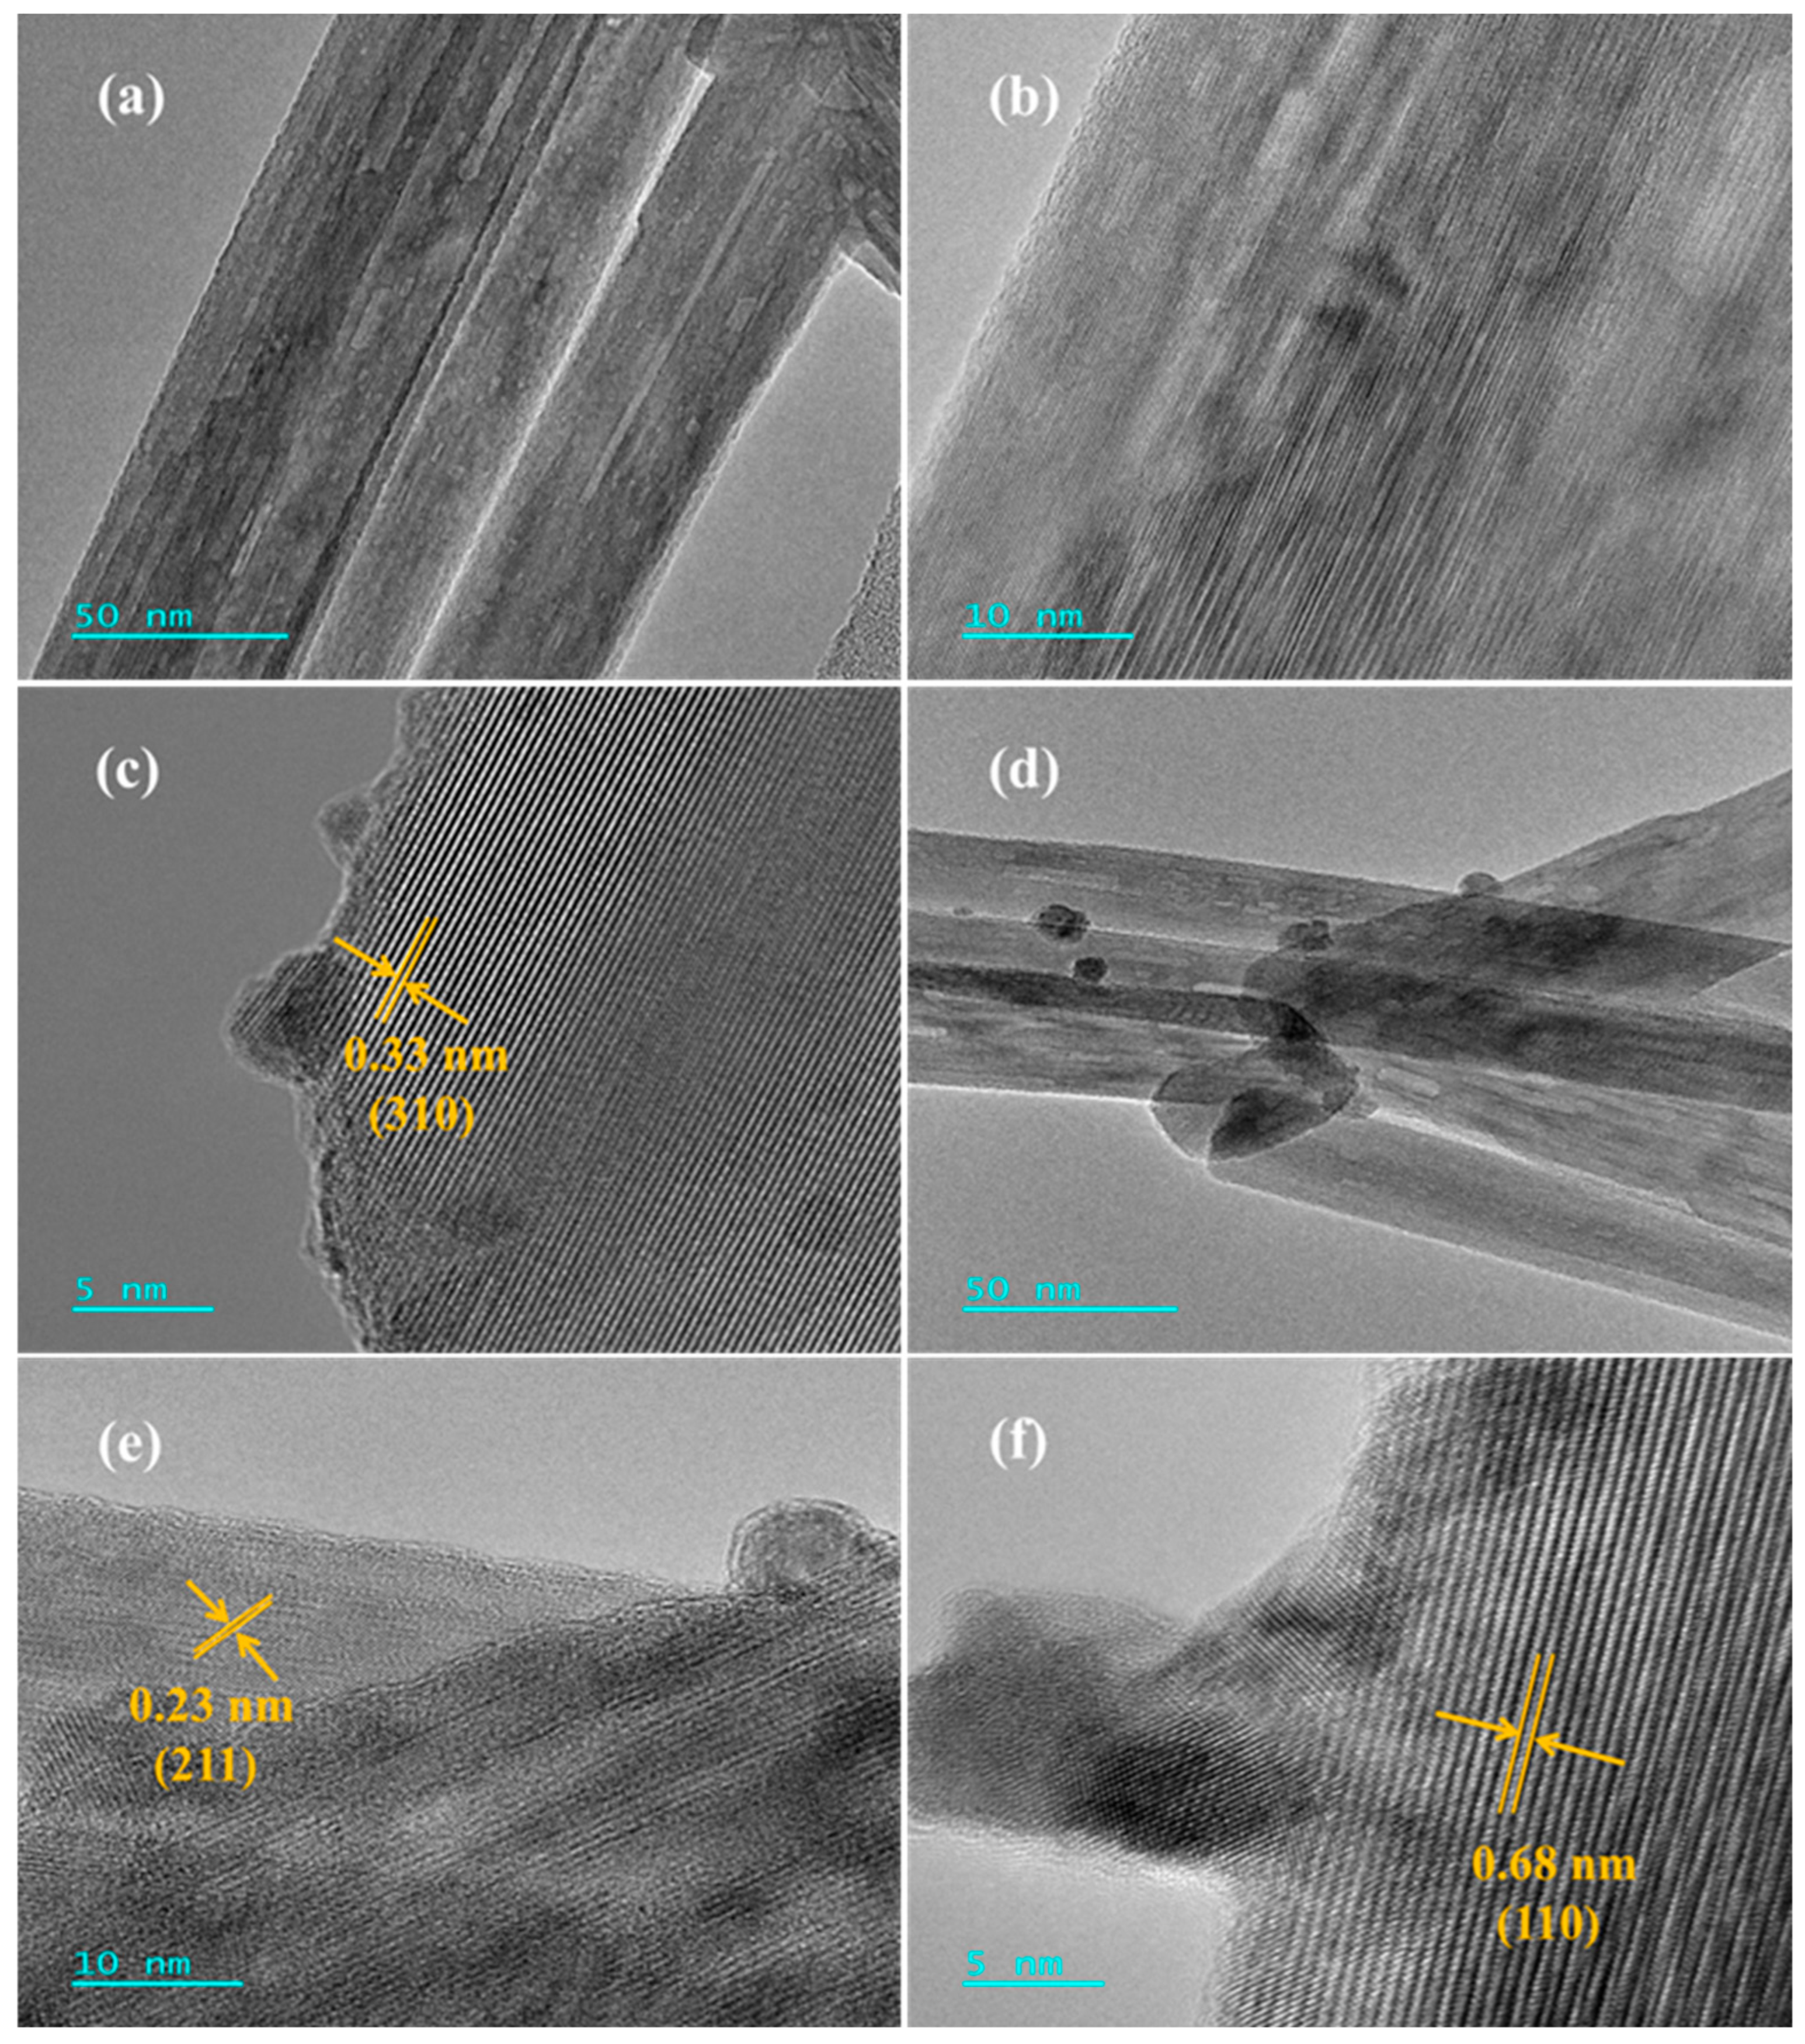
Figure 4 shows high-resolution TEM images of the 0.47Pd-0.46Pt/α-MnO2 sample. In Figure 4e, the lattice spacing is 0.23 nm, which is attributed to the (211) plane of α-MnO2. Similarly, the lattice spacing of the other samples in Figure 4c and f is 0.33 and 0.68 nm, respectively, corresponding to the (310) and (110) planes of α-MnO2. It can be seen that loading Pd-Pt nanoparticles (NPs) on the surface of α-MnO2 did not change the morphology of the sample. In addition, Pd-Pt NPs were highly dispersed on the surface of α-MnO2. The estimation of the Pd-Pt NP sizes from their TEM images reveals that the average noble metal particle sizes of 0.92Pd/α-MnO2, 0.91Pt/α-MnO2, 0.23Pd-0.21Pt/α-MnO2, 0.47Pd-0.46Pt/α-MnO2, and 0.93Pd-0.89Pt/α-MnO2 are 3.4 ± 1.0, 3.2 ± 1.0, 2.9 ± 0.9, 2.6 ± 1.1, and 2.5 ± 0.6 nm (Table 2 and Figure S9), respectively. The average precious metal particle sizes in xPd-yPt/α-MnO2 were slightly smaller than those in Pd/α-MnO2 and Pt/α-MnO2. As shown in Figure S3, in order to further study the detailed distributions of Pd and Pt, we recorded HAADF-STEM images and elemental mappings of the 0.47Pd-0.46Pt/α-MnO2 sample. It can be seen from Figure S3 that the Pd and Pt species are well dispersed on the surface of 0.47Pd-0.46Pt/α-MnO2, and the distribution of Pd and Pt elements is almost the same. This result indicates that the Pd and Pt species were uniformly mixed during the preparation process.

2.3. Surface Properties and Oxygen Desorption Behavior

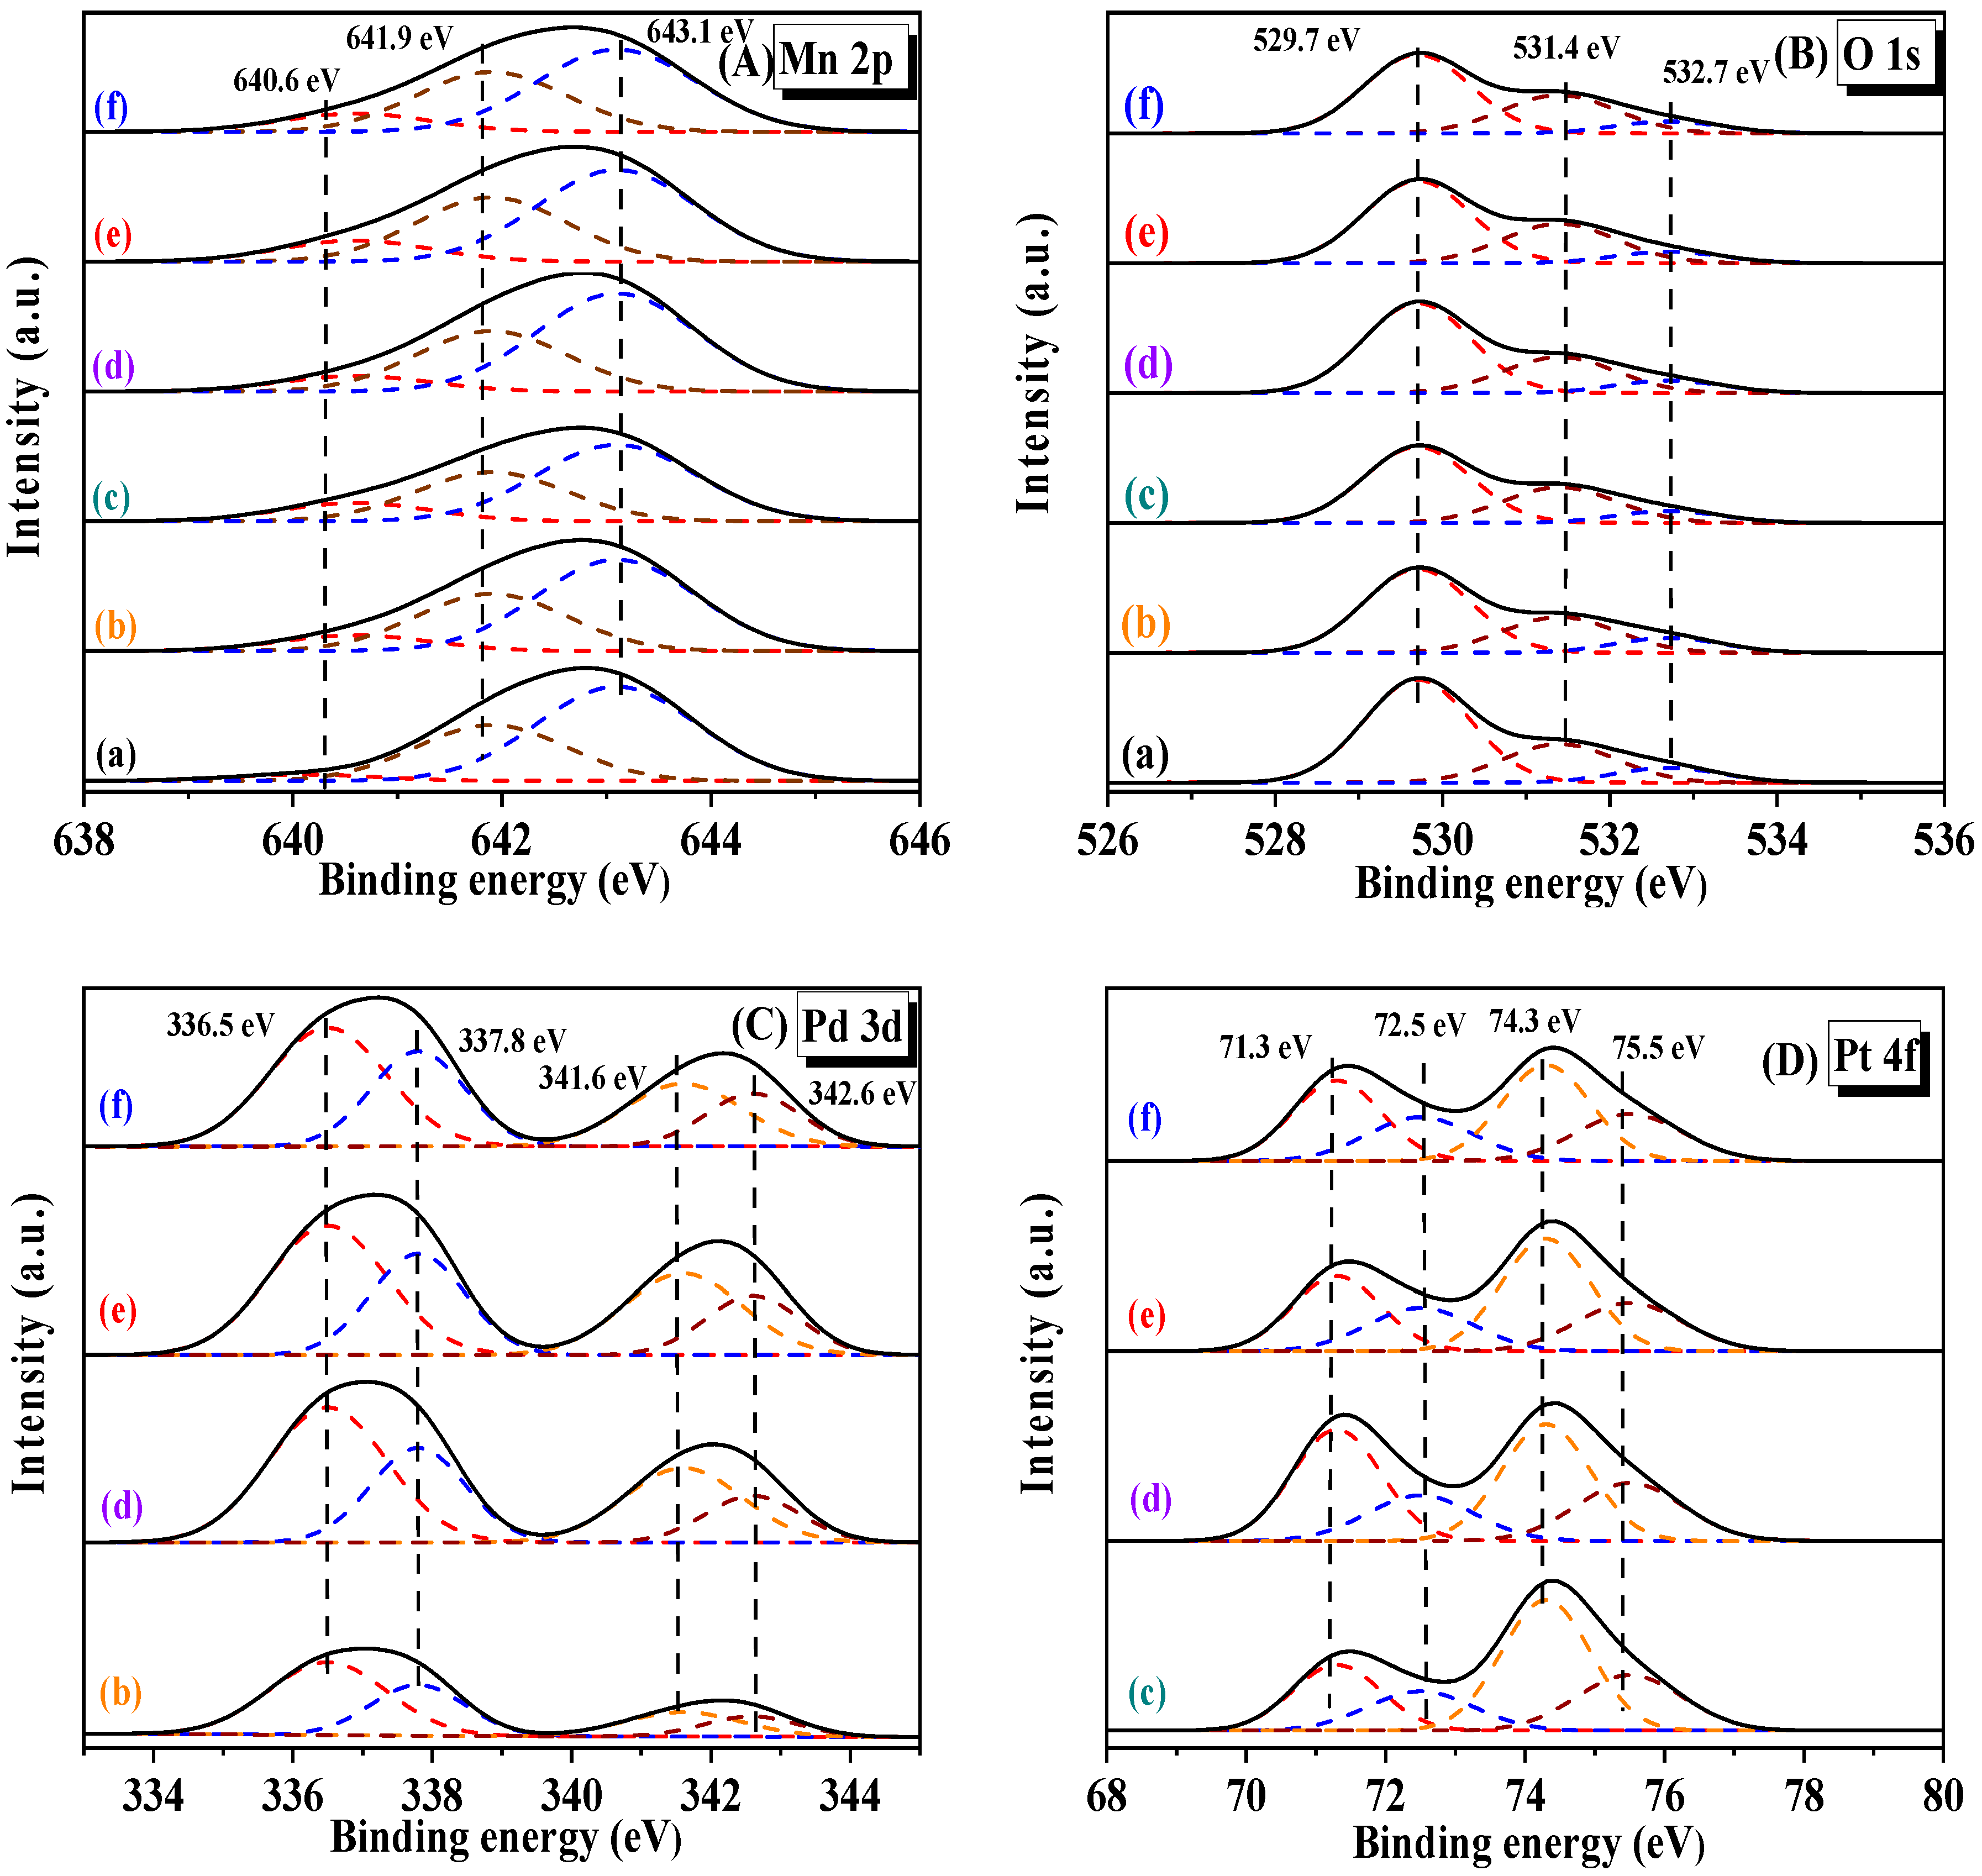
The surface properties of the samples were characterized using the XPS technique, and their XPS spectra and quantitative analysis results are shown in Figure 5 and Table 3, respectively. It can be seen from Figure 5A that the components at binding energies (BEs) of 643.1, 641.9, and 640.6 eV are attributed to the surface Mn4+, Mn3+, and Mn2+ species [33], respectively. The molar ratio of Mn3+/Mn4+ decreased in the order of 0.93Pd-0.89Pt/α-MnO2 (0.69) > 0.47Pd-0.46Pt/α-MnO2 (0.66) > 0.91Pt/α-MnO2 (0.61) > 0.92Pd/α-MnO2 (0.59) > 0.23Pd-0.21Pt/α-MnO2 (0.58) > α-MnO2 (0.56). Clearly, the Mn3+/Mn4+ molar ratios on the supported Pd-Pt bimetal samples with a Pd or Pt loading of above 0.46 wt% were higher than that on the supported Pd or Pt monometal sample or that on the supported Pd-Pt bimetal sample with a Pd or Pt loading below 0.21 wt%, and the Mn3+/Mn4+ molar ratios on the supported monometal samples were higher than that of the α-MnO2 sample. The loading of Pd and/or Pt could produce more surface Mn3+ species, which leads to an increase in the density of oxygen vacancies on the surface of α-MnO2. It has been reported that Mn3+ species could improve the catalytic performance of Mn-containing samples [34]. This is due to the fact that the rise in Mn3+ species concentration can increase the surface oxygen vacancy density. The enhanced oxygen vacancies are beneficial for the adsorption and activation of gas-phase oxygen to the active oxygen species, thus enhancing the catalytic activity of the samples.
As shown in Figure 5C, the Pd 3d XPS spectrum of each sample can be decomposed to four components using the curve-fitting method: the two components at BE = 336.5 and 341.6 eV are assigned to the surface Pd0 species, while the ones at BE = 337.8 and 342.6 eV are attributed to the surface Pd2+ species [35]. It can be seen from Figure 5D that the Pt 4f XPS spectrum of each sample can be deconvoluted into four components: the two components at BE = 71.3 and 74.3 eV and the ones at BE = 72.5 and 75.5 eV, which belong to the surface Pt0 and Pt2+ species [36], respectively. With the loading of Pd-Pt NPs, the molar ratio of Pd2+/Pd0 and Pt2+/Pt0 increased. The molar ratios of Pd2+/Pd0 (0.65) and Pt2+/Pt0 (0.62) of 0.93Pd-0.89Pt/α-MnO2 were higher than those of 0.92Pd/α-MnO2 (0.59) and 0.91Pt/α-MnO2 (0.58), respectively. Meanwhile, after loading Pd and Pt NPs, the concentration of the surface Mn3+ species on α-MnO2 increased. This result might be due to the presence of a strong metal–support interaction between Pd and Pt NPs and α-MnO2 through the electron transfer from Pd and Pt NPs to α-MnO2 (Pt0 + Mn4+ → Pt2+ + Mn3+ and Pd0 + Mn4+ → Pd2+ + Mn3+).
The O 1s XPS spectrum of each sample could be decomposed into three components at BE = 529.7, 531.4, and 532.7 eV (Figure 5B), which were assignable to the surface lattice oxygen (Olatt), adsorbed oxygen (Oads), and adsorbed water ((H2O)ads) [37], respectively. As shown in Table 3, after loading the Pd and Pt NPs, the Oads/Olatt molar ratio increased significantly, and the Oads/Olatt molar ratio decreased in the order of 0.93Pd-0.89Pt/α-MnO2 (0.57) > 0.47Pd-0.46Pt/α-MnO2 (0.51) > 0.91Pt/α-MnO2 (0.50) > 0.92Pd/α-MnO2 (0.46) > 0.23Pd-0.21Pt/α-MnO2 (0.43) > α-MnO2 (0.40). The changing trend in Oads/Olatt molar ratio coincided with that in the surface Mn3+/Mn4+ molar ratio that correlated with the changing trend in oxygen vacancy density. Among all of the samples, 0.93Pd-0.89Pt/α-MnO2 possessed the highest Oads/Olatt molar ratio, indicating that this sample showed the best catalytic activity for toluene oxidation.

2.4. Low-Temperature Reducibility

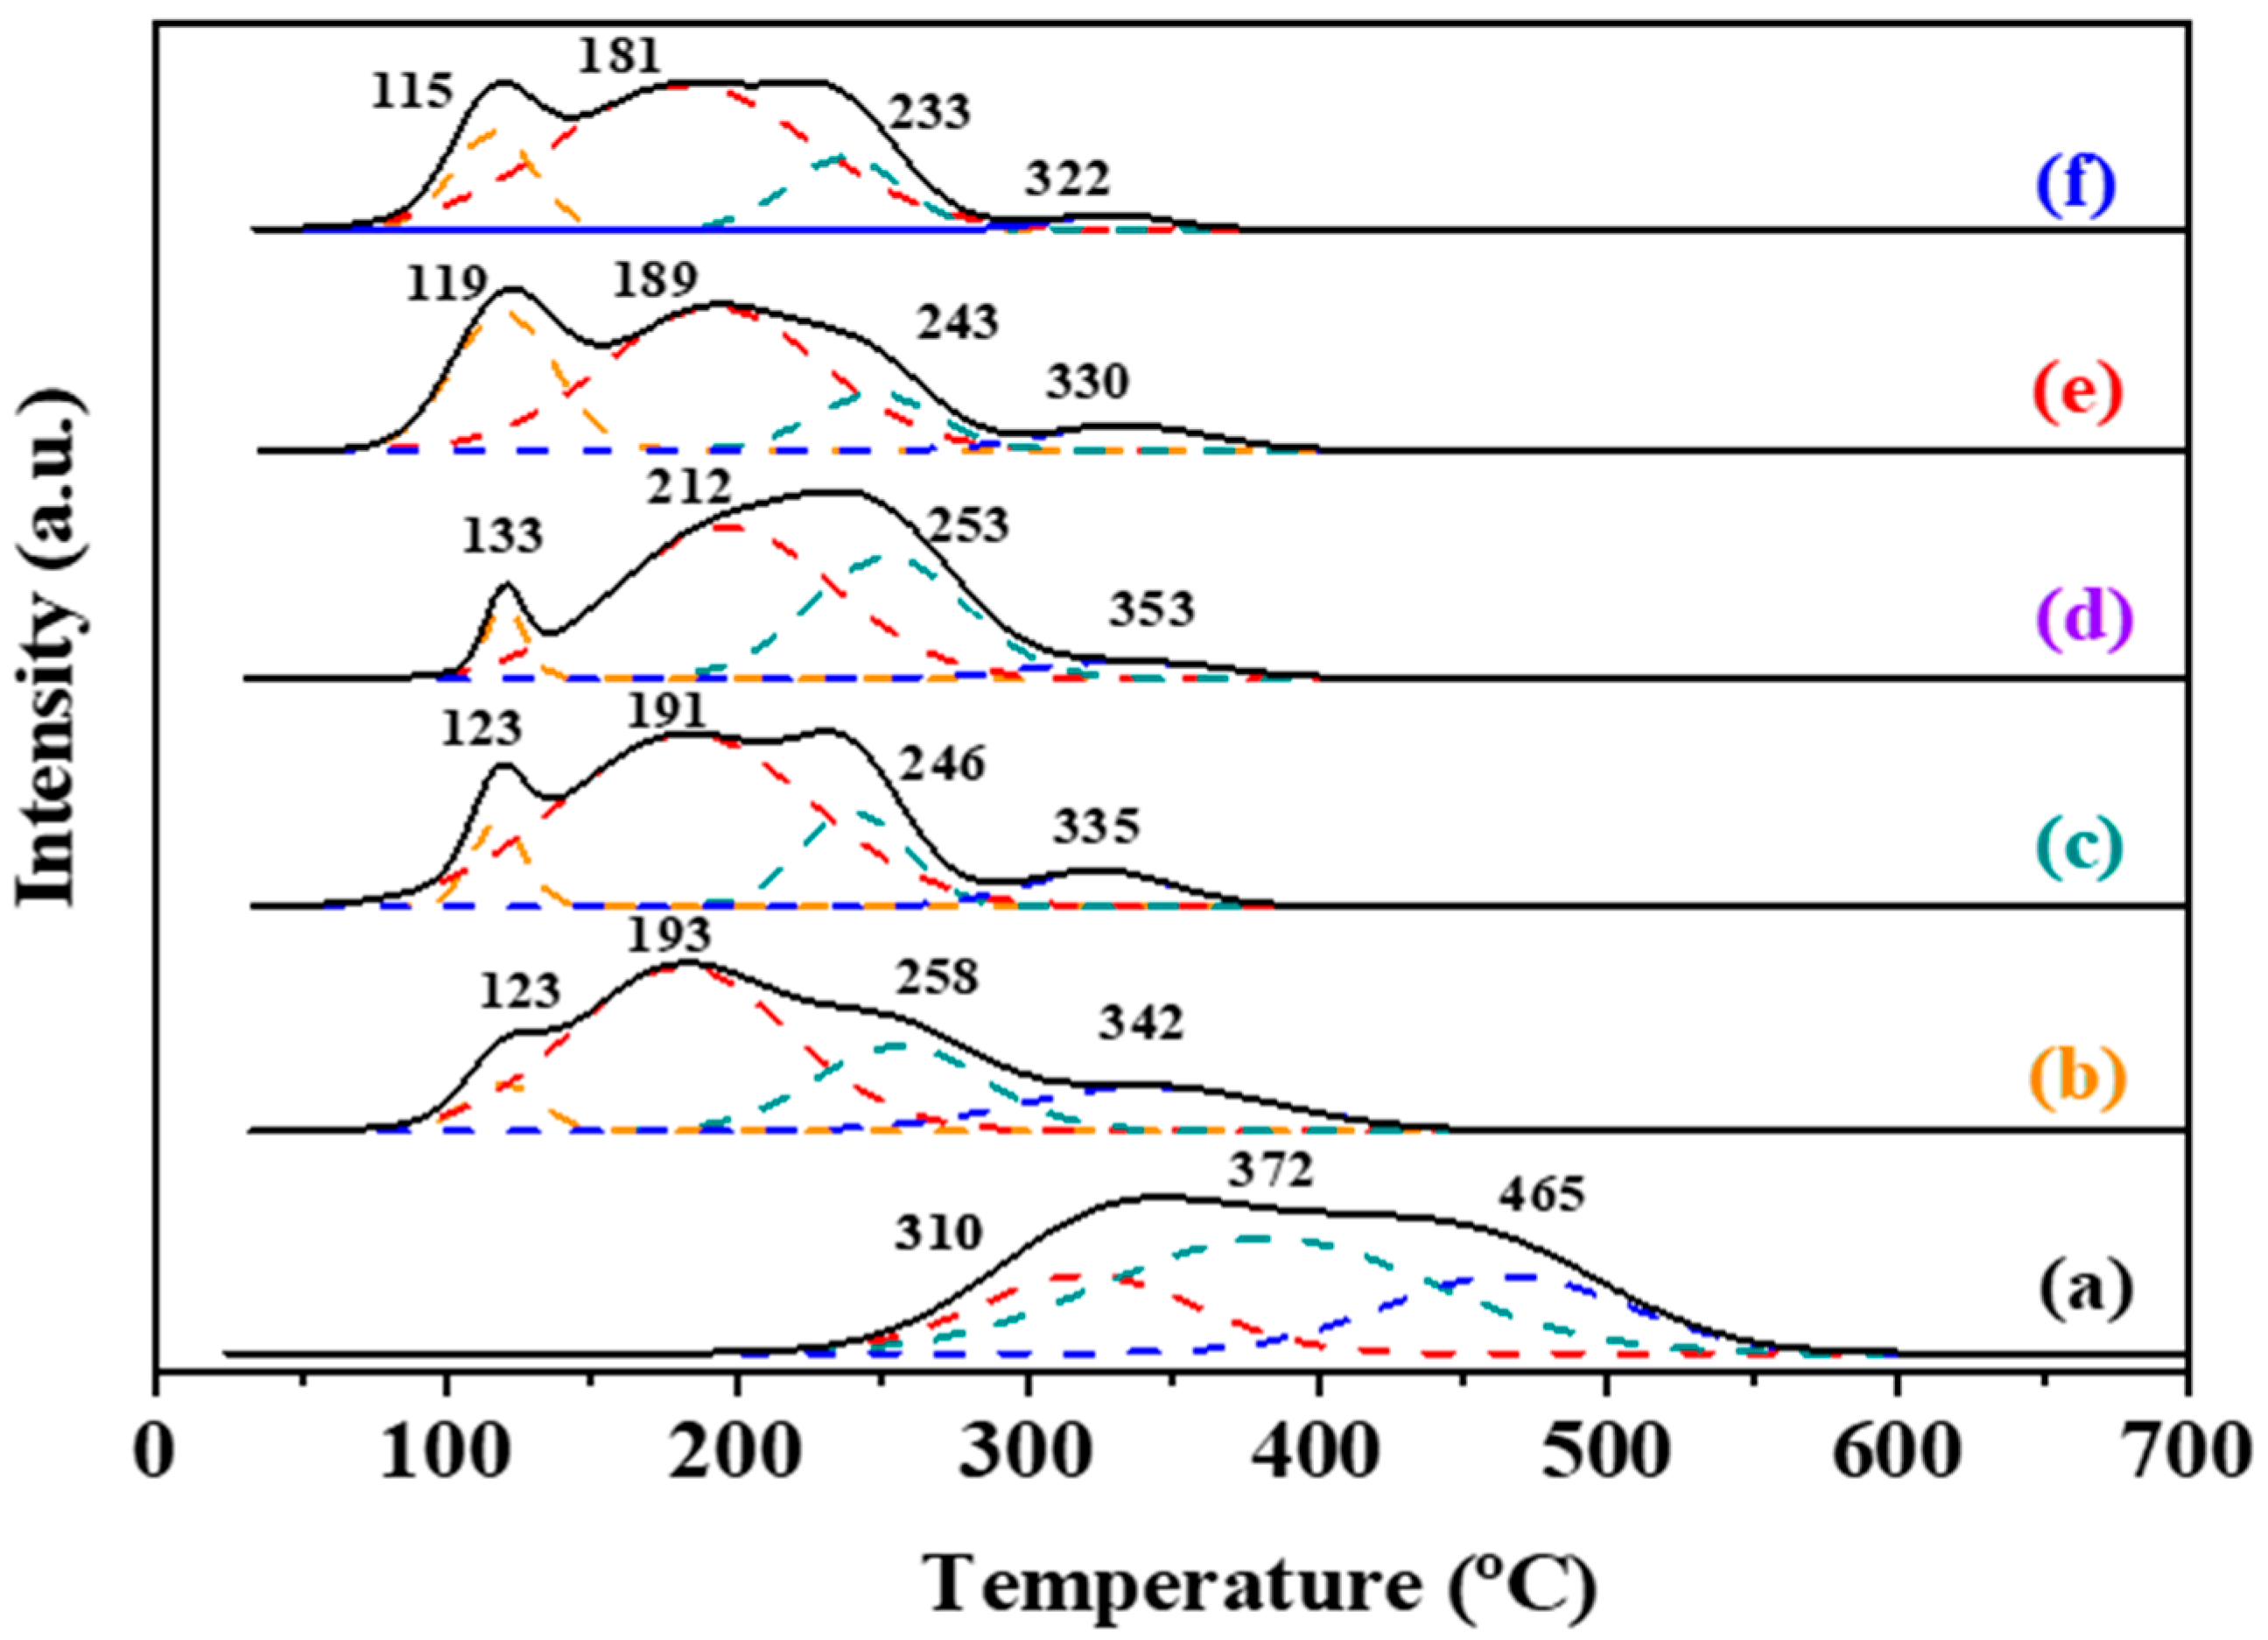
In order to study the reducibility of the samples, H2-TPR experiments were carried out and their profiles are shown in Figure 6. By quantitatively analyzing the reduction peaks in H2-TPR profiles, we estimated the H2 consumption of the samples (Table 3). The H2-TPR profile of the α-MnO2 sample could be decomposed into three peaks that are denoted as peaks α, β, and γ, respectively. For the α-MnO2 sample, peak α at the lowest temperature (310 °C) corresponded to the consumption of the oxygen species adsorbed on the sample surface, and peak β (372 °C) and peak γ (465 °C) were attributed to the continuous reduction of MnO2 → Mn3O4 → MnO [13]. After the introduction of Pd-Pt NPs, however, the reduction peak of α-MnO2 was shifted to a lower temperature, which indicates that there was a strong interaction between the noble metal NPs and α-MnO2. Such a strong interaction could improve the low-temperature reducibility of the noble metal samples supported on α-MnO2, thus enhancing the catalytic performance. There are some reports on the strong metal–support interaction leading to a shift at a lower temperature in the H2-TPR profile of catalysts. For example, when Pd, Pt, or Pd-Pt alloy nanoparticles were loaded on 6.70MnOx/3DOM CoFe2O4 [26] or mesoporous MnO2 [38], the reduction peaks were shifted to lower temperatures. The results indicated that there was a strong interaction between the noble metal and the support. In other words, the loading of noble metal nanoparticles on 6.70MnOx/3DOM CoFe2O4 or mesoporous MnO2 enhanced its low-temperature reducibility. As shown in Figure 6 and Table 3, the reduction temperature decreased and the H2 consumption increased significantly with the loading of Pd and/or Pt. Clearly, compared with the other samples, 0.93Pd-0.89Pt/α-MnO2 exhibited the lowest reduction temperature (181 °C) and the highest hydrogen consumption (54.2 mmol/g). Therefore, the strongest interaction was between Pd-Pt NPs and α-MnO2; hence, it exhibited the best catalytic activity for toluene oxidation.

2.5. Catalytic Stability and Effects of SV, Water Vapor, and Sulfur Dioxide

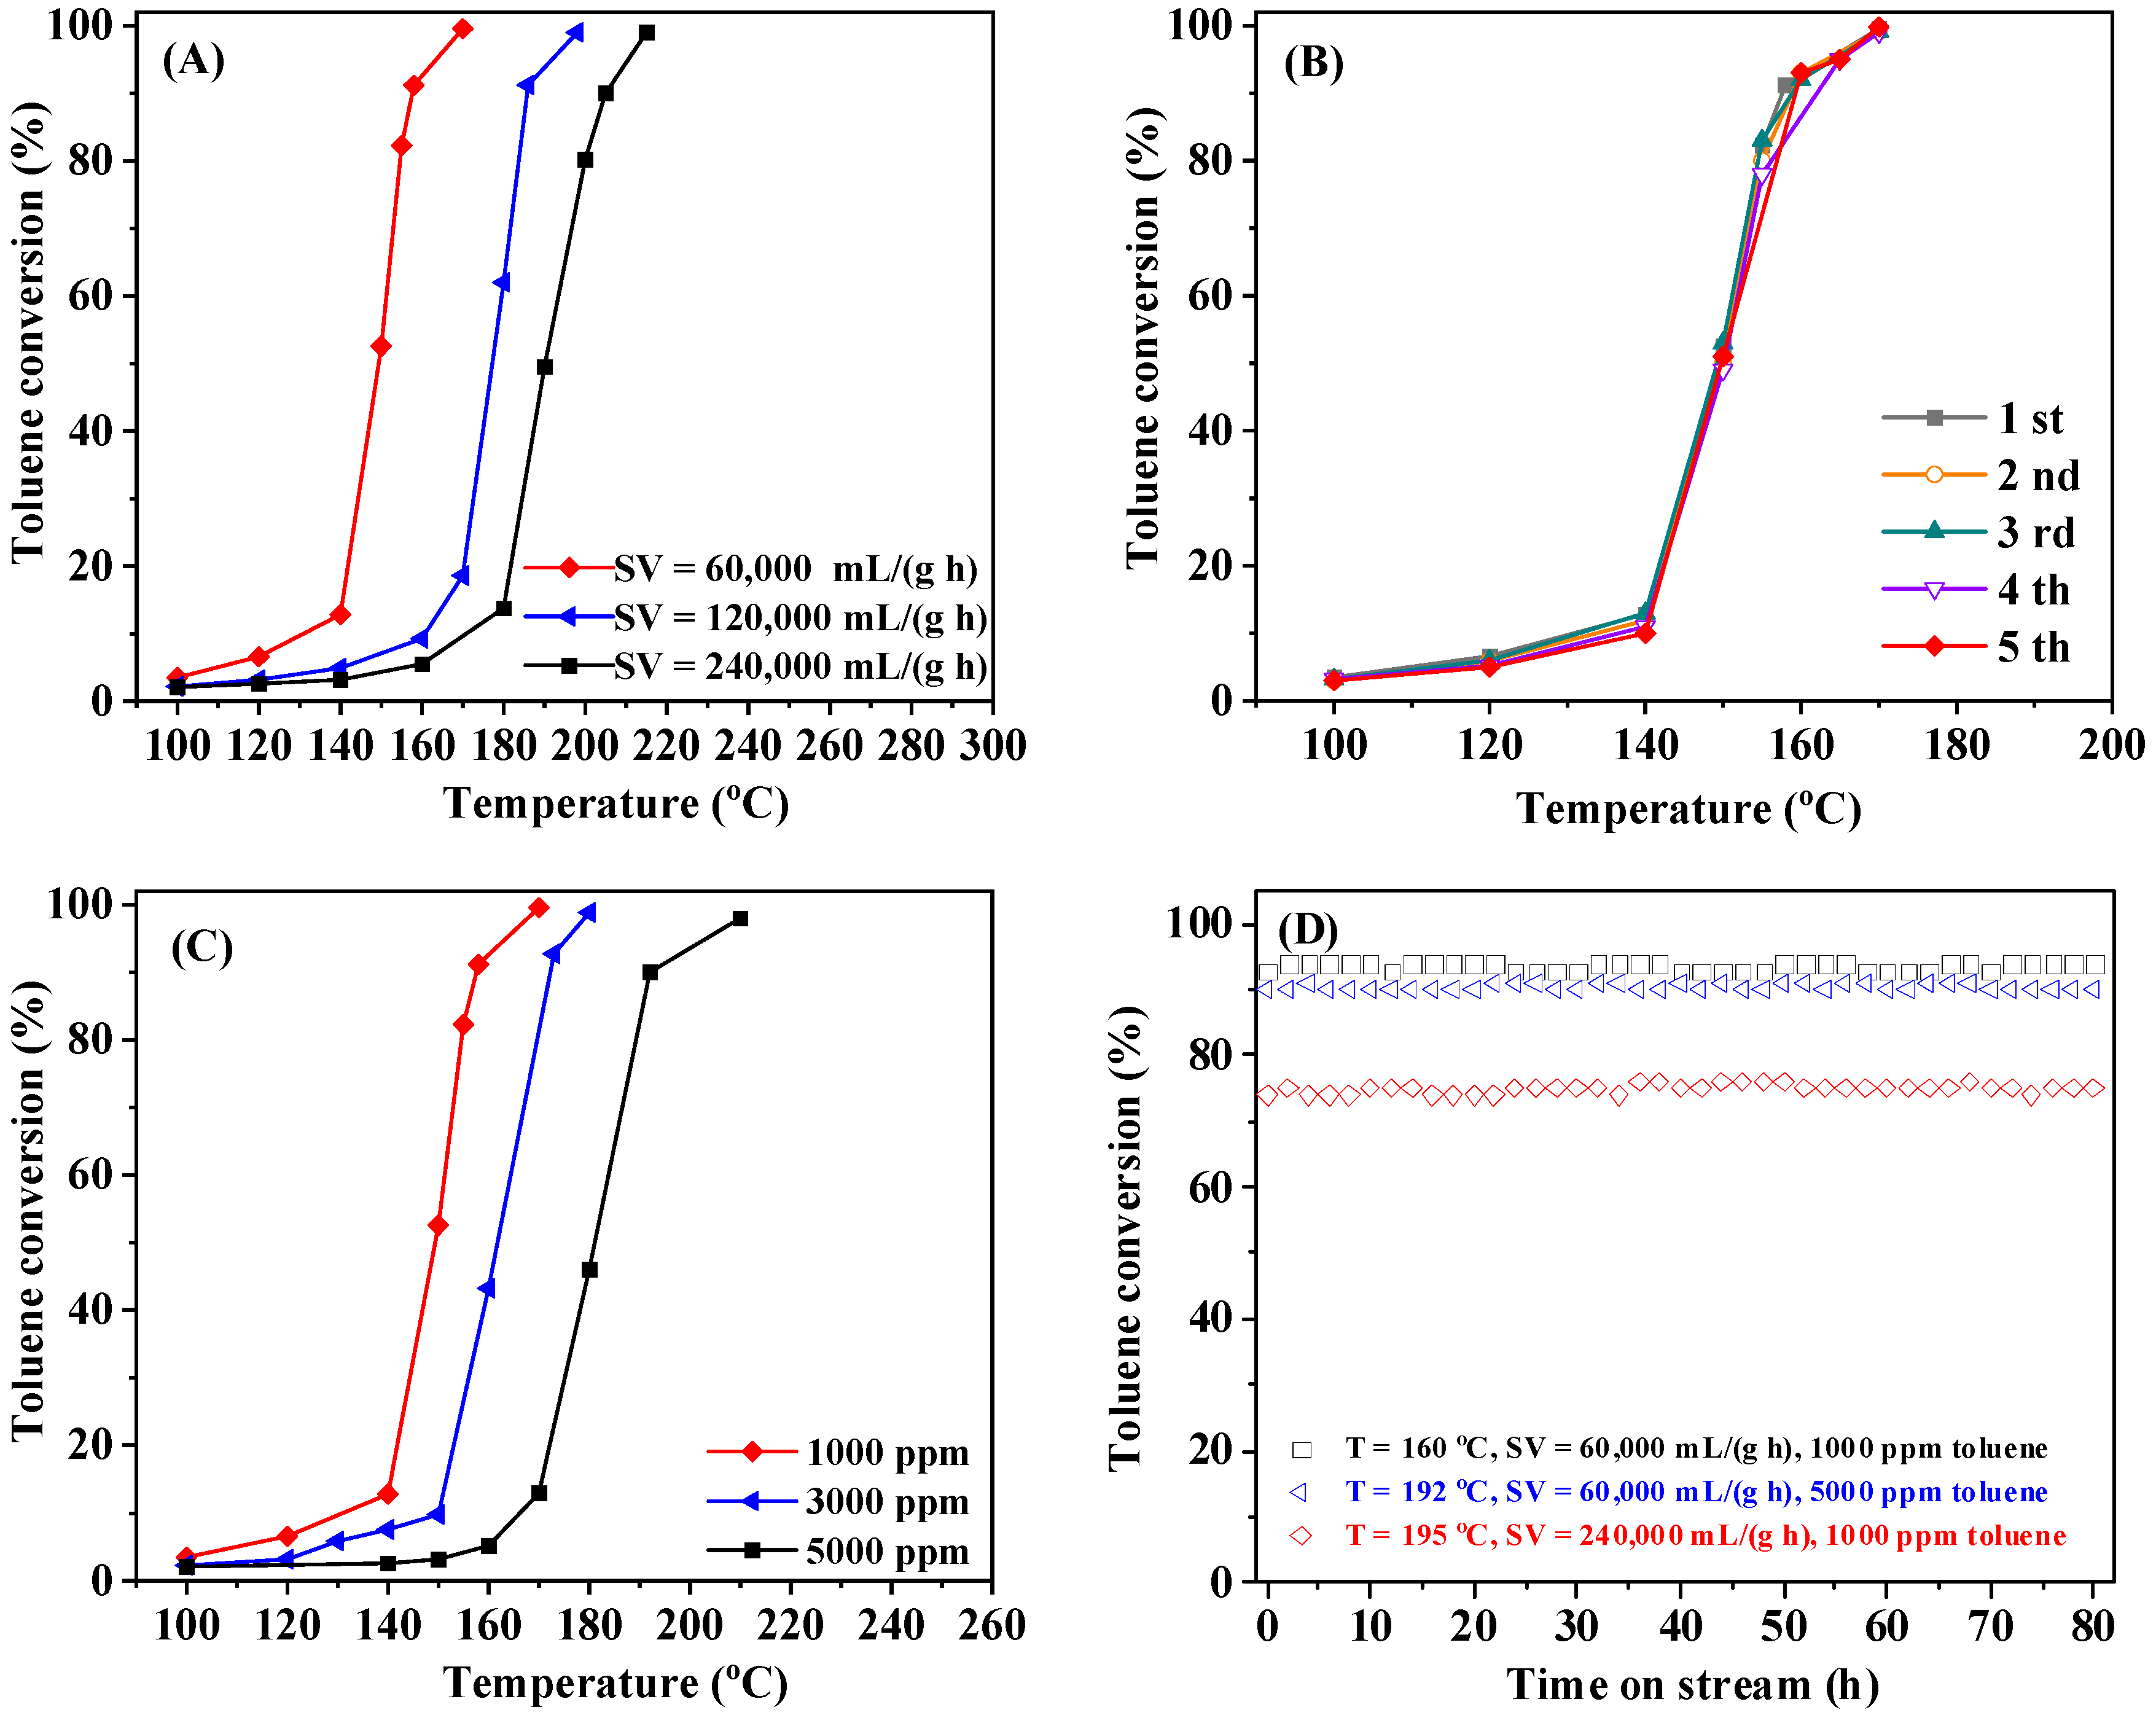
The effect of SV on the catalytic activity of 0.47Pd-0.46Pt/α-MnO2 is shown in Figure 7A. It can be seen that with the rise in SV, the catalytic activity gradually decreased. This was due to the shortening of the contact time between toluene molecules and the catalyst, which decreased the conversion of toluene. Nevertheless, under high-SV conditions (240,000 mL/(g h)), a complete conversion of toluene could be still achieved over the 0.47Pd-0.46Pt/α-MnO2 sample at 235 °C. The reusability of a catalyst is an important feature for evaluating its catalytic performance. The recyclability of 0.47Pd-0.46Pt/α-MnO2 was tested, and the result is shown in Figure 7B. After five recycles, toluene conversions were hardly changed, which demonstrates that the 0.47Pd-0.46Pt/α-MnO2 sample was catalytically durable. Figure 7C shows the conversions of toluene at different concentrations over the 0.47Pd-0.46Pt/α-MnO2 sample. Even at a concentration of 5000 ppm toluene, the sample still showed good activity, with toluene being completely converted at 223 °C. In order to examine the stability of the best-performing 0.47Pd-0.46Pt/α-MnO2 sample, we carried out on-stream toluene oxidation for up to 80 h under the conditions of different SVs, toluene concentrations, and different temperatures (Figure 7D). Seemingly, there were no significant alterations in the catalytic activity of this sample under different conditions, indicating that the 0.47Pd-0.46Pt/α-MnO2 sample possessed good catalytic stability.
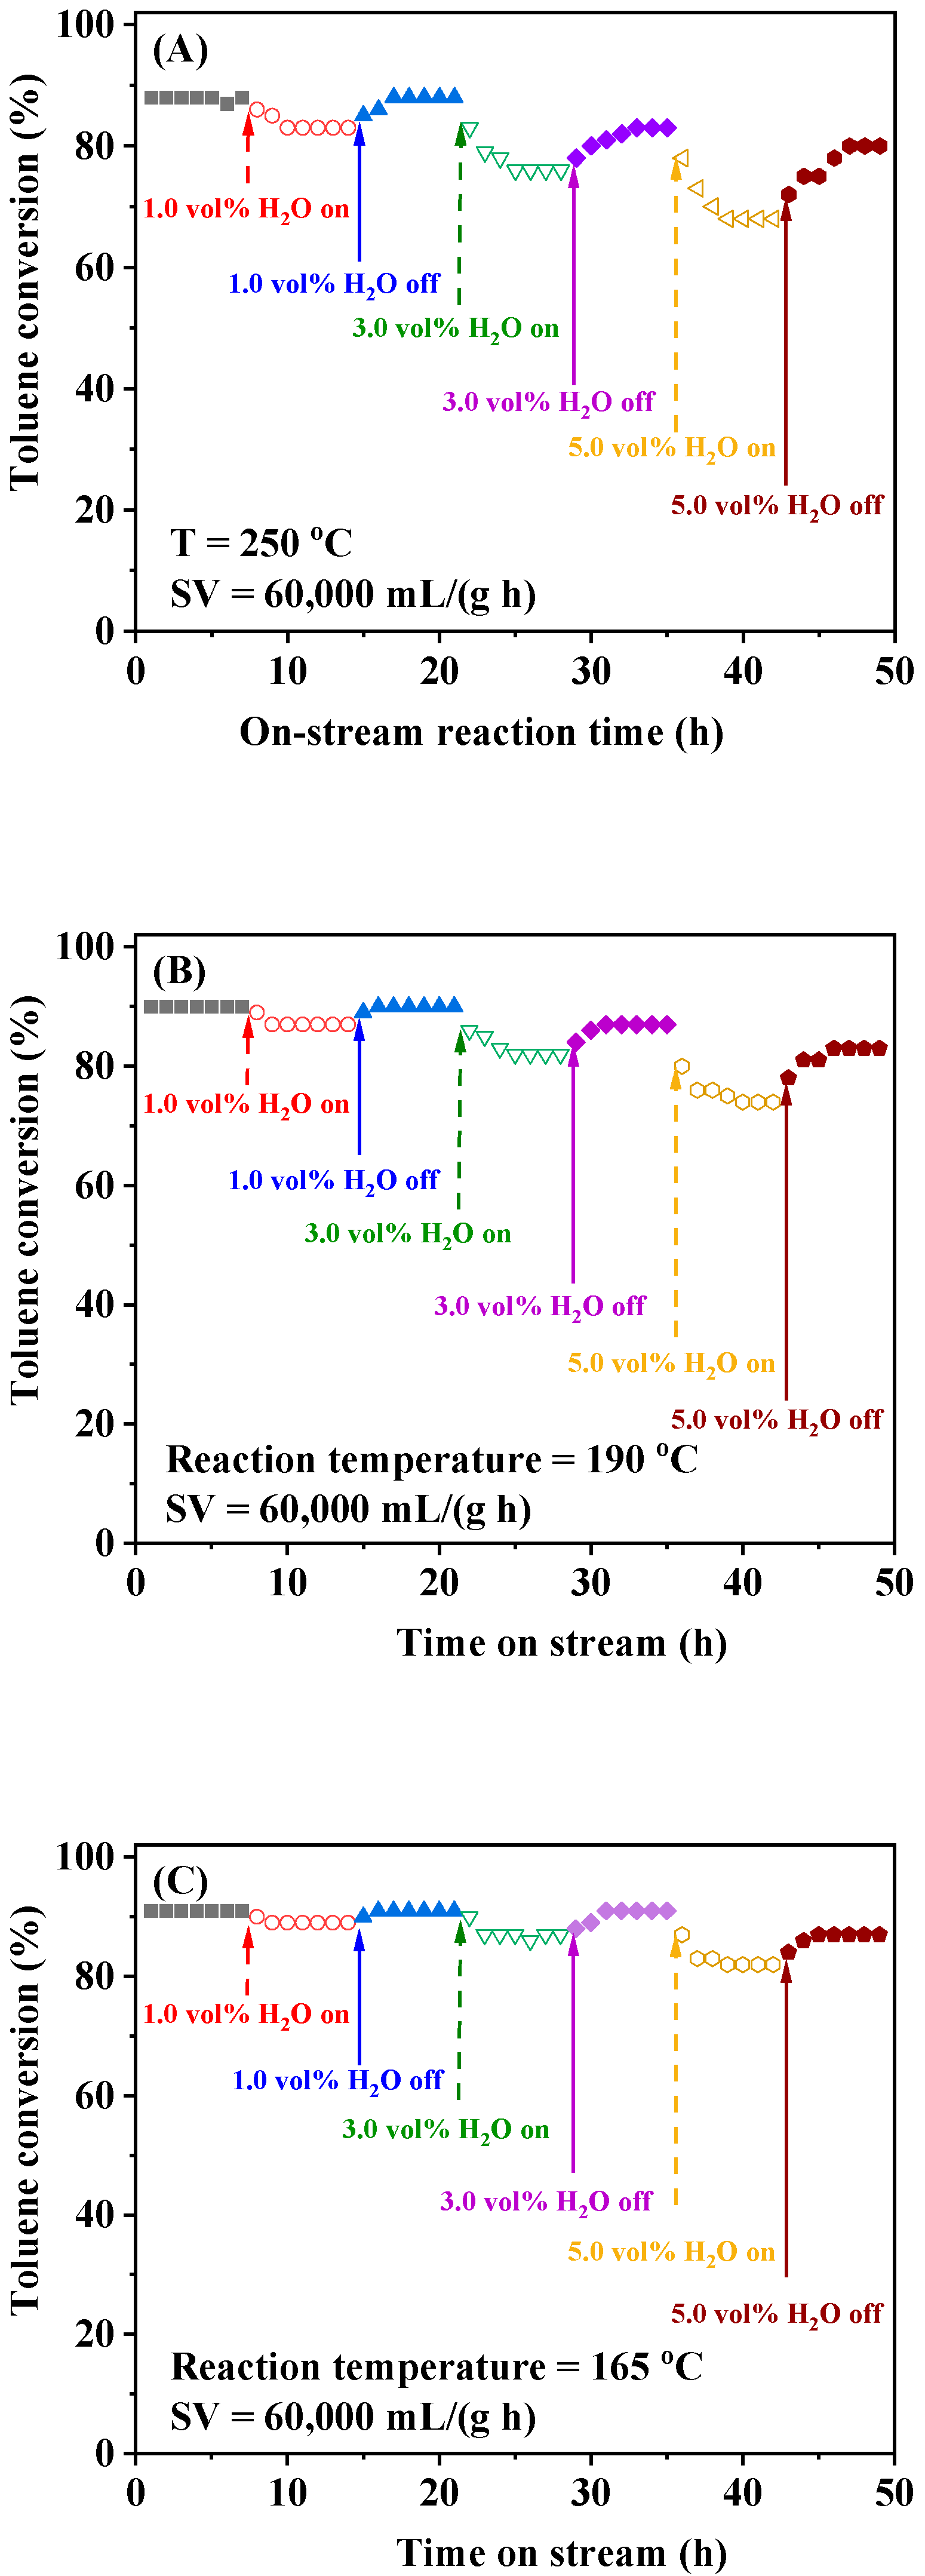
Since most VOC emissions contain water vapor and water is also one of the products of VOC combustion, it is necessary to investigate the effect of water vapor on the catalytic oxidation of VOCs over catalysts. Figure 8 shows the influence of water vapor on the catalytic activity of the α-MnO2, 0.92Pd/α-MnO2, and 0.47Pd-0.46Pt/α-MnO2 samples for toluene oxidation in the presence of 1.0, 3.0, or 5.0 vol% water vapor at SV = 60,000 mL/(g h). It should be noted that the water concentration range was chosen as a typical level of water presence in practical industrial processes (e.g., [39,40,41]). When 5.0 vol% water vapor was introduced, the catalytic activity of 0.47Pd-0.46Pt/α-MnO2 was decreased slightly but to a lesser extent, and toluene conversions finally stabilized at 82%, while those of 0.93Pd/α-MnO2 and α-MnO2 decreased to 74 and 68%, respectively. The above results show that the presence of water vapor exerts a significant effect on the catalytic activity of α-MnO2, and the loading of noble metals could reduce the effect of water vapor. According to the literature, water vapor molecules tend to be adsorbed on the surface of metal oxide supports rather than the surface of precious metals [42]. A previous study reported that after 1.0 vol% water vapor was introduced, the decrease in catalytic activity for toluene oxidation over a manganese oxide-supported gold nanocatalyst was associated with the competitive adsorption of water vapor and reactant molecules on the catalyst surface [43]. Therefore, there was no significant change in the catalytic activity of the 0.47Pd-0.46Pt/α-MnO2 sample after a certain amount of water vapor (1.0–3.0 vol%) was introduced, which was due to the strong interaction between the highly dispersed Pd and Pt NPs and the α-MnO2 support. There are some reports on the effect of a strong metal–support interaction on the water resistance of the catalysts. For instance, Guo et al. [44] claimed that the strong interaction between manganese or europium and iron resulted in excellent low-temperature selective catalytic reduction activity and water resistance for the manganese–europium–iron (1)-500 catalyst. By means of XPS and H2-TPR characterization, Li et al. [45] confirmed that the good water resistance of their catalyst originated from the strong interaction between nickel and the dopant Ca element.
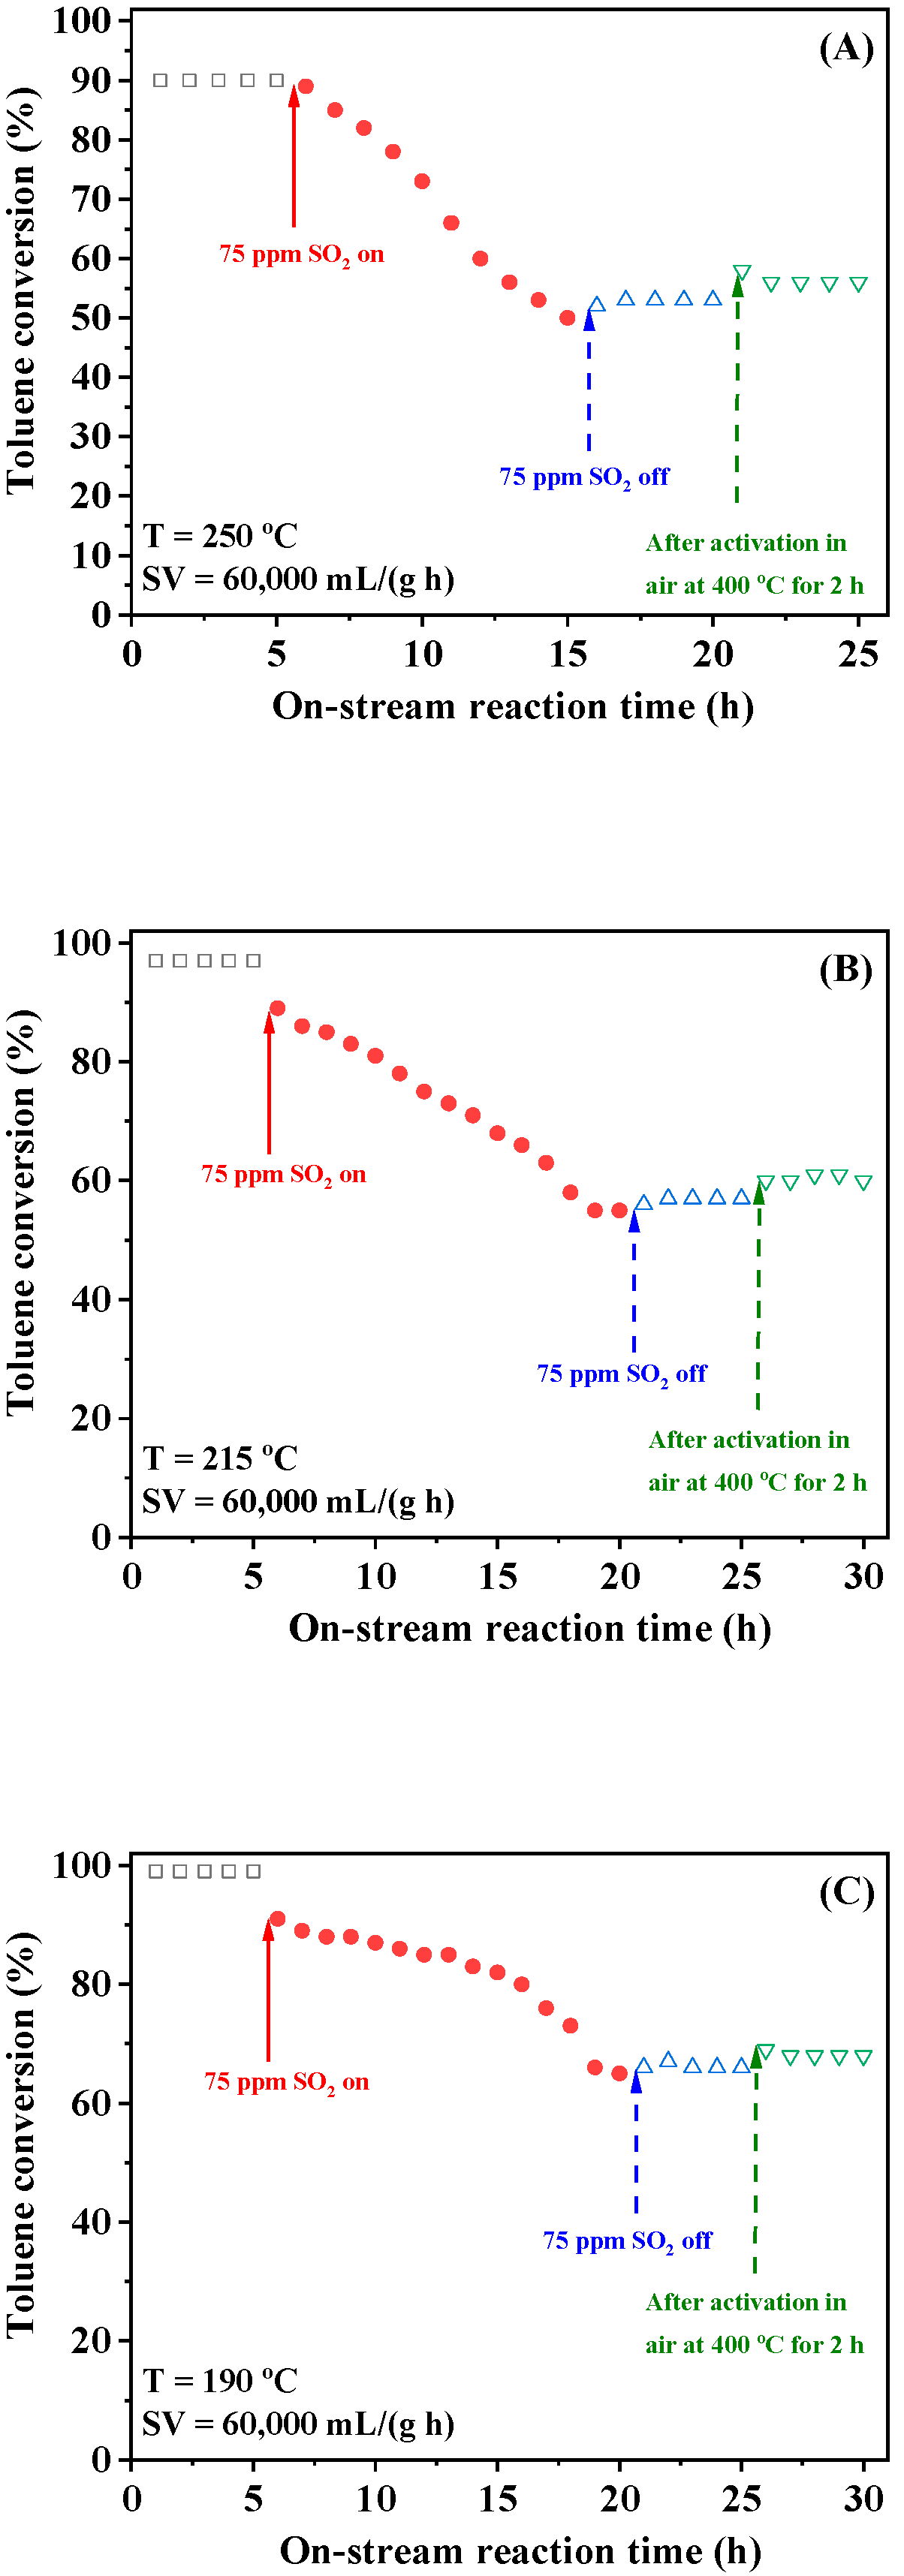
Due to the possible presence of SO2 in the practical applications of VOCs, we investigated the SO2 effect on catalytic toluene oxidation. In order to explore the influence of SO2, we used the α-MnO2, 0.92Pd/α-MnO2, and 0.47Pd-0.46Pt/α-MnO2 samples to conduct stability tests in the presence of 75 ppm SO2 during the oxidation of toluene. It can be seen from Figure 9A that the catalytic activity of the α-MnO2 support decreased after the introduction of 75 ppm SO2; after 10 h of on-stream reaction, the α-MnO2 sample was deactivated, and toluene conversion decreased from 90 to 49%. Figure 9B shows the stability of 0.92Pd/α-MnO2 in the presence of 75 ppm SO2 during the toluene oxidation process. After the addition of SO2, toluene conversion decreased, but the decrease degree over 0.92Pd/α-MnO2 was lower than that over α-MnO2; toluene conversion was 55% after 15 h of on-stream reaction. As shown in Figure 9C, the drop in toluene conversion over 0.47Pd-0.46Pt/α-MnO2 was slower than that over α-MnO2 or 0.92Pd/α-MnO2. After 15 h of on-stream reaction in the presence of 75 ppm SO2, toluene conversion dropped from 91 to 65%. Therefore, the 0.47Pd-0.46Pt/α-MnO2 sample showed better SO2 resistance than the α-MnO2 and 0.92Pd/α-MnO2 samples.
When the above samples after SO2 poisoning were treated in a synthetic air stream of 50 mL/min at 400 °C for 2 h, toluene conversions were not completely recovered. This result indicates that the partial deactivation of these samples caused by SO2 addition was irreversible, but the 0.47Pd-0.46Pt/α-MnO2 sample exhibited the best SO2 tolerance.

2.6. Physicochemical Properties After Sulfur Dioxide Treatment

In order to explore the cause of SO2 poisoning and deactivation, we compared the physicochemical properties of the fresh 0.47Pd-0.46Pt/α-MnO2 sample and the SO2-treated sample (0.47Pd-0.46Pt/α-MnO2-S). Figure S5A shows XRD patterns of the fresh and SO2-treated samples. Compared with the fresh 0.47Pd-0.46Pt/α-MnO2 sample, the diffraction peak positions of the 0.47Pd-0.46Pt/α-MnO2-S sample did not change, but their intensity was significantly decreased. In addition, no diffraction peaks due to the sulfate species were detected, indicating that the sulfate species might exist mainly in an amorphous form on the sample surface. The XRD results reveal that the introduction of Pd and Pt exerted a protective effect on the sample in the presence of SO2. The N2 adsorption–desorption isotherm (Figure S5C) of the 0.47Pd-0.46Pt/α-MnO2-S sample was the same as that of the fresh counterpart. The sorption isotherm with an H3-type hysteresis loop was type IV at a p/p0 of 0.6–1.0, indicating the presence of a mesoporous structure. As shown in Figure S5D, the average pore size of the 0.47Pd-0.46Pt/α-MnO2-S sample, calculated using the BJH method, was 15.8 nm, which was significantly bigger than that of the fresh sample (7.1 nm). In addition, compared with the fresh sample, the surface area of 0.47Pd-0.46Pt/α-MnO2-S decreased from 41.7 to 20.3 m2/g. This result might be due to the formation of sulfate species covering the surface of the sample, causing the blockage of some of the pores. Figure S6 shows the SEM images of the fresh and SO2-poisoned samples. The morphology and structure of the sample after SO2 treatment did not change significantly, similarly to those of the fresh sample; i.e., they maintained the original nanorod-like morphology. Therefore, the introduction of SO2 did not alter the morphology and structure of the 0.47Pd-0.46Pt/α-MnO2 sample.
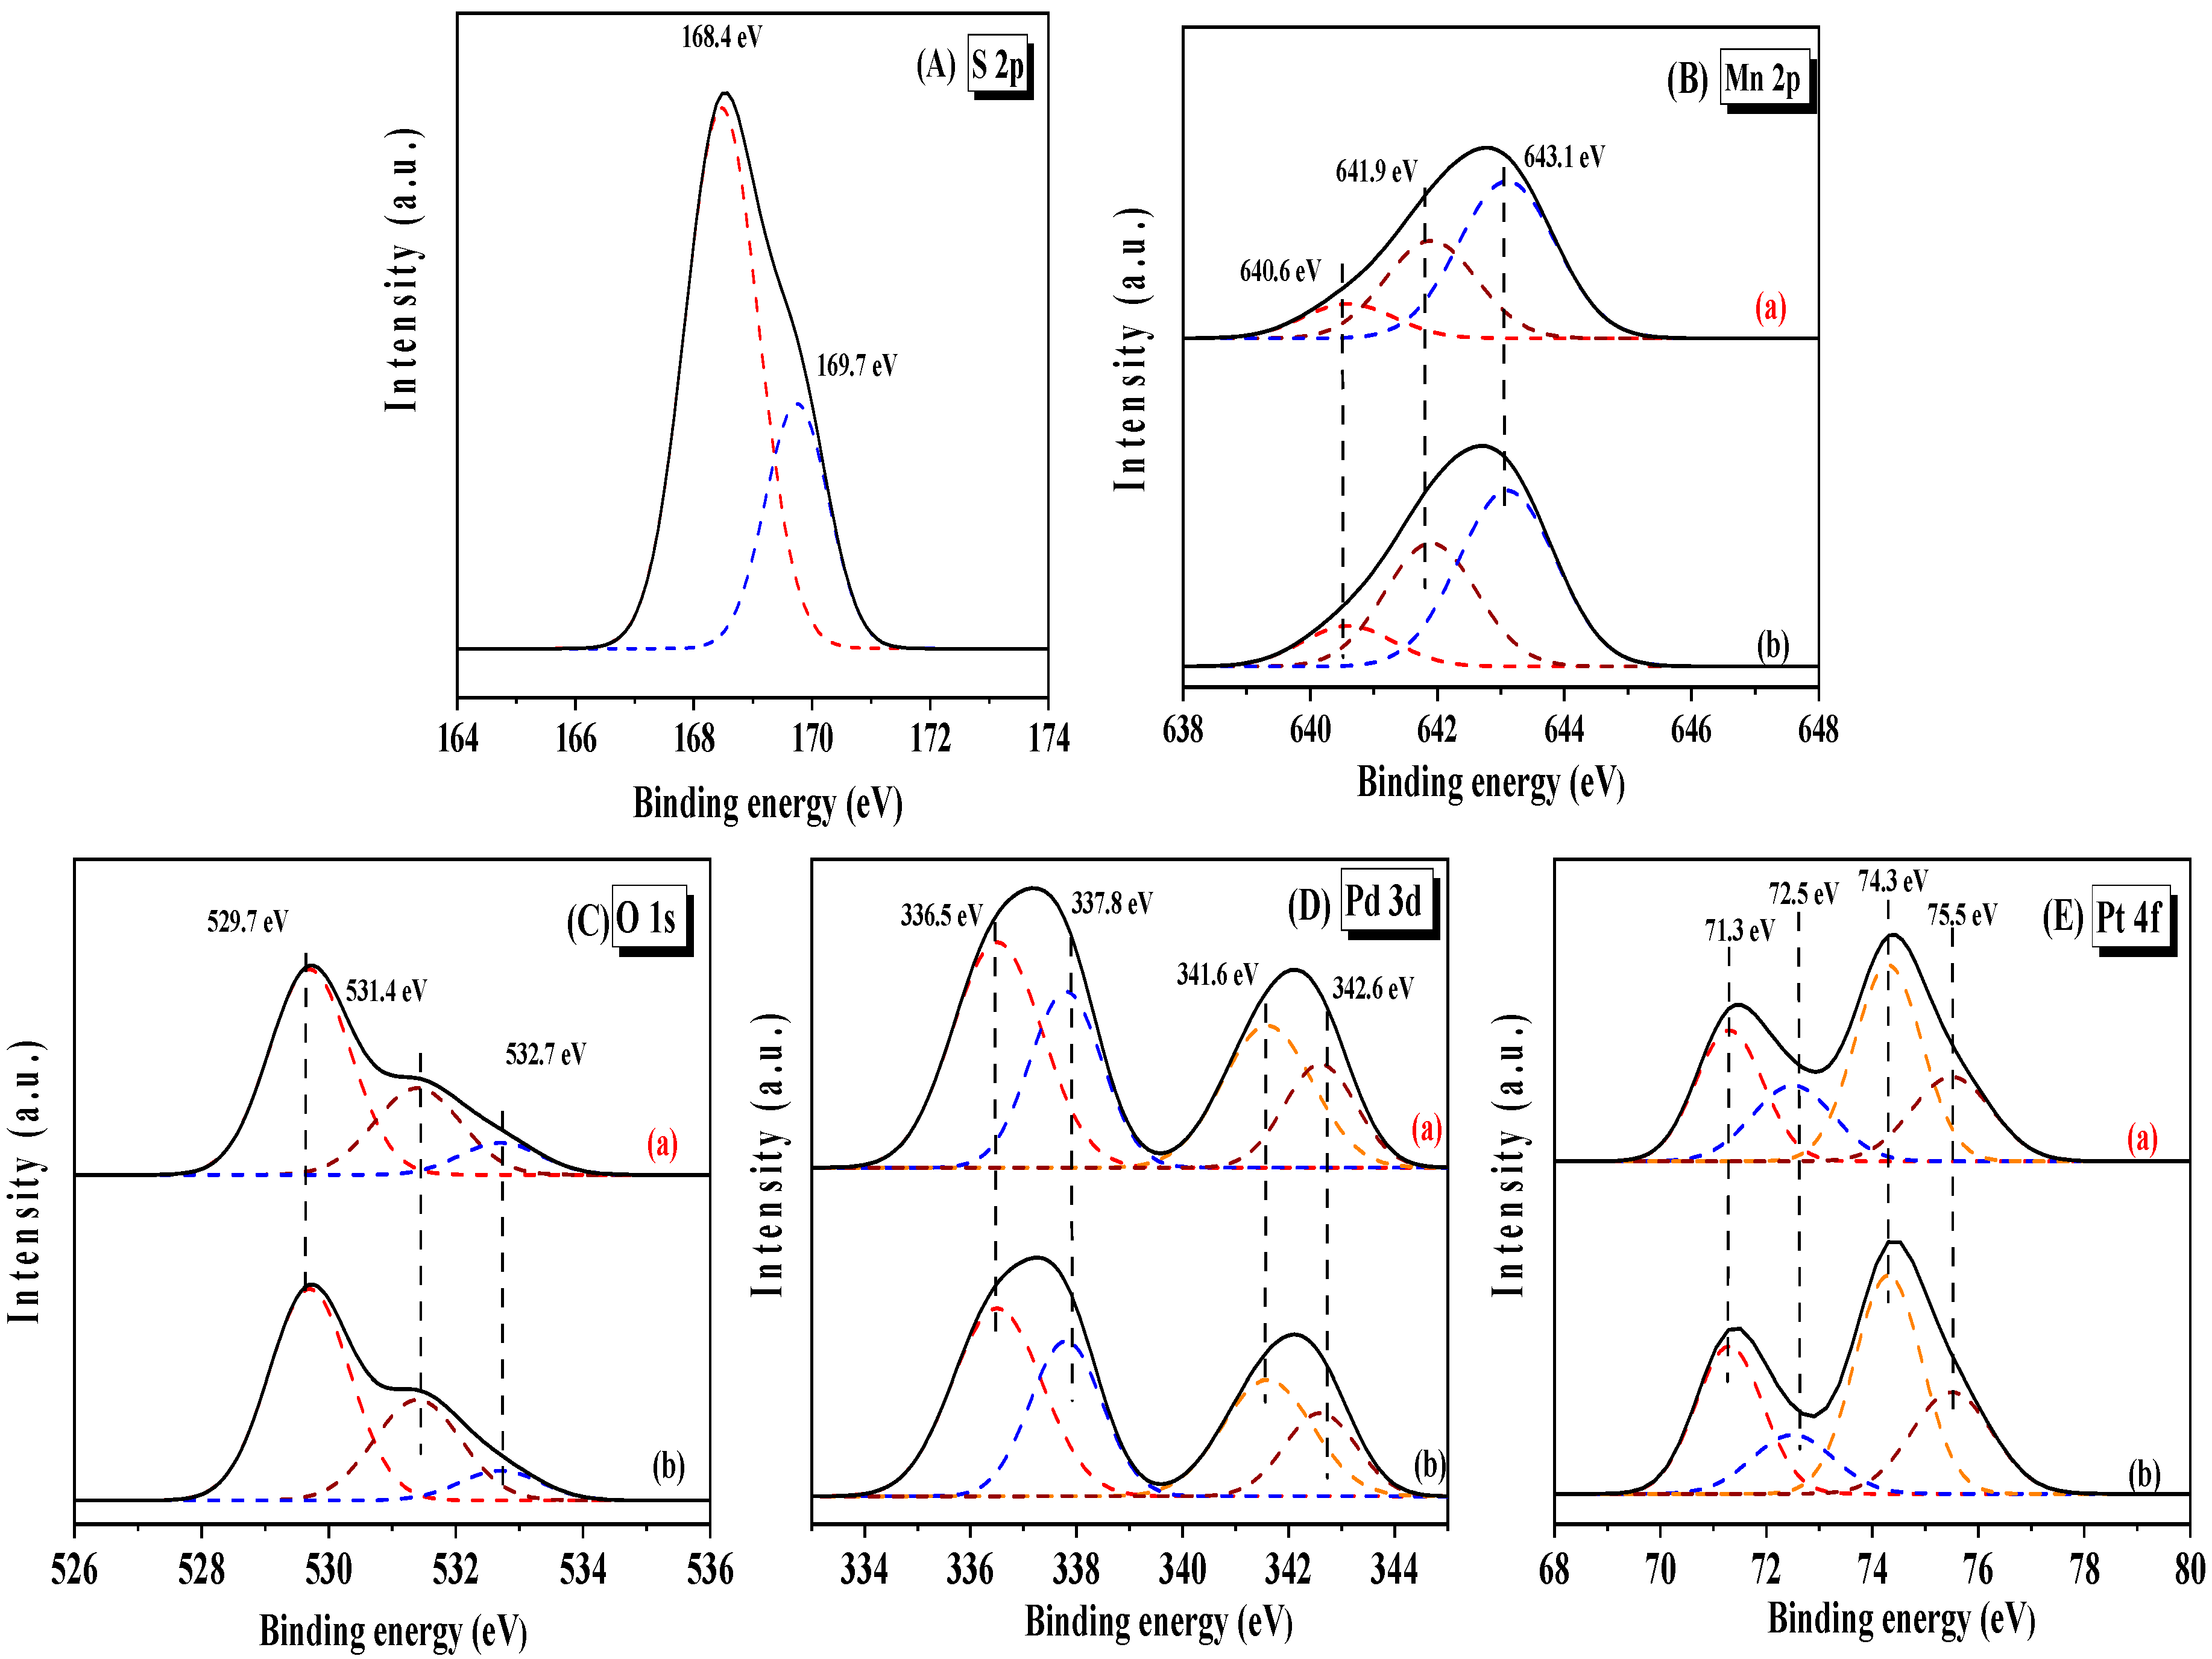
In order to better understand the changes in surface species of the samples before and after SO2 treatment, we performed XPS characterization on these samples, and the results are shown in Figure 10. Figure 10A shows the S 2p XPS spectrum of the 0.47Pd-0.46Pt/α-MnO2 sample after SO2 treatment, which can be decomposed into two components at BE = 168.4 and 169.7 eV attributable to the different sulfate species [46]. Figure 10B exhibits the Mn 2p XPS spectra of the fresh 0.47Pd-0.46Pt/α-MnO2 sample and the 0.47Pd-0.46Pt/α-MnO2-S sample. Clearly, the SO2 treatment increased the concentration of the surface Mn2+ species. It was found that the molar ratio (0.59) of Mn3+/Mn4+ on 0.47Pd-0.46Pt/α-MnO2-S sample decreased compared to that on the fresh sample (0.66). This result indicates that the introduction of SO2 favors the transformation of the surface Mn3+ and Mn4+ species into surface Mn2+ species, thereby combining with the formed sulfate species to generate MnSO4 species. Figure 10C illustrates the O 1s XPS spectra of the fresh and SO2-treated 0.47Pd-0.46Pt/α-MnO2 samples. Compared to the Oads/Olatt molar ratio (0.51) on the fresh sample, that on the SO2-treated sample (0.45) decreased, which indicates that the introduction of SO2 affects the Oads species concentration. Figure 10D,E show Pd 3d and Pt 4f XPS spectra of the fresh and SO2-treated samples. Compared with the molar ratios of Pd2+/Pd0 (0.60) and Pt2+/Pt0 (0.56), there was a small variation in the Pd2+ and Pt2+ species concentrations after SO2 treatment. This result was due to the formation of PdSO4 and PtSO4 via the interaction of the Pd2+ and Pt2+ species with SO2. Compared with the influence of SO2 on the Mn species, Pd and Pt possessed better sulfur dioxide resistance. Therefore, it can be inferred that the partial deactivation of the catalyst was caused by the deactivation of α-MnO2.
Figure S7 illustrates H2-TPR profiles of the fresh and SO2-treated 0.47Pd-0.46Pt/α-MnO2 samples. Compared with the fresh sample, the reduction peak of the SO2-treated 0.47Pd-0.46Pt/α-MnO2-S sample was obviously shifted to a higher temperature, which indicates that the reducibility of 0.47Pd-0.46Pt/α-MnO2-S was decreased; the low-temperature reducibility was weakened more clearly. At the same time, the 0.47Pd-0.46Pt/α-MnO2-S sample showed a strong reduction peak at 552 °C, which was due to the reduction of the sulfate species [47]. This result was consistent with the previous XPS result. Therefore, it can be inferred that the strong peak in the sulfur dioxide-treated sample at 500–700 °C was attributed to the reduction of the MnSO4 species.
Figure S5B shows the TG profiles of the fresh and SO2-treated 0.47Pd-0.46Pt/α-MnO2 samples. The fresh sample exhibited a weight loss of approximately 2 wt% below 200 °C, which was attributed to the removal of moisture adsorbed on the sample surface. For the 0.47Pd-0.46Pt/α-MnO2-S sample, the weight loss between 200 and 350 °C was assigned to the dehydration of MnSO4·H2O. The weight loss at 400 or 600 °C was attributed to the decomposition of the oxysulfate intermediate formed on the surface of the sample. The decomposition of MnSO4 was observed around 750 °C, so the weight loss between 750 and 900 °C was due to the high-temperature decomposition of MnSO4 [48]. The above results show that the weight loss of the SO2-treated sample in the range of 300–600 °C was much higher than that of the fresh sample. This result demonstrates that during the SO2 treatment process of the samples, a large number of the Mn species in the sample were sulfated to generate MnSO4, which led to a significant decrease in the low-temperature activity of the sample. At the same time, the generated sulfate species could not be completely decomposed at 400 °C; hence, the activity of the sample could not recover to its original level, which is consistent with the result reflected in Figure 9C.

2.7. Reaction Intermediate and Reaction Mechanism

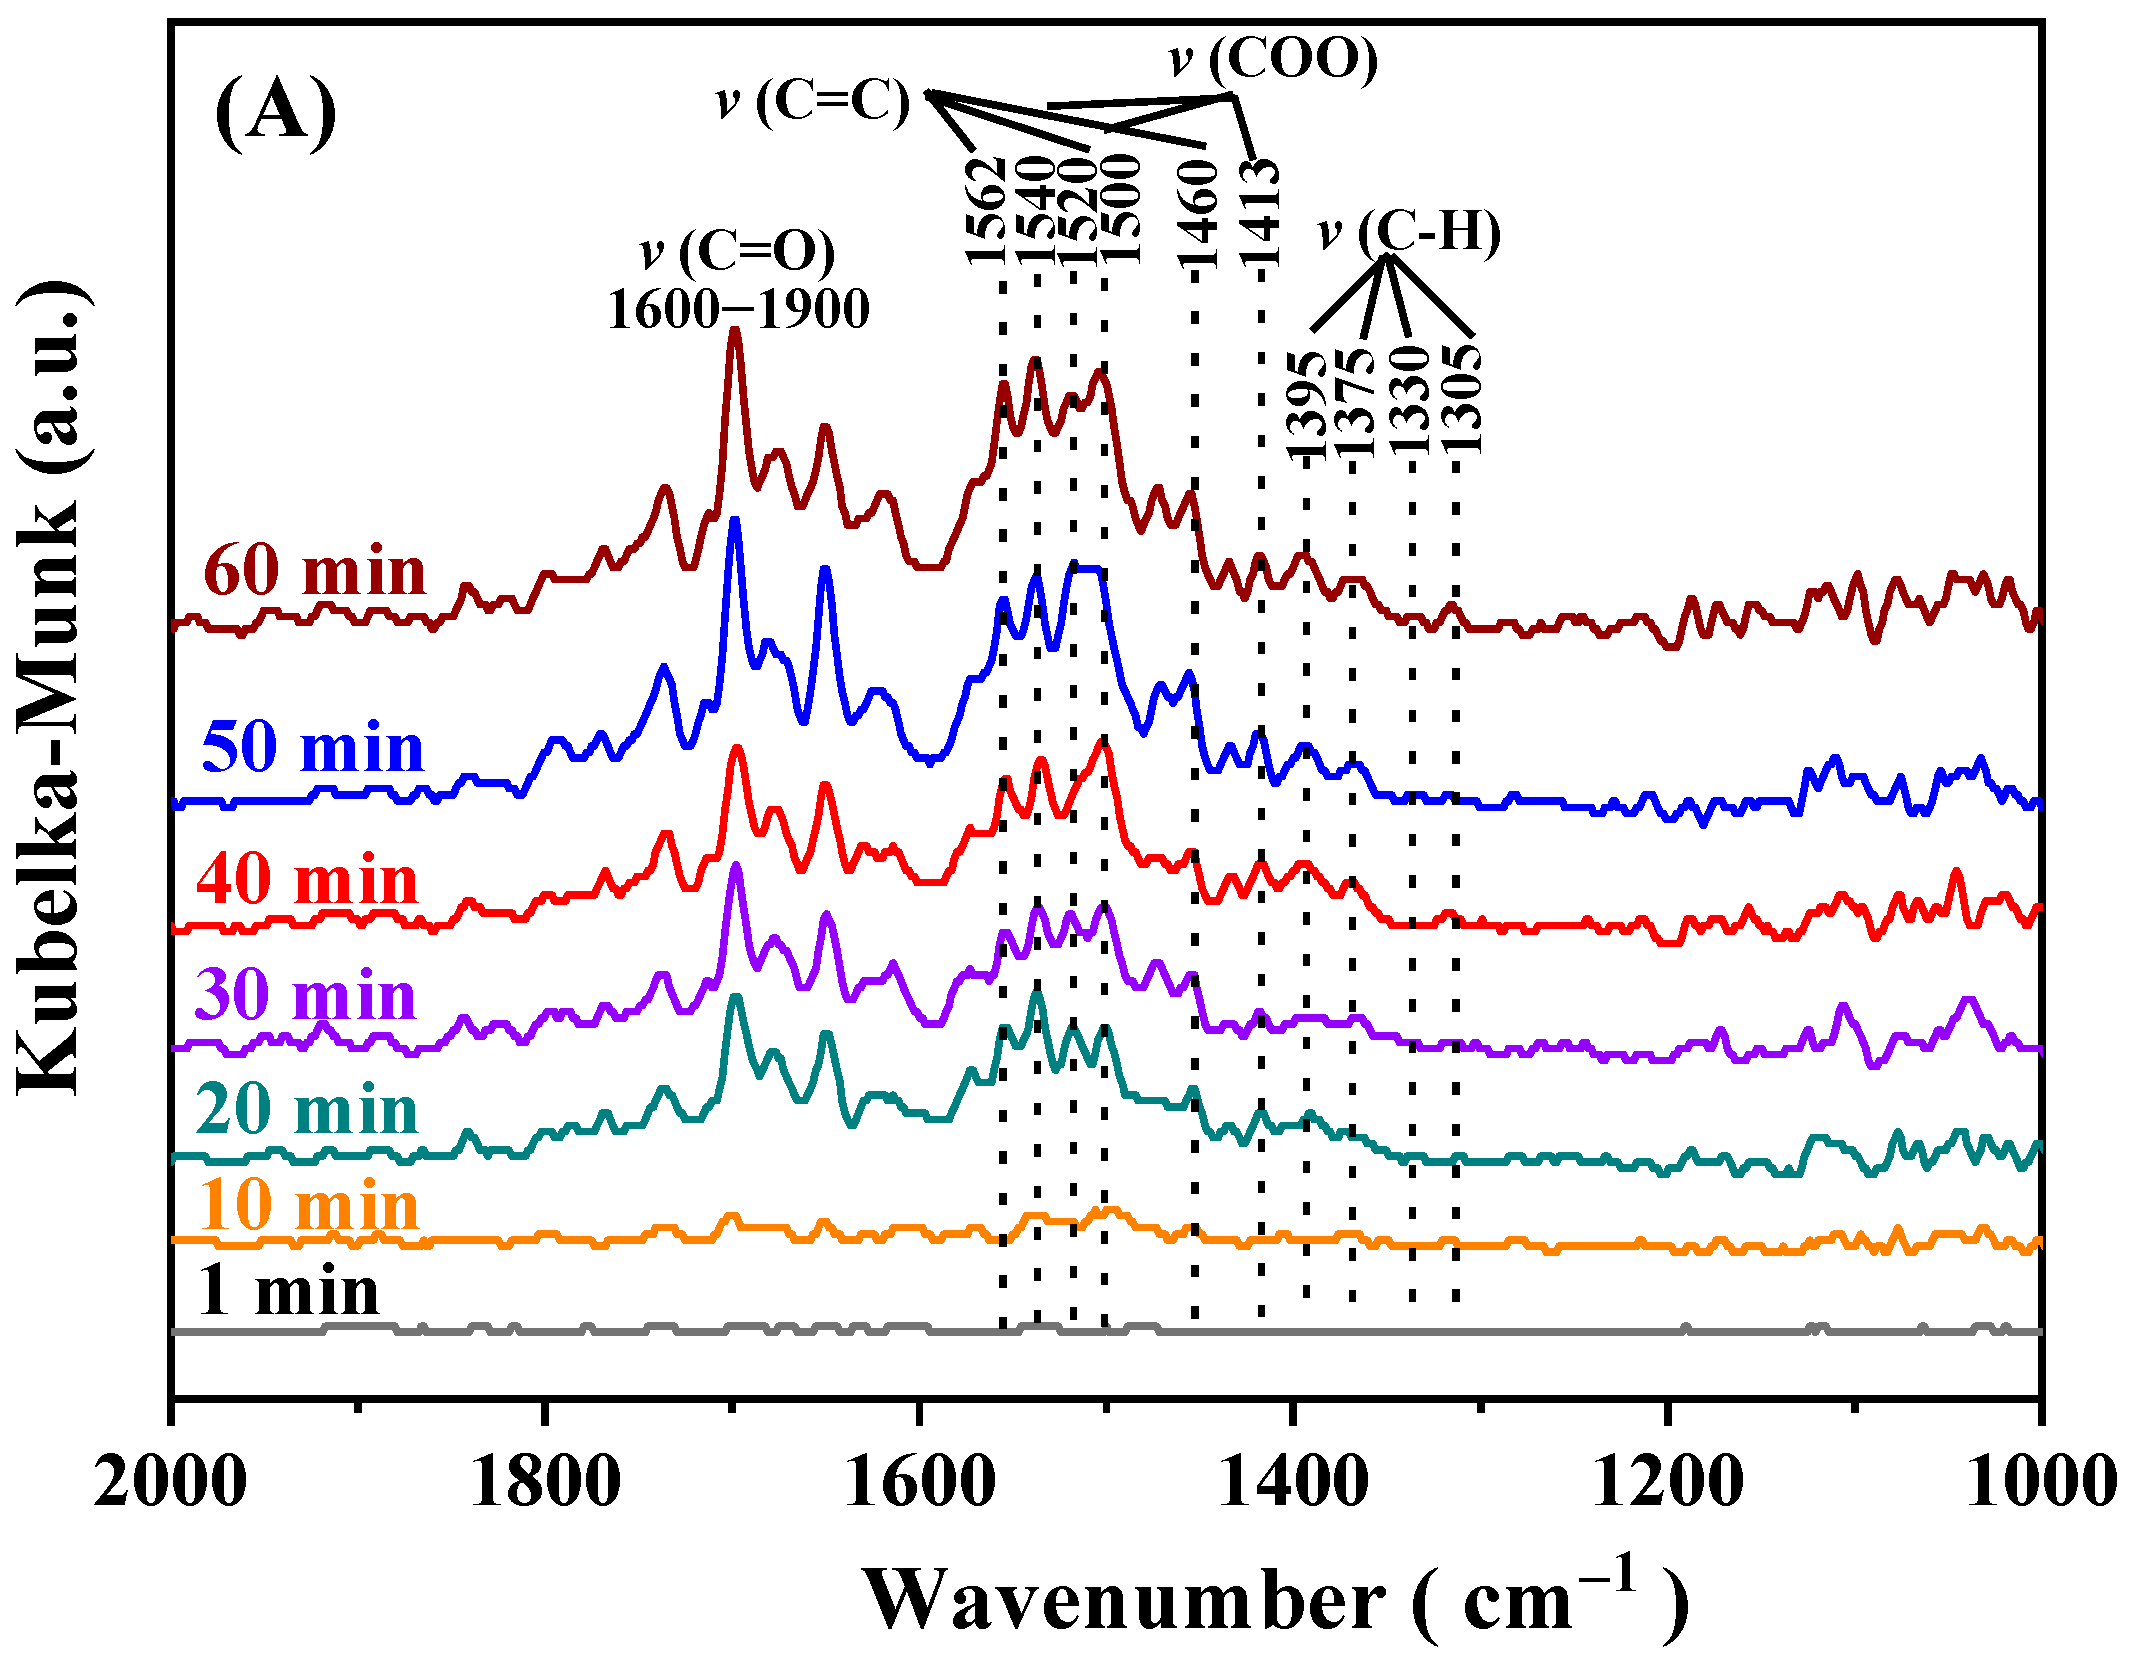
The in situ DRIFTS technique was used to study the intermediate species formed during the toluene oxidation process over 0.47Pd-0.46Pt/α-MnO2. Before the experiment, the 0.47Pd-0.46Pt/α-MnO2 sample was first pretreated in a N2 flow at 400 °C for 1 h and then cooled to room temperature. Figure 11A shows the adsorption of toluene on 0.47Pd-0.46Pt/α-MnO2 at 150 °C. When the reaction time increased, toluene was rapidly adsorbed on the surface of the sample. A number of absorption bands appeared: the wide bands in the range of 1600–1900 cm−1 were due to the characteristic vibration of the C=O bond, indicating the formation of benzaldehyde (C6H5-CHO) species [49,50]. The tensile vibration bands at 1413, 1520, and 1540 cm−1 belonged to the formate (-COO) species, the ones at 1460, 1500, and 1562 cm−1 were attributed to the υ(C=C) vibration of the aromatic ring skeleton [51,52], and the ones at 1305, 1330, 1375, and 1395 cm−1 were due to the vibration of the -CH2 group, which originated from the cleavage of the CH3 group in toluene to form a benzyl group (C6H5-CH2) [53]. The above results indicate that toluene can still be adsorbed on the sample surface and form a series of intermediate products in the O2-free atmosphere, which might be ascribed to the Oads species on the sample surface that would lead to high catalytic activity for toluene oxidation.
Compared with the in situ DRIFTS spectrum of toluene adsorption, Figure 11B shows the oxidation of toluene over 0.47Pd-0.46Pt/α-MnO2 at different temperatures. With the rise in temperature, the intensity of all of the bands increased, which indicates that toluene decomposes faster at an elevated temperature and the intermediate desorbs faster. When the temperature rose to 170 °C, the intensity of the characteristic bands increased significantly, indicating that toluene was clearly oxidized. For example, bands in the range of 1600–1900 cm−1 and at 1413, 1520, and 1540 cm−1 were detected, which indicates the rapid formation of benzaldehyde and benzoate species. This result confirms that benzaldehyde and benzoate species are the key intermediates formed in the catalytic oxidation of toluene. When the temperature reached 180 °C, the intensity of all of the characteristic bands began to decrease, which means that the intermediate species are rapidly transformed at this temperature and do not accumulate on the sample surface. Finally, when the temperature rose to 190 °C, all of the bands almost disappeared, indicating that toluene was completely converted into CO2 and H2O.
In order to investigate the effect of SO2 introduction on the catalytic oxidation of toluene, which is the cause of the partial deactivation of a catalyst, we recorded the in situ DRIFTS spectra of toluene oxidation over 0.47Pd-0.46Pt/α-MnO2 in the presence of 75 ppm SO2. As shown in Figure 11C, when SO2 was introduced, several new bands were detected at 1150 and 1058 cm−1, which were due to the formation of sulfate species on the sample [54]. As the reaction temperature increases, characteristic bands related to toluene begin to appear, but it is clear that the intensity of the characteristic bands due to toluene at the same temperature is lower than that of the bands in the absence of SO2, and the intensity of the bands due to the sulfate species gradually increases with the reaction. This result reveals that SO2 is oxidized into sulfates, which blocks the active sites and affects the contact between toluene and oxygen species on the catalyst surface, thereby inhibiting the oxidation of toluene. The intensity of the bands due to the sulfate species is not weakened with the rise in temperature. On the contrary, a strong band appears in the range of 1000–1300 cm−1, which is attributed to either surface or bulk sulfates [55], and its intensity increases with the extension in adsorption time. The sulfate species on the sample surface combined with the Mn species to form the manganese sulfate species. According to the literature [56], the decomposition of metal sulfate species requires a temperature higher than 700 °C, which is consistent with the TG results (Figure S5B). Therefore, when the temperature was 220 °C, the metal sulfate species were stable and could not be decomposed, resulting in an irreversible deactivation of the catalyst.
Based on the above analysis of the in situ DRIFTS spectra, we can preliminarily propose a possible route of toluene oxidation over 0.47Pd-0.46Pt/α-MnO2, as shown in Scheme 1. Initially, toluene was first adsorbed on the upper surface of the sample and then rapidly dehydrogenated to generate intermediates, such as benzoate and benzaldehyde. When the temperature was higher than 150 °C, the adsorbed benzoate and benzaldehyde intermediates began to further be rapidly oxidized by the surface Oads species, and the Oads species were supplemented by gas-phase oxygen. Finally, the benzoate and benzaldehyde intermediates were converted into CO2 and H2O.

3. Experimental Section

3.1. Catalyst Preparation

3.1.1. Synthesis of α-MnO2

The α-MnO2 used in this study was prepared using the hydrothermal method. An aqueous KMnO4 solution was added to an aqueous MnSO4·H2O solution, which turned brown and was stirred for 2 h. The mixed aqueous solution was poured into an autoclave with a polytetrafluoroethylene inner liner and hydrothermally treated at 165 °C for 24 h. The resulting wet solids were filtered, washed with deionized water, and dried at 80 °C overnight. The dried sample was placed in a muffle furnace and calcined in air at 400 °C for 2 h, thus obtaining the α-MnO2 support.

3.1.2. Preparation of xPd-yPt/α-MnO2

The xPd-yPt/α-MnO2 samples were prepared using polyvinyl alcohol (PVA) as the protecting agent and NaBH4 as the reducing agent. The preparation steps were as follows: in an ice-water bath, a certain amount (50 mL) of aqueous solution of PVA (precious metal/PVA mass ratio = 1.5:1.0) mixed with 0, 2.5, 5.0, 10.0, and 10.0 mg of Pd(NO3)2·2H2O and 10.0, 2.5, 5.0, 10.0, and 0 mg Pt(NO3)2 was added into a beaker, and after vigorous stirring for 30 min, the NaBH4 aqueous solution (precious metal/NaBH4 molar ratio = 1.0:5.0) was rapidly injected and further stirred for 1 h under the condition of light avoidance to obtain the Pd-Pt composite solution. Then, 1.0 g of α-MnO2 was added to the above Pd-Pt composite solution and stirring was continued for 6 h (the theoretical Pd loadings (x) were 0, 0.25, 0.50, 1.00, and 1.00 wt%, respectively; the theoretical Pt loadings (y) were 1.00, 0.25, 0.50, 1.00, and 0 wt%, respectively). The samples were washed twice with deionized water and anhydrous ethanol, respectively, and then dried in an oven at 80 °C for 12 h. Finally, the obtained samples were kept in a muffle furnace at 400 °C for 2 h to obtain the xPd-yPt/α-MnO2 samples. The results of the inductively coupled plasma–atomic emission spectroscopy (ICP-AES) characterization show that the actual Pd loadings (x) in these samples are 0, 0.23, 0.47, 0.93, and 0.92 wt%, respectively, and the actual Pt loadings (y) are 0.91, 0.21, 0.46, 0.89, and 0 wt%, respectively. That is to say, the as-obtained catalysts were 0.92Pd/α-MnO2, 0.91Pt/α-MnO2, 0.23Pd-0.21Pt/α-MnO2, 0.47Pd-0.46Pt/δ-MnO2, and 0.93Pd-0.89Pt/α-MnO2. It should be noted, however, that due to the difference in amount of Pt and Pd NPs reduced from Pd(NO3)2·2H2O and Pt(NO3)2 and the difference in adsorption ability of Pt and Pd NPs on α-MnO2, the actual Pt and Pd loadings measured using the ICP technique were slightly different from the theoretical loadings of Pt and Pd NPs.

3.2. Catalyst Characterization

The physicochemical properties of the catalysts were characterized using the techniques of ICP–AES, X-ray diffraction (XRD), nitrogen adsorption–desorption (BET), scanning electron microscopy (SEM), transmission electron microscopy (TEM), high-angle annular dark field–scanning transmission electron microscopy (HAADF-STEM), X-ray photoelectron spectroscopy (XPS), hydrogen temperature-programmed reduction (H2-TPR), thermogravimetry (TG), and in situ diffuse reflectance infrared Fourier transform spectra (in situ DRIFTS). The detailed characterization procedures are stated in the Supplementary Material.

3.3. Catalytic Evaluation

The catalytic activities of the samples were measured in a continuous-flow fixed-bed quartz microreactor (i.d. = 4 mm) at ambient pressure. A total of 50 mg of the sample with a particle size of 40–60 mesh was well mixed with 250 mg of quartz sand (40–60 mesh) to avoid hotspots. Prior to the measurement, the sample was pretreated in an air flow of 40 mL/min at 250 °C for 1 h. After being cooled to a given temperature, the toluene-containing reactant gas mixture was passed through the catalyst bed. The reactant mixture was (1000 ppm toluene + 20 vo% O2 + N2 (balance)), the total flow rate was 50 mL/min, and the space velocity (SV) was 60,000 mL/(g h). The amounts of 1000, 3000, and 5000 ppm toluene were generated by passing a N2 flow through a pure toluene-containing bottle that was chilled in an isothermal bath at 0, 19, and 28 °C, respectively. The N2 flow rates (39, 78 or 156 mL/min) were altered to change the SV (60,000, 120,000 or 240,000 mL/(g·h)). In the case of water vapor introduction, 1.0, 3.0, and 5.0 vol% water vapor were introduced by passing a N2 flow of 5.3, 10.7, and 13.1 mL/min and a total reactant flow of 50 mL/min through a water saturator at 25, 34, and 50 °C, respectively. The reactants and products were analyzed online on a gas chromatograph (GC7900, Shanghai Tianmei Scientific Instrument Company Ltd., Shanghai, China) equipped with a flame ionization detector (FID) and a TCD, using a stabilwax@-DA column (30 m in length) and a 1/8 in Carboxen 1000 column (3 m in length). The balance of carbon throughout the investigation was estimated to be 99.5%. The toluene conversion was calculated using the following formula: (cinletcoutlet)/cinlet × 100%, where cinlet and coutlet represent the toluene concentration in the inlet and outlet of the microreactor, respectively.

4. Conclusions

Herein, xPd-yPt/α-MnO2 catalysts were prepared using the PVA-protected NaBH4 reduction method, and their catalytic activities for toluene oxidation and water and sulfur dioxide resistance were investigated. The 0.93Pd-0.89Pt/α-MnO2 sample exhibited the best catalytic activity (T90% = 156 °C, rcat = 6.34 × 10⁻⁴ molToluene/(gcat s), and Ea = 31.9 kJ/mol), which was significantly better than that of the supported single-noble-metal samples, and slightly better than that of 0.47Pd-0.46Pt/α-MnO2 (T90% = 165 °C). The loading of Pd-Pt bimetal on α-MnO2 improved the adsorption and activation of oxygen, increased the Mn3+/Mn4+ and Oads/Olatt molar ratios, and, hence, enhanced the catalytic activity. Moreover, the 0.47Pd-0.46Pt/α-MnO2 sample showed good hydrothermal stability and good resistance to water vapor and SO2. The coverage of the active sites in the samples by sulfate species was the main reason for the partial deactivation of the catalysts. Benzaldehyde and benzoate were important intermediates in the oxidation of toluene.

Supplementary Materials

The following supporting information can be downloaded at https://www.mdpi.com/article/10.3390/catal15080746/s1, Figure S1: Arrhenius plots for toluene oxidation over the α-MnO2, 0.92Pd/α-MnO2, 0.91Pt/α-MnO2, and xPd-yPt/α-MnO2 samples at SV = 60,000 mL/(g h). Figure S2: (A) Nitrogen adsorption–desorption isotherms and (B) pore size distributions of (a) α-MnO2, (b) 0.92Pd/α-MnO2, (c) 0.91Pt/α-MnO2, (d) 0.23Pd-0.21Pt/α-MnO2, (e) 0.47Pd-0.46Pt/α-MnO2, and (f) 0.93Pd-0.89Pt/α-MnO2. Figure S3: HAADF-STEM images and EDS elemental mappings of the 0.47Pd-0.46Pt/α-MnO2 sample. Figure S4: Effects of 40, 75, or 100 ppm SO2 on the catalytic activity of the 0.47Pd-0.46Pt/α-MnO2 sample for toluene oxidation at SV = 60,000 mL/(g h). Figure S5: (A) XRD patterns, (B) TG profiles, (C) nitrogen adsorption–desorption isotherms, and (D) pore size distributions of the (a) fresh and (b) used 0.47Pd-0.46Pt/α-MnO2-S samples after SO2 poisoning. Figure S6: SEM images of the (a) fresh and (b) used 0.47Pd-0.46Pt/α-MnO2-S samples after SO2 poisoning. Figure S7: H2-TPR profiles of the (a) fresh and (b) used 0.47Pd-0.46Pt/α-MnO2-S samples after SO2 poisoning. Figure S8: Toluene oxidation rate at 160 °C as a function of (A) Mn3+/Mn4+ or (B) Oads/Olatt molar ratio of the samples. Figure S9: Noble particle size distributions of (a) 0.92Pd/α-MnO2, (b) 0.91Pt/α-MnO2, (c) 0.23Pd-0.21Pt/α-MnO2, (d) 0.47Pd-0.46Pt/α-MnO2, and (e) 0.93Pd-0.89Pt/α-MnO2. Table S1: Deconvolution parameters of the Pt 4f XPS spectra of the samples. Table S2: Deconvolution parameters of the Pd 3d XPS spectra of the samples. Table S3: Deconvolution parameters of the Mn 2p XPS spectra of the samples. Table S4: Deconvolution parameters of the O 1s XPS spectra of the samples.

Author Contributions

Conceptualization, N.D., W.W., X.Z., H.L., J.Z., Q.Y. and H.D.; Methodology, N.D., W.W., X.Z., H.L., J.Z., Q.Y. and H.D.; Formal Analysis, N.D., W.W. and X.Z.; Investigation, W.W., X.Z., H.L. and J.Z.; Resources, N.D., Q.Y. and H.D.; Writing—Original Draft Preparation, N.D. and W.W.; Writing—Review Editing, Q.Y. and H.D.; Visualization, X.Z., H.L. and J.Z.; Supervision, Q.Y. and H.D.; Funding Acquisition, Q.Y. All authors have read and agreed to the published version of the manuscript.

Funding

This work was financially supported by the National Key R&D Program of China (2022YFB3506200) and the National Natural Science Foundation of China (21806005).

Institutional Review Board Statement

Not applicable.

Informed Consent Statement

Not applicable.

Data Availability Statement

Data are contained within the article and Supplementary Materials.

Conflicts of Interest

Author Ning Dong was employed by the company Beijing Huaneng Yangtze Environmental Technology Research Institute Co., Ltd., Beijing, China. The remaining authors declare that the research was conducted in the absence of any commercial or financial relationships that could be construed as a potential conflict of interest.

References

  1. Yi, J.; Liu, J.; Gao, B.; Bo, L.; Cao, L.; Sillanpää, M. The comprehensive review of catalysts for catalytic oxidation of volatile organic compounds. J. Environ. Chem. Eng. 2025, 13, 115691. [Google Scholar] [CrossRef]
  2. He, C.Q.; Zou, Y.; Lv, S.J.; Flores, R.M.; Yan, X.L.; Deng, T.; Deng, X.J. The importance of photochemical loss to source analysis and ozone formation potential: Implications from in-situ observations of volatile organic compounds (VOCs) in Guangzhou, China. Atmos. Environ. 2024, 320, 120320. [Google Scholar] [CrossRef]
  3. Feng, Y.; Yang, C.; Cao, X. Intermediate volatile organic compounds in Canadian residential air in winter: Implication to indoor air quality. Chemosphere 2023, 328, 138567. [Google Scholar] [CrossRef]
  4. Zheng, H.; Chang, X.; Wang, S.; Li, S.; Yin, D.; Zhao, B.; Huang, G.; Huang, L.; Jiang, Y.; Dong, Z.; et al. Trends of full-volatility organic emissions in China from 2005 to 2019 and their organic aerosol formation potentials. Environ. Sci. Technol. Lett. 2023, 10, 137–144. [Google Scholar] [CrossRef]
  5. He, L.; Duan, Y.; Zhang, Y.; Yu, Q.; Huo, J.; Chen, J.; Cui, H.; Li, Y.; Ma, W. Effects of VOC emissions from chemical industrial parks on regional O3-PM2.5 compound pollution in the Yangtze River Delta. Sci. Total. Environ. 2024, 906, 167503. [Google Scholar] [CrossRef]
  6. Li, L.; Zhang, D.; Hu, W.; Yang, Y.; Zhang, S.; Yuan, R.; Lv, P.; Zhang, W.; Zhang, Y.; Zhang, Y. Improving VOC control strategies in industrial parks based on emission behavior, environmental effects, and health risks: A case study through atmospheric measurement and emission inventory. Sci. Total. Environ. 2023, 865, 161235. [Google Scholar] [CrossRef] [PubMed]
  7. Ren, Y.; Dong, C.; Song, C.; Qu, Z. Spinel-based catalysts that enable catalytic oxidation of volatile organic compounds. Environ. Sci. Technol. 2024, 58, 20785–20811. [Google Scholar] [CrossRef] [PubMed]
  8. Fang, Y.; Yang, J.; Pan, C. The surface/interface modulation of platinum group metal (PGM)-free catalysts for VOCs and CO catalytic oxidation. ACS Appl. Mater. Interfaces 2024, 16, 37379–37389. [Google Scholar] [CrossRef]
  9. Sun, K.; Kong, F.; Gong, X.; Shi, Y.; Jin, D.; Jin, H.; Guo, X.; Zhou, R. Hierarchical porous S-1 zeolite supported Pt catalyst for catalytic oxidation of various VOCs at low temperature with strong water resistance and excellent stability. Appl. Catal. A 2025, 699, 120284. [Google Scholar] [CrossRef]
  10. Guo, Y.; Wen, M.; Li, G.; An, T. Recent advances in VOC elimination by catalytic oxidation technology onto various nanoparticles catalysts: A critical review. Appl. Catal. B 2021, 281, 119447. [Google Scholar] [CrossRef]
  11. Gong, P.; He, F.; Xie, J.; Fang, D. Catalytic removal of toluene using MnO2-based catalysts: A review. Chemosphere 2023, 318, 137938. [Google Scholar] [CrossRef]
  12. Lu, T.; Zhang, C.; Du, F.; Zhang, C.; Zhang, R.; Liu, P.; Li, J. Mutual inhibition effects on the synchronous conversion of benzene, toluene, and xylene over mnox catalysts. J. Colloid Interface Sci. 2023, 641, 791–802. [Google Scholar] [CrossRef]
  13. Xiang, W.; Liu, W.; Liu, G.; He, Y.; Yang, S.; Chen, X.; Song, Z.; Zhang, X.; Tsubaki, N. Decoding the role of oxygen defects in MnO2-based catalysts for enhanced VOCs oxidation. Mater. Today Chem. 2025, 44, 102604. [Google Scholar] [CrossRef]
  14. Nguyen, D.M.T.; Nguyen, C.C.; Thi, P.N.H.; Nguyen, P.H.D.; Van, L.Q.; Kim, S.Y.; Nguyen-Dinh, L. Tailoring oxygen vacancies and active surface oxygen species in copper-doped MnO2 catalysts for total catalytic oxidation of VOCs. Ind. Eng. Chem. Res. 2023, 62, 6908–6919. [Google Scholar] [CrossRef]
  15. Bai, B.; Huang, Y.; Chen, J.; Lei, J.; Wang, S.; Wang, J. Ultrathin MnO2 with strong lattice disorder for catalytic oxidation of volatile organic compounds. J. Colloid Interface Sci. 2024, 653, 1205–1216. [Google Scholar] [CrossRef] [PubMed]
  16. Cai, B.; Lin, F.; Guo, X.; Li, Y. Catalytic acetone oxidation over mnox catalysts: Regulating their crystal structures and surface properties. Processes 2024, 12, 326. [Google Scholar] [CrossRef]
  17. Li, J.; Zhu, D.; Di, S.; Xu, L.; Wu, Z.; Yao, S. Construction of Pt-MnO2 interface with strong electron coupling effect for plasma catalytic oxidation of aromatic VOCs. Colloids Surf. A 2023, 665, 131248. [Google Scholar] [CrossRef]
  18. Ru, X.; Li, W.; Wang, X.; Shi, Z.; Wen, X.; Mo, S.; Zhang, Q.; Mo, D. Regulating the surface local environment of MnO2 materials via metal-support interaction in Pt/MnO2 hetero-catalysts for boosting methanol oxidation. Chem. Eng. Sci. 2023, 281, 119079. [Google Scholar] [CrossRef]
  19. Xia, Y.; Xia, L.; Liu, Y.; Yang, T.; Deng, J.; Dai, H. Concurrent catalytic removal of typical volatile organic compound mixtures over Au-Pd/α-MnO2 nanotubes. J. Environ. Sci. 2018, 64, 276–288. [Google Scholar] [CrossRef]
  20. Zhang, H.; Jin, M.; Xia, Y. Enhancing the catalytic and electrocatalytic properties of Pt-based catalysts by forming bimetallic nanocrystals with Pd. Chem. Soc. Rev. 2012, 41, 8035–8049. [Google Scholar] [CrossRef]
  21. Liao, F.; Lo, T.W.B.; Tsang, S.C.E. Recent developments in palladium-based bimetallic catalysts. ChemCatChem 2015, 7, 1998–2014. [Google Scholar] [CrossRef]
  22. Rosseler, O.; Ulhaq-Bouillet, C.; Bonnefont, A.; Pronkin, S.; Savinova, E.; Louvet, A.; Keller, V.; Keller, N. Structural and electronic effects in bimetallic PdPt nanoparticles on TiO2 for improved photocatalytic oxidation of CO in the presence of humidity. Appl. Catal. B 2015, 166, 381–392. [Google Scholar] [CrossRef]
  23. Kim, S.; Im, M.; Cho, E.; Jang, H.; Jang, S.Y.; Kim, D.W.; Kim, K.W.; Heo, I.; Kim, Y.J.; Lee, J.H. Effects of thermal aging on the electronic and structural properties of Pt-Pd and toluene oxidation activity. Sci. Total. Environ. 2022, 847, 157482. [Google Scholar] [CrossRef] [PubMed]
  24. Taheri, A.; Hamzehlouyan, T. Effect of hydrothermal aging on CO and C3H6 oxidation over a Pt-Pd-based wiremesh catalyst as a motorcycle aftertreatment device. Appl. Catal. A 2023, 656, 119128. [Google Scholar] [CrossRef]
  25. Liu, X.; Zhang, Q.; Ning, P.; Tang, T.; Hu, J.; Su, W. One-pot synthesis of mesoporous Al2O3-supported Pt-Pd catalysts for toluene combustion. Catal. Commun. 2018, 115, 26–30. [Google Scholar] [CrossRef]
  26. Li, X.; Liu, Y.; Deng, J.; Xie, S.; Zhao, X.; Zhang, Y.; Zhang, K.; Arandiyan, H.; Guo, G.; Dai, H. Enhanced catalytic performance for methane combustion of 3Dom CoFe2O4 by co-loading MnO and Pd-Pt alloy nanoparticles. Appl. Surf. Sci. 2017, 403, 590–600. [Google Scholar] [CrossRef]
  27. Fu, X.; Liu, Y.; Deng, J.; Jing, L.; Zhang, X.; Zhang, K.; Han, Z.; Jiang, X.; Dai, H. Intermetallic compound PtMny-derived Pt-MnOx supported on mesoporous CeO2: Highly efficient catalysts for the combustion of toluene. Appl. Catal. A 2020, 595, 117509. [Google Scholar] [CrossRef]
  28. Yang, Y.; Wang, G.; Zheng, P.; Dang, F.; Han, J. Carbon deposits during catalytic combustion of toluene on Pd-Pt-based catalysts. Catal. Sci. Technol. 2020, 1, 2452–2461. [Google Scholar] [CrossRef]
  29. Li, Y.; Xiao, L.; Liu, F.; Dou, Y.; Liu, S.; Fan, Y.; Cheng, G.; Song, W.; Zhou, J. Core-shell structure Ag@Pd nanoparticles supported on layered MnO2 substrate as toluene oxidation catalyst. J. Nanoparticle Res. 2019, 21, 28. [Google Scholar] [CrossRef]
  30. Pei, W.; Liu, Y.; Deng, J.; Zhang, K.; Hou, Z.; Zhao, X.; Dai, H. Partially embedding Pt nanoparticles in the skeleton of 3DOM Mn2O3: An effective strategy for enhancing catalytic stability in toluene combustion. Appl. Catal. B 2019, 256, 117814. [Google Scholar] [CrossRef]
  31. Zhang, Q.; Su, W.; Ning, P.; Liu, X.; Wang, H.; Hu, J. Catalytic performance and mechanistic study of toluene combustion over the Pt-Pd-HMS catalyst. Chem. Eng. Sci. 2019, 205, 230–237. [Google Scholar] [CrossRef]
  32. Hao, Y.; Chen, S.; Wang, H.; Chen, R.; Sun, P.; Chen, T. Platinum nanoparticles supported on hierarchically porous aluminosilicate nanospheres for low-temperature catalytic combustion of volatile organic compounds. ACS Appl. Nano Mater. 2020, 3, 8472–8482. [Google Scholar] [CrossRef]
  33. Jafarihaghighi, F.; Payan, A.; Soltan, J. Unraveling the role of support in the catalytic performance of α-MnO2 for enhanced O3-assisted VOC decomposition: Influence of operational parameters, catalytic synergies, and stability. Colloid Surf. A 2025, 718, 136922. [Google Scholar] [CrossRef]
  34. Wu, S.; Yuan, C.; Huang, Z.; Xu, H.; Shen, W. Engineering Mn-O strength in manganese oxide catalyst to enhance propane catalytic oxidation. Chem. Eng. J. 2024, 479, 147928. [Google Scholar] [CrossRef]
  35. Xing, X.; Wang, Y.; Hao, M.; Li, Z.; Liu, D.; Yan, K. Simultaneous catalytic oxidation of benzene and toluene over Pd-CeZrOx catalysts. Atmosphere 2024, 15, 1301. [Google Scholar] [CrossRef]
  36. Lu, Y.; Deng, H.; Zhang, X.; Ding, J.; Bai, S.; Wang, L.; He, H. Tuning Pt-TiO2 interactions to switch inhibition to synergy in toluene–acetone mixture combustion. Environ. Sci. Technol. 2025, 59, 11875–11884. [Google Scholar] [CrossRef] [PubMed]
  37. Cheng, Y.; Liu, C.; Yi, C. Construction of CeO2/δ-MnO2 heterojunction for photothermal catalysis of toluene. Appl. Surf. Sci. 2025, 686, 162009. [Google Scholar] [CrossRef]
  38. He, J.; Chen, D.; Li, N.; Xu, Q.; Li, H.; He, J.; Lu, J. Pt-Pd bimetallic nanoparticles anchored on uniform mesoporous MnO2 sphere as an advanced nanocatalyst for highly efficient toluene oxidation. Green Energy Environ. 2022, 7, 1349–1360. [Google Scholar] [CrossRef]
  39. Zhang, X.; Chen, D.; Liang, C.; Shen, B. Water poisoning and resistance in catalytic oxidation of VOCs from industrial flue gas. Fuel Process. Technol. 2025, 273, 108231. [Google Scholar] [CrossRef]
  40. Chen, Y.; Yao, K.; Zhang, X.; Shen, B.; Smith, R.L.; Guo, H. Siloxane-modified mnox catalyst for oxidation of coal-related o-xylene in presence of water vapor. J. Hazard. Mater. 2022, 436, 129109. [Google Scholar] [CrossRef]
  41. Qin, Y.; Liu, X.; Zhu, T.; Zhu, T. Catalytic oxidation of ethyl acetate over silver catalysts supported on CeO2 with different morphologies. Mater. Chem. Phys. 2019, 229, 32–38. [Google Scholar] [CrossRef]
  42. Yang, K.; Liu, Y.; Deng, J.; Zhao, X.; Yang, J.; Han, Z.; Hou, Z.; Dai, H. Three-dimensionally ordered mesoporous iron oxide-supported single-atom platinum: Highly active catalysts for benzene combustion. Appl. Catal. B 2019, 244, 650–659. [Google Scholar] [CrossRef]
  43. Xie, S.; Dai, H.; Deng, J.; Yang, H.; Han, W.; Arandiyan, H.; Guo, G. Preparation and high catalytic performance of Au/3DOM Mn2O3 for the oxidation of carbon monoxide and toluene. J. Hazard. Mater. 2014, 279, 392–401. [Google Scholar] [CrossRef]
  44. Guo, M.; Zhao, P.; Liu, Q.; Liu, C.; Han, J.; Ji, N.; Song, C.; Ma, D.; Lu, X.; Liang, X.; et al. Improved low-temperature activity and H2O resistance of Fe-doped Mn-Eu catalysts for no removal by NH3-SCR. ChemCatChem 2019, 11, 4954–4965. [Google Scholar] [CrossRef]
  45. Li, L.; Zhang, Y.; Wang, X.; Lu, J.; Feng, J.; Zhao, S.; Qiu, W.; Huang, Z.; Lin, H. Directional induction of hydrogen spillover enhancing H2O resistance of Ca-Ni-based dual-function materials for integrated CO2 capture and in-situ methanation. Chem. Eng. J. 2025, 505, 159691. [Google Scholar] [CrossRef]
  46. Feng, C.; Liu, X.; Zhu, T.; Hu, Y.; Tian, M. Catalytic oxidation of Co over Pt/TiO2 with low Pt loading: The effect of H2O and SO2. Appl. Catal. A 2021, 622, 118218. [Google Scholar] [CrossRef]
  47. Zhang, L.; Li, L.; Cao, Y.; Yao, X.; Ge, C.; Gao, F.; Deng, Y.; Tang, C.; Dong, L. Getting insight into the influence of SO2 on TiO2/CeO2 for the selective catalytic reduction of NO by NH3. Appl. Catal. B 2015, 165, 589–598. [Google Scholar] [CrossRef]
  48. Zhang, B.; Yang, Y.; Zheng, J.; Zhang, D.; Chen, W.; Yuan, W.; Chen, X.; Liu, R.; Chen, B.; Li, L.; et al. Diverse effects of SO2-induced Pt-O-SO3 on the catalytic oxidation of C3H6 and C3H8. Environ. Sci. Technol. 2024, 58, 18020–18032. [Google Scholar] [CrossRef] [PubMed]
  49. Uz Zaman, M.W.; Phule, A.D.; Senthamaraikannan, T.G.; Kim, S.Y.; Elkaee, S.; Yang, J.H.; Lim, D. Design of bifunctional nitrogen-doped biochar with adsorption and catalytic oxidation capabilities for enhanced toluene emission control. Environ. Res. 2025, 269, 120867. [Google Scholar] [CrossRef]
  50. Zhang, M.; Zou, S.; Mo, S.; Zhong, J.; Chen, D.; Ren, Q.; Fu, M.; Chen, P.; Ye, D. Enhancement of catalytic toluene combustion over Pt–Co3O4 catalyst through in-situ metal-organic template conversion. Chemosphere 2021, 262, 127738. [Google Scholar] [CrossRef] [PubMed]
  51. Liu, J.; Yang, L.; Dai, Z.; Jiang, W.; Ma, S.; Yao, L.; Chen, Y.; Zhou, Q.; Zheng, J. Zeolite-induced defect engineering for synthesis of cubtc-derived novel carbon-zeolite bifunctional support catalyst for multicomponent VOCs catalytic oxidation removal. Chem. Eng. J. 2024, 500, 156830. [Google Scholar] [CrossRef]
  52. Yang, X.; Yu, X.; Jing, M.; Song, W.; Liu, J.; Ge, M. Defective mnxzr1-XO2 solid solution for the catalytic oxidation of toluene: Insights into the oxygen vacancy contribution. ACS Appl. Mater. Interfaces 2019, 11, 730–739. [Google Scholar] [CrossRef]
  53. Lai, Y.T.; Chen, T.C.; Lan, Y.K.; Chen, B.S.; You, J.H.; Yang, C.M.; Lai, N.C.; Wu, J.H.; Chen, C.S. Pt/SBA-15 as a highly efficient catalyst for catalytic toluene oxidation. ACS Catal. 2014, 4, 3824–3836. [Google Scholar] [CrossRef]
  54. Huo, Y.; Liu, K.; Liu, J.; He, H. Effects of SO2 on standard and fast SCR over CeWo: A quantitative study of the reaction pathway and active sites. Appl. Catal. B 2022, 301, 120784. [Google Scholar] [CrossRef]
  55. Kwon, D.W.; Kim, D.H.; Lee, S.; Kim, J.; Ha, H.P. A dual catalytic strategy by the nature of the functionalization effect as well as active species on vanadium-based catalyst for enhanced low temperature SCR. Appl. Catal. B 2021, 289, 120032. [Google Scholar] [CrossRef]
  56. Gao, F.; Tang, X.; Yi, H.; Li, J.; Zhao, S.; Wang, J.; Chu, C.; Li, C. Promotional mechanisms of activity and SO2 tolerance of Co- or Ni-doped MnOx-CeO2 catalysts for SCR of NOx with NH3 at low temperature. Chem. Eng. J. 2017, 317, 20–31. [Google Scholar] [CrossRef]
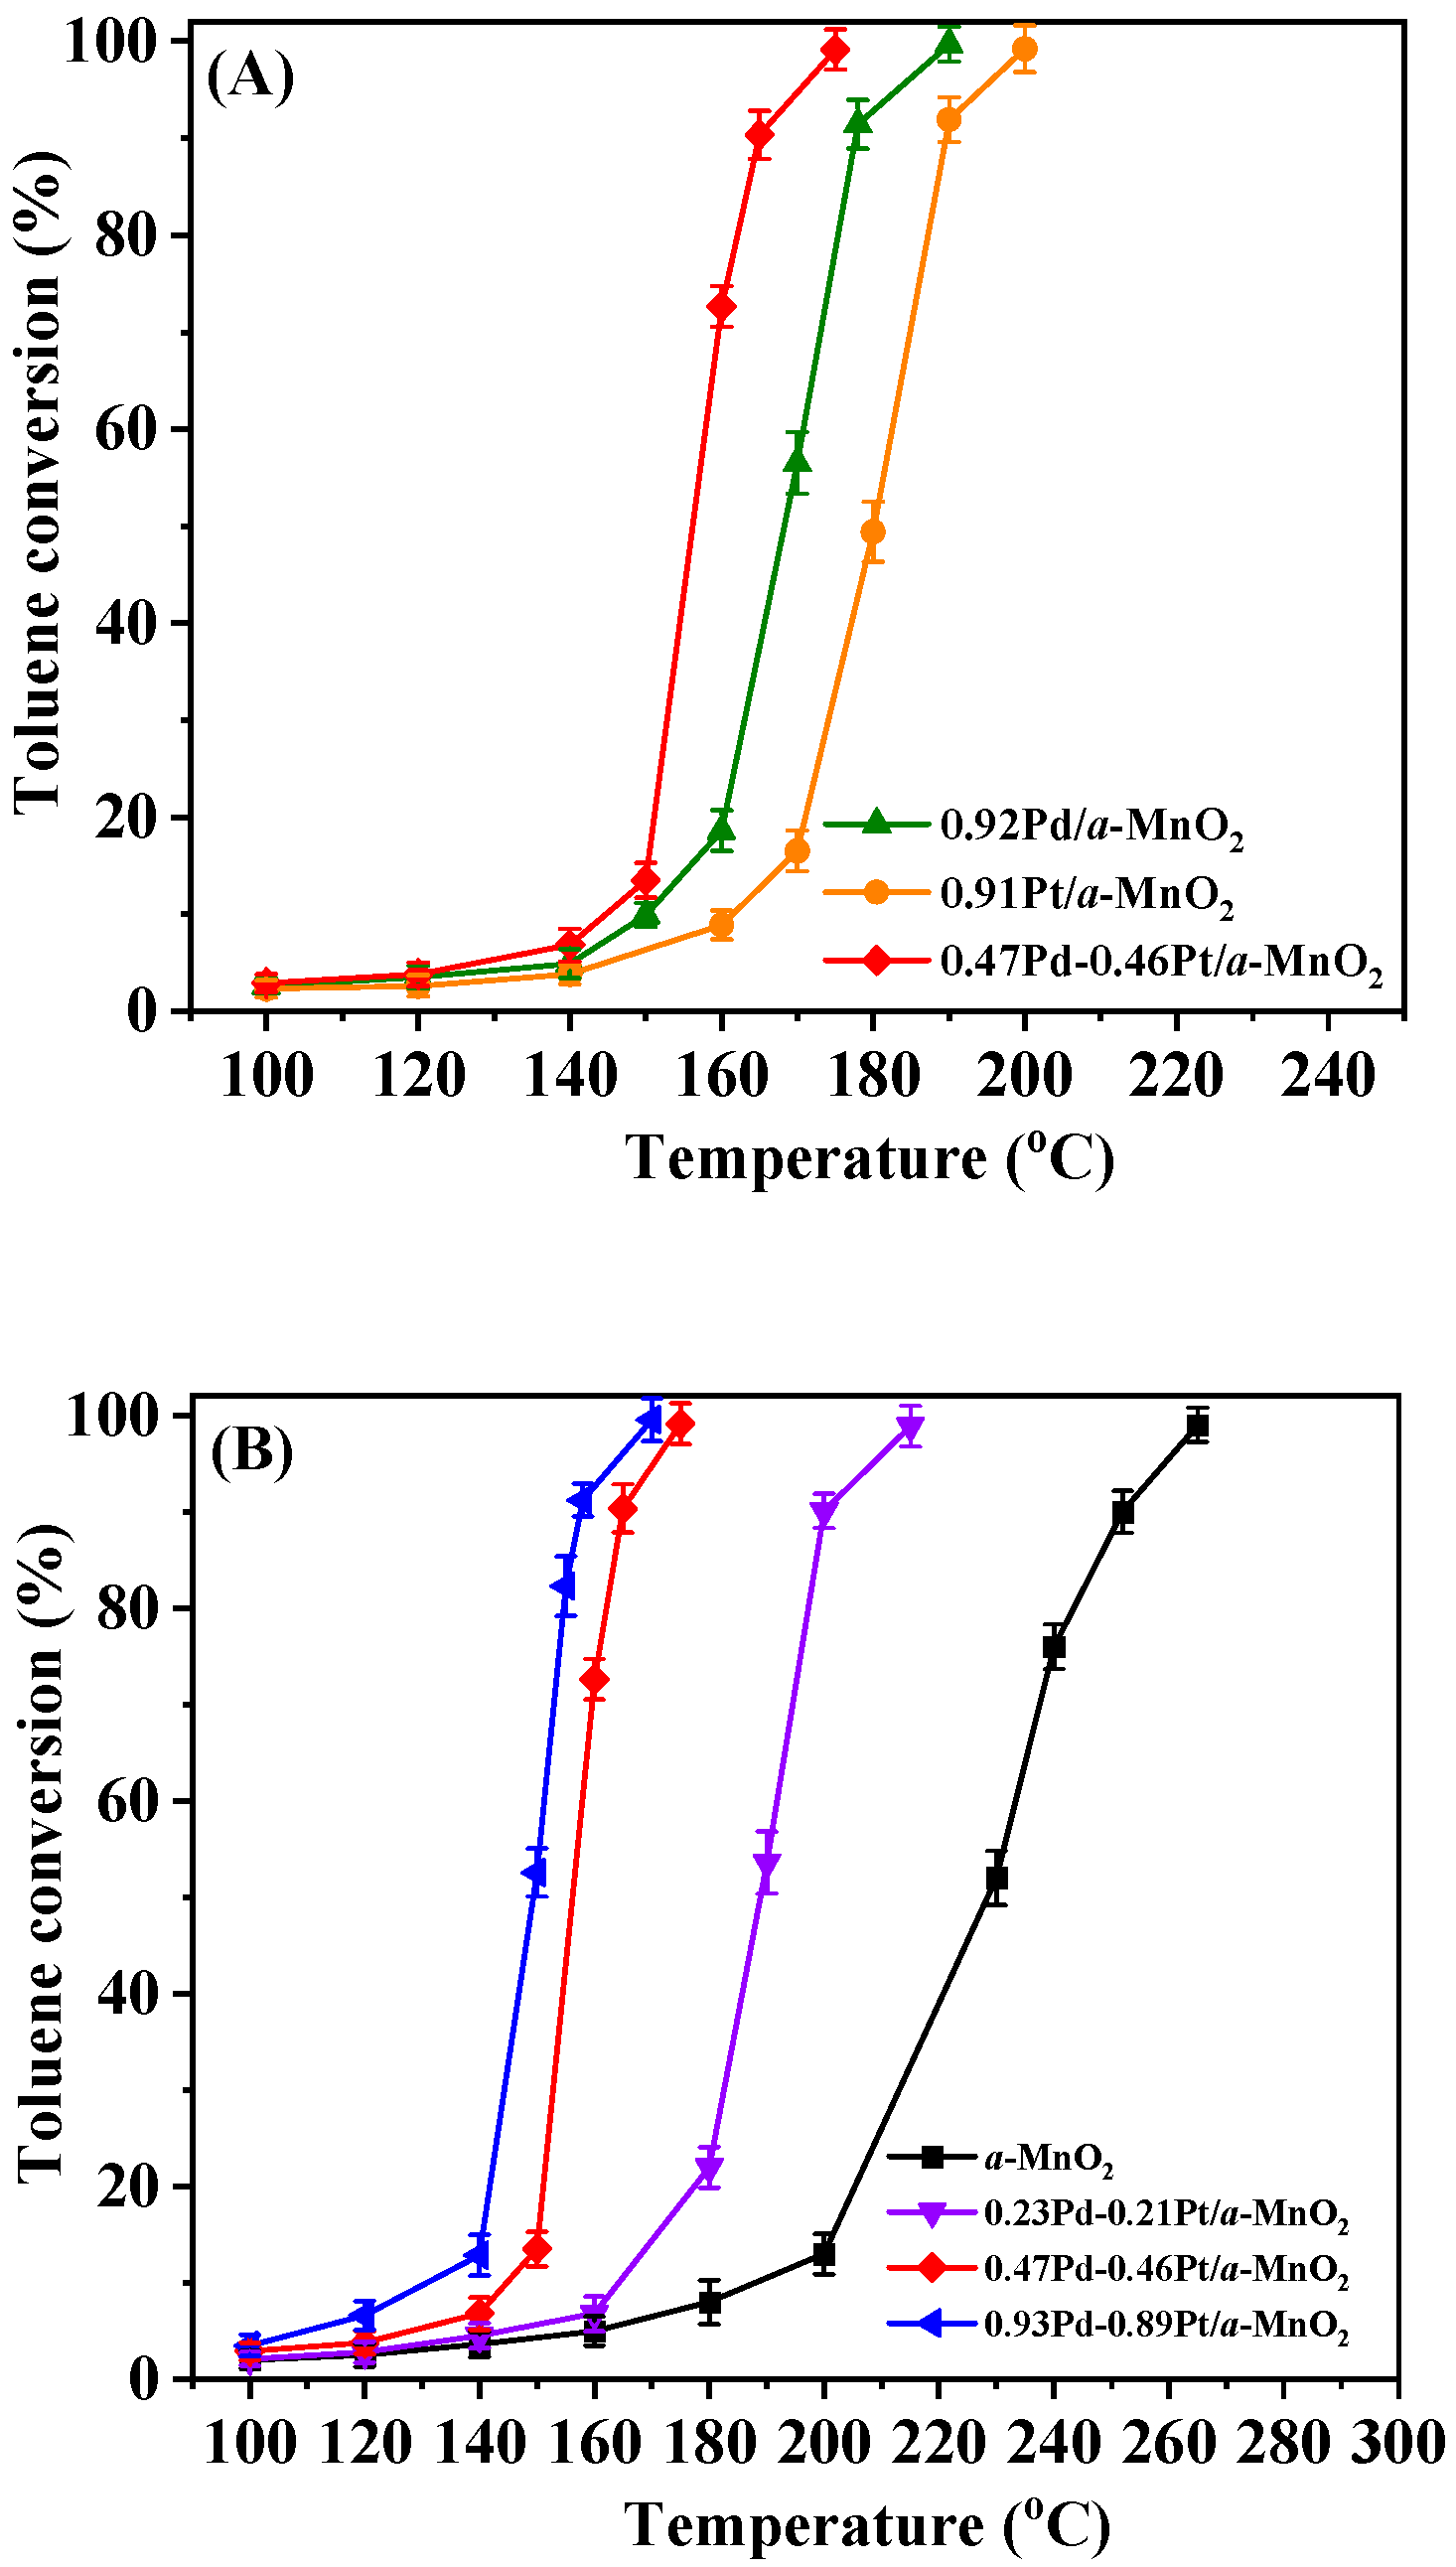
Figure 1. Toluene conversion as a function of reaction temperature over (A) α-MnO2, 0.92Pd/α-MnO2, 0.91Pt/α-MnO2, 0.47Pd-0.46Pt/α-MnO2, and (B) α-MnO2 and xPd-yPt/α-MnO2 at SV = 60,000 mL/(g h).
Catalysts 15 00746 g001
Figure 2. XRD patterns of (a) α-MnO2, (b) 0.92Pd/α-MnO2, (c) 0.91Pt/α-MnO2, (d) 0.23Pd-0.21Pt/α-MnO2, (e) 0.47Pd-0.46Pt/α-MnO2, and (f) 0.93Pd-0.89Pt/α-MnO2.
Catalysts 15 00746 g002
Figure 3. SEM images of (a) α-MnO2, (b) 0.92Pd/α-MnO2, (c) 0.91Pt/α-MnO2, (d) 0.23Pd-0.21Pt/α-MnO2, (e) 0.47Pd-0.46Pt/α-MnO2, and (f) 0.93Pd-0.89Pt/α-MnO2.
Catalysts 15 00746 g003
Figure 4. TEM images of (af) 0.47Pd-0.46Pt/α-MnO2 sample.
Catalysts 15 00746 g004
Figure 5. (A) Mn 2p, (B) O 1s, (C) Pd 3d, and (D) Pt 4f XPS spectra of (a) α-MnO2, (b) 0.92Pd/α-MnO2, (c) 0.91Pt/α-MnO2, (d) 0.23Pd-0.21Pt/α-MnO2, (e) 0.47Pd-0.46Pt/α-MnO2, and (f) 0.93Pd-0.89Pt/α-MnO2.
Catalysts 15 00746 g005
Figure 6. H2-TPR profiles of (a) α-MnO2, (b) 0.92Pd/α-MnO2, (c) 0.91Pt/α-MnO2, (d) 0.23Pd-0.21Pt/α-MnO2, (e) 0.47Pd-0.46Pt/α-MnO2, and (f) 0.93Pd-0.89Pt/α-MnO2.
Catalysts 15 00746 g006
Figure 7. (A) Effect of SV on catalytic activity of 0.47Pd-0.46Pt/α-MnO2, (B) catalytic activity of 0.47Pd-0.46Pt/α-MnO2 in different runs and SV = 60,000 mL/(g h), (C) effect of concentration on catalytic activity of 0.47Pd-0.46Pt/α-MnO2 at SV = 60,000 mL/(g h), and (D) catalytic stability of 0.47Pd-0.46Pt/α-MnO2 at different SVs, different toluene concentrations, and different temperatures.
Catalysts 15 00746 g007
Figure 8. Effect of 1.0, 3.0, or 5.0 vol% water vapor on toluene oxidation over (A) α-MnO2 at 250 °C, (B) 0.92Pd/α-MnO2 at 190 °C, and (C) 0.47Pd-0.46Pt/α-MnO2 at 165 °C and SV = 60,000 mL/(g·h).
Catalysts 15 00746 g008
Figure 9. Effect of 75 ppm SO2 on toluene conversion over (A) α-MnO2, (B) 0.92Pd/α-MnO2, and (C) 0.47Pd-0.46Pt/α-MnO2 at toluene concentration = 1000 ppm, SV = 60,000 mL/(g·h), and different temperatures.
Catalysts 15 00746 g009
Figure 10. (A) S 2p, (B) Mn 2p, (C) O 1s, (D) Pd 3d, and (E) Pt 4f XPS spectra of the (a) fresh 0.47Pd-0.46Pt/α-MnO2 sample and (b) SO2-treated 0.47Pd-0.46Pt/α-MnO2-S sample.
Catalysts 15 00746 g010
Figure 11. In situ DRIFTS spectra of (A) toluene adsorption on 0.47Pd-0.46Pt/α-MnO2 under conditions of 150 °C and (1000 ppm toluene + N2 (balance)), (B) toluene oxidation over 0.47Pd-0.46Pt/α-MnO2 in (1000 ppm toluene + 20 vol% O2 + N2 (balance)) conditions, and (C) toluene oxidation over 0.47Pd-0.46Pt/α-MnO2 in the presence of 75 ppm SO2 at different temperatures and SV = 60,000 mL/(g·h).
Catalysts 15 00746 g011aCatalysts 15 00746 g011b
Scheme 1. Proposed catalytic mechanism of toluene oxidation over the 0.47Pd-0.46Pt/α-MnO2 catalyst.
Catalysts 15 00746 sch001
Table 1. Catalytic activities, apparent activation energies (Ea), and specific reaction rates at 156 °C (rcat) of the as-prepared samples.
SampleToluene Oxidation ActivityEa
(kJ/mol)
rcat
(mol/(g s))
T50% (°C)T90% (°C)
α-MnO222225254.33.54 × 10−5
0.92Pd/α-MnO217719241.56.13 × 10−5
0.91Pt/α-MnO216117837.31.31 × 10−4
0.23Pd-0.21Pt/α-MnO218620146.94.77 × 10−5
0.47Pd-0.46Pt/α-MnO215516533.64.98 × 10−4
0.93Pd-0.89Pt/α-MnO214815631.96.34 × 10−4
Table 2. Surface areas, pore volumes, average pore diameters, crystallite sizes (D), average noble metal particle sizes, and actual noble metal loadings of the samples.
SampleSurface
Area a
(m2/g)
Pore Volume a
(cm3/g)
Average Pore
Diameter b
(nm)
D c
(nm)
Noble Metal Particle Size d
(nm)
Actual Pd Content e
(wt%)
Actual Pt Content e
(wt%)
α-MnO239 ± 1.50.087 ± 0.019.0 ± 1.428 ± 1.6
0.92Pd/α-MnO242 ± 1.50.071 ± 0.017.0 ± 1.430 ± 1.63.4 ± 1.00.92 ± 0.01
0.91Pt/α-MnO242 ± 1.50.078 ± 0.017.3 ± 1.428 ± 1.63.2 ± 1.00.91 ± 0.01
0.23Pd-0.21Pt/
α-MnO2
41 ± 1.50.071 ± 0.017.2 ± 1.429 ± 1.62.9 ± 0.90.23 ± 0.010.21 ± 0.01
0.47Pd-0.46Pt/
α-MnO2
42 ± 1.50.069 ± 0.017.1 ± 1.430 ± 1.62.6 ± 1.10.47 ± 0.010.46 ± 0.01
0.93Pd-0.89Pt/
α-MnO2
43 ± 1.50.079 ± 0.016.8 ± 1.432 ± 1.62.5 ± 0.60.93 ± 0.010.89 ± 0.01
a Data were determined using the BET method; b data were determined using the BJH method; c data determined based on the XRD results according to the Scherrer equation using the FWHM of the (110) line of α-MnO2; d data were estimated according to the HRTEM images of the noble metal NPs on the surface of the samples; e determined using the ICP-AES technique.
Table 3. Surface element compositions and H2 consumption of the samples.
SampleSurface Element Composition
(Molar Ratio)
H2 Consumption (mmol/g)
Mn3+/Mn4+Pt2+/Pt0Pd2+/Pd0Oads/OlattPeak α Peak β Peak γ Total
α-MnO20.560.4012.313.512.838.6
0.92Pd/α-MnO20.590.590.4619.611.59.340.4
0.91Pt/α-MnO20.610.580.5022.311.49.443.1
0.23Pd-0.21Pt/α-MnO20.580.540.540.4319.113.28.240.5
0.47Pd-0.46Pt/α-MnO20.660.590.610.5122.613.18.844.5
0.93Pd-0.89Pt/α-MnO20.690.620.650.5723.313.610.347.2
Disclaimer/Publisher’s Note: The statements, opinions and data contained in all publications are solely those of the individual author(s) and contributor(s) and not of MDPI and/or the editor(s). MDPI and/or the editor(s) disclaim responsibility for any injury to people or property resulting from any ideas, methods, instructions or products referred to in the content.