Article

Rotating Photo-Disc Reactor (RPR) Used in the Photo-Degradation of Pyridine Using Zinc Oxide as a Catalyst Composited with Aluminum Nanoparticles and Irradiated with Natural Light

Faculty of Chemistry, Autonomous University of Carmen, Ciudad del Carmen C.P. 24180, Campeche, Mexico
*
Author to whom correspondence should be addressed.
Catalysts 2025, 15(5), 437; https://doi.org/10.3390/catal15050437
Submission received: 20 March 2025 / Revised: 7 April 2025 / Accepted: 9 April 2025 / Published: 29 April 2025
(This article belongs to the Special Issue Environmental Catalysis in Advanced Oxidation Processes, 2nd Edition)

Abstract

:
Pyridine was degraded in a rotating photo-disc reactor (RPR) using zinc oxide (ZnO) doped with aluminum nanoparticles (ZnO-Al) as a catalyst and natural light lamps. The reactor disks made of clay had a surface area of 329.7209 m2. The reactor was operated as a semi-batch system, where it handled a volume of 14.8 L and had a hydraulic residence time (HRT) of 72 h at 54 rpm with a constant flow rate. The results indicate an average degradation of 50.6% after an HRT of 72 h, with a maximum degradation of 62%. The characterization results confirm the effectiveness of the doping process, showing an aluminum concentration of 4.11% by mass in the catalyst, as determined by X-ray techniques. Overall, the doping process proved effective for the zinc oxide catalyst, as evidenced by a reduction in the catalyst bandgap from 3.25 eV for undoped ZnO to 3.08 eV for the doped version, making it sufficiently active under artificial visible light.

1. Introduction

Industrial development has grown significantly in recent years, leading to a substantial increase in industrial waste discharge into receiving bodies of water. This has resulted in the release of various pollutants into water bodies. Numerous persistent organic compounds have been identified, including phenols, chlorophenols, and pyridine, which are compounds commonly associated with industrial activities [1].
Pyridine is widely used in the synthesis of various compounds, including fertilizers, paints, and pesticides. Advanced oxidation processes are an effective alternative for degrading persistent organic compounds. These processes include non-photocatalytic methods, such as ultrasound, as well as photocatalytic methods, such as heterogeneous photocatalysis.
The increasingly acceptable use of chemical products in industries and homes has led to an increase in organic pollutants in effluents [2].
Various industries release a significant number of aromatic compounds into the environment due to their widespread use in many industries. Among these, heterocyclic aromatic compounds, such as pyridine and its derivatives, are of particular concern as environmental pollutants due to their recalcitrant, toxic, and teratogenic nature [3,4].
Pyridine and substituted pyridines are important intermediates for the synthesis of pharmaceuticals, herbicides, metal corrosion inhibitors, rubber vulcanization accelerators, etc. [5,6,7,8,9].
Pyridine, a chemical compound with the formula C3H5N, has caused significant environmental pollution due to its widespread industrial use, especially in wastewater. Even at very low concentrations (0.3 μg/L), pyridine imparts an unpleasant odor to water, and at higher concentrations (0.82 mg/L), it also affects the taste. Consequently, researchers have actively explored effective and economically viable techniques to mitigate pyridine contamination and purify contaminated water [9,10,11,12,13].
ZnO is an important semiconductor material that has a wide range of applications, including transparent conducting oxides, UV light absorbers, and photocatalysis.
Transition metal doping and mixed oxide formation are two widely studied mechanisms to improve the intrinsic properties of binary oxides. Both procedures have been instrumental in the spectacular increase in applications based on zinc oxide (ZnO) and titanium oxide (TiO2) thin films [14].
Applications derived from metal-doped ZnO in optoelectronic devices include photovoltaic solar cells, flat panel displays, photodetectors, gas sensors, and light-emitting diodes. Most previous works on doped ZnO films focus on doping with group III elements, and in particular, trivalent cations of the elements Al, Ga, and I have frequently been used to enhance the n-type conductivity of ZnO films [15,16].
Preparing doped material is also a competent method for regulating the surface states of ZnO energy levels, which can be further advanced by changing the doping concentration of semiconductor materials.
As one of the most interesting p-type magnetic doping materials, cobalt oxide nanostructures are also recognized as attractive materials with broad applications in various fields, such as doping, catalysts, solid-state sensors, and electrochemical devices [17].
The doping of impurities to create chemical and, in some cases, physical defects in the crystal lattice that would act as the capture and recombination sites of exactions, involves introducing transition metal (M) atoms as impurities in ZnO crystallites to tailor the photocatalytic property [18].
Since the band gap energy of ZnO crystals is about 3.3 eV, ZnO can absorb UV rays with wavelengths under 375 nm. Therefore, ZnO has been regarded as an excellent UV shielding material, with broad UV absorption characteristics and photofastness compared with other organic and inorganic UV shielding materials [19].
The absorbed UV rays excite the valence electrons to the conduction band. When these photo-excited electrons and holes move to the particle surfaces where water and oxygen molecules reside, highly active free radicals, such as superoxide anion (•O2) and •OH radicals, are generated and undergo secondary reactions, such as the decomposition of organic compounds [20].
Photocatalytic reactors come in various configurations, primarily classified by the light source, shape, catalyst, stirring method, bed dynamics, and reactor type. Slurry and immobilized/deposited reactors are two main categories based on the catalyst type. While slurry reactors require secondary separation for catalyst recovery, immobilized reactors offer advantages like increased light penetration and higher efficiency by preventing catalyst agglomeration. To enhance performance, various substrates, such as glass, quartz, alumina, ceramics, stainless steel, activated carbon, and zeolite, are used to support the photocatalyst [21,22,23,24,25].
The deposition of photocatalyst particles on reactor substrates can limit the mass transfer, affecting the overall efficiency. Spinning disc reactors (SDRs) have emerged as a promising solution due to their versatility and ability to enhance the mass transfer and mixing. They have been successfully employed in various processes, including biodiesel production, enzymatic reactions, nanoparticle synthesis, and the photocatalytic degradation of pollutants. Recent studies have explored the potential of SDRs for degrading textile dyes, pharmaceutical compounds, and antibiotics, offering a promising approach to overcome the limitations associated with traditional photocatalytic reactors [26,27].
Spinning disc reactors (SDRs) enhance mixing and mass transfer through centrifugal force. A key limitation in photocatalytic degradation is the reduced efficiency due to insufficient light exposure of the catalyst. The farther the catalyst is from the light source, the lower its activation and degradation efficiency. SDRs offer a solution by creating thin liquid films and fine droplets, maximizing the light penetration to the catalyst surface. This increased light exposure boosts photocatalytic activity, generates more free radicals, and ultimately improves the overall degradation efficiency [28].
Biodisc rotary reactors (BRRs), a well-established technology in secondary wastewater treatment, have been successfully adapted as photo-reactors. Through extensive testing, this system has been optimized, which involved evaluating various catalyst support materials. Clay discs proved to be the most efficient [28,29].
In addition, crucial operating variables have been tested, such as the rotation speed, hydraulic residence time, changes in the type of light source (visible light range and UV radiation), flow rate, initial contaminant concentration, pH, type of disc structure, and flow rate, which has achieved superior performance [30].
These reactors, with batch treatment capacities of between 10 and 30 L, offer the advantage of not requiring external aeration and feature a high contact area/volume ratio, maximizing the process efficiency. Additionally, treatment is performed sequentially thanks to bulkhead separation. Mass transfer limitations, which might otherwise arise, are minimized by reducing the boundary layer to a minimum. This is achieved by means of turbulent flow in the layer formed above the disk by adjusting the number of revolutions applied [31,32].

2. Results

2.1. SEM Results

Figure 1 shows the characterization of the catalysts synthesized by the SEM technique. In Figure 1A, a characteristic shape of undoped ZnO is observed, with a crystal shape with an average size of 100 to 50 μm; a clean surface is observed. In Figure 1B, accumulations of small particles are observed on the surface of the ZnO, which are attributed to the deposited aluminum particles.
The results of the SEM characterization and EDS analysis (Figure 1D) show that the Al3+ nanoparticles were indeed deposited on the surface of the zinc oxide. Although this was not a quantitative test but rather a qualitative one, the EDS result was used to give a percentage of 11% by weight of the doped material, and plasmons of this are shown in the microfilms presented (Figure 1C).

2.2. X-Rays

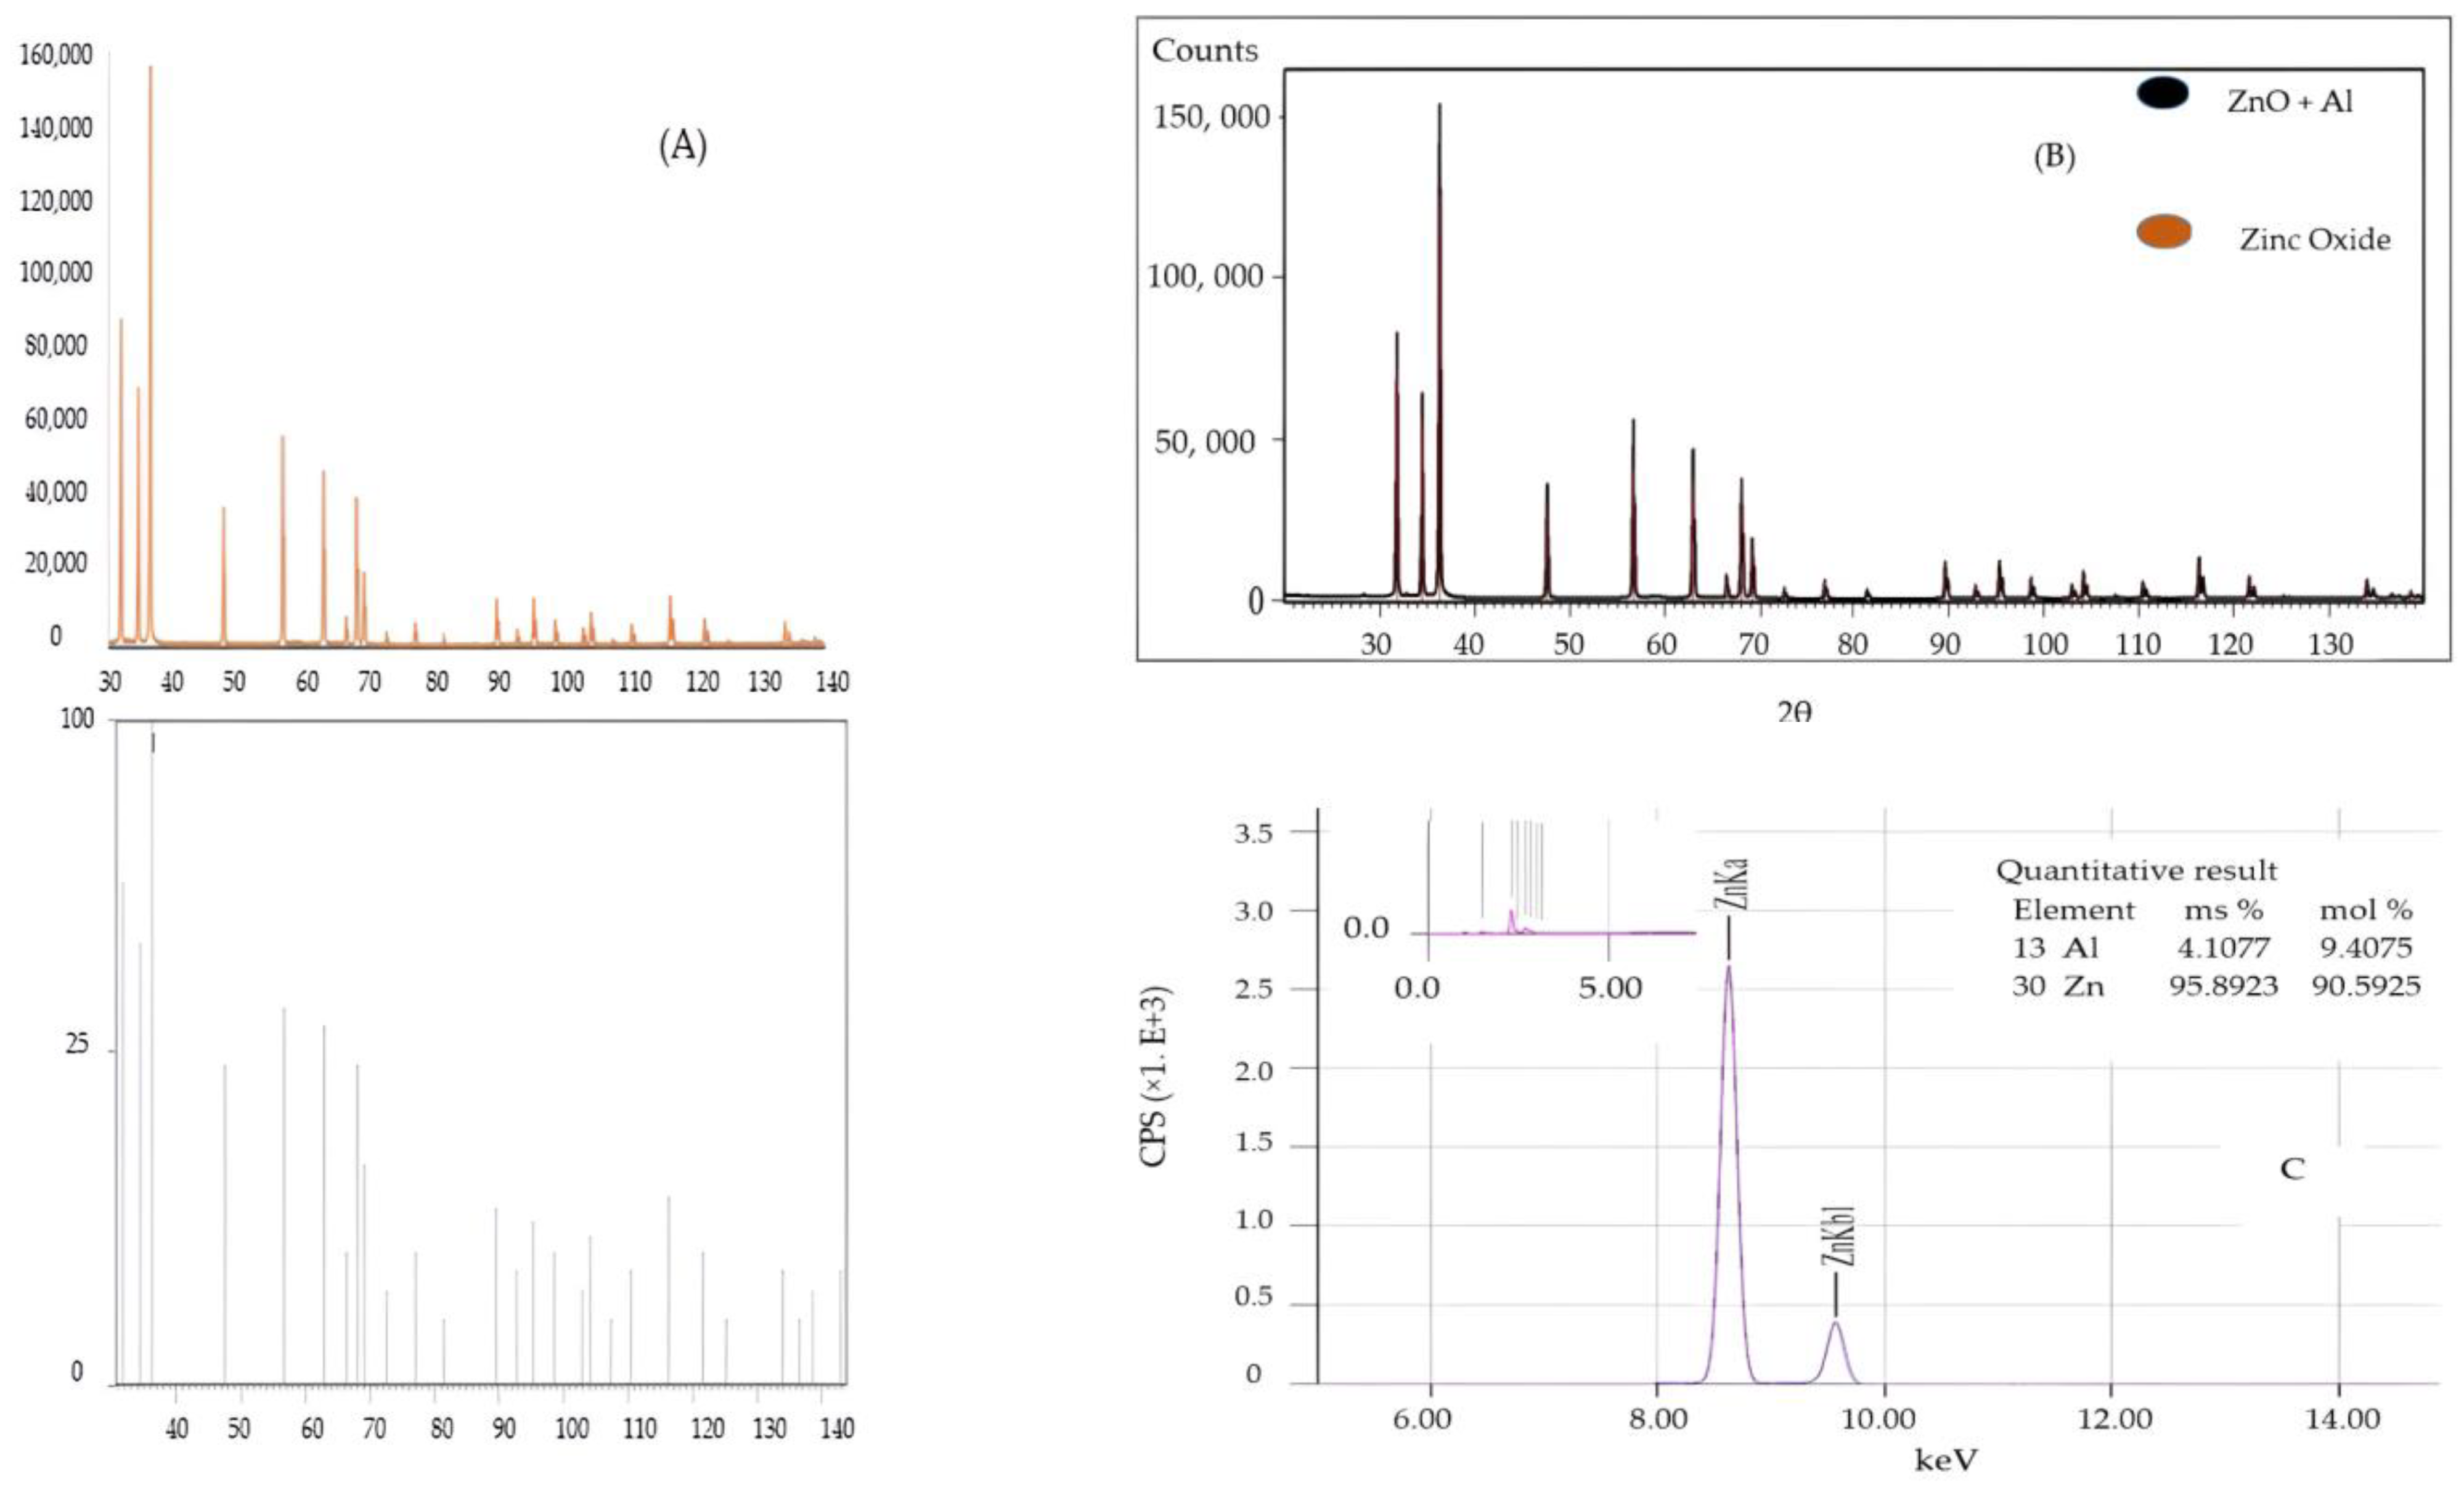
The crystalline structure of zinc oxide (ICDD: 00-036-1451) was identified; see Figure 2A. This sample presented diffraction peaks at −31.8, 34.5, 36.3, 47.6, 56.6, 62.9, 66.4, 67.9, 69.1, 72.6, 76.9, 81.4, 89.6, 92.8, 95.3, 98.6, 102.9, 104.2, 107.5, 110.4, 116.3, 121.6, 125.2, and 133.9, which corresponded to the Miller indices (100), (002), (101), (102), (110), (103), (200), (112), (201), (004), (202), (104), (203), (210), (211), (114), (212), (105), (204), (300), (213), (302), (006), and (205) of zincite [33].
Figure 2B compares the X-ray spectra of the undoped and aluminum-doped zinc oxide. Only an increase in the intensities of the doped zinc oxide peaks was observed, and small, almost imperceptible, shifts of the peaks, which may have been due to the presence of the dopant in the zinc oxide, which was confirmed by the analysis of the energy-dispersed X-ray studies (Figure 2C).
The elemental study of ZnO-Al was carried out by energy-dispersive X-ray spectroscopy (EDX). Figure 2C represents the EDX results; the peak observed at 8.63 keV represents Zn, while the peaks associated with 1.46 keV that represent Al in the EDS analysis also confirm the presence of aluminum, which was impregnated in the zinc oxide matrix.
Aluminum was present at 4.1%, which is consistent with the mass concentration used in the doping. This study confirmed the presence of aluminum.

2.3. Diffuse Reflectance

The optical band gap can be estimated using the following Tauc relationship [34]:
αhν = B(hν − Eg)n
where B is a constant; Eg is the forbidden or optical bandwidth of the material; and n is a number characterizing the nature of the electronic transition between the valence band and conduction band, which can have values of 1/2, 2, 3/2, and 3 corresponding to direct allowed, indirect allowed, direct forbidden, and indirect forbidden transitions, respectively.
It is well known that the direct transition through the forbidden band is feasible between the valence band and the conduction band bordering the “k-space”. In the transition process, the total energy and momentum of the electron–photon system must be conserved.
It is known that ZnO is a direct band gap semiconductor, so from the above equation, it is clear that the graph of (αhν)1/2 vs. hν will indicate a divergence at an energy value, for example, where the transition occurs. The value of the forbidden band depends on the nature of the transition (i.e., the n value) given.
The transition mode in these ZnO nanoparticles was confirmed to be direct. The absorption coefficient near the band edge was also assumed to show an exponential dependence on the photon energy, and this dependence is given as follows [35,36,37,38,39,40,41]:
α = α0 exp(hν/Eu)
where α0 is a constant, and Eu is the Urbach energy interpreted as the width of the tails of the localized states associated with the amorphous state in the forbidden gap.
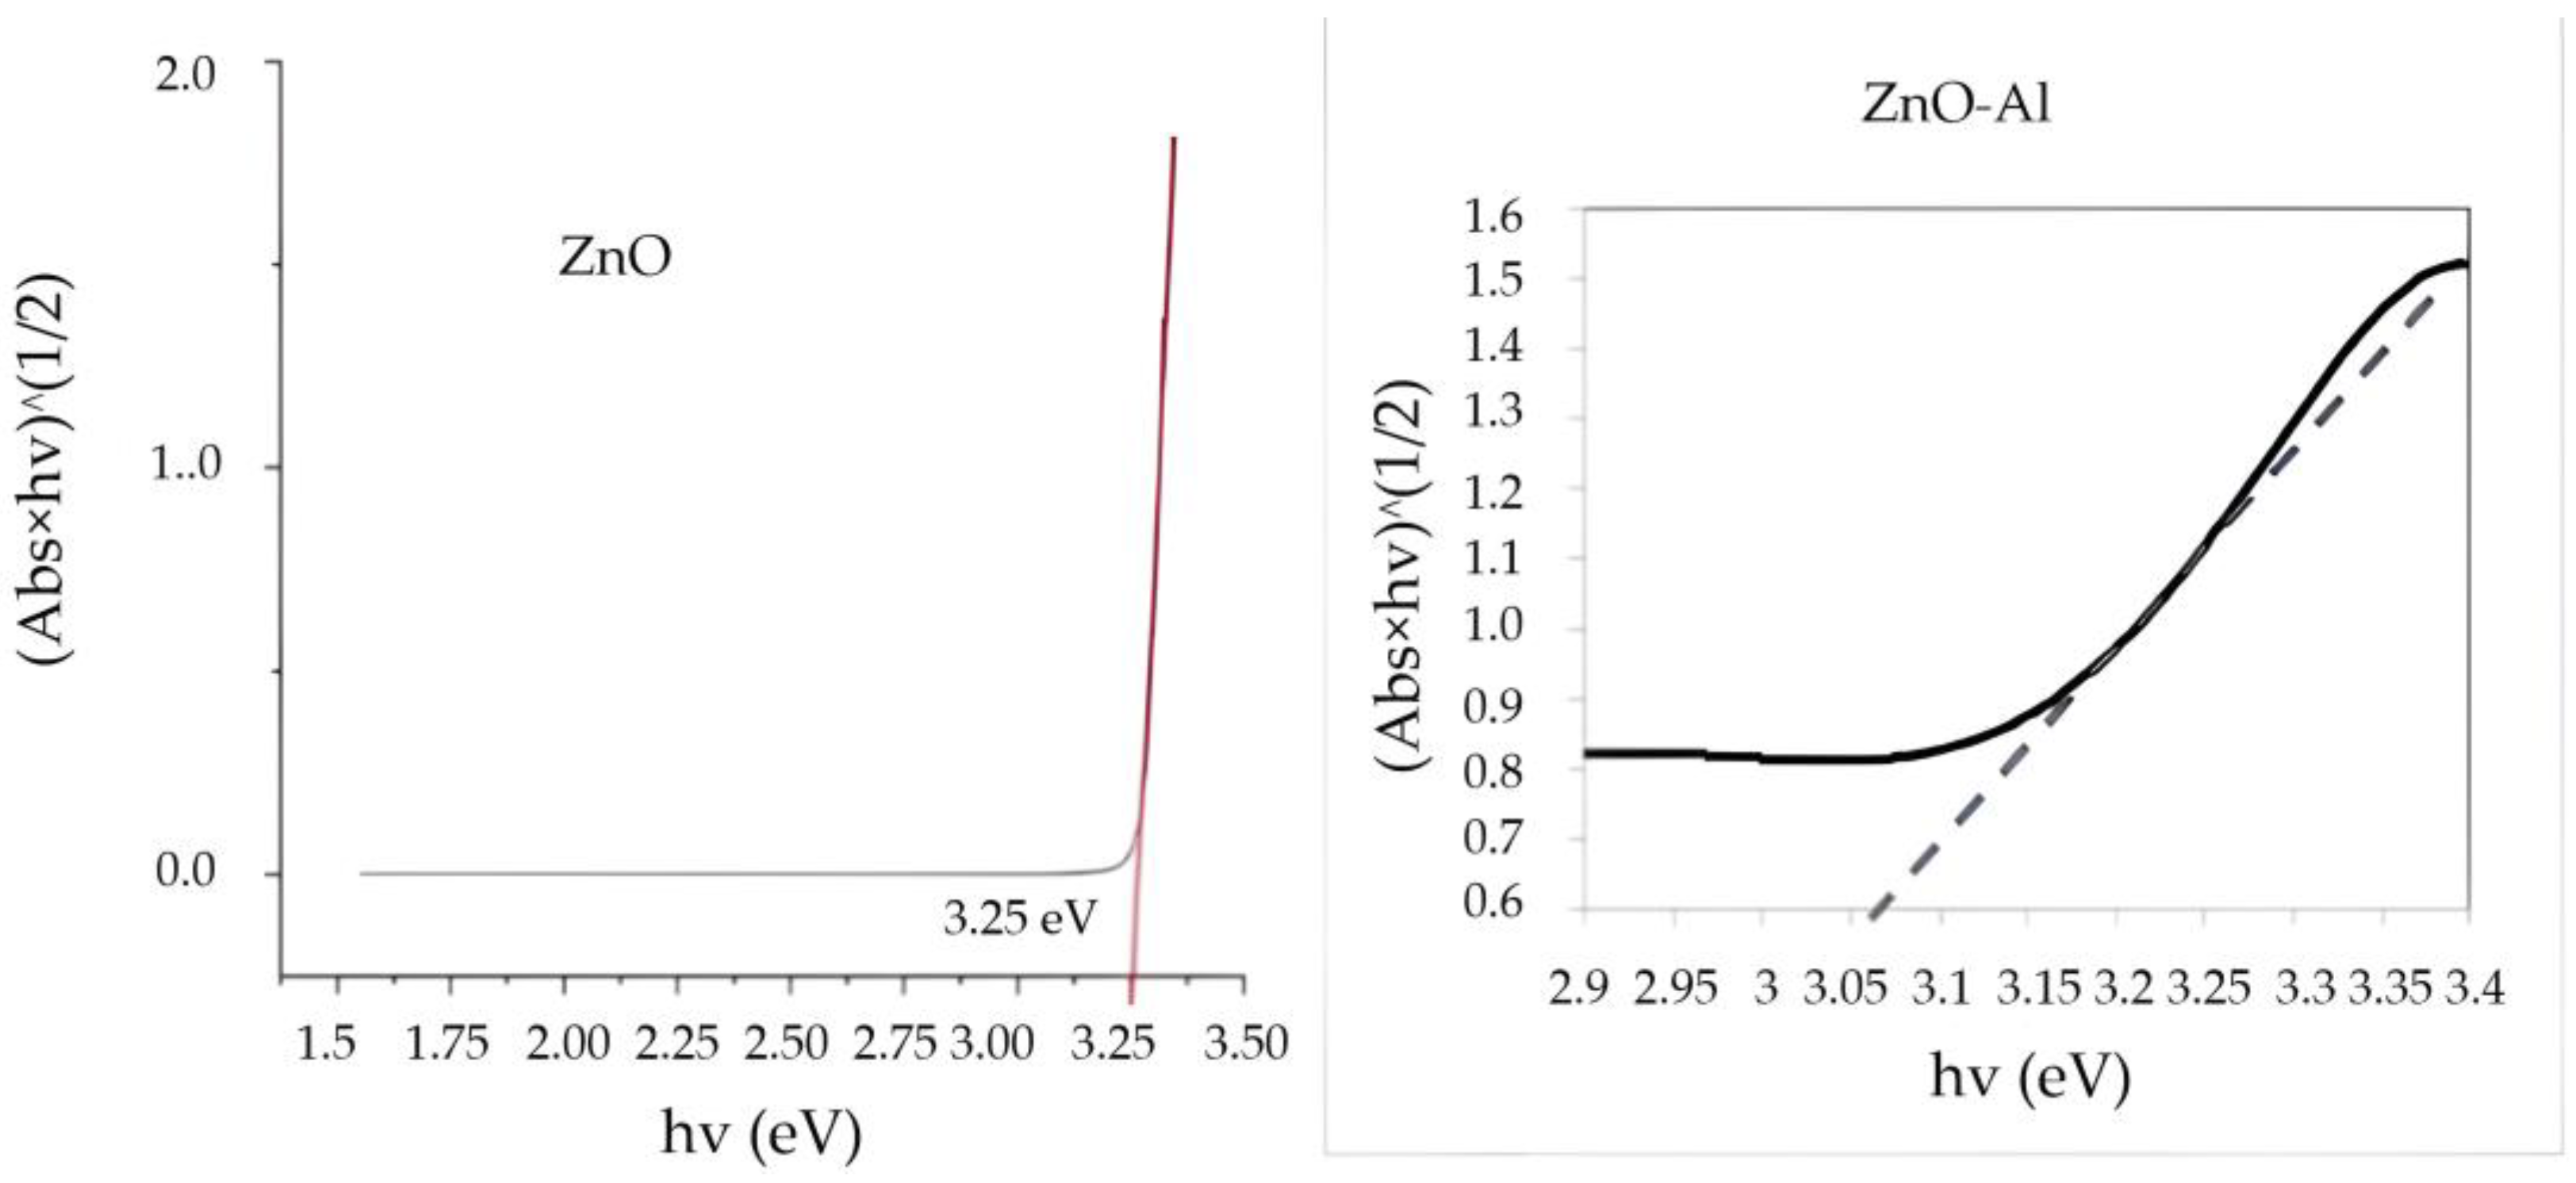
The estimated band gap from the plot of (αhν)1/2 versus hν for the Al-doped ZnO particles can be seen in Figure 3. The band gap (“Eg”) was determined by extrapolating the straight portion to the energy axis at α = 0. The linear part shows that the transition mode in these particles was direct. The estimated band gap value of the Al+-doped ZnO was 3.08 eV. The band gap value was smaller than that of undoped ZnO of 3.25 eV [36]; this might have been due to the strain arising from the chemical synthesis of the Al doped ZnO. These microstrains greatly influenced the optical band gap of the material [36].

2.4. Raman Spectroscopy

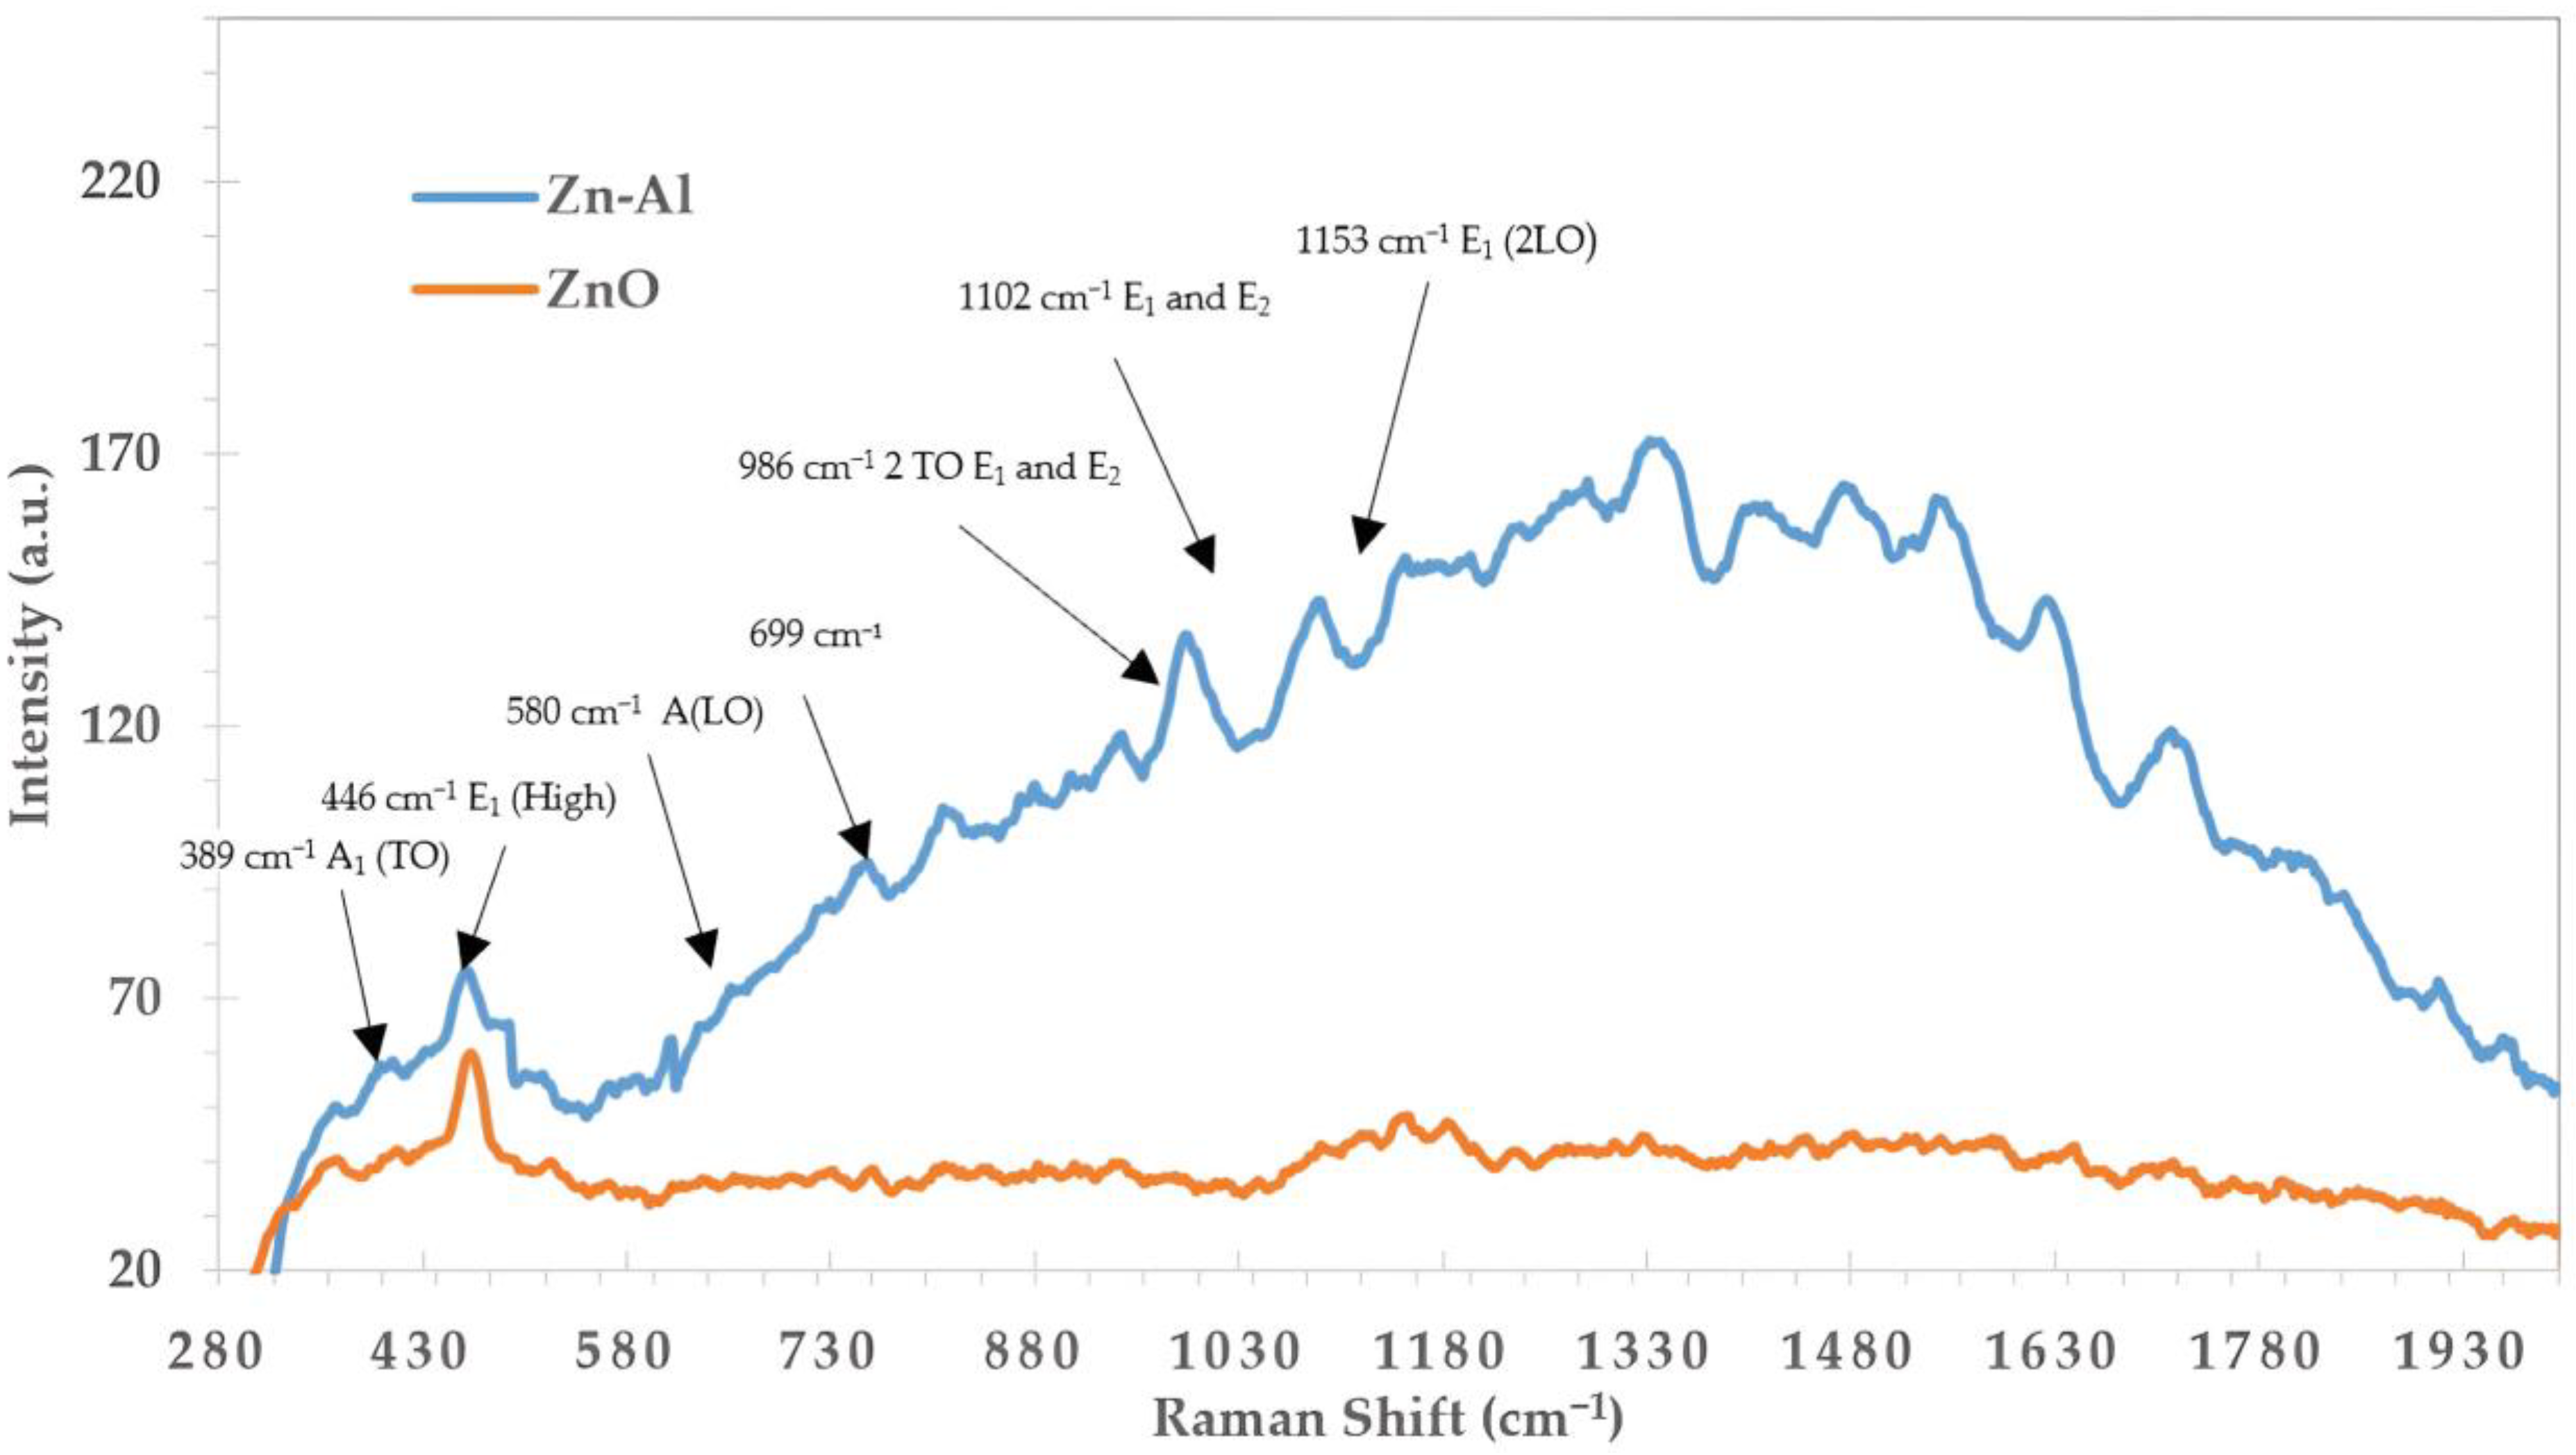
Figure 4 shows the Raman spectrum of undoped (red) and doped (blue line) ZnO. The first shows the characteristic peaks of zinc oxide. In this case, the zinc oxide was obtained from its hexagonal phase (wursite), and its structure belonged to the C3V symmetry group, in which the following vibration modes existed, as determined by group theory:
Γ = A1 + 2B1 + E1 + 2E2
The modes A1, E1, and E2 (E2 (low), E2 (high)) are Raman active modes. The symmetrical modes A1 and E1 are Raman and infrared active modes, E2 is only Raman active and B1 is a forbidden mode for both Raman and infrared. The polar characteristics of the A1 and E1 vibration modes lead to longitudinal and transverse components designated as A1 (TO), A1 (LO), E1 (TO), and E1 (LO).
Zinc oxide (ZnO) exhibits a distinctive peak in the Raman spectrum at 446 cm−1, which disappears upon doping with Al3+. In contrast, the Raman spectrum of Al3+-doped ZnO exhibited an increase in the intensity of the characteristic peaks at 580 cm−1 (LO), 986 cm−1 (E1), and 1102 cm−1 (E2). An average increase of 6 intensity units was observed for these peaks, as well as for the E1 peak at 1153 cm−1 (2LO); suggesting that the presence of aluminum on the zinc oxide surface could be the cause of these variations.
The peak at 437 cm−1 is characteristic of the hexagonal phase, while the peak located at 582 cm−1 was attributed to the E1 (LO) mode. The latter is generally thought to be related to structural defects (oxygen vacancies, interstitial zinc, free carriers, etc.) in ZnO. The intense presence of the E2 (high) mode and the suppression of the E1 (LO) mode in the Raman spectrum indicate that the ZnO nanostructures obtained in this work were highly crystalline with a hexagonal phase and that the density of the surface defects was minimal.

2.5. Uv–Vis and HPLC Results

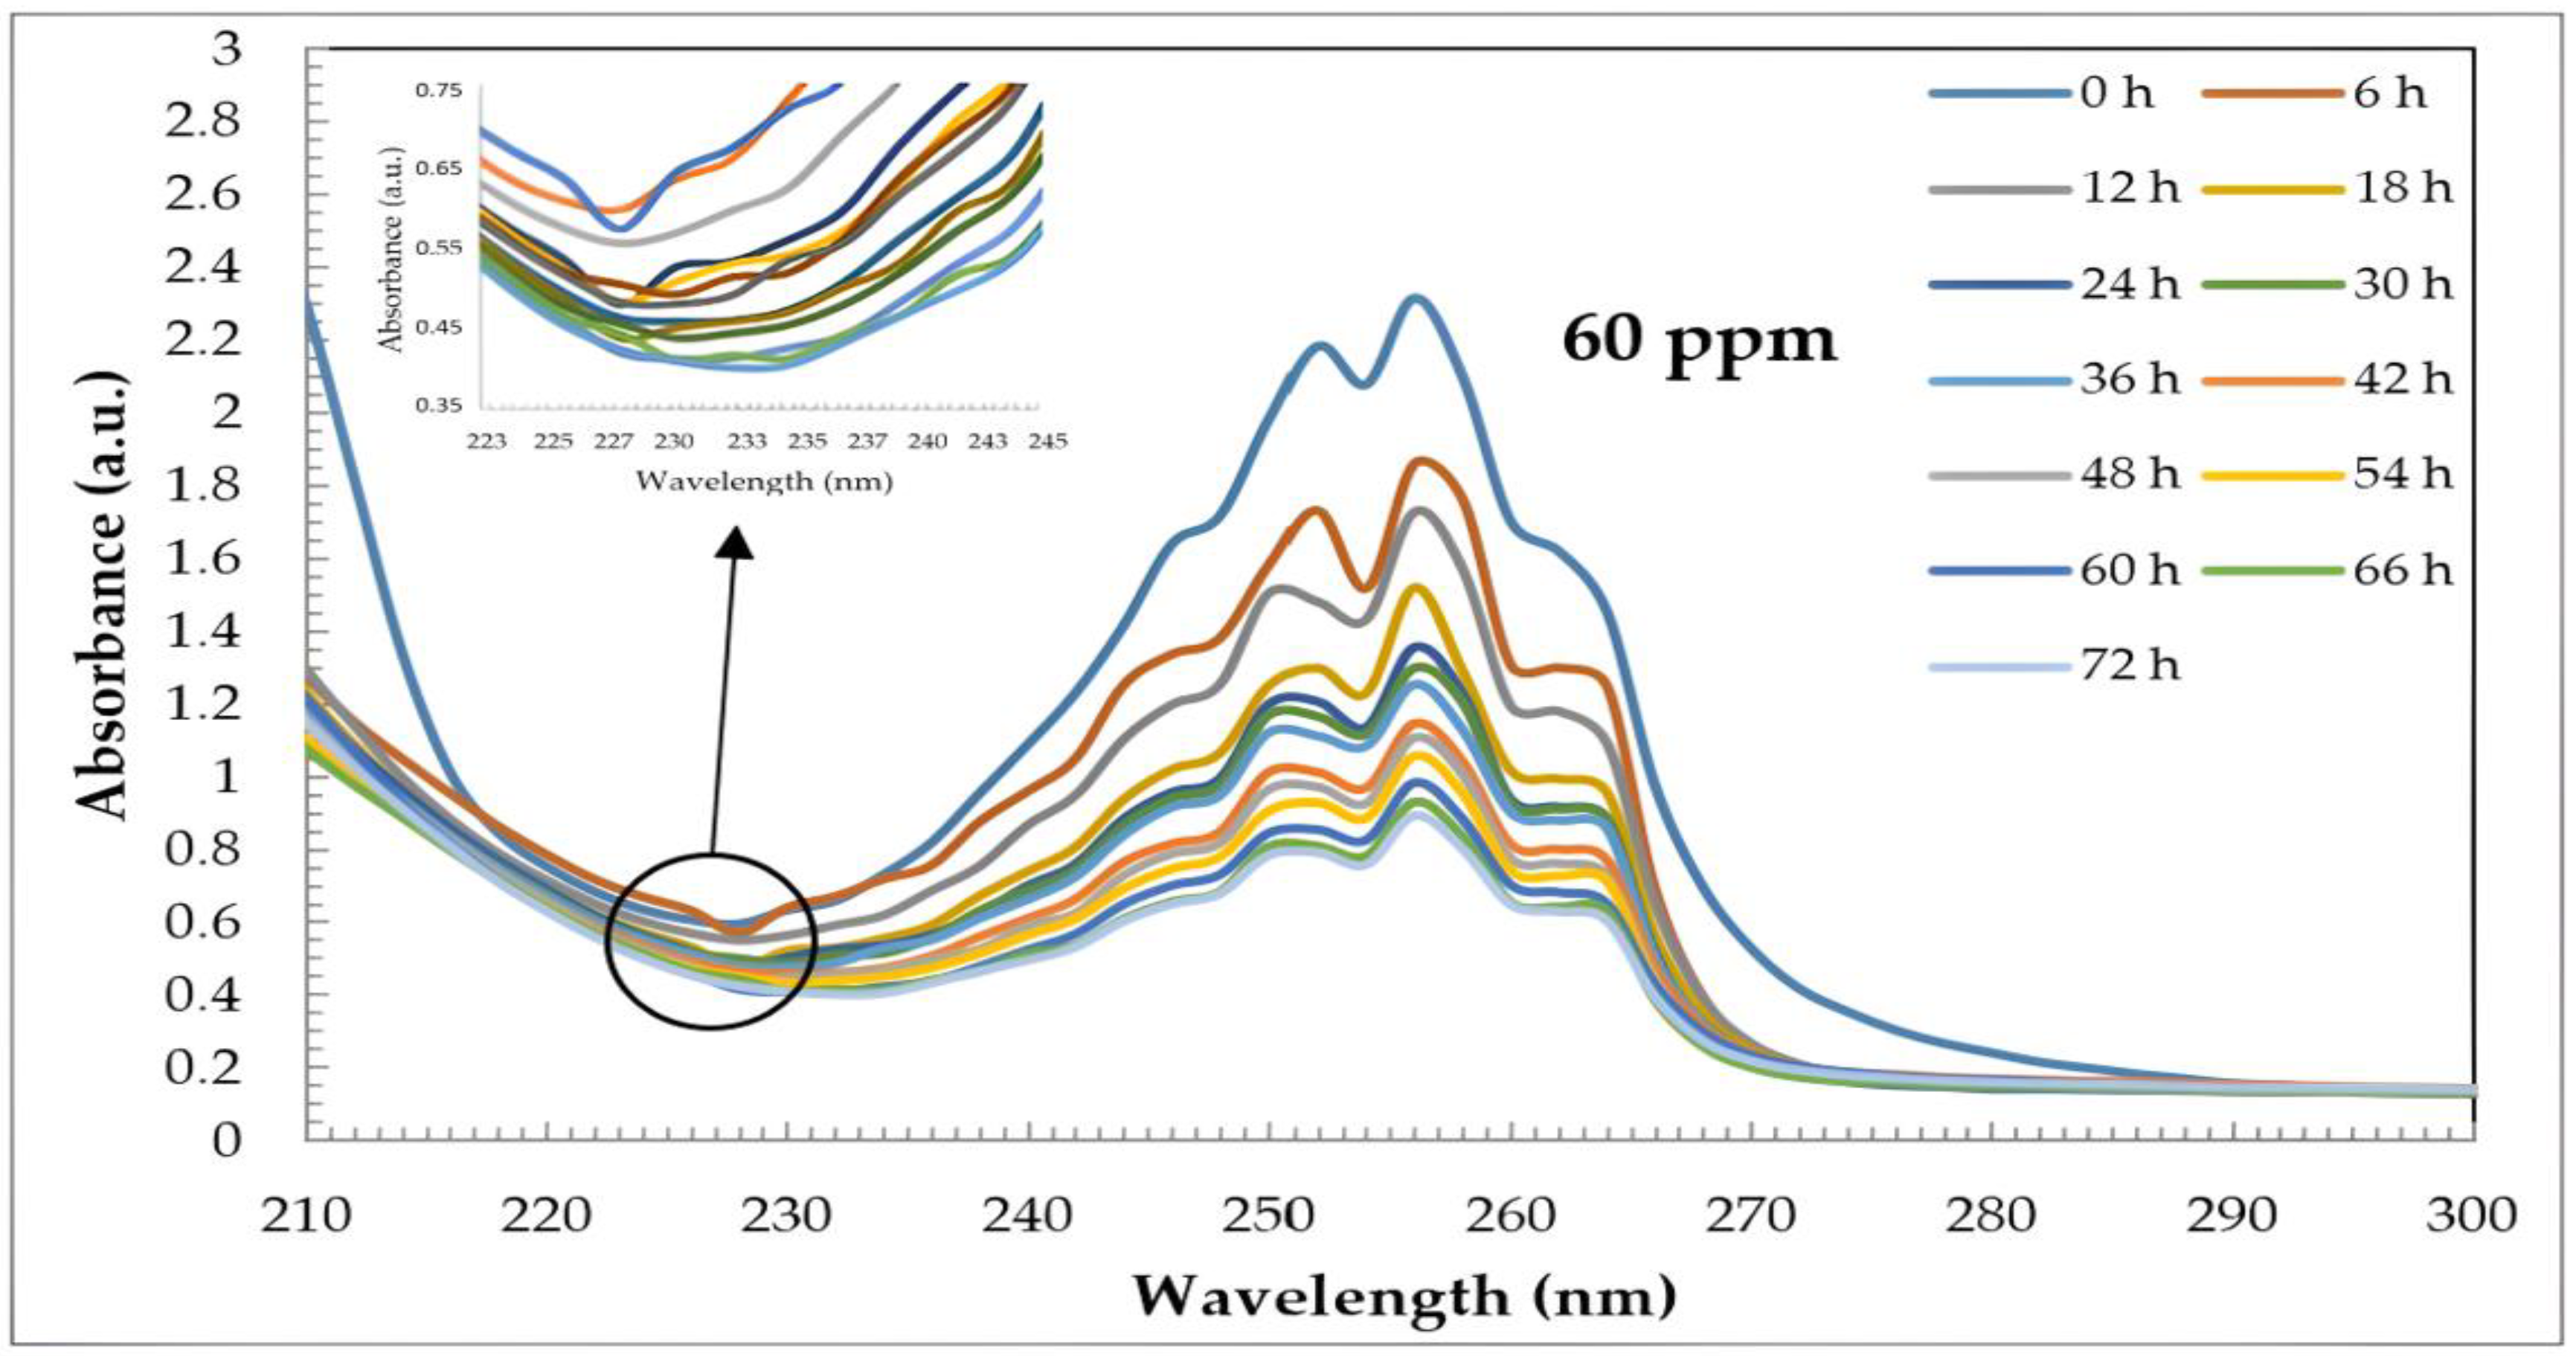
The UV–vis results are shown in Figure 5, which shows the characteristic peaks of pyridine at an initial time, with peaks at 256 and 250 nm. Pyridine is a heterocyclic compound that presents several electronic transitions, which are combinations of the π-π* and η-Π* transitions, to which these characteristic peaks are attributed [37,38,39,40,41,42,43,44]. The maximum peak decreased as the degradation time passed; in this case, the total exposure time was 72 h.
During the first hours, the percentage of degradation between each 6 h was approximately 39%. For the final times (48 to 72 h), this percentage was drastically reduced to 20%, with a photo-degradation percentage of 62% after 72 h.
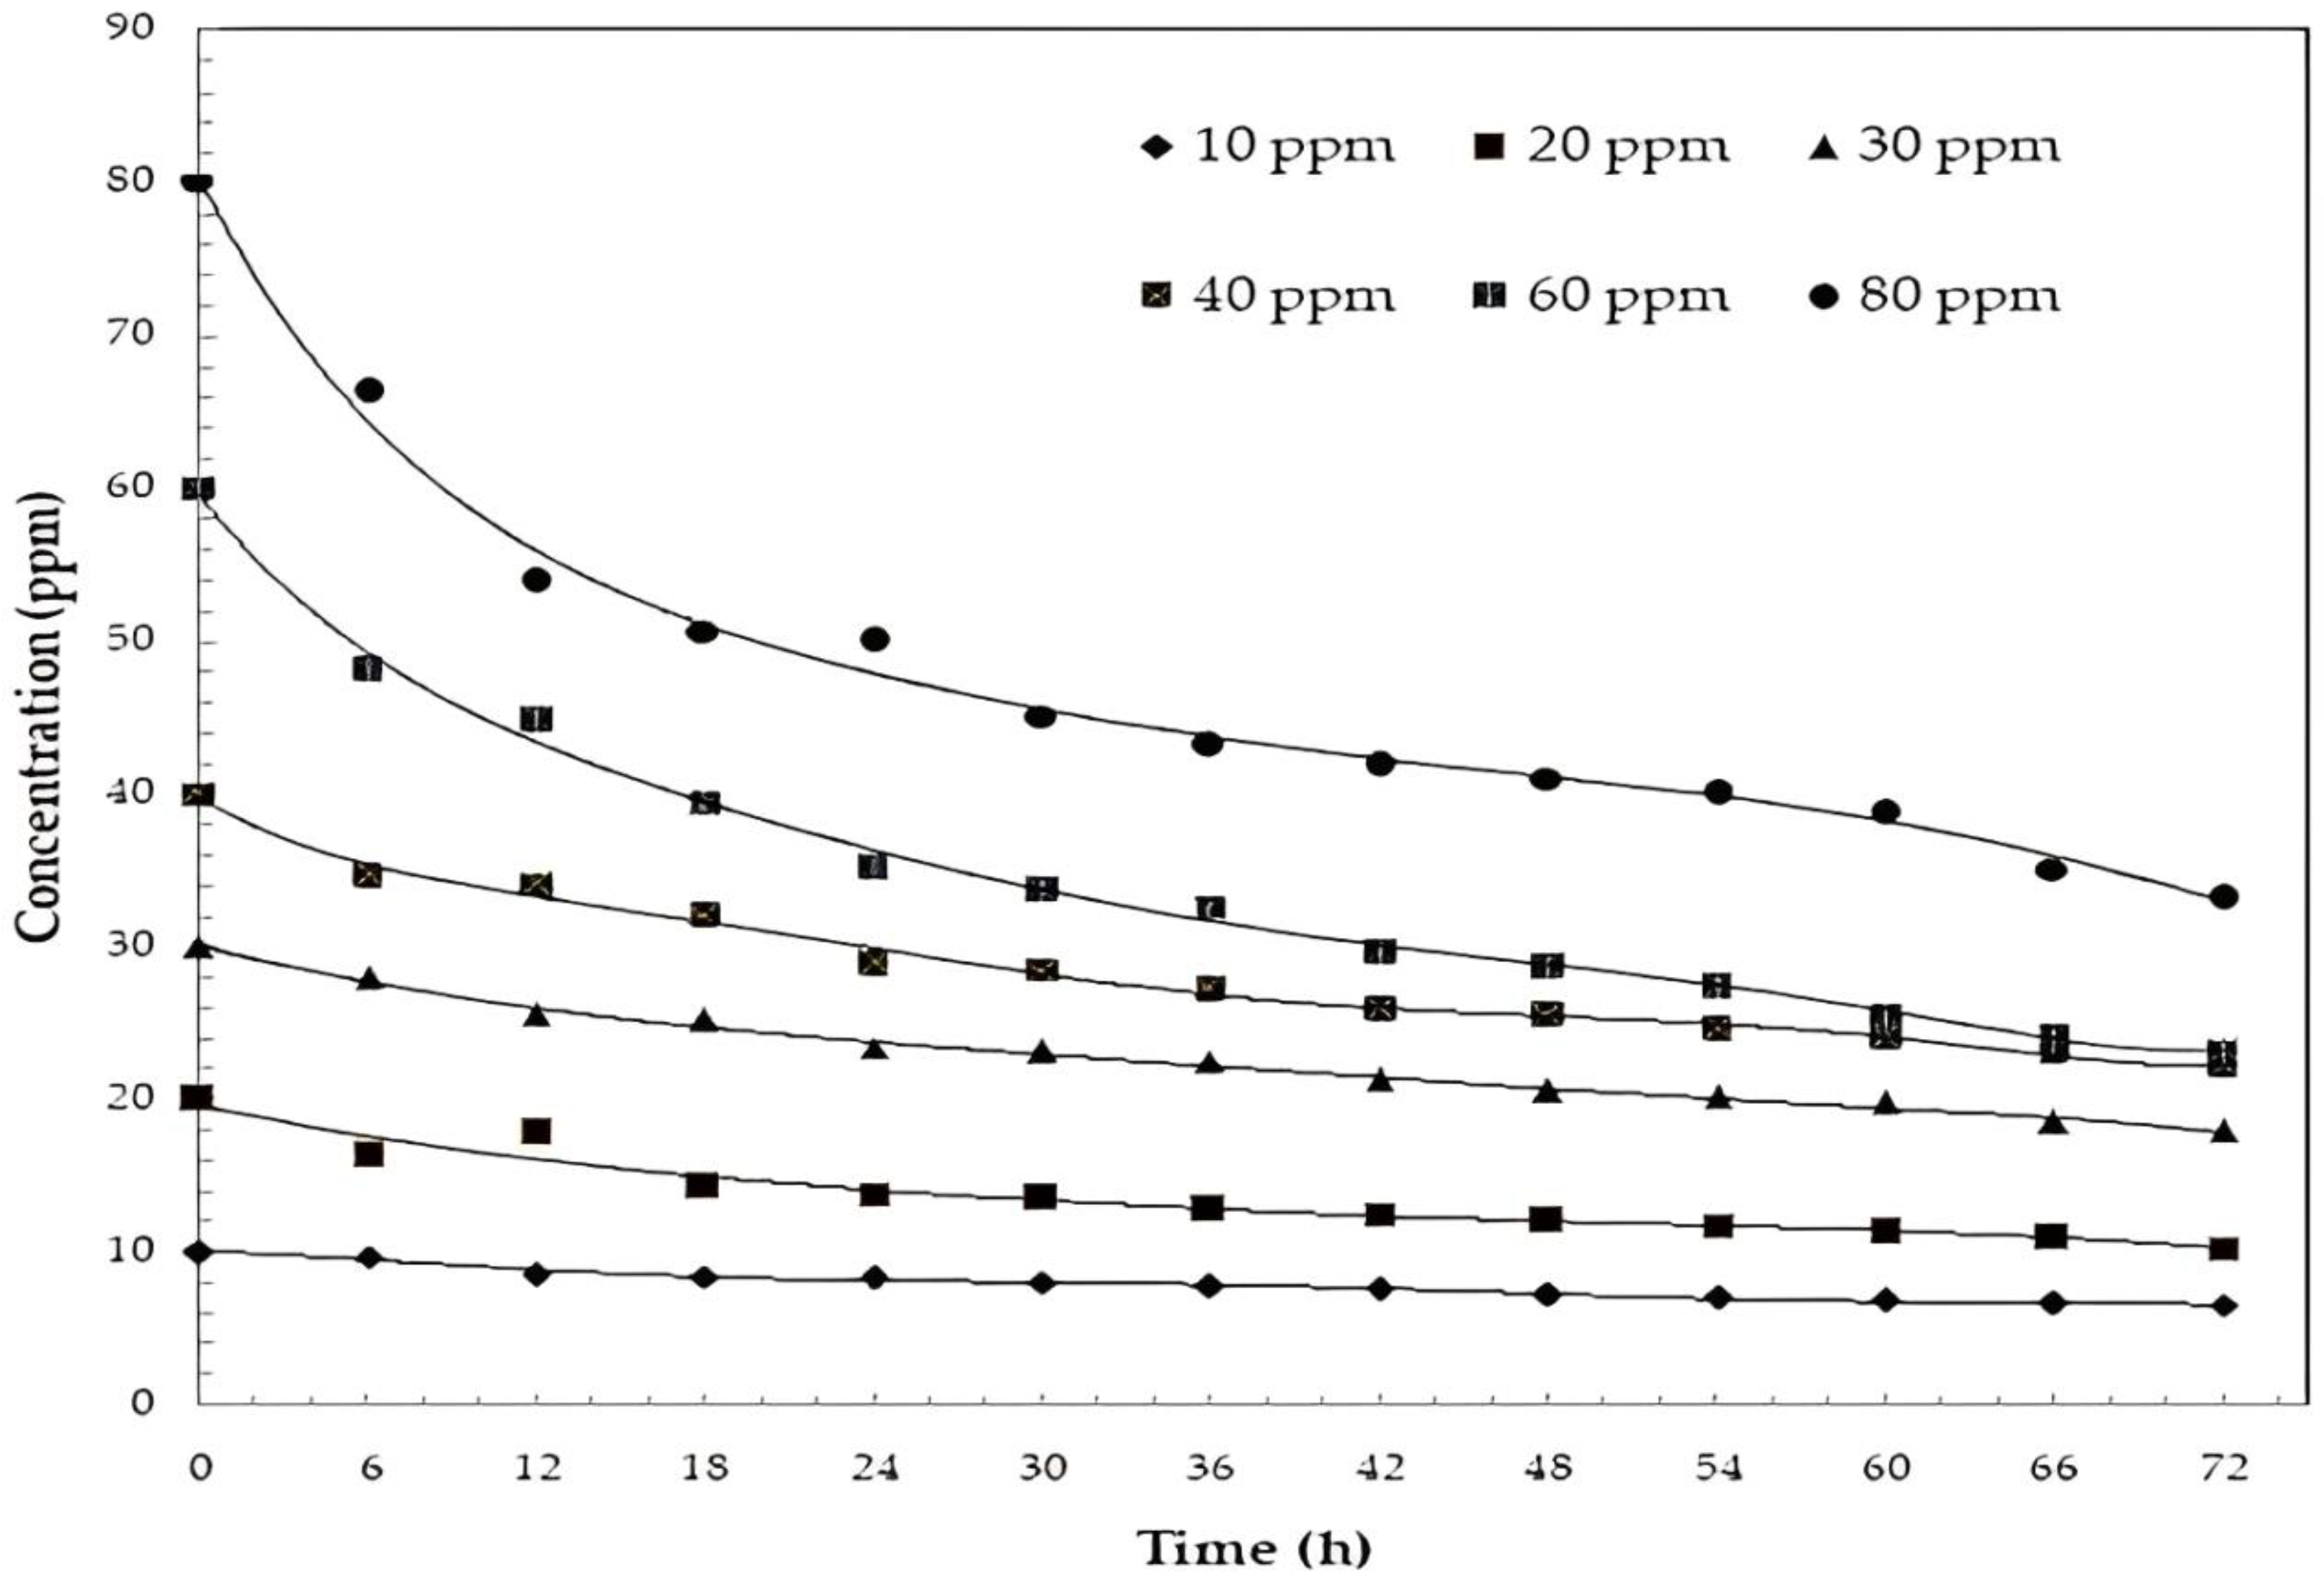
Figure 6 shows how the different initial concentrations used decreased over time. In the cases of 60 and 80 ppm, after 24 h, sufficient hydroxyl radicals were produced to attack the molecule. After 18 h in the case of the reaction, a 32% decrease was noted, and as time progressed up to 72 h, this decrease was constant but more minor. This may have been due to the increase in the intermediate compounds that were less susceptible to photo-oxidation.
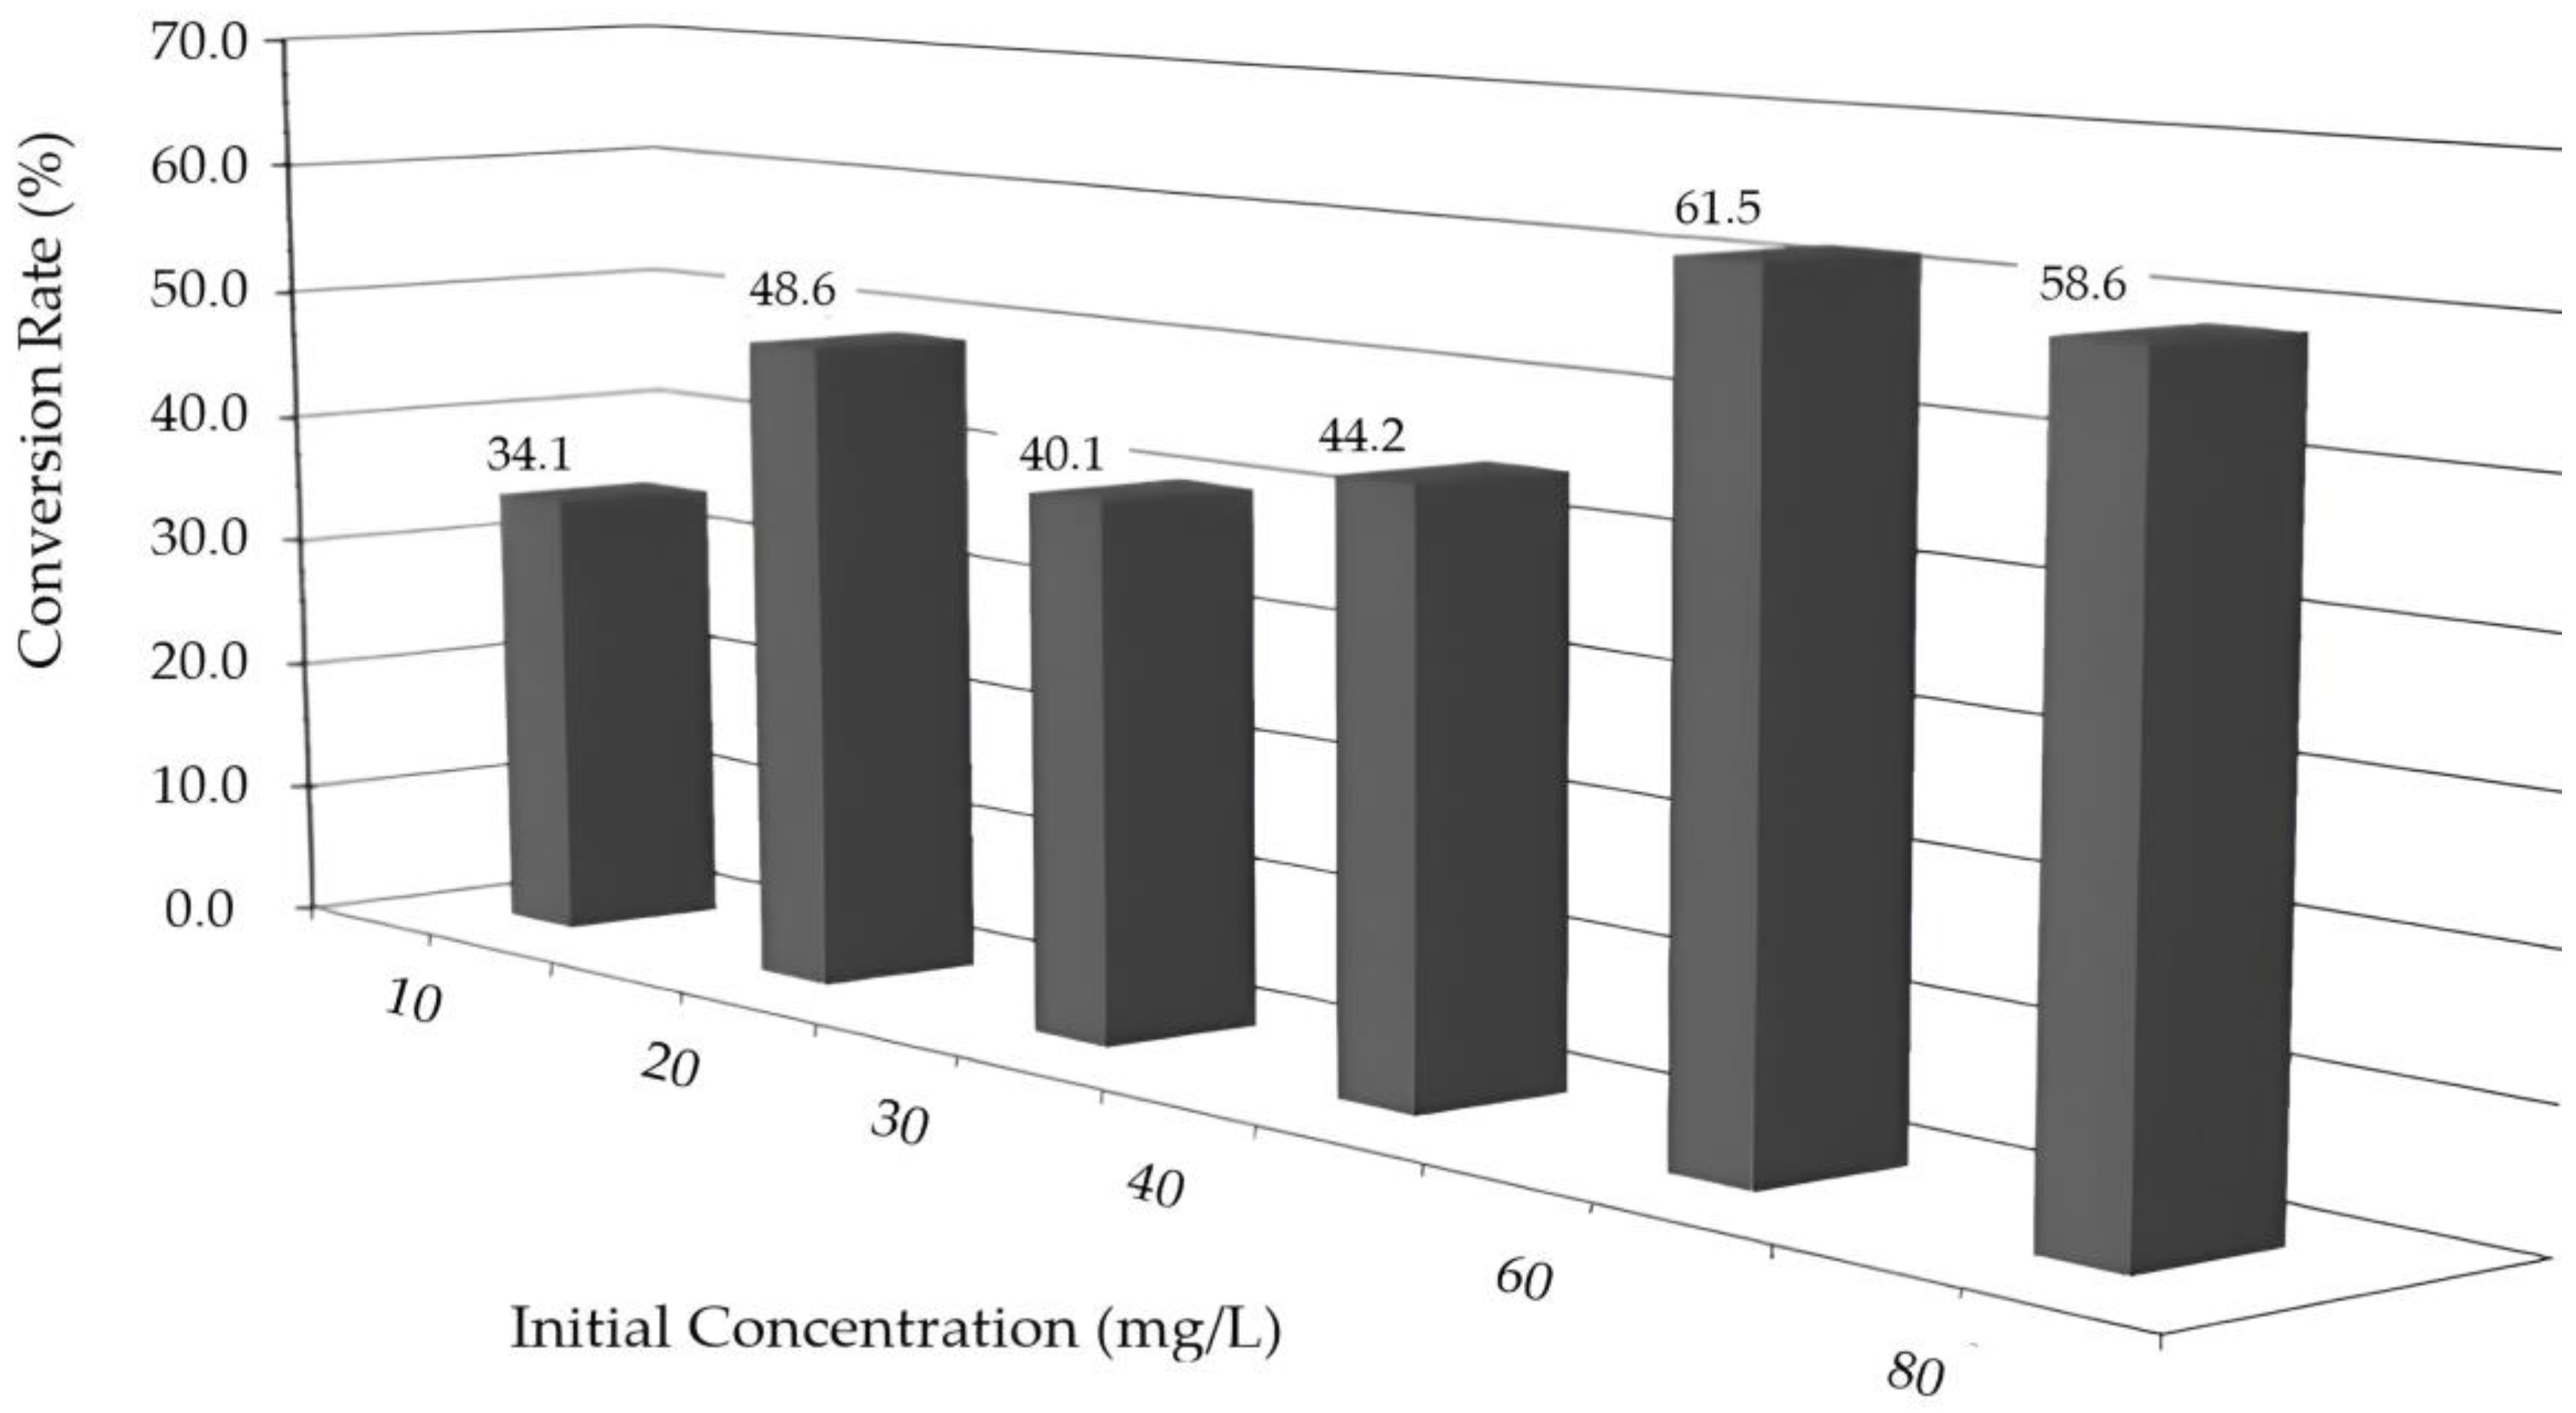
Figure 7 shows the percentage degradation values determined using Equation (4):
% conversion = (1 − Cf/Ci) × 100
where Cf—final concentration and Ci—initial concentration
Figure 7 shows that at low concentrations, the efficiencies were, on average, the same at 40%, which could have been because when the concentration of the organic compound was low, the intermediate compounds were more abundant and more complex and could compete with the main molecule to be oxidized. Meanwhile, at high concentrations (60 and 80 ppm), the pyridine molecule was easily oxidized by the hydroxyl radicals formed, which monopolized most of it considering that natural lights were used.

2.6. Kinetic Analysis

This indicated that the photocatalytic oxidation reactions followed Langmuir–Hinshelwood-type kinetics [9,38,39,40,41], as follows:
r a = dC dt = K 1 C 1 + K 2 C + K i C i
where K1C represents the kinetic term of the rate equation, K2C represents the adsorption term of the reactant, and ∑(Ki Ci) represents the adsorption term of all the intermediate products of the degradation reaction of organic compounds.
If the experimental data are analyzed for very short reaction times, the adsorption term of the intermediate products can be neglected.
Based on the above, it can be shown that the following equation can represent the general kinetic form:
r a = dC dt = K 1 C m 1 + K 2 C n
If the exponents m and n have a value of 1, the constants K1 and K2 can be determined directly from the graph of the reaction rate versus the concentration.
Equation (6) can be linearized in the manner recommended by Fogler [42] and Moctezuma [9] using the following initial conditions: t = 0, C = C0, and reaction rate, where the following equations are obtained:
r a t = 0 = K 1 C 0 1 + K 2 C 0
1 r a t = 0 = 1 + K 2 C 0 K 1 C 0 = 1 K 1 C 0 = K 2 C 0 K 1 C 0
1 r a t = 0 = 1 K 1 C 0 + K 2 K 1  
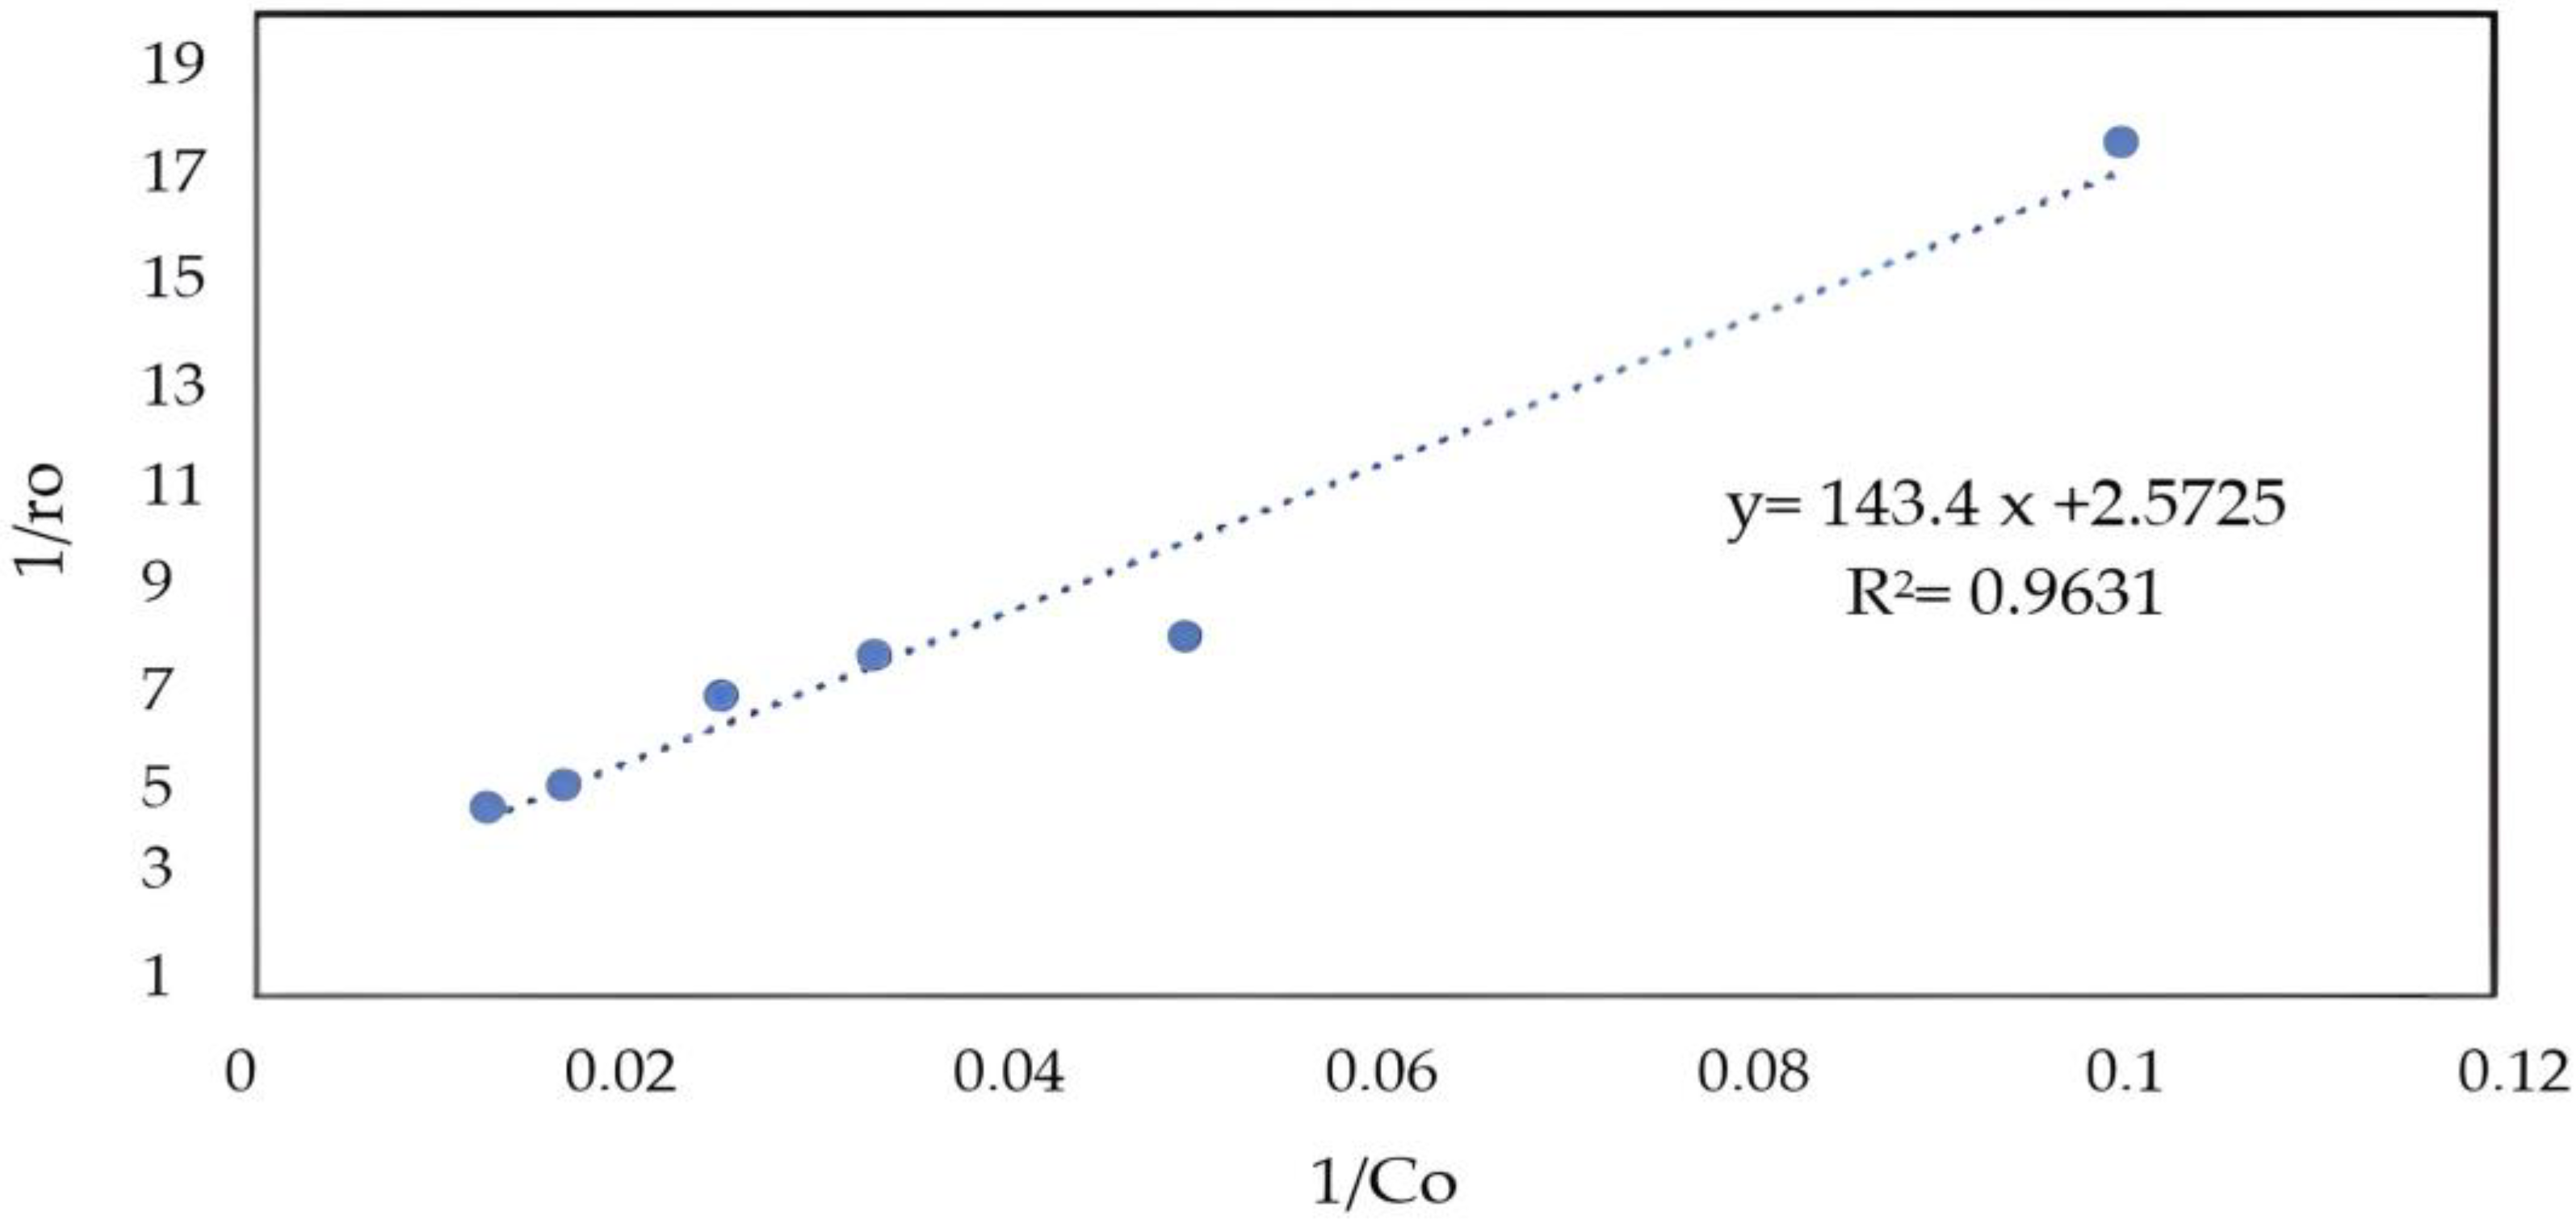
Equation (9)’s behavior is represented in Figure 8, where the ordinate at the origin is K2/K1, and the slope is given by 1/K1.
r A C = d C A C d t = K 1 C A C 1 + K 2 C A C
From the values obtained in Figure 8, we have the values of the constants, and therefore, the previous equation is expressed as follows:
r A C = 0.0069 × C A C 1 + 0.0179 × C A C
The values of the reaction constants K1 = 0.0069 h−1 is low if we compare them with the results presented by Elisa [42], but the system was a 300 mL reactor and the catalyst was only zinc oxide, where pyridine was degraded using UV lamps, and the absorption constant K2 = 0.0179 L/mg was slightly lower than the results presented by this author. But the absorption of pyridine is favorable in this system. Therefore, it can be said that the compound had a good affinity for the ZnO surface, which facilitated a closer contact with the hydroxyl radicals formed and allowed for a better photodegradation of the compound.
Figure 9 shows the behavior of the LH-HW model of experimental data and the model. The data are observed to have a behavior similar to the model.

2.7. Proposed Reaction Mechanism

The proposed mechanism for pyridine follows the formation pathway of 2-hydroxy pyridine until the double bonds are weakened and the ring cycle of this compound is broken. It can be assumed that carboxylic acids and other acids are formed.
The experimental results show the formation of 2-hydroxypyridine in the first instance. The inspection of the charged resonance forms suggested that the electron density on the alpha and gamma carbon atoms was especially low; consequently, a beta substitution was expected, also because this position was the only one in which the transition state in the substitution did not have a resonance form with a charge on the trivalent nitrogen.
Once 2-hydroxy pyridine is formed, it can lead to the formation of 2,3-dihydropyridine, but according to the results of the gas mass study, 2,6-dihydropyridine was formed. This weakens the benzene ring, leading to the weakening of the carbon–nitrogen bond, thus forming the monoamine of 3-pentanoic acid or 3-amino pentanoic acid.
Many agree that the next step is the formation of succinic acid or, where appropriate, glutamic acid before it breaks down into carboxylic acid compounds or other derivatives.
Subsequently, the formations of the compound’s acetic acid, butyl ester, and 2-butoxy ethanol were observed.
The proposed mechanism is shown in Figure 10, supported by the gas mass analyses.

3. Methodology

3.1. Reagents and Chemicals

Aldrich brand Al2O3 oxide with 99.9% purity and Aldrich brand ZnO were used. For the pH adjustment, Aldrich brand pyridine, sulfuric acid, and sodium hydroxide solutions were used (Aldrich: St. Louis, MO, USA).

3.2. Analytical Methods

3.2.1. Rotating Photo-Disk Reactor (RPR)

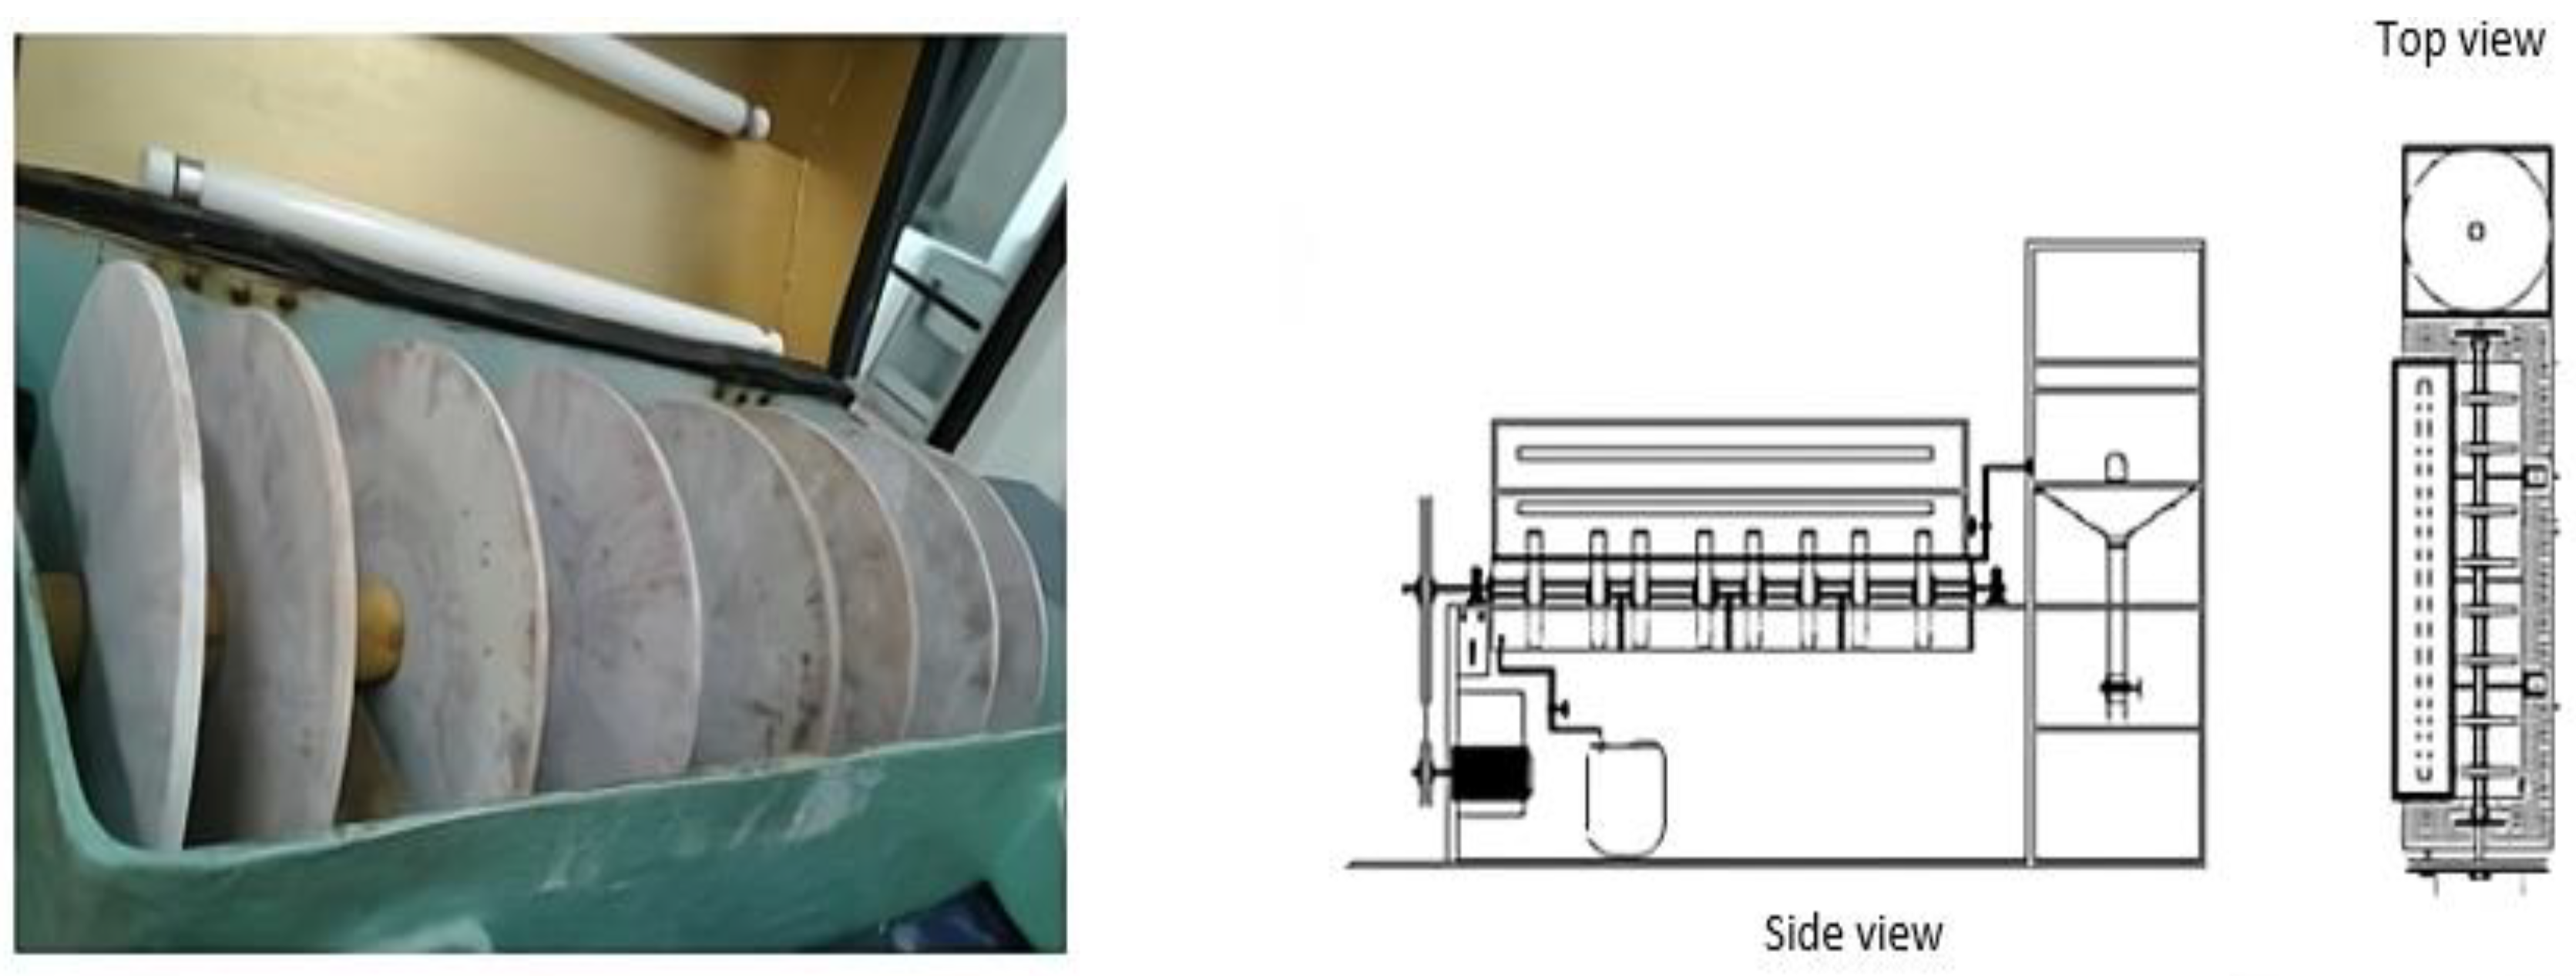
For the degradation of pyridine, a rotating photo-disk reactor (RPR) was used, which consisted of 4 stages with 2 disks each. The RPR had a total capacity of 14.8 L and, for each stage, a capacity of 3.7 L; it had a tubular structure support that was 0.58 m wide by 1 m high and 1.35 m long. Each stage had an exit at the bottom of the reactor for sampling.
The RPR was a semi-cylindrical fiberglass tub with a height of 0.31 m and a radius of 0.17 m. Inside the tub, three fiberglass bulkheads divided the reactor into separate stages. The reactor cover was made of stainless steel and measured 0.30 m wide by 0.60 m long. Mounted on the cover were three 15-watt artificial visible light lamps strategically positioned to illuminate each stage, as illustrated in Figure 11.
The RPR disks were moved by a series of pulleys connected to a stainless-steel shaft, which achieved a speed of 55 rpm. This system worked with a Dayton brand motor of 1/8 hp, 115 W, with a capacity of 1075 rpm and 1.9 amps.
The reactor disks, which had a diameter of 0.23 m and a thickness of 0.008 m, were impregnated with zinc oxide and doped with Al3+ metallic nanoparticles. The reactor characteristics are summarized in Table 1.

3.2.2. Doping Process

Clay discs with a diameter of 0.23 m and a thickness of 0.008 m were used. As a first step, the discs were placed in a muffle furnace that had reached 550 °C to eliminate the organic matter residue.
The discs were impregnated with a solution of distilled water and zinc oxide. They were then calcined in a muffle furnace at 550 °C for one hour to improve the catalyst’s adhesion to the clay surface.
The photo-deposition technique was used for the ZnO doping using hydrated aluminum sulfate. A 15 L solution was prepared with a concentration of 300 ppm of Al3+. The disks were mounted on the reactor shaft, UV light lamps with a wavelength of 365 nm and 15 watts of power were turned on and allowed to irradiate for 4 h to photo-dope the disks with Al3+ particles, and then the disks were placed in the muffle at 550 °C for 1 h [43,44].

3.3. Catalyst Characterization Tests

3.3.1. SEM Tests

Scanning electron microscopy (SEM) is a technique by which it is possible to conclude whether the synthesis of the catalyst and the doping agent has been successful [45]. A JEOL 7600F electron microscope (Akishima, Japan), which was of Japanese origin and operated at 10 kV, was used for this. The samples were analyzed at the Autonomous University of Mexico, Mexico City. The elemental composition was determined utilizing the Oxford INCA X EDX bench, (Oxford Instruments, Abingdon, Oxfordshire, UK) using the JEOL 7600F operated at 10 kV, and the samples were prepared on carbon tape.
This analysis provided information on the sample’s composition by providing the percentages of the ZnO catalyst on the support and the presence of aluminum metal ions.

3.3.2. Diffuse Reflectance

To estimate the forbidden band width (Eg), the catalyst was analyzed utilizing a Thermo Scientific Evolution 600 UV spectroscope (Waltham, MA, USA) of USA origin equipped with an ISR-2200 integrating sphere. First, a magnesium oxide blank was analyzed, and then the samples were analyzed in the 200 to 800 nm range. These analyses were developed at the Autonomous University of San Luis Potosi, San Luis Potosi, Mexico.

3.3.3. X-Rays

The photocatalyst was characterized by X-ray diffraction (XDR) to determine the chemical phases and crystallographic properties of the synthesized material [35]; it was carried out using a Bruker D8 advanced X-ray diffractometer made in Karlsruhe, Germany with a 1.54 A copper tube (35 kV, 25 mA) as an X-ray source. The scanning was carried out between 10° and 70° (2 theta) with a step size of 0.03°/s. These analyses were developed at the Metropolitan Autonomous University, Iztapalapa, Mexico City.
To determine the synthesized material’s chemical phases and crystallographic properties [46], in most processes, the effective use of nanocatalysts depends on the particle size and ease of manipulation. Therefore, it is of vital importance to characterize them using effective methods at low cost [47].

3.3.4. Raman

Raman microscopy characterized the chemical structure of the undoped and doped zinc oxide. This process was carried out on equipment that used a 785 nm laser and a QE65000 Raman detector from Ocean Optics (Dunedin, FL, USA). This equipment was a homemade assembly in the engineering laboratory of the Autonomous University of Carmen. A 785 nm infrared laser with a laser power of 75 mW was used for undoped ZnO oxide, but for doped ZnO, a laser power of 25 mW was used.

3.4. Preparation of Pyridine Solutions

Pyridine stock solutions with 1000 ppm were prepared, and from these, different dissolutions were made with concentrations of 10, 20, 30, 40, 60, and 80 ppm, where 14.8 L that was the total operating capacity of the photo-reactor for each concentration handled.
The following equation (Equation (12)) was used to find the relationship and prepare the solutions (10, 20, 30, 40, 60, and 80 ppm) of pyridine:
C1V1 = C2V2
where C—concentration and V—volume.

3.5. Degradation Tests

The degradation of pyridine was carried out for 72 h, with samples taken continuously every 6 h; an approximately 5 mL aliquot was taken in clean, dry, and labeled amber vials for later analysis using UV–vis Carry 60 spectrometer (Agilent, Santa Clara, CA, USA) and high-performance liquid chromatography (HPLC).
Initially, a pyridine sample was scanned to identify the maximum absorption peak and wavelength. Scans were performed on each sample taken from a wavelength of 200 to 500 nm. Likewise, HPLC was used to analyze each sample.

3.6. Gas Masses

Gas chromatography–mass spectroscopy (GC-MS) is a technique that combines the separation capacity of gas chromatography with the sensitivity and selective capacity of a mass detector. This combination allows for the analysis and quantification of trace compounds in complex mixtures with high effectiveness.
This technique is used for the separation of volatile and semi-volatile organic compounds. It consists of vaporizing the sample and injecting it into a capillary chromatographic column.
Elution occurs by the flow of a mobile phase of an inert gas that transports the analytes through the column. The analytes are retained reversibly because of a physical adsorption process. The separated components are eluted from the column and recorded by an MS detector, which obtains a mass spectrum that represents the abundance of different types of ions based on the mass/charge ratio.
The use of GC-MS is restricted to separating compounds with a molecular weight of less than 1000 and a maximum working temperature of about 400 °C.
For this technique, an Agilent 6890N Network GC System gas chromatograph with an Agilent 5973 MSD mass detector (quadrupole) made in the Santa Clara, CA, USA, a DB5-MS column (30 m × 0.25 mm × 0.25 μm), and a split/splitless purge and trap injector (Teledyne Tekmar, Mason, OH, USA) were used. The experiments were carried out at the Faculty of Chemistry of the Autonomous University of Carmen, Mexico.
For this, a temperature ramp that increased by 10 °C every minute until it reached 250 °C was used. This temperature was maintained for 3 min, and then an increase of 10 °C was managed until it reached 355 °C and was maintained for 10 min. The ACQ method CIQ was used, which has already been established.

4. Conclusions

The doping of zinc oxide with aluminum (Al3+) significantly modified its electronic properties, as demonstrated by a decreased band gap from 3.25 eV to 3.08 eV. The EDS and X-ray analyses corroborated the incorporation of the dopant in a proportion of 4.1% by weight. This structural modification, induced by doping, improved the capacity of the material to absorb visible light and, therefore, increased its photocatalytic activity under natural light illumination conditions. On the other hand, this catalyst was suitable for pyridine degradation, which achieved degradations of up to 61.8% for high concentrations and 48.6% for low concentrations, which we concluded was due to the affinity of pyridine for the catalyst surface due to the presence of aluminum.
What was also observed in the values of the determined reaction constants was that the value of the absorption constant (K2 was 0.0179) was much greater than that of the reaction constant (K1 of 0.0069), confirming this observed behavior.
According to these results, the degradation kinetic constants followed pseudo-first-order kinetics, which fit perfectly with the LH-HW model for photocatalytic degradation.
The proposed mechanism was based on the formation of hydroxylated compounds, where hydroxyl radicals attack the pyridine ring in the ortho, meta, and para positions for the subsequent rupture of the pyridine ring and the formation of various species until reaching carboxylic acids, carbon monoxide, and water.
The aluminum-doped zinc oxide exhibited photocatalytic activity under natural light and achieved pyridine degradation within 72 h. The experiments were carried out in a rotating photo-disk reactor, where the catalyst was immobilized on clay disks. This system, with a working volume of 14.8 L and a contact area of 329.7 m2, was adequate for contaminant degradation.

Author Contributions

The contributions of the authors for this manuscript were the following: conceptualization: C.M.; methodology, C.M.; investigation, C.M., C.A.A. and E.L.; resources, J.G.C. and R.M.C.; writing—original draft preparation, C.M.; writing—review and editing, J.G.C., R.M.C., C.M. and E.L.; supervision, J.G.C., R.M.C. and C.M.; project administration, J.G.C., R.M.C. and C.M.; funding acquisition, J.C.R., and A.R. All authors have read and agreed to the published version of the manuscript.

Funding

This work was supported by UNACAR with support from the project registered under number CIPIINOVA/2023/02.

Data Availability Statement

The data presented in this study is available on request from the corresponding author.

Conflicts of Interest

The authors declare that this research was conducted in the absence of any commercial or financial relationships that could be construed as a potential conflict of interest.

References

  1. Koe, W.S.; Lee, J.W.; Chong, W.C.; Pang, Y.L.; Sim, L.C. An overview of photocatalytic degradation: Photocatalysts, mechanisms, and development of photocatalytic membrane. Environ. Sci. Pollut. Res. 2020, 27, 2522–2565. [Google Scholar] [CrossRef] [PubMed]
  2. Careghini, A.; Mastorgio, A.F.; Saponaro, S.; Sezenna, E. Bisphenol A, nonylphenols, benzophenones, and benzotriazoles in soils, groundwater, surface water, sediments, and food: A review. Environ. Sci. Pollut. Res. 2015, 22, 5711–5741. [Google Scholar] [CrossRef]
  3. Santhi, K.; Manikandan, P.; Rani, C.; Karuppuchamy, S. Synthesis of nanocrystalline titanium dioxide for photodegradation treatment of remazol brown dye. Appl. Nanosci. 2015, 5, 373–378. [Google Scholar] [CrossRef]
  4. Bello, M.M.; Raman, A. Adsorption and Oxidation Techniques to Remove Organic Pollutants from Water. In Green Adsorbents for Pollutant Removal; Springer: Cham, Switzerland, 2018; pp. 249–300. Available online: https://www.researchgate.net/publication/326012580_Adsorption_and_Oxidation_Techniques_to_Remove_Organic_Polltants_from_Water (accessed on 20 March 2025).
  5. Grigor’eva Nellya, G.; Filippova Nadezhda, A.; Tselyutina Marina, I.; Kutepov Boris, I. Synthesis of pyridine and methylpyridines over zeolite catalysts. Appl. Petrochem. Res. 2015, 5, 99–104. [Google Scholar] [CrossRef]
  6. Ashok, B.; Hariram, N.; Siengchin, S.; Rajulu, A.V. Modification of tamarind fruit shell powder with in situ generated copper nanoparticles by single step hydrothermal method. J. Bioresour. Bioprod. 2020, 5, 180–185. [Google Scholar] [CrossRef]
  7. Frolov, N.A.; Vereshchagin, A.N. Piperidine Derivatives: Recent Advances in Synthesis and Pharmacological Applications. Int. J. Mol. Sci. 2023, 24, 2937. [Google Scholar] [CrossRef] [PubMed]
  8. Marinescu, M.; Popa, C.-V. Pyridine Compounds with Antimicrobial and Antiviral Activities. Int. J. Mol. Sci. 2022, 23, 5659. [Google Scholar] [CrossRef]
  9. Moctezuma, E.; López, M.; Zermeño, B. Reaction pathways for the photocatalytic degradation of phenol under different experimental conditions. Rev. Mex. Ing. Química 2016, 15, 129–137. [Google Scholar]
  10. Elsayed, M. Successive advanced oxidation of pyridine by ultrasonic irradiation: Effect of additives and kinetic study. Desalination Water Treat. 2015, 53, 57–65. [Google Scholar] [CrossRef]
  11. Aguilar, U.C.; Anguebes, F.F.; Cerón, B.J.; Cerón, B.R.; Córdova-Quiroz, A.V.; Montalvo-Romero, C.; Rangel-Marrón, M.; Robles-Heredia, J.C.; y Zavala-Loría, J.C. Tópicos Selectos de Ingeniería Química; UNACAR: Campeche, México, 2012. [Google Scholar]
  12. Song, K.K.; Chen, J.; Song, Y. The degradation of pyridine wastewater by ozonation catalyzed by calcined zinc-magnesium-aluminum hydrotalcites. J. Beijing Univ. Chem. Technol. 2021, 8, 8–15. [Google Scholar] [CrossRef]
  13. Swarnakar, P.; Kanel, S.R.; Nepal, D.; Jiang, Y.; Jia, H.; Kerr, L.; Goltz, M.N.; Levy, J.; Rakovan, J. Silver deposited titanium dioxide thin film for photocatalysis of organic compounds using natural light. Sol. Energy 2013, 88, 242–249. [Google Scholar] [CrossRef]
  14. Czech, B.; Rubinowska, K. TiO2-assisted photocatalytic degradation of diclofenac, metoprolol, estrone and chloramphenicol as endocrine disruptors in water. Adsorption 2013, 19, 619–630. [Google Scholar] [CrossRef]
  15. Kaur, A.; Gupta, G.; Ibhadon, A.O.; Salunke, D.B.; Sinha, A.; Kansal, S.K. A Facile synthesis of silver modified ZnO nanoplates for efficient removal of ofloxacin drug in aqueous phase under solar irradiation. J. Environ. Chem. Eng. 2017, 6, 3621–3630. [Google Scholar] [CrossRef]
  16. El Nemr, A.; Helmy, E.T.; Gomaa, E.A.; Eldafrawy, S.; Mousa, M. Photocatalytic and Biological Activities of Undoped and Doped TiO2 Prepared by Green Method for Water Treatment. J. Environ. Chem. Eng. 2019, 7, 103385. [Google Scholar] [CrossRef]
  17. Rahman, M.M.; Khan, S.B.; Asiri, A.M.; Alamry, K.A.; Khan, A.A.P.; Khan, A.; Rub, M.A.; Azum, N. Acetone sensor based on solvothermally prepared ZnO doped with Co3O4 nanorods. Microchim. Acta 2013, 180, 675–685. [Google Scholar] [CrossRef]
  18. Islam, M.T.; Jing, H.; Yang, T.; Zubia, E.; Goos, A.G.; Bernal, R.A.; Botez, C.E.; Narayan, M.; Chan, C.K.; Noveron, J.C. Fullerene Stabilized Gold Nanoparticles Supported on Titanium Dioxide for Enhanced Photocatalytic Degradation of Methyl Orange and Catalytic Reduction of 4-Nitrophenol. J. Environ. Chem. Eng. 2018, 6, 3827–3836. [Google Scholar] [CrossRef]
  19. Sharma, D.K.; Shukla, S.; Sharma, K.K.; Kumar, V. A review on ZnO: Fundamental properties and applications. Mater. Today Proc. 2022, 49, 3028–3035. [Google Scholar] [CrossRef]
  20. He, R.; Hocking, R.K.; Tsuzuki, T. Local structure and photocatalytic property of sol–gel synthesized ZnO doped with transition metal oxides. J. Mater. Sci. 2012, 47, 3150–3158. [Google Scholar] [CrossRef]
  21. Binjhade, R.; Mondal, R.; Mondal, S. Continuous photocatalytic reactor: Critical review on the design and performance. J. Environ. Chem. Eng. 2022, 10, 107746. [Google Scholar] [CrossRef]
  22. Sundar, K.P.; Kanmani, S. Progression of Photocatalytic reactors and it’s comparison: A Review. Chem. Eng. Res. Des. 2020, 154, 135–150. [Google Scholar] [CrossRef]
  23. Mosleh, S.; Ghaedi, M. Chapter 13—Photocatalytic reactors: Technological status, opportunities, and challenges for development and industrial upscaling. Interface Sci. Technol. 2021, 32, 761–790. [Google Scholar] [CrossRef]
  24. Molinari, R.; Severino, A.; Lavorato, C.; Argurio, P. Which Configuration of Photocatalytic Membrane Reactors Has a Major Potential to Be Used at an Industrial Level in Tertiary Sewage Wastewater Treatment? Catalysts 2023, 13, 1204. [Google Scholar] [CrossRef]
  25. Sannino, D.; Morante, N.; Sacco, O.; Mancuso, A.; De Guglielmo, L.; Di Capua, G.; Femia, N.; Vaiano, V. Visible light-driven degradation of Acid Orange 7 by light modulation techniques. Photochem. Photobiol. Sci. 2023, 22, 185–193. [Google Scholar] [CrossRef]
  26. Chakravorty, A.; Roy, S. A review of photocatalysis, basic principles, processes, and materials. Sustain. Chem. Environ. 2024, 8, 100155. [Google Scholar] [CrossRef]
  27. Hassaan, M.A.; El-Nemr, M.A.; Elkatory, M.R.; Ragab, S.; Niculescu, V.-C.; El Nemr, A. Principles of Photocatalysts and Their Different Applications: A Review. Top. Curr. Chem. 2023, 381, 31. [Google Scholar] [CrossRef]
  28. Hassard, F.; Biddle, J.; Cartmell, E.; Jefferson, B.; Tyrrel, S.; Stephenson, T. Rotating biological contactors for wastewater treatment—A review. Process. Saf. Environ. Prot. 2015, 94, 285–306. [Google Scholar] [CrossRef]
  29. Cortez, S.; Teixeira, P.; Oliveira, R.; Mota, M. Rotating biological contactors: A review on main factors affecting performance. Rev. Environ. Sci. Bio/Technol. 2008, 7, 155–172. [Google Scholar] [CrossRef]
  30. Boiarkina, I.; Norris, S.; Patterson, D.A. Investigation into the effect of flow structure on the photocatalytic degradation of methylene blue and dehydroabietic acid in a spinning disc reactor. Chem. Eng. J. 2013, 222, 159–171. [Google Scholar] [CrossRef]
  31. Imayama, S. Studies of the Rotating-Disk Boundary-Layer Flow. Technical Reports from Royal Institute of Technology KTH Mechanics. December 2014, Stockholm, Sweden. Available online: https://www.diva-portal.org/smash/get/diva2:781517/SUMMARY01.pdf (accessed on 6 March 2025).
  32. Imayama, S.; Alfredsson, P.H.; Lingwood, R.J. On the laminar–turbulent transition of the rotating-disk flow: The role of absolute instability. J. Fluid Mech. 2014, 745, 132–163. [Google Scholar] [CrossRef]
  33. Wang, L.; Liu, S.; Wang, Z.; Zhou, Y.; Qin, Y.; Wang, Z.L. Piezotronic Effect Enhanced Photocatalysis in Strained Anisotropic ZnO/TiO2 Nanoplatelets via Thermal Stress. ACS Nano 2016, 10, 2636–2643. [Google Scholar] [CrossRef]
  34. Porrawatkul, P.; Pimsen, R.; Kuyyogsuy, A.; Rattanaburi, P.; Nuengmatcha, P. Morphology-dependent photocatalytic performance of ZnO nanostructures in organic dye and antibiotic degradation. Int. J. Environ. Sci. Technol. 2024, 21, 7397–7414. [Google Scholar] [CrossRef]
  35. Salah, N.; Hameed, A.; Aslam, M.; Babkair, S.S.; Bahabri, F. Photocatalytic activity of V doped ZnO nanoparticles thin films for the removal of 2- chlorophenol from the aquatic environment under natural sunlight exposure. J. Environ. Manag. 2016, 177, 53–64. [Google Scholar] [CrossRef]
  36. Raliya, R.; Avery, C.; Chakrabarti, S.; Biswas, P. Photocatalytic degradation of methyl orange dye by pristine titanium dioxide, zinc oxide, and graphene oxide nanostructures and their composites under visible light irradiation. Appl. Nanosci. 2017, 7, 253–259. [Google Scholar] [CrossRef]
  37. Medellin, C.N.; Ocampo, R.; Leyva, R.R.; Sanchez-Polo, M.; Rivera-Utrilla, J.; Méndez-Díaz, J.D. Removal of diethyl phthalate from water solution by adsorption, photo-oxidation, ozonation and advanced oxidation process (UV/H2O2, O3/H2O2 and O3/activated carbon). Sci. Total Environ. 2013, 1, 26–35. [Google Scholar] [CrossRef]
  38. Montalvo, C.; Aguilar, C.; Alcoser, R.; Ramirez-Elias, M.; Cordova-Quiroz, V. Semi-Pilot Photocatalytic Rotating Reactor (RFR) with Supported TiO2/Ag Catalysts for Water Treatment. Molecules 2018, 23, 224. [Google Scholar] [CrossRef]
  39. Aguilar, C.A.; Montalvo, C.; Ceron, J.G.; Moctezuma, E. Photocatalytic Degradation of Acetaminophen. Int. J. Environ. Res. 2011, 5, 1071–1078. [Google Scholar]
  40. Fogler, H.S. Elements of Chemical Reaction Engineering, 3rd ed.; Pearson Education Limited: Hongkong, China, 1999; ISBN 9780135317167. [Google Scholar]
  41. Matthews, R.W.; McEvoy, S.R. Photocatalytic degradation of phenol in the presence of near-UV illuminated titanium dioxide. J. Photochem. Photobiol. A Chem. 1992, 64, 231–246. [Google Scholar] [CrossRef]
  42. Elisa, L.; Carlos, M.; Edgar, M.; Socorro, L. Photocatalytic degradation of pyridine in water solution using ZnO as an alternative catalyst to TiO2. J. Ceram. Process. Res. 2008, 9, 455–462. [Google Scholar]
  43. He, B.; Zhao, Q.; Zeng, Z.; Wang, X.; Han, S. Effect of hydrothermal reaction time and calcination temperature on properties of Au@CeO2 core–shell catalyst for CO oxidation at low temperature. J. Mater. Sci. 2015, 50, 6339–6348. [Google Scholar] [CrossRef]
  44. Thaha, S.K.S.M.; Nalandhiran, P.; Kaliyamoorthy, S.; Mizota, I.; Mangalaraja, R.V.; Sathishkumar, P. Critical Review of Photocatalytic Reactor Designs for Environmental Applications. In Photocatalysis for Energy and Environmental Applications. Green Energy and Technology; Sathishkumar, P., Ed.; Springer: Singapore, 2024. [Google Scholar] [CrossRef]
  45. Wang, Z.; Luo, C.; Zhang, Y.; Gong, Y.; Wu, J.; Fu, Q.; Pan, C. Construction of hierarchical TiO2 nanorod array/graphene/ZnO nanocomposites for high-performance photocatalysis. J. Mater. Sci. 2018, 53, 15376–15389. [Google Scholar] [CrossRef]
  46. Zyoud, A.; Zu’bi, A.; Helal, M.H.S.; Park, D.; Campet, G.; Hilal, H.S. Optimizing photo-mineralization of aqueous methyl orange by nano-ZnO catalyst under simulated natural conditions. J. Environ. Health Sci. Eng. 2015, 13, 46. [Google Scholar] [CrossRef]
  47. Gupta, N.; O’Loughlin, E.J.; Sims, G. Microbial degradation of pyridine and pyridine Derivatives. In Microbial Metabolism of Xenobiotic Compounds; Microorganisms for, sustainability, Arora, P., Eds.; Springer: Singapore, 2019. [Google Scholar]
Figure 1. (A) Undoped zinc oxide, (B) Al3+-doped zinc oxide, (C) close-up of the doped area, and (D) EDS results of the Al3+-doped zinc oxide.
Catalysts 15 00437 g001
Figure 2. (A) X-ray diffraction patterns for ZnO, (B) X-ray patterns comparing undoped and doped ZnO, and (C) weight percentage of each element observed by EDS analysis (ZnO-Al catalysts).
Catalysts 15 00437 g002
Figure 3. Plots showing (αhν)1/2 vs. hν for band gap determination of ZnO and ZnO-Al material.
Catalysts 15 00437 g003
Figure 4. Raman spectrum of undoped ZnO and Al3+-doped ZnO.
Catalysts 15 00437 g004
Figure 5. UV–vis spectra of pyridine with an initial concentration of 60 ppm and 72 h of reaction using 15-watt artificial natural light lamps, a rotation speed of 55 rpm, and ZnO-Al as a catalyst.
Catalysts 15 00437 g005
Figure 6. Graph of concentration vs. degradation time of pyridine during 72 h of reaction using 15-watt natural light lamps, a rotation speed of 55 rpm, and ZnO-Al as a catalyst.
Catalysts 15 00437 g006
Figure 7. Degradation percentages against initial concentration over a period of 72 h using ZnO-Al with a rotation speed of 55 rpm and natural light lamps.
Catalysts 15 00437 g007
Figure 8. Graph of 1/ro vs. 1/Co to obtain the K1 and K2 values of the LH-HW model.
Catalysts 15 00437 g008
Figure 9. Initial reaction rate as a function of the initial concentration (72 h of reaction using 15-watt natural light lamps, a rotation speed of 55 rpm, and ZnO-Al as a catalyst).
Catalysts 15 00437 g009
Figure 10. Proposed reaction mechanism for the degradation of pyridine in a rotating photonic reactor in a reaction time of 72 h using 15-watt natural light lamps, a rotation speed of 55 rpm, and ZnO-Al as a catalyst.
Catalysts 15 00437 g010
Figure 11. Schematic of the rotating photo-disk reactor (RPR).
Catalysts 15 00437 g011
Table 1. Characteristics of the rotating photo-disk reactor (RPR).
Reactor CharacteristicValue
Number of stages 4
Number of disks per stage 2
Disk diameter 0.23 m
Disk thickness 0.008 m
Total area of undoped disks 0.66476 m2
Total area of doped disks 329.7209 m2
Area per stage 41.21512 m2
Total reactor volume 14.8 L
Disclaimer/Publisher’s Note: The statements, opinions and data contained in all publications are solely those of the individual author(s) and contributor(s) and not of MDPI and/or the editor(s). MDPI and/or the editor(s) disclaim responsibility for any injury to people or property resulting from any ideas, methods, instructions or products referred to in the content.