Article

Valorization of Residual Brewery Biomass for the Production of Counter Electrodes for Dye-Sensitized Solar Cells

1
Doctorate in Sciences Engineering with Specialization in Bioprocesses, Universidad de La Frontera, Av. Francisco Salazar, Temuco 01145, Chile
2
Center of Waste Managment and Bioenergy, Scientific and Technological Bioresource Nucleus (BIOREN), Universidad de La Frontera, Av. Francisco Salazar, Temuco 01145, Chile
3
Electrical Engineering Department, Universidad de La Frontera, Av. Francisco Salazar, Temuco 01145, Chile
4
Departamento de Ciencias Químicas y Recursos Naturales, Facultad de Ingeniería y Ciencias, Universidad de La Frontera, Av. Francisco Salazar, Temuco 01145, Chile
5
Chemical Engineering Department, Universidad de La Frontera, Av. Francisco Salazar, Temuco 01145, Chile
*
Authors to whom correspondence should be addressed.
Catalysts 2025, 15(5), 433; https://doi.org/10.3390/catal15050433
Submission received: 13 March 2025 / Revised: 22 April 2025 / Accepted: 24 April 2025 / Published: 29 April 2025

Abstract

:
In this work, a biochar catalyst was developed from residual brewery spent grain (BSG) biomass and iron oxide to be applied in the counter electrode (CE) in dye-sensitized solar cells (DSSCs). The composite was obtained using a two-stage methodology based on microwave-assisted hydrothermal carbonization and pyrolysis, evaluating the influence of the pyrolysis temperature (700, 800 and 900 °C) on the properties and performance of the material. As result, composites with a high carbon and iron oxide content were obtained in a magnetite state attached to the surface. Furthermore, the physicochemical characteristics of the biochar showed similarities to those of reduced graphene oxide (rGO), which was attributed to the incorporation of iron oxide and the pyrolysis temperature. Electrochemical analysis showed that the composite pyrolyzed at 800 °C presented better catalytic activity and lower charge transfer resistance. Its application in the CE of a DSSC presented a current density of 10.44 mA/cm2 and an efficiency of 3.05%, values close to the conventional Pt catalyst in DSSCs (Pt = 4.43%). This study validates the use of a composite based on residual brewery biomass with iron oxide in a CE, making it an alternative that contributes to the recovery of residues and the generation of sustainable technologies.

Graphical Abstract

1. Introduction

In recent years, the photovoltaic (PV) market has been dominated by p-n junctions and silicon cells. However, the main disadvantage is the high manufacturing cost [1,2] mainly due to materials such as silicon, which limits their manufacture and implementation. Among the emerging PV devices are dye-sensitized solar cells (DSSCs), which offer a cost-effective solution in the renewable energy field [3,4]. Structurally, DSSCs are composed of a photoanode impregnated with a sensitized semiconductor, an electrolyte and a counter electrode (CE), where the improvement of one of them leads to an increase in the overall performance of a DSSC [5]. In this regard, the CE is considered one of the most important components in DSSCs, as it acts as a catalyst in the reduction process, which is demonstrated through the rate of reduction of the redox couple. The fast and easy diffusion of the triiodide ions ( I 3 ) will depend on the material used, its structure [6,7] and the electrocatalytic ability of the material applied in the CE, which should possess high conductivity, high chemical stability and excellent catalytic activity, as well as be low cost and environmentally friendly [8].
Platinum (Pt) is the most used catalyst in DSSCs, but its high cost, limited natural availability and poor corrosion resistance when used with iodide-triiodide ( I / I 3 ) , electrolyte have driven the search for alternative materials [9,10,11]. Carbon-based materials stand out as a promising substitute for platinum [12,13], including graphene [14], activated carbon [15], carbon nanotubes [7] and composites [8], as they have favorable electrical conductivity and high surface area, thus providing abundant electron transmission channels that lead to better catalyst performance [16]. The application of these carbon-based materials has demonstrated high efficiencies as DSSC CEs when compared to platinum, where the most recent studies are based on the application of carbon nanotubes and graphene, mainly for their good catalytic activity and electrochemical stability [17,18]. These have demonstrated efficiencies of over 14% when evaluated with cobalt (Co) based electrolytes, compared to platinum, which has achieved 11% in iodide-based electrolytes and 13% in Co-based electrolytes [19]. However, despite the advantages of these materials, their use is limited by high costs and low production yields [20]. An example of this is graphene, which has a low production yield when high-quality graphene is required [21,22]. Because of this, new ways of obtaining carbon-based materials with optimal properties to replace platinum have been developed, using low-cost and environmentally sustainable materials.
Residues produced by agriculture or forestry industries have recently been highlighted as potential feedstocks in the energy area, where their use would reduce dependence on materials from fossil resources and, at the same time, manage the biomass supply chain [23]. The use of biomass has been evaluated in DSSCs such as rice, grapefruit, coconut, aloe vera, apple and orange, among others [12,16,24,25,26]. The biomass is transformed into biochar material through methods like oxidative cyclic carbonization, hydrothermal carbonization or pyrolysis, increasing its economic value and its DSSC application [27,28,29].
Hydrothermal carbonization (HTC) is a thermochemical conversion technology that allows processing biomass at low temperatures (<350 °C) to obtain solid biochar, using sufficient pressure to keep the water in a liquid phase (<50 bar) and with relatively short processing times (ca. 30 to 120 min) [30,31]. From this treatment, a solid material (hydrochar) is obtained, with higher energy density and a higher carbon content compared to the starting feedstock. However, the traditional HTC process has some disadvantages, such as lower yield due to heat loss [32,33]. Based on this, microwave-assisted hydrothermal carbonization (MHTC) has attracted attention because it is more efficient due to the way heat is generated [32]. Microwave-assisted heating efficiently enhances HTC by selectively heating materials at the molecular level using microwave irradiation. This radiation penetrates the material, converting the microwave energy into thermal energy internally, that is, transferring the heat from inside to the outside. It is used to alter the structures of lignocellulosic biomass, where pretreatment with this method accelerates hydrolysis and favors strong depolymerization. Additionally, pyrolysis is a thermochemical method that allows the structure to be modified from the activation temperature in the absence of oxygen, producing a biochar with a higher carbon content and a more ordered structure, thus allowing the formation of layers to give a graphitization effect [34,35,36]. However, the poor electrocatalytic activity of biochar limits its application in DSSCs as a CE material.
Using composite materials allows for a better performance of the carbon in the CE. Studies have reported that doping the carbon with a material that has a high conductivity improves the performance of DSSCs [12,37,38]. In this context, transition metal oxides have been highlighted as suitable materials for use in CE because they possess a catalytic activity similar or superior to that of Pt [39]. Among inorganic transition metal oxides, iron oxide stands out due to its characteristic properties, including low cost and non-toxicity [30]. Moreover, iron is abundant in nature and it can be found under different crystalline and stoichiometric structures; among them are α-Fe2O3 (hematite), β-Fe2O3, γ-Fe2O3 (maghemite) and Fe3O4 (magnetite). Although the results obtained with Fe2O3 are low for its individual use as a catalyst, the support provided by the carbon could increase both the electrical performance and enhance the electrochemical properties of this oxide in the counter electrode of the DSSCs [39].
The use of iron oxide/biochar composites as CE has led to improved photovoltaic and electrochemical performance of a DSSC, by increasing the active sites through modification of its physicochemical properties due to the combined effect of the catalytic activity of iron oxide and the charge transfer properties of carbon in biochar [40]. In this context, the novelty of this article is based on the combination of iron oxide and residual brewery biomass, which is in line with the concept of circular economy and which allows obtaining materials with electrochemical and charge transfer properties suitable for application in DSSCs. Thus, the objective of this work was to develop an iron oxide/biochar composite based on brewery residual biomass and iron salts treated by a sequence of thermochemical processes and its application as a CE catalyst for DSSCs.

2. Results

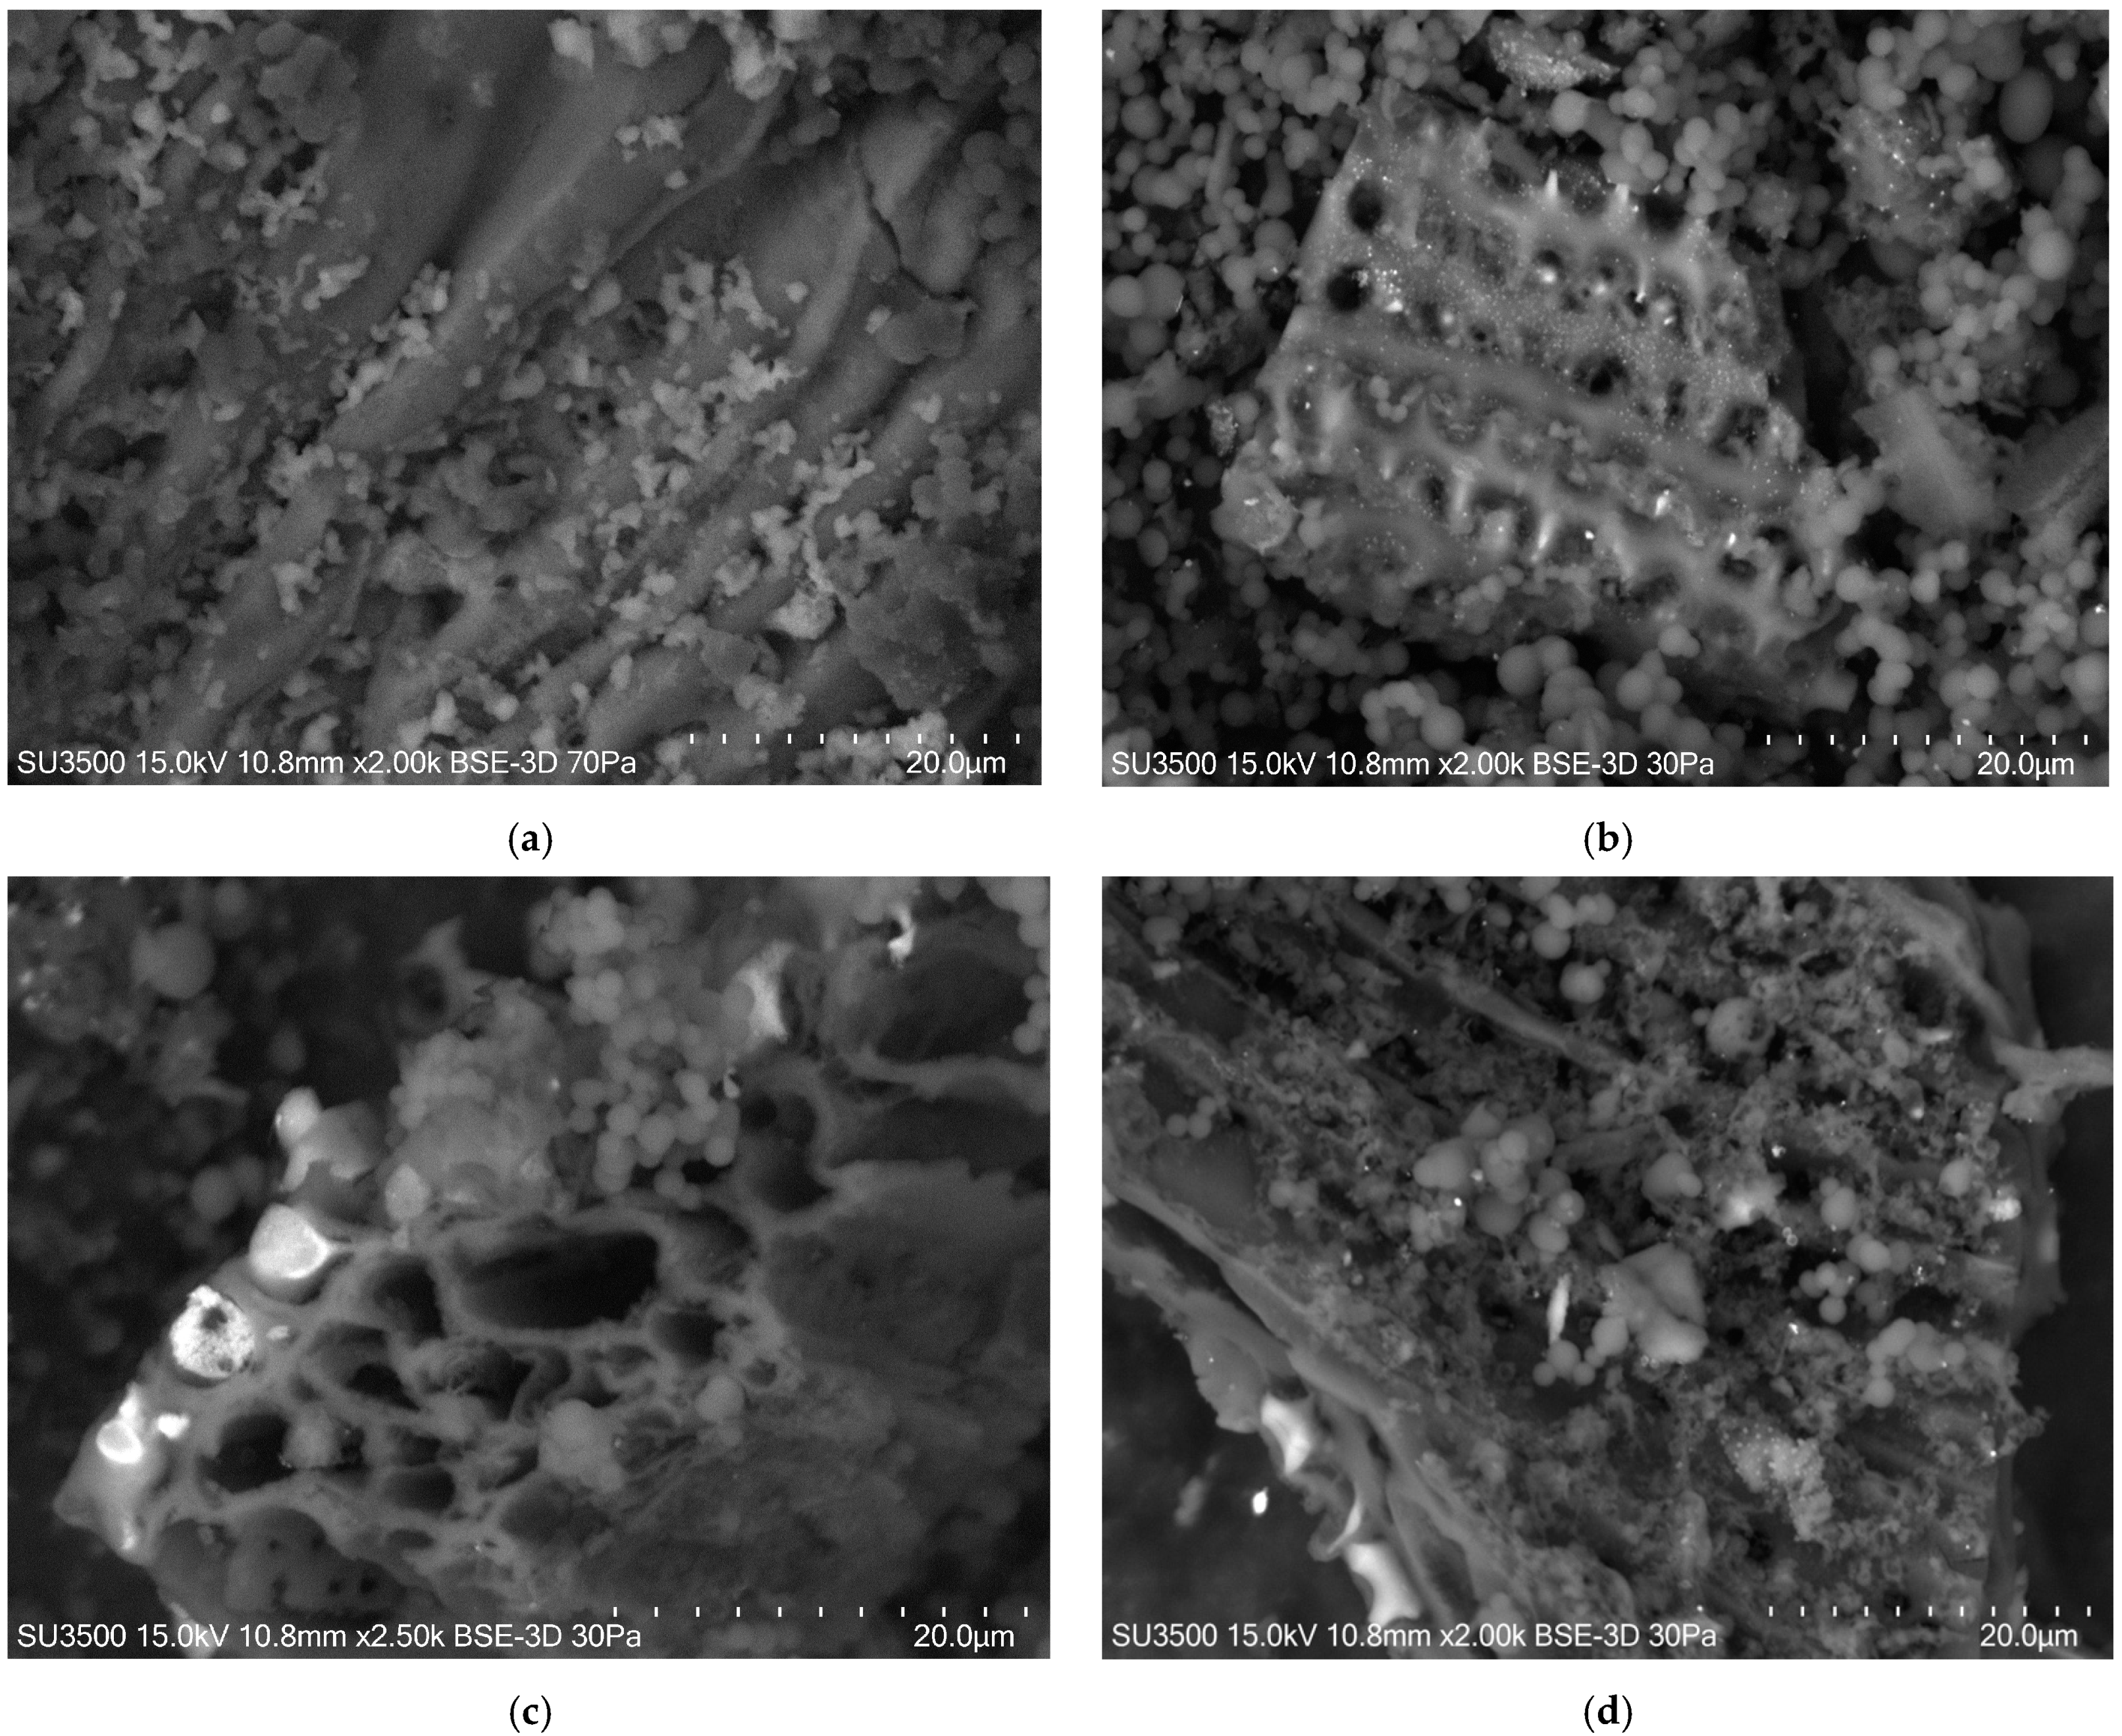
2.1. Physical and Chemical Characteristics of the Iron Oxide/Biochar Composite

Table 1 presents the elemental composition of the composites synthesized through microwave-assisted hydrothermal carbonization (MHTC) followed by pyrolysis at three different temperatures. The carbon content of the composites pyrolyzed at 700, 800 and 900 °C was 92.27%, 94.40% and 91.97%, respectively, indicating an increase in carbon content up to 800 °C, followed by a slight decrease at 900 °C. This trend aligns with findings reported by Anabalón Fuentes et al. [41], where the degree of carbon enrichment is directly related to the pyrolysis temperature. The decline at 900 °C may be attributed to iron oxidation reactions and the formation of iron oxides, which can become embedded in the carbon matrix, leading to partial carbon loss [41,42]. Furthermore, hydrogen and nitrogen exhibited a decreasing trend with increasing temperature. Hydrogen declined from 2.66% to 1.08%, while nitrogen decreased from 1.03% to 0.78%. This suggests progressive dehydrogenation and nitrogen volatilization, resulting in a more condensed and structurally ordered material with an enhanced degree of carbon enrichment [43]. The composite pyrolyzed at 700 °C had the highest iron content with a value of 1.84 wt.% and was mainly present as magnetite according to the XRD results. This changed when the composite was pyrolyzed at 800 °C, showing a drastic decrease in iron content (0.2 wt.%), with the formation of iron structures of Fe3O4 and Fe3C, also, according to Zhang et al. [44]. Species zero valent of iron can also be formed, species that cannot interact with the carbonaceous matrix and may be lost after washing the final product. In this regard, Zazo et al. [45] manufactured activated carbon catalysts using FeCl3, evaluating pyrolysis temperatures between 500 °C and 800 °C. The catalyst they produced had a low iron content, which decreased as the pyrolysis temperature increased. Before washing, the iron content was 25 wt.%, which was reduced to less than 1 wt.% after washing with HCl. Despite the low iron content, acid washing was necessary as it favored the liberation of the pores blocked during the thermochemical process without affecting the distribution of iron on the carbonaceous matrix.
The BET surface area and pore volume of the samples exhibit a significant variation with temperature. The highest surface area (110.6 m2/g) was observed for the sample pyrolyzed at 700 °C, while higher temperatures led to a substantial reduction, reaching 13.09 m2/g at 800 °C and 9.56 m2/g at 900 °C. However, the increase in pore volume (from 0.028 to 0.037 cm3/g) and slight variations in pore diameter (1.69–1.88 nm) indicate a modification in the porosity of the material, which could influence its catalytic performance. The reduction in surface area aligns with findings by Wrogemann et al. [46], who reported a similar trend during the thermochemical treatment of coke to produce graphite, where BET surface area decreased from 5.3 m2/g at 800 °C to 1.8 m2/g at higher temperatures. This phenomenon is attributed to particle size effects and basal plane area reduction. As the carbonization temperature rises, the BET surface area and the non-basal plane area, which are associated with structural defects, decline. Similarly, Sert et al. [47] investigated the production of activated carbon from cotton waste using FeCl3 as an activating agent (5–15 wt.%) and observed a decrease in surface area with increasing FeCl3 concentration; the authors attributed this to the formation of Fe2O3 and Fe3O4 on the carbon surface during pyrolysis, which blocked the pores and hindered further textural development.
The low surface areas obtained in samples pyrolyzed at 800 and 900 °C may be due to the catalytic action of the FeCl3. The sequence of the MHTC process followed by the pyrolysis led to an increase in the graphitization degree of composites, but this caused a decrease in the surface area [46]. Moreover, a higher particle size was observed at 900 °C (112.421 nm) compared with the particle size of composites developed at 700 °C (40.282 nm) and 800 °C (39.727 nm) (Table A1). The increase in particle size at high temperatures could be due to the collapse of the pores caused by the formation of iron oxides, which allowed the material to agglomerate, increasing its size and decreasing its surface area.
In a two-stage activation process, the pyrolysis temperature is crucial in optimizing biochar properties, influencing physicochemical and textural characteristics. These findings suggest that tailoring pyrolysis conditions can optimize biochar performance for application in energy generation, as a higher degree of graphitization improves structural stability as well as electrical conductivity [48], which increases the order of the carbonaceous structure of the biochar and improves the properties, which has been demonstrated with different biomasses, including brewer’s bagasse [16,49,50,51].
Figure 1 shows the SEM images of hydrochar and pyrolyzed composites at 700, 800 and 900 °C, revealing notable structural changes with increasing temperature. Figure 1a shows the structure of the hydrochar developed with FeCl3 through a microwave-assisted hydrothermal carbonization process, where some spherical particles corresponding to the decomposition of cellulose during MHTC and iron particles on the surface of the carbon structure can be observed [52]. The lignin content of brewers’ spent grain is approximately 28% [53], so due to its chemical stability partial degradation occurs, and therefore, it is still possible to identify a solid structure in the hydrochar. The developed composites exhibited pores that were not observed in the hydrochar. Figure 1b (700 °C) displays a highly porous structure with well-defined cavities, where iron oxide has adhered to the surface. In Figure 1c (800 °C), the composite exhibits a smoother surface with dispersed pores, though some appear partially obstructed by iron oxide particles, contributing to the reduction in surface area. Finally, Figure 1d (900 °C) reveals a denser, non-porous structure, where iron oxide particles are still present but embedded in a more compact matrix.
These results show the influence of pyrolysis temperature on the composition and morphology of the synthesized composite, which allowed the development of more porous structures compared to hydrochar. At pyrolysis temperatures above 800 °C, the composite transitions towards a more uniform and consolidated structure with reduced surface area, likely influenced by the prior MHTC process, which enhances material densification. Additionally, the formation and growth of iron oxide and carbon spheres contribute to pore blockage at higher temperatures.

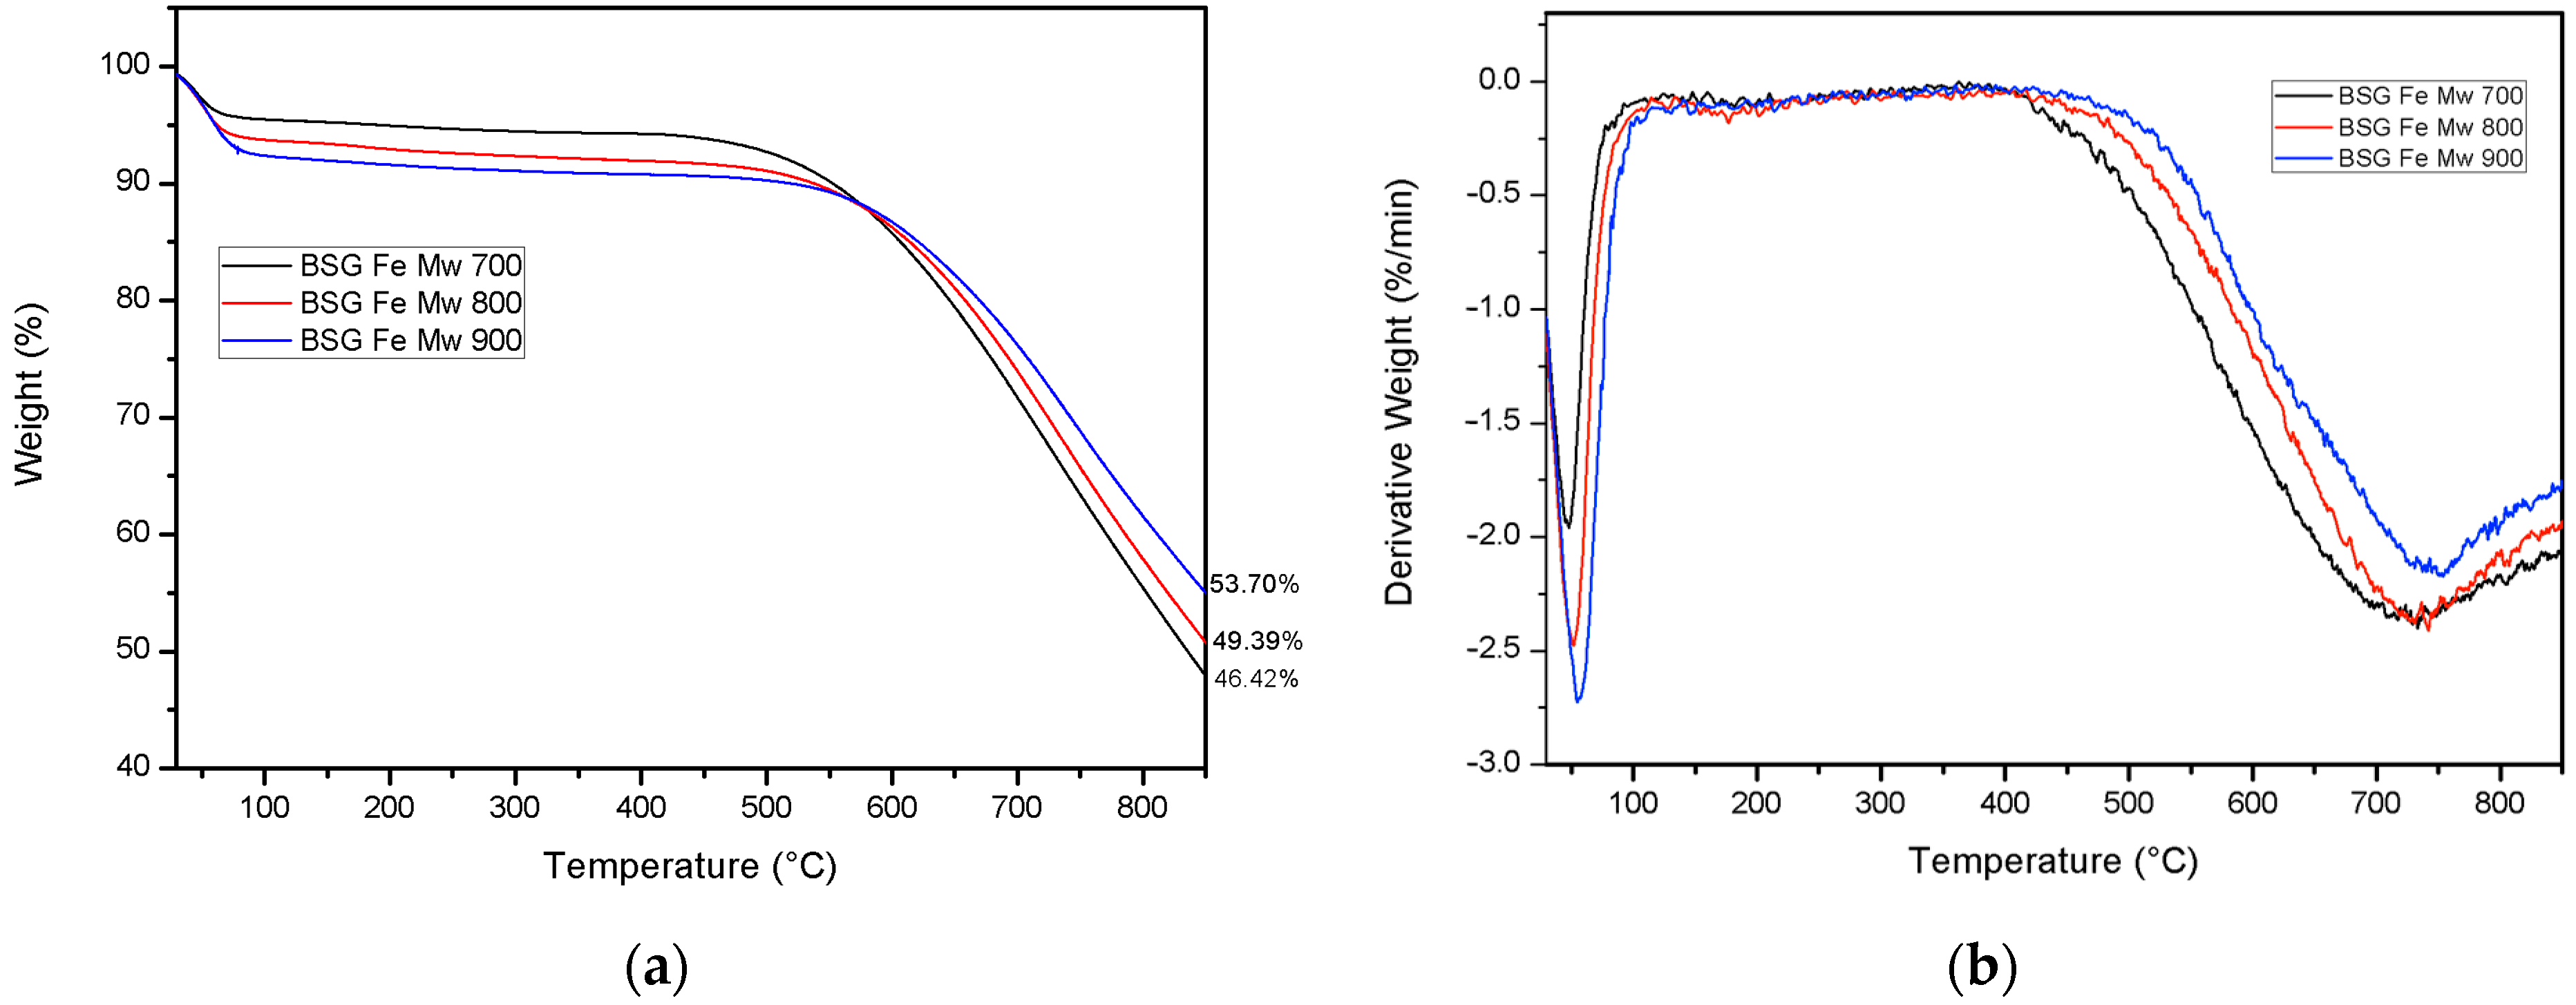
2.1.1. Thermogravimetric Analysis (TGA)

A material for a CE must be stable at high temperatures for good performance, so a TGA was performed to evaluate the thermal stability of the composite, as shown in Figure 2. Figure 2a shows the thermal decomposition of iron oxide/biochar composites pyrolyzed at 700, 800 and 900 °C, exhibiting a biochar recovery close to 50% as the pyrolysis temperature increased. The sample pyrolyzed at 700 °C showed the greatest weight loss and the sample pyrolyzed at 900 °C showed the least mass loss due to thermal degradation. However, it is possible to observe the effect of temperature on thermal stability, where the higher the temperature, the lower the mass loss due to the increase in the fixed carbon content of the samples. The results of DTG as a function of temperature of the composites (Figure 2b) showed a degradation peak at 53 °C, which would indicate that the samples had a low moisture content. The thermal stability of the developed composite could indicate that it is reduced graphene oxide (rGO). Mahendran et al. [54] reduced GO using a flower extract and obtained a highly stable rGO, demonstrating a thermogravimetric analysis with a DTG peak at 165 °C and 169 °C where the loss of hydroxyl groups and water molecules occurs. Graphene oxide starts to decompose at low temperatures, from 165 °C, while rGO decomposes at higher temperatures, between 620 °C and 950 °C, due to the few defects in the structure and its high thermal stability.
Figure 2b shows a second degradation peak at 740 °C. However, the degradation process of the three samples started at 570 °C. This could be due to the catalytic action of iron oxide on the samples during the pyrolysis process that accelerates the degradation process of the oxygen-containing functional groups. The degradation of the composite occurs in three stages: the first occurs at temperatures below 100 °C and is attributed to the evaporation of water. The second takes place between 100 °C and 500 °C and corresponds to the stability of graphene together with Fe3O4 and the third occurs above 500 °C, where the process of mass loss begins, which is due to the decomposition of oxygen-containing species [55].

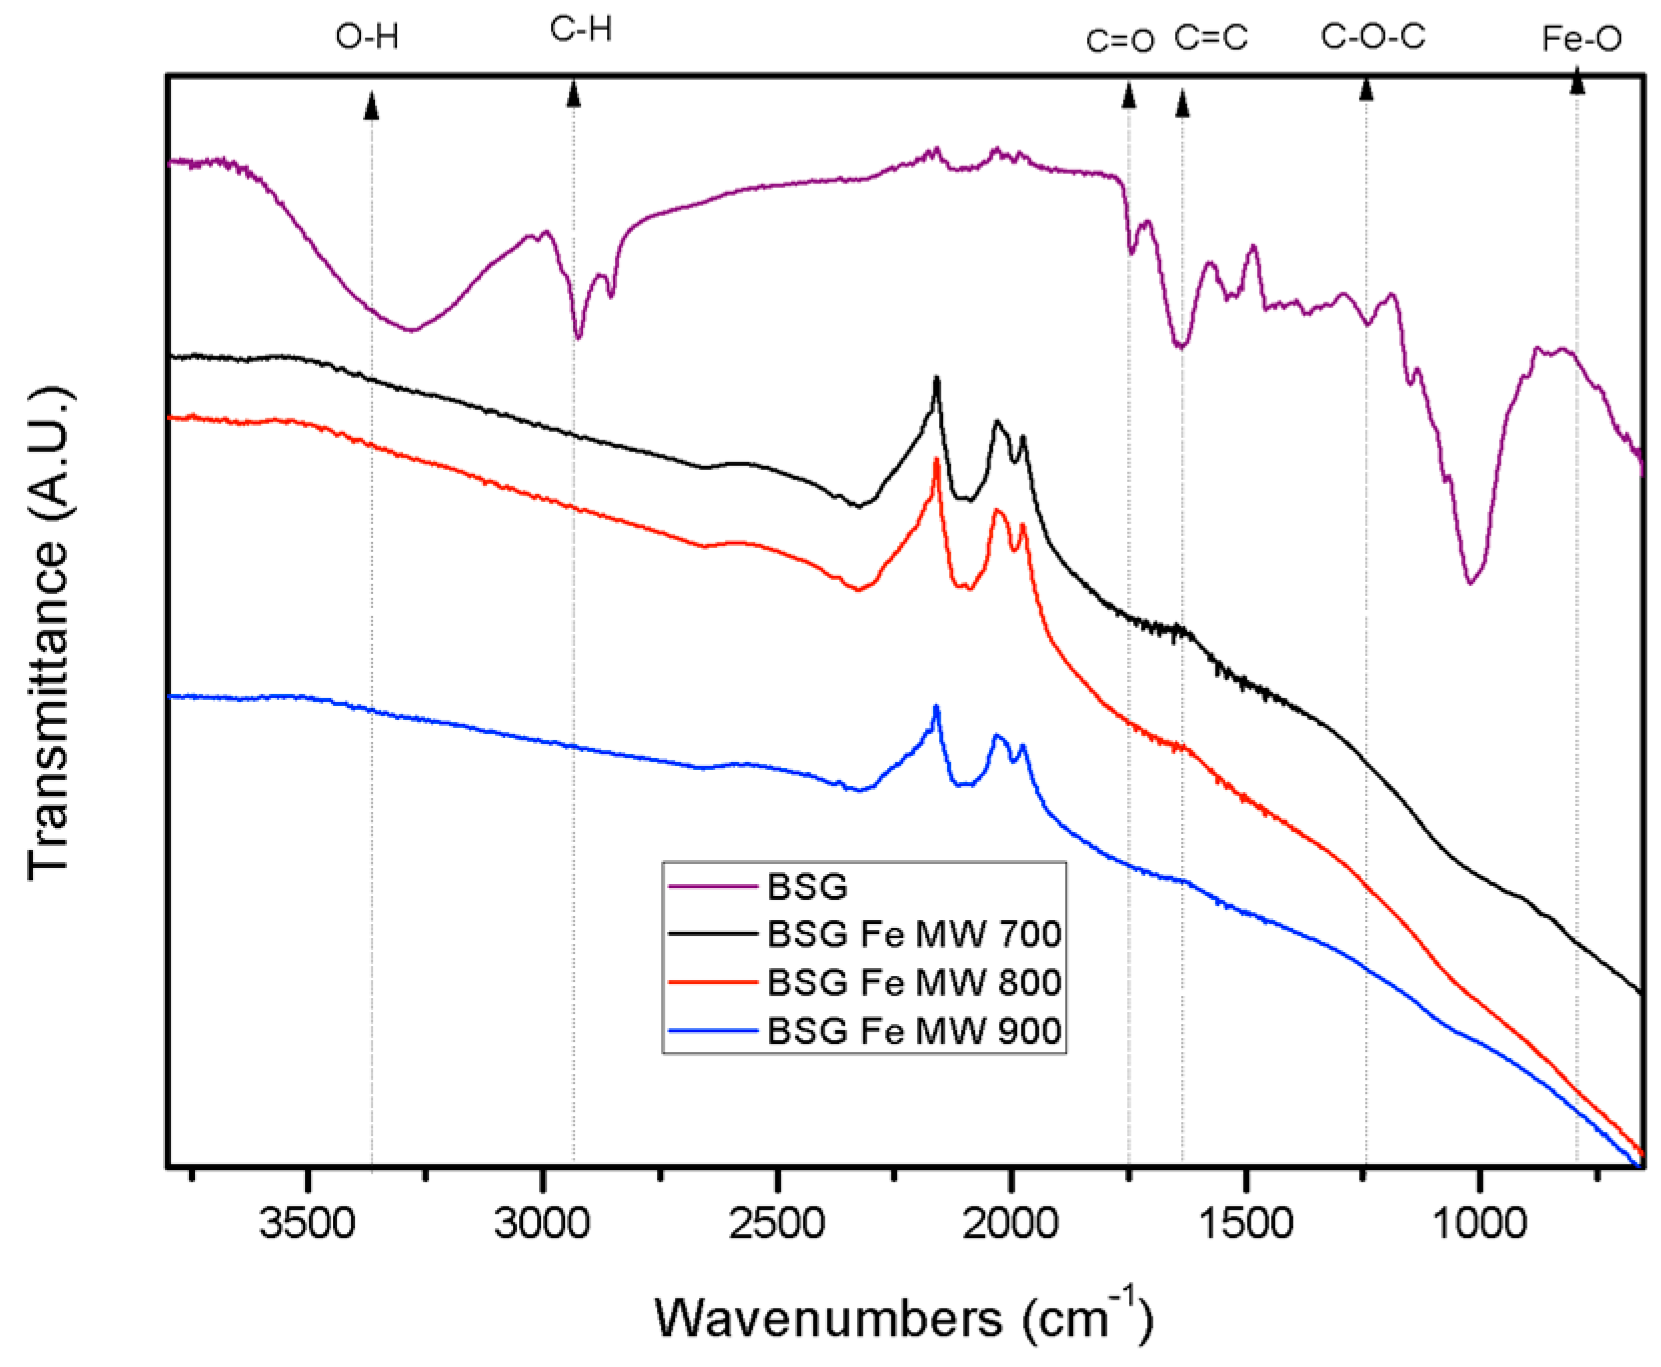
2.1.2. Fourier Transform Infrared Spectroscopy (FTIR)

FTIR analysis was conducted to identify the surface functional groups of the biochar composites, with the results presented in Figure 3. The FTIR spectrum of BSG exhibits a broad absorption band in the range of 3450–3300 cm−1, attributed to the stretching vibrations of O–H groups. This signal is characteristic of hydroxyl groups commonly present in cellulose, hemicellulose and lignin, indicating the existence of hydrogen-bonded structures within the biomass [56]. Additionally, the band observed between 2975 and 2855 cm−1 corresponds to the stretching vibrations of aliphatic C–H bonds, which are associated with the structural components of lignin [57]. The absorption band in the region of 1715–1600 cm−1 is linked to the stretching vibrations of C=O bonds, indicative of carbonyl-containing functional groups such as ketones, carboxylic acids, aldehydes and esters. Furthermore, the bands located between 1645 and 1620 cm−1 correspond to the stretching vibrations of C–O bonds, further confirming the presence of oxygenated functional groups in the biomass structure.
Following pyrolysis at 700, 800 and 900 °C, a significant reduction in the intensity of these bands was observed, suggesting the progressive degradation of oxygenated functional groups with increasing temperature. In particular, the O–H stretching band (3450–3300 cm−1) diminished considerably, indicating the elimination of hydroxyl groups and dehydration of the material. Similarly, the aliphatic C–H band (2975–2855 cm−1) weakened, reflecting the thermal decomposition of lignocellulosic components. The overall increase in pyrolysis temperature led to a greater degree of hydrophobicity in the biochar, likely due to the removal of polar functional groups and increased carbonization. At 800 °C and 900 °C, the substantially reduced carbonyl- and carboxyl-related bands (1715–1600 cm−1) suggest their transformation into more aromatic structures or volatilization. This is consistent with the progressive aromatization of the carbon matrix, a characteristic feature of high-temperature pyrolysis and thermal activation processes. Additionally, the FTIR spectra revealed the presence of iron oxide phases within the biochar composite. A band at approximately 600 cm−1 corresponds to the stretching vibrations of Fe–O bonds, indicating the presence of iron oxide [58].

2.1.3. X-Ray Diffraction (XRD)

Figure 4 presents the XRD patterns of the iron oxide/biochar composites, confirming the presence of magnetite (Fe3O4). The diffractograms of the samples pyrolyzed at 700 and 900 °C exhibit prominent diffraction peaks at 35.3°, 43°, 50.4°, 62.5° and 64.8°, which correspond to the characteristic reflections of magnetite, as indexed in the JCPDS database No. 19-0629. These peaks, assigned to the (220), (311), (400) and (511) crystal planes, confirm the formation of Fe3O4 with a cubic spinel structure and lattice parameters a = 8.3995 Å, b = 8.3995 Å and c = 8.3995 Å. In all samples, a diffraction peak near 23° was observed, associated with the (002) plane, along with a peak between 42° and 44°, which can be attributed to reduced graphene oxide (rGO). Furthermore, peaks at 43.1° and 44.9° were identified, corresponding to iron carbide (Fe3C), as referenced in JCPDS No. 035-0772. The formation of Fe3C was the result of the reduction of the iron precursor due to the high temperature in the pyrolysis process [59]. Iron carbides are characterized by their excellent electrical conductivity, making them promising candidates for applications in cathode materials for energy production [56]. Interestingly, the sample pyrolyzed at 800 °C exhibited the lowest intensity of iron-related peaks, suggesting a reduced incorporation of iron species into the structure [60], agreeing with the TXRF results. However, this sample displayed the most intense carbon-related peaks, indicating a higher degree of graphitization or structural ordering of the biochar at this intermediate temperature.

2.1.4. Raman Spectroscopy

The Raman spectra corresponding to the composite are shown in Figure 5. It can be appreciated that the D and G bands of all the samples are located near 1340 cm−1 and 1580 cm−1, which are attributed to first-order carbon materials (D and G bands). The D band is related to disorder within the matrix and the G band corresponds to the sp2 hybridization of the carbon atoms in graphite [58,61]. The G band of the composites pyrolyzed at 800 °C and 900 °C decreased compared to the composite pyrolyzed at 700 °C. This decrease is related to the pyrolysis temperature; as the temperature increases, the amorphous contributions of the composite decrease, achieving graphitization of the material [62]. A composite with favorable electrical properties has a high degree of graphitization, which is evaluated through the integral intensity ratio ID/IG [63].
The ID/IG ratio of each sample is shown in Table 2. The composite pyrolyzed at 700 °C presented an ID/IG ratio of 0.90, while the samples pyrolyzed at 800 °C and 900 °C presented an ID/IG ratio of 0.95 and 0.94, respectively. From the ID/IG it is possible to estimate the graphitization of the samples since it indicates the amorphous degree of the material from the structural defects of the carbon [64,65]. The catalyst that presented a more graphitized structure is the composite pyrolysis at 800 °C. Meanwhile, the composite pyrolyzed at 800 °C and 900 °C showed a similar and higher intensity ratio. This increasing trend is due to the rGO characteristics of the composite, where the increase in the ID/IG intensity ratio is attributed to the contraction of the average size of the sp2 domains after the reduction, varying the pyrolysis temperature. Furthermore, the interaction of the Fe3O4 particles in the composite influenced the increase in intensity [66,67]. On the other hand, during the treatment of biomass with FeCl3 in the MWHTC process, FeCl3 allows for a more acidic environment, favoring the carbonization of biomass as well as hydrolysis into Fe(OH) species, which, after activation at high temperature, favors the graphitization process, creating more stable Fe-based species such as Fe3O4 [68].
This increase in intensity was demonstrated by Shen et al. [61], as they compared the bands of GO and rGO possessing better electrical conductivity, where the ID/IG ratio was higher for rGO with ratios similar to those obtained in our work, suggesting that an increase in the ID/IG value, resulting from the increase in pyrolysis temperature, generally provides an increase in the number of small graphene domains. On the other hand, Al-Hazmi et al. [58], developed activated carbon composites from tea leaves together with Fe3O4. Raman characterization of the activated carbons showed D bands at 1354 cm−1 and 1585 cm−1 at G, characteristic of biochar, where the ID/IG ratio was approximately ~1.0, reflecting defects in the composite.
Although the composite pyrolyzed at 700 °C achieved better graphitization and structural order with a lower ID/IG, the intensity ratio obtained for the composites pyrolyzed at 800 °C and 900 °C resulted in a composite with a degree of graphitization and defects in equilibrium, which is desirable in a good catalyst CE [69].

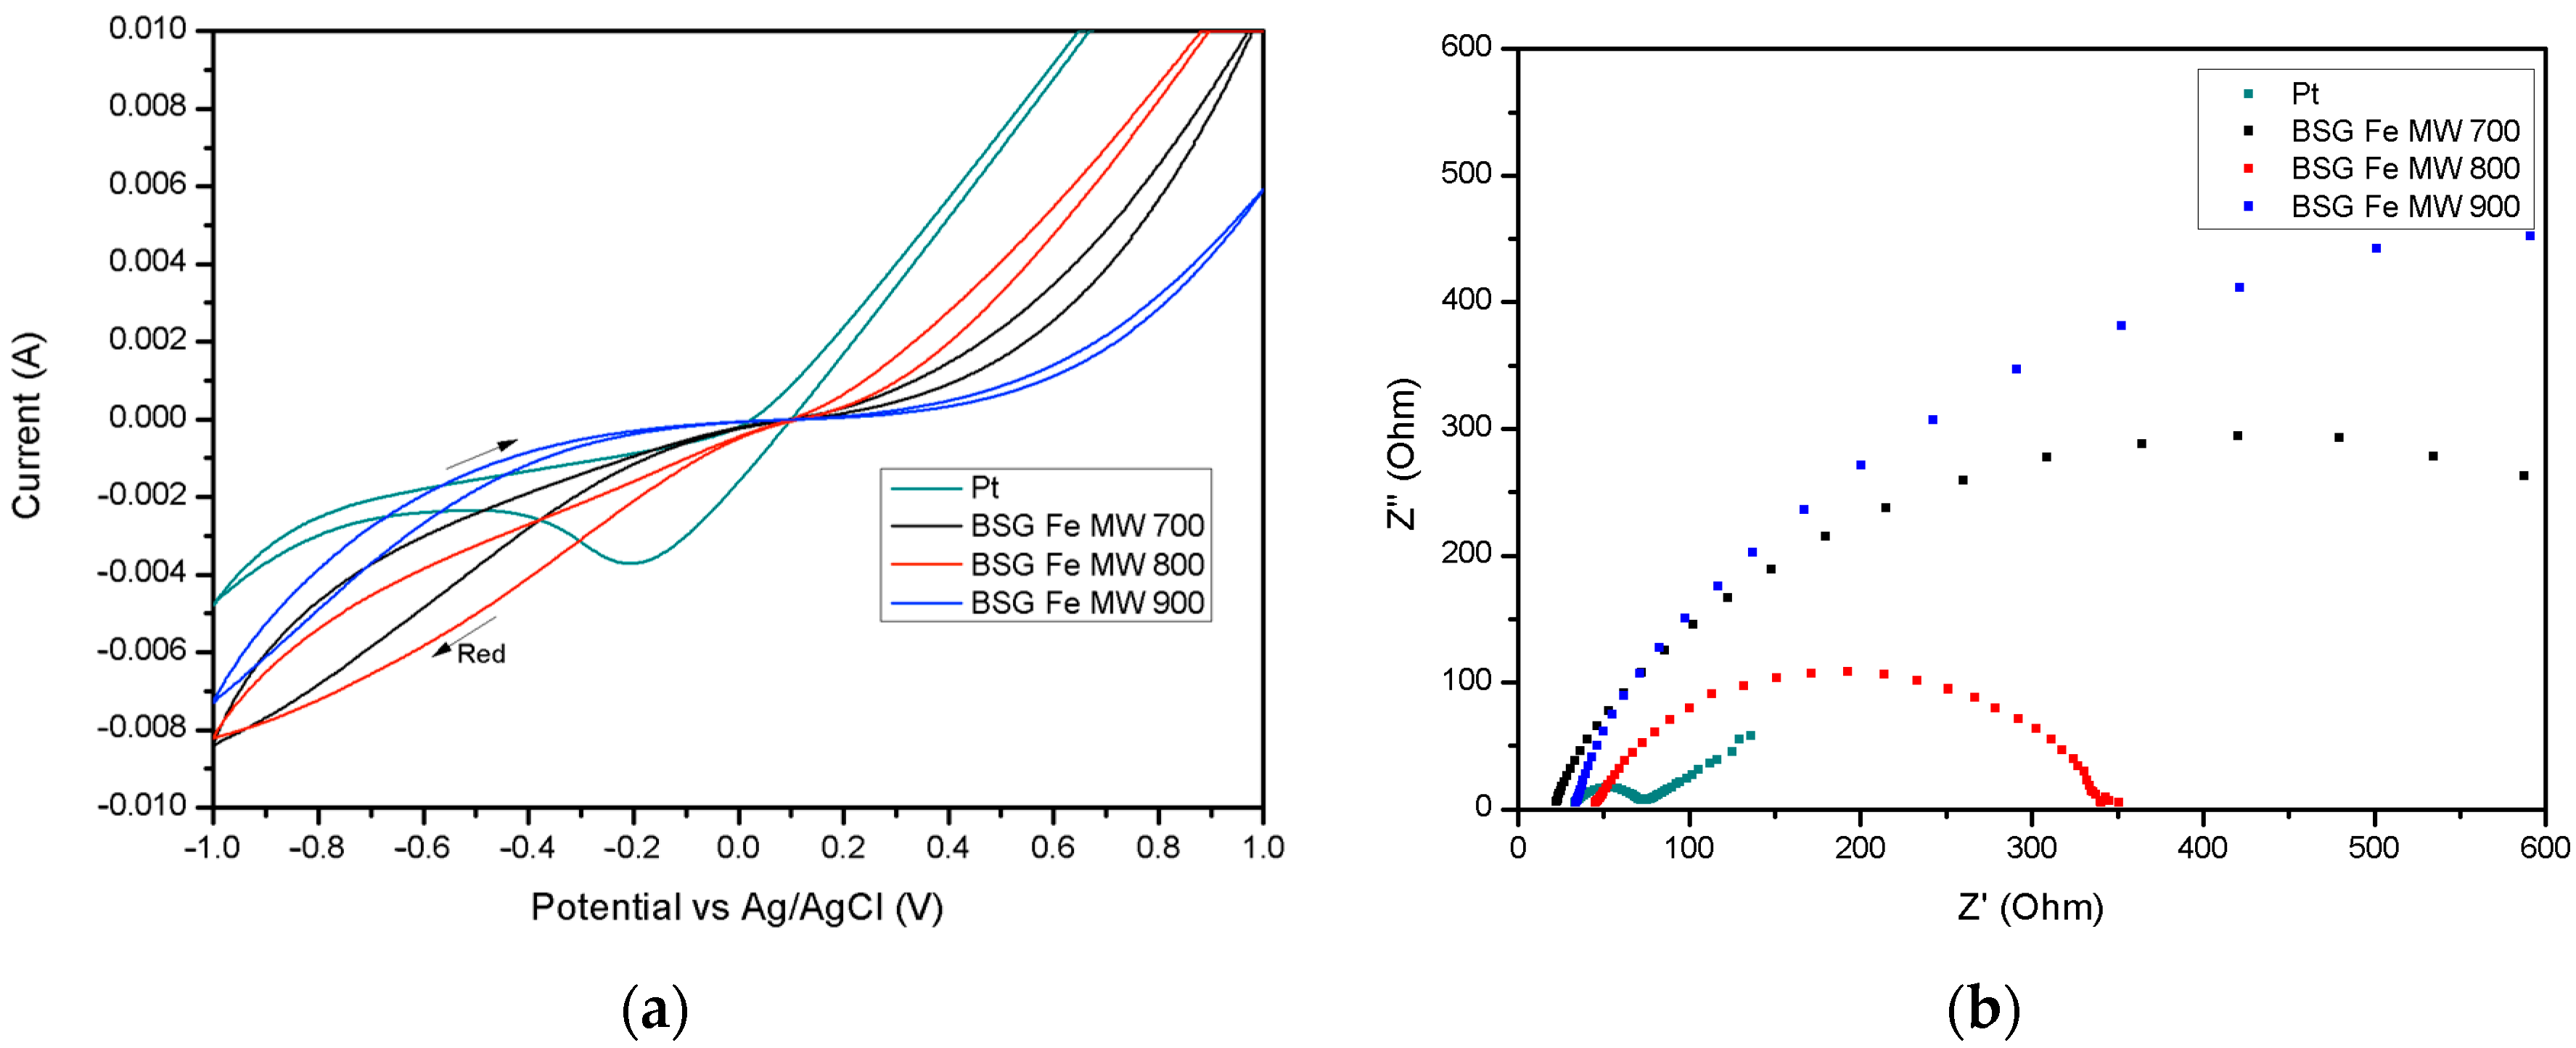
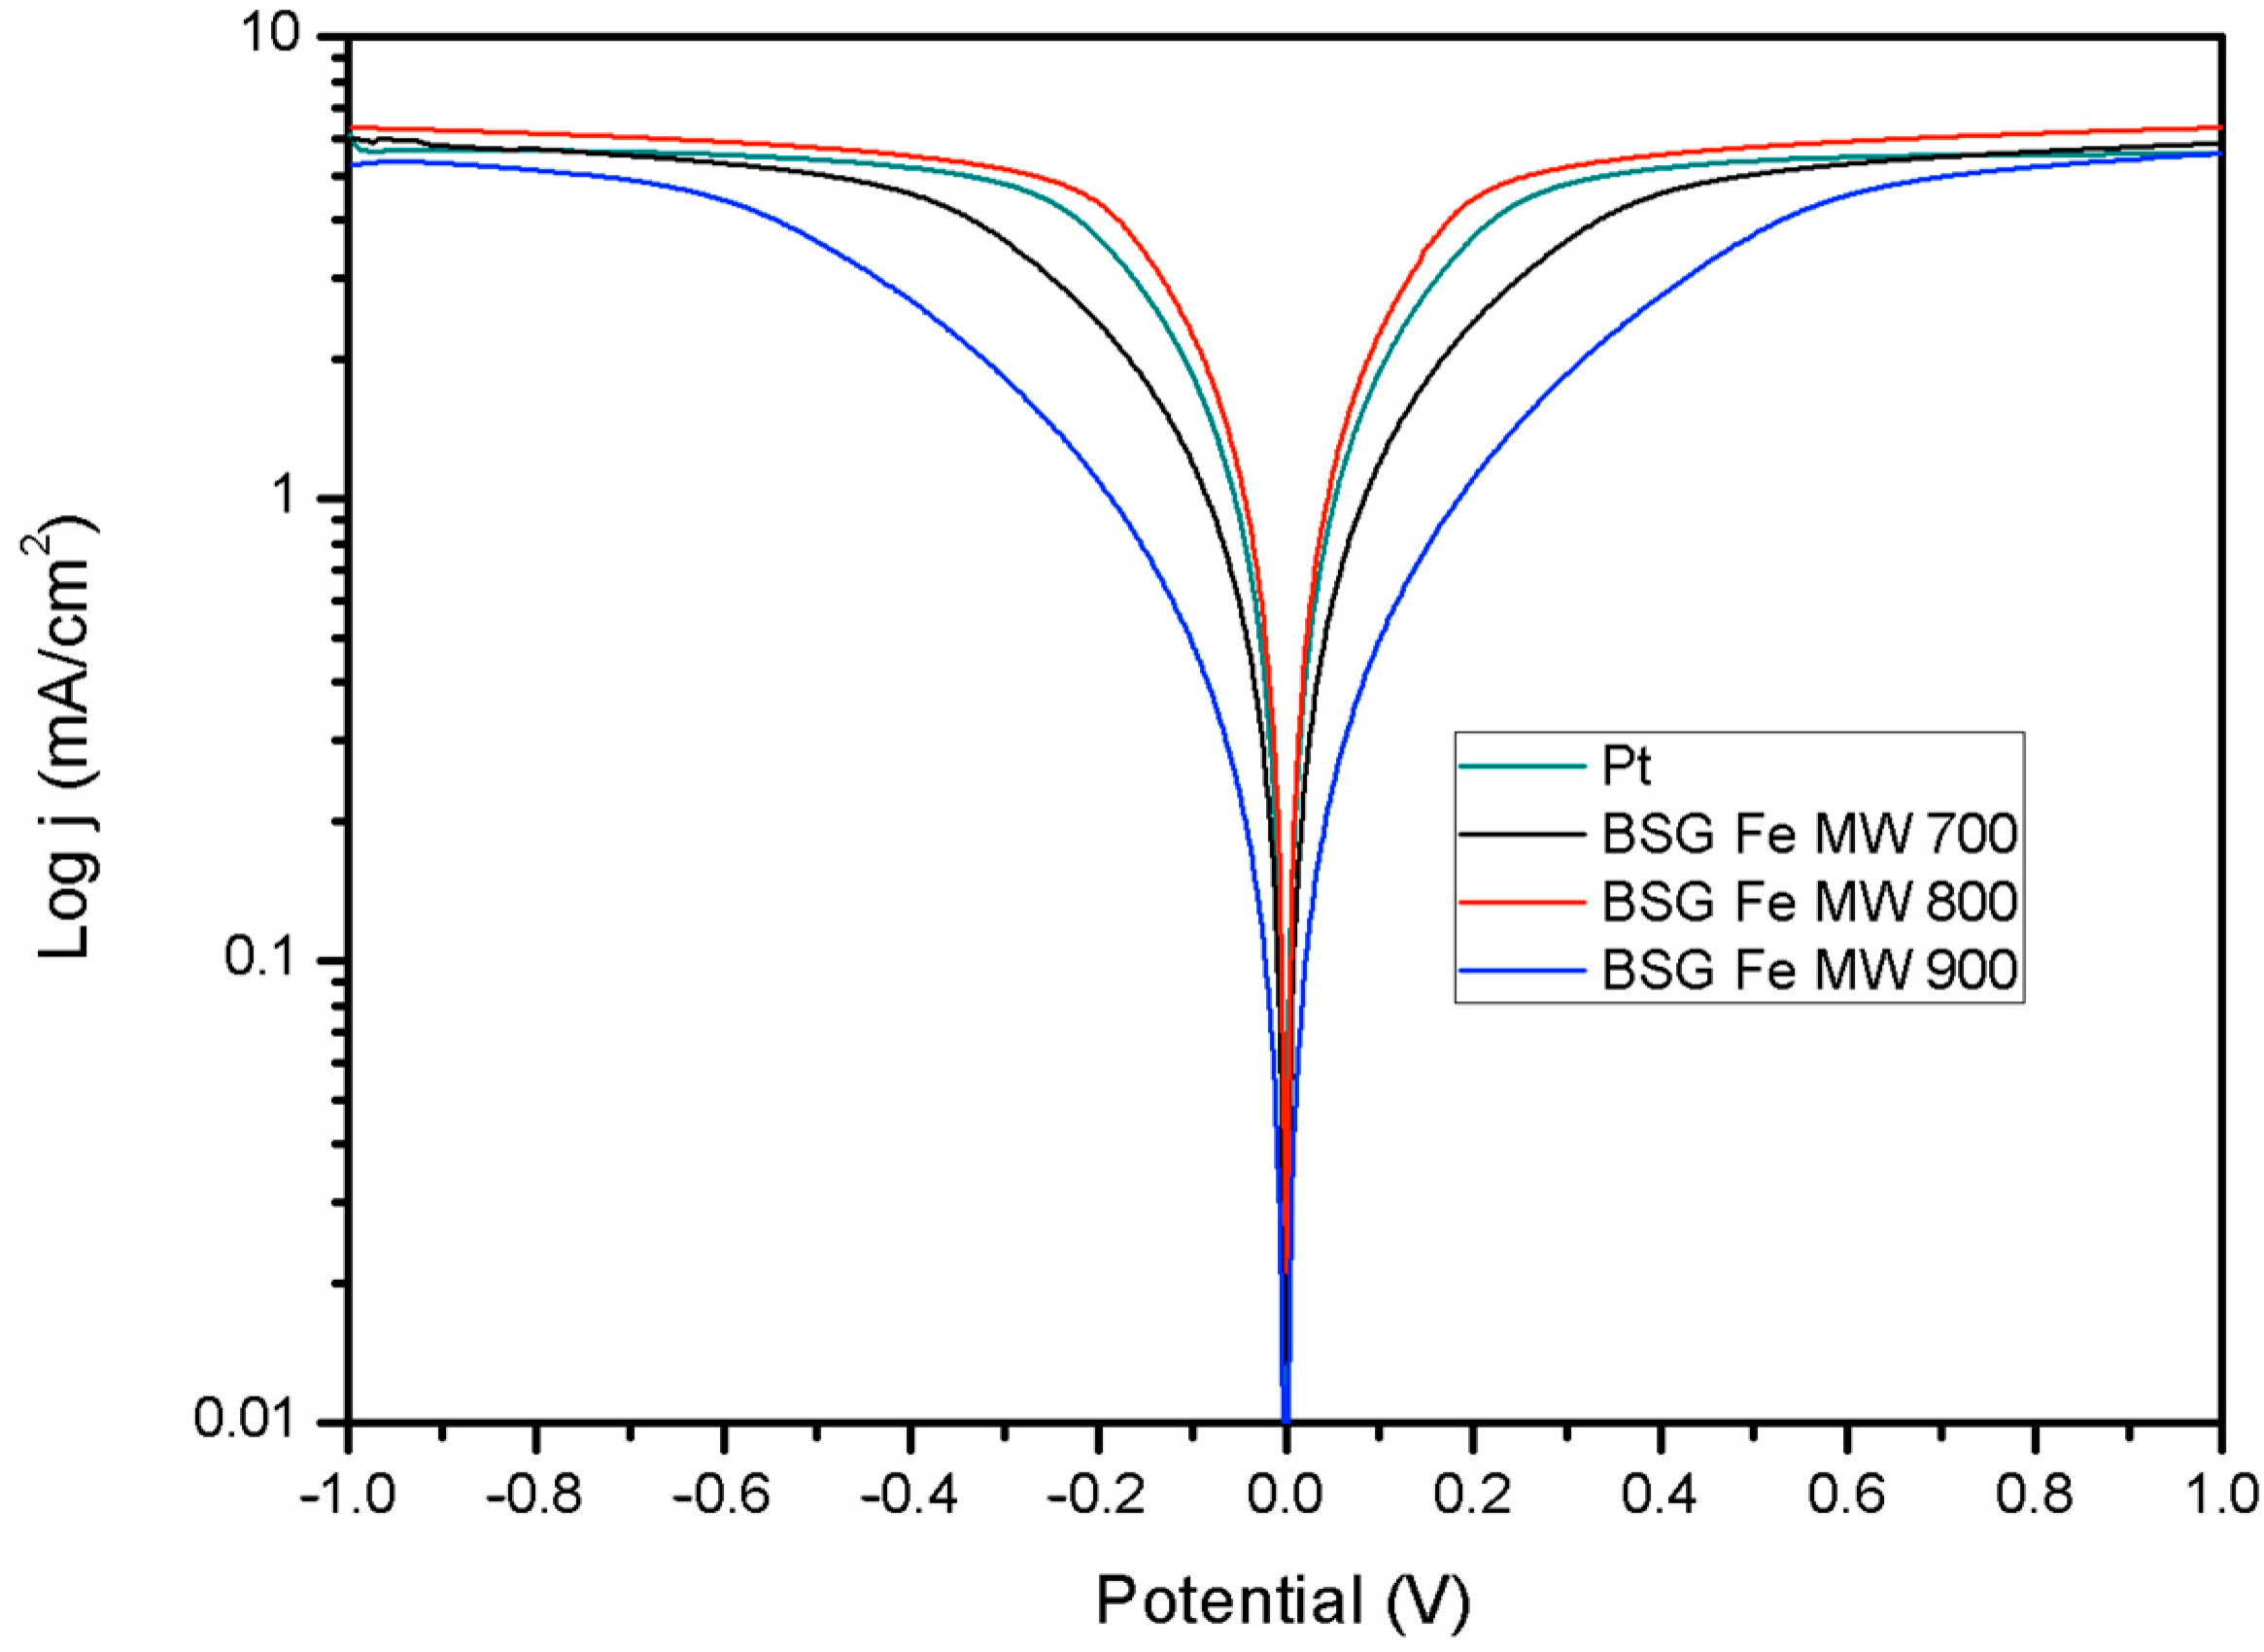
2.2. Electrochemical Characterization of the Counter Electrode

Figure 6 shows the cyclic voltammograms and the Nyquist plot corresponding to the electrodes constructed with the iron oxide/biochar composite pyrolyzed at 700, 800 and 900 °C. Figure 6a shows the voltammograms of the composite, where the curve of the electrode developed with iron and pyrolyzed at 800 °C presented a cathodic potential with a reduction peak at −0.54 V. However, platinum presented a better reduction potential of −0.2 V. Using the three-electrode system, it was possible to identify only the cathodic peak corresponding to the reduction of the electrolyte, which allows the electrocatalytic evaluation of the electrode for use in a DSSC. The reaction observed in the voltammograms corresponds to the reduction peak (red) of I 3 , which is produced through the electrochemical reaction I 3 + 2 e 3 I that allows the reduction of triiodide to iodide in the redox reaction.
Table 3 shows the parameters corresponding to the cathodic peak potential ( E p c ) corresponding to the reduction of the electrolyte and the cathodic peak current ( I p c ). The composite developed at 900 °C obtained the most negative cathodic peak potential, being more difficult for this composite the electrolyte reduction process. At 900 °C a sample with a higher carbon content was obtained and at the same time the iron was reduced transforming it into Fe3C.
The interfacial charge transfer processes of the electrodes based on the catalysts developed with FeCl3 were investigated by electrochemical impedance spectroscopy (EIS). For this purpose, electrodes were fabricated with the catalyst and evaluated in a three-electrode system, where the working electrode was the FTO substrates with the developed catalyst, a Pt wire was used as the auxiliary electrode and Ag/AgCl as the reference electrode, the solution resistance (RS) and charge transfer resistance (RCT) were evaluated. Figure 6b shows the Nyquist diagrams of the electrodes fabricated with platinum and the iron oxide/biochar composites developed with microwave-assisted hydrothermal carbonization and subsequent pyrolysis at 700, 800 and 900 °C. The electrode with the best charge transfer was the one pyrolyzed at 800 °C. These diagrams show a semicircle, which represents the charge transfer resistance, where a smaller circle represents lower resistance and a better catalytic activity.
The values of RS and RCT obtained through the adjusted equivalent circuit are shown in Table 4. Platinum is the most used catalyst in DSSC counter electrodes and, being a commercial product, presented a low resistance in comparison with the developed composites. The resistance obtained in the BSG Fe MW 800 sample exhibits better results with respect to the charge transfer resistance of the other composites (297 Ω ⋅cm). On the other hand, the composites pyrolyzed at 700 °C and 900 °C presented an adjusted RCT of 788 Ω ⋅cm and 855 Ω ⋅cm, respectively. This can be attributed to the change in the iron phase as the pyrolysis temperature varies [70]. The constant phase element (CPE) replaces the ideal capacitor in the system, and which can be adjusted with a dimensionless exponent n, ranging between 0 and 1, being n = 1 an ideal capacitor and n < 1 describe possible deviations caused by the electrode surface [71]. The evaluated electrodes presented an n of 1, approximately 0.8, which is due to the rough surface of the catalyst applied on the FTO substrate, as well as to the porosity of the developed composite.
Figure 7 represents the Tafel polarization curves of the composite pyrolyzed at 700, 800 and 900 °C measured by symmetrical cells. The Tafel polarization allows us to study the diffusion rate and charge transfer of the redox couple at the counter electrode/electrolyte interface. The curves represent the logarithmic exchange current density (log j) against the voltage (V) during the oxidation and reduction process of the electrolyte from I 3 , to I , at the counter electrode [39]. The RCT is inversely related to the exchange current transfer (J0), which can be calculated from Equation (1). The gas constant is defined as R, F is Faraday’s constant, T is the absolute temperature and n is the number of electrons participating in the reduction reaction from I 3 , to I .
J o = R T n F R c t
The diffusion current density (Jlim) that can be observed in the high potential zone of the Tafel curve [72] can be obtained from Equation (2), where D is the diffusion coefficient of triiodide, l is the thickness between the electrodes and C is the concentration of triiodide. Hence, to obtain an optimal electrode, the values of J0, Jlim must be highest [39].
D = l   J l i m 2 n F
The more pronounced the Tafel zone, the higher the J0 and the greater the catalytic activity of the evaluated material. In Figure 7, the behavior of the three electrodes is similar; however, the highest J0 is found in the Pt and the composite pyrolyzed at 800 °C (Table 5), which translates into a higher electrocatalytic activity. The Jlim changes in the same way as the J0 the diffusion current density of the redox reaction improves with the increase of the pyrolysis temperature. The composite pyrolyzed at 900 °C had the lowest catalytic activity, which is due to the large particle size and low surface area obtained due to the collapse of the pores caused by the temperature. These results corroborate the results obtained in CV and EIS, where the catalysts that worked best were the composites pyrolyzed at 800 °C.

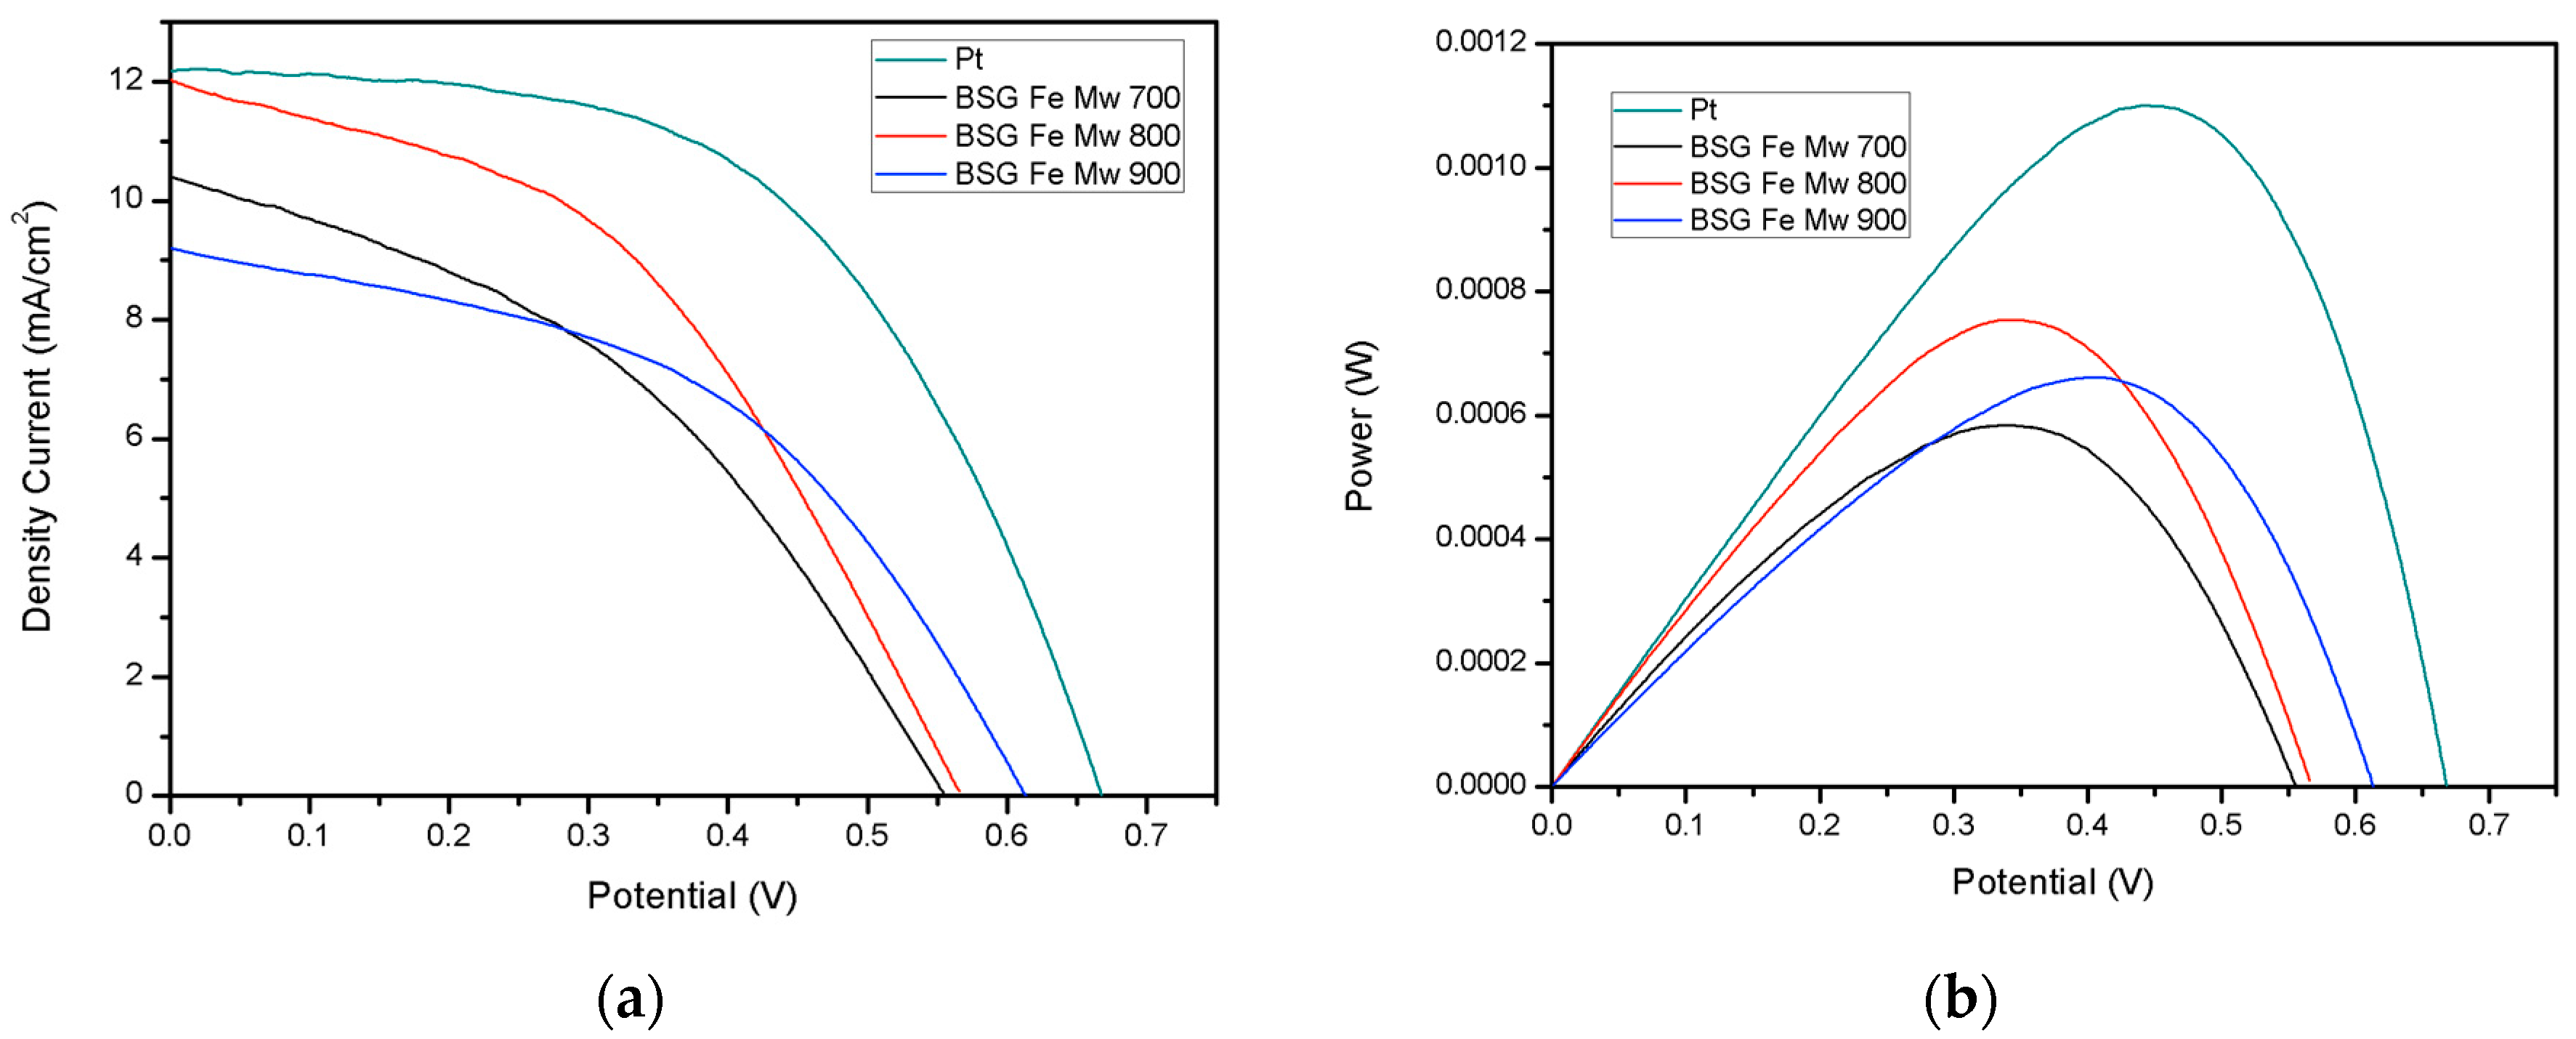
2.3. Characterization of DSSCs

To evaluate the photovoltaic performance of the composite in a DSSC, cells were fabricated based on the composites pyrolyzed at 700, 800 and 900 °C and on platinum as a commercial reference. The photovoltaic performance of the DSSCs is shown in Figure 8a, represented by the J-V curve. The values associated with the photovoltaic parameters, current density (Jsc), open circuit voltage (Voc), fill factor (FF) and conversion efficiency are presented in Table 6. The cells with the composite pyrolyzed at 800 °C reached a higher voltage of 0.566 V and an efficiency of 3.05%. Current density is considered an important parameter, as it defines the amount of current generated, where the higher the current density, the more efficient the cell [73]. The BSG Fe MW 800 composite achieved high efficiency, as it had the highest current density of 11.90 mA/cm2. These results coincide with the good catalytic activity presented in the electrochemical study, as it was the electrode with the lowest resistance. FF is a parameter that allows the working condition at maximum output power to be represented; this value varies between 0 and 1, where a higher FF indicates a more efficient device. Both efficiency and FF allow the evaluation and comparison of DSSCs made with different materials. The sample with the best FF was the sample pyrolyzed at 900 °C, due to the cell’s high Voc. As the pyrolysis temperature increased, the voltage of the DSSC circuit increased. In comparison with the cell manufactured with Pt, the Voc was close in the sample pyrolyzed at 900 °C, as was the FF. However, the current density was lower, resulting in lower efficiency compared to Pt and the other composites, which may be due to the higher resistance of the catalyst, which was evaluated through the symmetrical cells. The composite developed at a lower temperature of 700 °C shows the lowest efficiency, being 2.36%, a current density of 10.44 mA/cm2 and an open circuit voltage of 0.556 V. Tiihonen et al. [26] evaluated the use of residual brewery biomass to prepare biochar, for which the biomass was carbonized through a hydrothermal process followed by pyrolysis at 800 °C, evaluating catalyst in DSSC counter electrodes in replacement of platinum. The results were a biochar with a large surface area through activation with KOH. In terms of photovoltaic yields, they obtained an efficiency of 3.6%, which was 1.7% lower than the efficiencies obtained with platinum in cells of 0.4 cm2 of active area.
Figure 8b shows the power-voltage curve for the DSSCs manufactured with the pyrolyzed composite at 700, 800 and 900 °C. Where it is possible to obtain the maximum power point (Pmax) corresponding to the ideal working point of the cell, this is obtained from the product between the maximum power voltage and the maximum power current. The composites that exhibit the highest Pmax were the composites pyrolyzed at 800 and 900 °C, showing both the highest running and the highest voltage, respectively.
These results indicate the effect that the pyrolysis temperature has on the development of the composite, where increasing the temperature improves the open circuit voltage properties, enhancing the efficiency of the DSSCs.
The developed methodology produces a composite with rGO characteristics and better conductivity properties. In addition, the use of biochar in DSSC CE generates a rougher surface with catalytic active sites accessible to larger ions, producing better results that compete with those obtained with platinum. The application of the methodology with two thermochemical methods and using FeCl3 as an activator shows good results in terms of conversion efficiency since its application not only improved the physical properties of the composites but also the electrical ones, considering that no other additive such as carbon black was used and the results depended only on the treatment given to the biomass.
The composites developed were more efficient when compared to biomass used alone as reported in the literature [26], including bagasse alone, where KOH is generally used as an activating agent and carbon black to improve the performance of a DSSC. This was due to the incorporation of iron, which improved the structural properties of the biochar and the electrochemical performance of the compound, demonstrating that optimization of the compound allows for a reduction in additives in the development of the catalyst to obtain good results when applied to a counter electrode of a DSSC.

3. Materials and Methods

3.1. Iron Oxide/Biochar Composite Synthesis

The residual brewery biomass was supplied by the brewery Soluciones Cerveceras located at Kilometer 7 Camino Freire-Villarrica, Araucanía Region, Chile, and was used as a raw material to develop the composite. Hydrothermal carbonization was carried out in the UWAVE-2000 microwave (Sineo Microwave Chemistry Technology Co., Ltd., Shanghai, China) based on the methodology described by Qi et al. [74]. A 40% FeCl3 (Labochemie, Mumbai, India) solution was prepared and proportional amounts of brewer’s residual biomass and FeCl3 solution equivalent to 12.5 g of each were measured. The mixture was transferred to the microwave reactor and filled with deionized water to 100 mL to maintain a biomass/water ratio of 1:8. Carbonization was carried out at 180 °C with a residence time of 1 h at 500 W. The mixture was evaluated at 1:2 impregnation ratio (biomass: FeCl3). The hydrocarbons (HCs) obtained were washed with deionized water and dried at 105 °C for 12 h. The physical activation was carried out according to the methodology of Macdermid-Watts et al. [75] from a thermal treatment. The sample was pyrolyzed in a SZGL-1200C tubular reactor at 700, 800 and 900 °C under a continuous N2 flow of 0.8 mL/min with a >99.995% purity and a residence time of 2 h for each sample. After cooling, the carbonized samples were washed with 100 mL of HCl (Merck, Rahway, NJ, USA) solution (0.1 M) for 20 min and then rinsed with deionized water until no chloride was detected in the samples. The samples were oven dried at 105 °C for 24 h. Finally, the samples were sieved with a 52 μm sieve to control the particle size.

3.2. Iron Oxide/Biochar Composite Characterization

Elemental composition (EA) was performed by elemental analysis based on C, H and N contents using a Eurovector EA 3000 (Eurovector EA 3000, Milano, Italy). Total reflection X-ray Fluorescence (TXRF) was used for quantified iron content using Bruker S3 T-STAR instrument (Bruker, Billerica, MA, USA). Thermogravimetric analysis (TGA) was performed to measure for thermal decomposition in terms of overall mass loss was performed using a model STA 6000 thermogravimetric analyzer (Perkin Elmer, Springfield, IL, USA). Briefly, 0.003 g of dry brewery residual biomass was placed under a nitrogen atmosphere (flow rate of 40.0 mL/min), exploring a temperature range of 25 to 900 °C with a heating rate of 15 °C min−1, surface area, pore volume, pore diameters and N2 adsorption/desorption isotherms at 77 K using a Quantachrome NOVA 1000e porosimeter (Quantachrome Instruments, Boynton Beach, FL, USA). Surface area was determined using the Brunauer–Emmett–Teller (BET) model, pore volume from density functional theory (DFT) and particle size distribution using the Barrett, Joyner and Halenda (BJH) method. The morphological study of the composites was analyzed by scanning electron microscopy (SEM SU3500, HITACHI, Tokyo, Japan). The functional groups of the residual brewing biomass were evaluated by the FTIR spectrometer Cary 630 (Agilent Technologies, Santa Clara, CA, USA) in a spectral range from 400 to 4000 cm−1. Raman spectra were measured at room temperature with adsorption spectra between 50 and 3600 cm−1 with an i-Raman Plus 532H spectrophotometer (BWS465-532H i-Raman® Plus, Plainsboro, NJ, USA). The crystallinity and phase purity of the iron oxide on the surface of the developed composite were determined using an X-ray diffractometer (XRD) (Bruker D2 PHASER, Billerica, MA, USA) with Cu-Kα radiation at 45 kV and 40 mA in the value range 2θ from 20 to 80°.

3.3. Preparation of Counter Electrodes with Iron Oxide/Biochar Composite

The composite was applied on the counter electrode using the methodology described by Hu et al. [76] and the paste was prepared by blending poly (vinylidene fluoride) (PVFD) (Merck, Rahway, NJ, USA) as a binder polymer in N-methylpyrrolidone (NMP) (Merck, Rahway, NJ, USA) in a 9:1 ratio. PVDF was dispersed in NMP at 80 °C and stirred until dissolved, then the iron oxide/biochar compound was added and stirred at 1000 RPM for 1 min. Working electrodes were fabricated from fluorine-doped tin oxide (FTO) coated substrates (TCO227/LI Transparent and Conductive Substrates, Solaronix, Aubonne, Switzerland) that were cleaned in an ultrasonic bath for 15 min with each of the following solutions: deionized water, acetone and isopropanol. The electrodes were fixed with a 45 μm thick adhesive that allowed to control the thickness of the catalyst layer and to limit the active area to 0.25 cm2. The iron oxide-biochar catalyst composite was applied on a substrate using the doctor blade technique: the paste was deposited near the top edge and spread to obtain a thin, uniform layer; it was then heated in an oven for 10 min at 300 °C. To compare the composite-based catalyst, counter electrodes were fabricated by coating FTO glasses with a thin layer of commercial platinum (Pt)-based catalyst (Plastisol T, Solaronix) synthesized at 450 °C for 10 min.

3.4. DSSC Assembly

To fabricate the photoanode, a glass (TCO227/LI Transparent and Conductive Substrates, Solaronix) was used, coated with a fluorine-doped tin oxide (FTO) layer, sized 2.5 cm × 2.5 cm × 2.2 mm and 7 Ω; these were cleaned in an ultrasonic bath for 15 min with each of the following solutions: deionized water, acetone and isopropanol [77]. The anode was coated with a thin layer of TiO2 semiconducting paste (Ti-Nanoxide T/SP, Solaronix) using the Doctor-Blade technique with a thickness of 47.5 μm, limiting the active area to 0.25 cm2, until having a thin and uniform layer. Subsequently, it was synthesized by heat treatment in a muffle furnace at 475 °C for 40 min. The pigment used was Ruthenizer 535 (Solaronix) at a concentration of 0.5 mM and was applied on the semiconductor by immersing it for 12 h in a solution with ethanol as solvent. The anode and cathode were assembled in such a way that the conductive faces were joined with a sealing film (Meltonix 1170-60, Solaronix) around the active zone. Using a press and a hot air gum, a transparent seal is ensured, which, in addition to encapsulating the cell, guarantees the permanence of the electrolyte inside it. The electrolyte used is an iodide/triiodide redox couple solution in acetonitrile (Iodolyte HI-30, Solaronix), which was applied by vacuum through a hole near the active area of the counter electrodes, then sealed with a sheet of sealing film (Meltonix 1170-60, Solaronix).

3.5. Characterization of Counter Electrodes Fabricated with Iron Oxide/Biochar Composite and DSSCs

The electrocatalytic performance of the electrodes towards the I / I 3 , redox pair was evaluated by cyclic voltammetry through a three-electrode system using an Autolab/PGSTAT101 potentiostat (Metrohm, Herisau, Switzerland). The working electrodes were FTO coated with the developed catalysts and Pt wire was used as auxiliary electrode and Ag/AgCl were used as reference electrode. The voltage sweep was performed at a rate of 0.025 mV/s in a voltage range of −1 to 1 V against the reference electrode and commercial electrolyte with a concentration of 30 mM iodide/tri-iodide (Iodolyte HI-30, Solaronix) resuspended in acetronitrile. Electrochemical impedance spectroscopy was measured using a potentiostat/galvanostat Autolab/PGSTAT302N (Metrohm, Herisau, Switzerland). coupled to a frequency response analyzer. The measurement was performed in an open circuit with an amplitude of 0.01 V and a frequency range of 0.1 to 1 × 10⁵ Hz. Tafel polarization was measured with symmetric cells (CE/electrolyte/CE) fabricated with the same methodology mentioned above and measured in obscurity with a sweep voltage of 0.05 V/s over a potential range of −1 to 1 V. The DSSC was evaluated in triplicate with a solar simulator consisting of a potentiostat/galvanostat module (Autolab, PGSTAT302N) and a xenon arc light source model LSZ163 (LOT, Darmstadt, Germany) of 150 W power. Photocurrent-voltage density characterizations were performed under standard solar conditions of 100 mW/cm2 at 25 °C and 1.5 air mass (AM), from which I-V curves, power curves and electrochemical impedance spectroscopy test were determined.

4. Conclusions

Composites based on residual brewery biomass and iron oxide were successfully synthesized using a combined microwave-assisted hydrothermal carbonization with subsequent pyrolysis at various temperatures and evaluated for application in CE in DSSCs. Characterization of the composites showed structural differences dependent on pyrolysis temperature. The BET analysis showed a greater surface area in the sample pyrolyzed at 700 °C, which at the same time was the composite with the highest iron content (1.84 wt.%), while the composite pyrolyzed at 900 °C, presented a smaller surface area (9.561 m2/g), which was mainly attributed to a pore collapse. An increment in pyrolysis temperature produced a progressive loss of the oxygenated functional groups at the surfaces, a phenomenon observed by FTIR. Through XRD analysis, it was demonstrated that iron was present in all composites, mainly as magnetite, while the composite pyrolyzed at 800 °C presented a more intense peak associated with rGO. Raman analysis showed a balance between the degree of graphitization and disorder of the biochar, which is favorable for catalytic activity. Electrochemical analysis showed that the composite pyrolyzed at 800 °C presented better catalytic activity and lower charge transfer resistance (297 Ω ⋅ cm), while at 900 °C, the resistance increased to 855 Ω ⋅ cm, due to pore collapse and low surface area. Finally, applying the composites in the CE of DSSCs presented relatively high efficiencies, particularly the composite pyrolyzed at 800 °C, which presented the highest efficiency (3.05%), close to the value obtained for conventional Pt catalyst in DSSC (Pt = 4.43%).
These findings demonstrate that developed composites based on residual brewery biomass together with a transition metal offering a sustainable, low-cost alternative that allow the development of sustainable technologies in line with the concept of a circular economy.

Author Contributions

Methodology, C.S., M.C., M.E.G. and A.M.R.R.; software, C.S.; investigation, C.S.; writing—original draft preparation, C.S. and M.C.; writing—review and editing, C.S., M.C., B.P., M.E.G., A.M.R.R., M.K. and P.M. All authors have read and agreed to the published version of the manuscript.

Funding

This project has received funding from ANID BECAS/DOCTORADO NACIONAL 2021-21211394, Fondecyt Regular Project 1201865 “Designing a continuous process for the remediation of water contaminated with chlorinated compounds using an iron oxide-hydrochar composite” and Fondecyt Regular Project 1231242 “Designing a bifunctional catalyst carbon-based to be used in the conversion of residual biomass in a one-pot furans production process”.

Data Availability Statement

The data presented in this study are available on request from the corresponding author.

Conflicts of Interest

The authors declare no conflicts of interest.

Appendix A

Table A1. Particle size distribution of iron oxide/biochar composite.
Sample25%50%75%
BSG Fe MW 7009.69 ± 0.5019.77 ± 0.6740.28 ± 0.66
BSG Fe MW 80010.07 ± 0.8020.01 ± 1.2139.73 ± 1.64
BSG Fe MW 90042.33 ± 3.0268.90 ± 1.81112.42 ± 2.32

References

  1. Kumar, P.; Thokala, S.; Singh, S.P.; Singh, R. Research Progress and Challenges in Extending the Infra-Red Absorption of Perovskite Tandem Solar Cells. Nano Energy 2024, 121, 109175. [Google Scholar] [CrossRef]
  2. Righini, G.C.; Enrichi, F. Chapter One—Solar Cells’ Evolution and Perspectives: A Short Review. In Solar Cells and Light Management: Materials, Strategies and Sustainability; Elsevier: Amsterdam, The Netherlands, 2020; pp. 1–32. ISBN 9780081027622. [Google Scholar] [CrossRef]
  3. Gómez-Ortíz, N.M.; Vázquez-Maldonado, I.A.; Pérez-Espadas, A.R.; Mena-Rejón, G.J.; Azamar-Barrios, J.A.; Oskam, G. Dye-Sensitized Solar Cells with Natural Dyes Extracted from Achiote Seeds. Sol. Energy Mater. Sol. Cells 2010, 94, 40–44. [Google Scholar] [CrossRef]
  4. Gra, M. Solar Energy Conversion by Dye-Sensitized Photovoltaic Cells. Inorg. Chem. 2005, 44, 6841–6851. [Google Scholar] [CrossRef]
  5. Devadiga, D.; Selvakumar, M.; Shetty, P.; Santosh, M.S. Recent Progress in Dye Sensitized Solar Cell Materials and Photo-Supercapacitors: A Review. J. Power Sources 2021, 493, 229698. [Google Scholar] [CrossRef]
  6. Jin, J.; Zhang, X.; He, T. Self-Assembled CoS2 Nanocrystal Film as an Efficient Counter Electrode for Dye-Sensitized Solar Cells. J. Phys. Chem. C 2014, 118, 24877–24883. [Google Scholar] [CrossRef]
  7. Shahzad, N.; Lutfullah; Perveen, T.; Pugliese, D.; Haq, S.; Fatima, N.; Salman, S.M.; Tagliaferro, A.; Shahzad, M.I. Counter Electrode Materials Based on Carbon Nanotubes for Dye-Sensitized Solar Cells. Renew. Sustain. Energy Rev. 2022, 159, 112196. [Google Scholar] [CrossRef]
  8. Du, Y.; Yue, G.; Lan, Z.; Gao, Y.; Wu, J.; Tan, F. A Dye-Sensitized Solar Cell Based on Magnetic CoP@FeP4@Carbon Composite Counter Electrode Generated an Efficiency of 9.88%. Inorg. Chem. Front. 2021, 8, 5034–5044. [Google Scholar] [CrossRef]
  9. Mposa, E.; Sithole, R.K.; Ndala, Z.; Ngubeni, G.N.; Mubiayi, K.P.; Shumbula, P.M.; Machogo-Phao, L.F.E.; Moloto, N. Novel 2D-AuSe Nanostructures as Effective Platinum Replacement Counter Electrodes in Dye-Sensitized Solar Cells. RSC Adv. 2022, 12, 12882–12890. [Google Scholar] [CrossRef]
  10. Mohanty, S.P.; More, V.; Bhargava, P. Effect of Aging Conditions on the Performance of Dip Coated Platinum Counter Electrode Based Dye Sensitized Solar Cells. RSC Adv. 2015, 5, 18647–18654. [Google Scholar] [CrossRef]
  11. Nemala, S.S.; Kartikay, P.; Agrawal, R.K.; Bhargava, P.; Mallick, S.; Bohm, S. Few Layers Graphene Based Conductive Composite Inks for Pt Free Stainless Steel Counter Electrodes for DSSC. Sol. Energy 2018, 169, 67–74. [Google Scholar] [CrossRef]
  12. Akman, E.; Karapinar, H.S. Electrochemically Stable, Cost-Effective and Facile Produced Selenium@activated Carbon Composite Counter Electrodes for Dye-Sensitized Solar Cells. Sol. Energy 2022, 234, 368–376. [Google Scholar] [CrossRef]
  13. Zatirostami, A. A New Electrochemically Prepared Composite Counter Electrode for Dye-Sensitized Solar Cells. Thin Solid Films 2020, 701, 137926. [Google Scholar] [CrossRef]
  14. Choi, J.S.; Park, H.B.; Yoon, O.J.; Kim, H.J. Investigation on the Role of Graphene Oxide Sheet-Platinum Composite Counter Electrode in Dye-Sensitized Solar Cell. Thin Solid Films 2022, 745, 139098. [Google Scholar] [CrossRef]
  15. Xie, Z.; Guan, W.; Ji, F.; Song, Z.; Zhao, Y. Production of Biologically Activated Carbon from Orange Peel and Landfill Leachate Subsequent Treatment Technology. J. Chem. 2014, 2014, 491912. [Google Scholar] [CrossRef]
  16. Wang, C.; Yun, S.; Xu, H.; Wang, Z.; Han, F.; Zhang, Y.; Si, Y.; Sun, M. Dual Functional Application of Pomelo Peel-Derived Bio-Based Carbon with Controllable Morphologies: An Efficient Catalyst for Triiodide Reduction and Accelerant for Anaerobic Digestion. Ceram. Int. 2020, 46, 3292–3303. [Google Scholar] [CrossRef]
  17. Dhillon, K.K.; Patyal, M.; Bhogal, S.; Gupta, N. A Review on Advanced Counter Electrode Materials for High-Efficiency Dye Sensitized Solar Cells. J. Coord. Chem. 2024, 77, 1933–1968. [Google Scholar] [CrossRef]
  18. Dhonde, M.; Sahu, K.; Das, M.; Yadav, A.; Ghosh, P.; Murty, V.V.S. Review—Recent Advancements in Dye-Sensitized Solar Cells; From Photoelectrode to Counter Electrode. J. Electrochem. Soc. 2022, 169, 066507. [Google Scholar] [CrossRef]
  19. Kakiage, K.; Aoyama, Y.; Yano, T.; Oya, K.; Fujisawa, J.I.; Hanaya, M. Highly-Efficient Dye-Sensitized Solar Cells with Collaborative Sensitization by Silyl-Anchor and Carboxy-Anchor Dyes. Chem. Commun. 2015, 51, 15894–15897. [Google Scholar] [CrossRef]
  20. Safian, M.T.-U.; Umar, K.; Mohamad Ibrahim, M.N. Synthesis and Scalability of Graphene and Its Derivatives: A Journey towards Sustainable and Commercial Material. J. Clean. Prod. 2021, 318, 128603. [Google Scholar] [CrossRef]
  21. Xu, X.; Yang, W.; Chen, B.; Zhou, C.; Ma, X.; Hou, L.; Tang, Y.; Yang, F.; Ning, G.; Zhang, L.; et al. Phosphorus-Doped Porous Graphene Nanosheet as Metal-Free Electrocatalyst for Triiodide Reduction Reaction in Dye-Sensitized Solar Cell. Appl. Surf. Sci. 2017, 405, 308–315. [Google Scholar] [CrossRef]
  22. Safian, M.T.-U.; Raja, P.B.; Shen, C.Y.; Mohamad Ibrahim, M.N. A Novel Preparation of Bio-Based Graphene from Oil Palm Biomass as a Fluid Loss Additive in Water-Based Drilling Fluid. Geoenergy Sci. Eng. 2023, 231, 212321. [Google Scholar] [CrossRef]
  23. Awasthi, M.K.; Sarsaiya, S.; Patel, A.; Juneja, A.; Singh, R.P.; Yan, B.; Awasthi, S.K.; Jain, A.; Liu, T.; Duan, Y.; et al. Refining Biomass Residues for Sustainable Energy and Bio-Products: An Assessment of Technology, Its Importance, and Strategic Applications in Circular Bio-Economy. Renew. Sustain. Energy Rev. 2020, 127, 109876. [Google Scholar] [CrossRef]
  24. Kumarasinghe, K.D.M.S.P.K.; Kumara, G.R.A.; Rajapakse, R.M.G.; Liyanage, D.N.; Tennakone, K. Activated Coconut Shell Charcoal Based Counter Electrode for Dye-Sensitized Solar Cells. Org. Electron. 2019, 71, 93–97. [Google Scholar] [CrossRef]
  25. Madhu, R.; Veeramani, V.; Chen, S.M.; Palanisamy, J.; Ezhil Vilian, A.T. Pumpkin Stem-Derived Activated Carbons as Counter Electrodes for Dye-Sensitized Solar Cells. RSC Adv. 2014, 4, 63917–63921. [Google Scholar] [CrossRef]
  26. Tiihonen, A.; Siipola, V.; Lahtinen, K.; Pajari, H.; Widsten, P.; Tamminen, T.; Kallio, T.; Miettunen, K. Biocarbon from Brewery Residues as a Counter Electrode Catalyst in Dye Solar Cells. Electrochim. Acta 2021, 368, 137583. [Google Scholar] [CrossRef]
  27. El Korhani, O.; Zaouk, D.; Cerneaux, S.; Khoury, R.; Khoury, A.; Cornu, D. Synthesis and Performances of Bio-Sourced Nanostructured Carbon Membranes Elaborated by Hydrothermal Conversion of Beer Industry Wastes. Nanoscale Res. Lett. 2013, 8, 121. [Google Scholar] [CrossRef]
  28. Güleç, F.; Riesco, L.M.G.; Williams, O.; Kostas, E.T.; Samson, A.; Lester, E. Hydrothermal Conversion of Different Lignocellulosic Biomass Feedstocks—Effect of the Process Conditions on Hydrochar Structures. Fuel 2021, 302, 121166. [Google Scholar] [CrossRef]
  29. Mian, M.M.; Liu, G. Recent Progress in Biochar-Supported Photocatalysts: Synthesis, Role of Biochar, and Applications. RSC Adv. 2018, 8, 14237–14248. [Google Scholar] [CrossRef]
  30. Davies, G.; McGregor, J. Hydrothermal Synthesis of Biomass-Derived Magnetic Carbon Composites for Adsorption and Catalysis. ACS Omega 2021, 6, 33000–33009. [Google Scholar] [CrossRef]
  31. Smith, A.M.; Whittaker, C.; Shield, I.; Ross, A.B. The Potential for Production of High Quality Bio-Coal from Early Harvested Miscanthus by Hydrothermal Carbonisation. Fuel 2018, 220, 546–557. [Google Scholar] [CrossRef]
  32. Zulkornain, M.F.; Shamsuddin, A.H.; Normanbhay, S.; Md Saad, J.; Zhang, Y.S.; Samsuri, S.; Wan Ab Karim Ghani, W.A. Microwave-Assisted Hydrothermal Carbonization for Solid Biofuel Application: A Brief Review. Carbon Capture Sci. Technol. 2021, 1, 100014. [Google Scholar] [CrossRef]
  33. Tripathi, M.; Sahu, J.N.; Ganesan, P.; Dey, T.K. Effect of Temperature on Dielectric Properties and Penetration Depth of Oil Palm Shell (OPS) and OPS Char Synthesized by Microwave Pyrolysis of OPS. Fuel 2015, 153, 257–266. [Google Scholar] [CrossRef]
  34. Rodriguez Ortiz, L.; Torres, E.; Zalazar, D.; Zhang, H.; Rodriguez, R.; Mazza, G. Influence of Pyrolysis Temperature and Bio-Waste Composition on Biochar Characteristics. Renew. Energy 2020, 155, 837–847. [Google Scholar] [CrossRef]
  35. Sevilla, M.; Fuertes, A.B. Chemical and Structural Properties of Carbonaceous Products Obtained by Hydrothermal Carbonization of Saccharides. Chem.—Eur. J. 2009, 15, 4195–4203. [Google Scholar] [CrossRef]
  36. Zhang, J.; An, Y.; Borrion, A.; He, W.; Wang, N.; Chen, Y.; Li, G. Process Characteristics for Microwave Assisted Hydrothermal Carbonization of Cellulose. Bioresour. Technol. 2018, 259, 91–98. [Google Scholar] [CrossRef]
  37. Samantaray, M.R.; Mondal, A.K.; Murugadoss, G.; Pitchaimuthu, S.; Das, S.; Bahru, R.; Mohamed, M.A. Synergetic Effects of Hybrid Carbon Nanostructured Counter Electrodes for Dye-Sensitized Solar Cells: A Review. Materials 2020, 13, 2779. [Google Scholar] [CrossRef]
  38. Zhang, X.; Fan, R.; Liu, M.; Cao, Y.; Sun, P.; Zhang, Y.; Hao, M.; Zhang, Y.; Zhang, W.; Li, L. Preparation of CoNi@CN Composites Based on Metal-Organic Framework Materials as High Efficiency Counter Electrode Materials for Dye-Sensitized Solar Cells. Sol. Energy 2022, 231, 767–774. [Google Scholar] [CrossRef]
  39. Sun, L.; Zhang, Q.; Liang, Q.; Li, W.; Li, X.; Liu, S.; Shuai, J. α-Fe2O3/Reduced Graphene Oxide Composites as Cost-Effective Counter Electrode for Dye-Sensitized Solar Cells. Catalysts 2022, 12, 645. [Google Scholar] [CrossRef]
  40. Wu, J.; Lan, Z.; Lin, J.; Huang, M.; Huang, Y.; Fan, L.; Luo, G.; Lin, Y.; Xie, Y.; Wei, Y. Counter Electrodes in Dye-Sensitized Solar Cells. Chem. Soc. Rev. 2017, 46, 5975–6023. [Google Scholar] [CrossRef]
  41. Anabalón Fuentes, P.; Kopp Pailañir, M.; Rocha Mella, S.; González Quijón, M.E.; Marzialetti Bernardi, T.; Cea Lemus, M. Development of Bifunctional Biochar/Iron Oxide Composites for Tetracycline Removal from Synthetic Wastewater. J. Water Process Eng. 2024, 64, 105509. [Google Scholar] [CrossRef]
  42. Lataf, A.; Khalil Awad, A.E.; Joos, B.; Carleer, R.; Yperman, J.; Schreurs, S.; D’Haen, J.; Cuypers, A.; Vandamme, D. Iron Oxide-Activated Carbon Composites for Enhanced Microwave-Assisted Pyrolysis of Hardwood. Environments 2024, 11, 102. [Google Scholar] [CrossRef]
  43. Olszewski, M.P.; Arauzo, P.J.; Wądrzyk, M.; Kruse, A. Py-GC-MS of Hydrochars Produced from Brewer’s Spent Grains. J. Anal. Appl. Pyrolysis 2019, 140, 255–263. [Google Scholar] [CrossRef]
  44. Zhang, L.; Dong, Y.; Liu, J.; Liu, C.; Liu, W.; Lin, H. The Effect of Co-Pyrolysis Temperature for Iron-Biochar Composites on Their Adsorption Behavior of Antimonite and Antimonate in Aqueous Solution. Bioresour. Technol. 2022, 347, 126362. [Google Scholar] [CrossRef] [PubMed]
  45. Zazo, J.A.; Bedia, J.; Fierro, C.M.; Pliego, G.; Casas, J.A.; Rodriguez, J.J. Highly Stable Fe on Activated Carbon Catalysts for CWPO upon FeCl3 Activation of Lignin from Black Liquors. Catal. Today 2012, 187, 115–121. [Google Scholar] [CrossRef]
  46. Wrogemann, J.M.; Fromm, O.; Deckwirth, F.; Beltrop, K.; Heckmann, A.; Winter, M.; Placke, T. Impact of Degree of Graphitization, Surface Properties and Particle Size Distribution on Electrochemical Performance of Carbon Anodes for Potassium-Ion Batteries. Batter. Supercaps 2022, 5, e202200045. [Google Scholar] [CrossRef]
  47. Sert, S.; Gultekin, Ş.S.; Gültekin, B.; Duran Kaya, D.; Körlü, A. A Facile Approach to Produce Activated Carbon from Waste Textiles via Self-Purging Microwave Pyrolysis and FeCl3 Activation for Electromagnetic Shielding Applications. Polymers 2024, 16, 915. [Google Scholar] [CrossRef]
  48. Aslam, J.; Waseem, M.A.; Lu, X.M.; Sun, W.; Wang, Y. From Biochar to Battery Electrodes: A Pathway to Green Lithium and Sodium-Ion Battery Systems. Chem. Eng. J. 2025, 505, 159556. [Google Scholar] [CrossRef]
  49. Kumar Mishra, R.; Singh, B.; Acharya, B. A Comprehensive Review on Activated Carbon from Pyrolysis of Lignocellulosic Biomass: An Application for Energy and the Environment. Carbon Resour. Convers. 2024, 7, 100228. [Google Scholar] [CrossRef]
  50. Mopoung, S.; Dejang, N. Activated Carbon Preparation from Eucalyptus Wood Chips Using Continuous Carbonization–Steam Activation Process in a Batch Intermittent Rotary Kiln. Sci. Rep. 2021, 11, 13948. [Google Scholar] [CrossRef]
  51. Olszewski, M.P.; Nicolae, S.A.; Arauzo, P.J.; Titirici, M.M.; Kruse, A. Wet and Dry? Influence of Hydrothermal Carbonization on the Pyrolysis of Spent Grains. J. Clean. Prod. 2020, 260, 121101. [Google Scholar] [CrossRef]
  52. Wang, Y.; Qiu, L.; Zhu, M.; Sun, G.; Zhang, T.; Kang, K. Comparative Evaluation of Hydrothermal Carbonization and Low Temperature Pyrolysis of Eucommia Ulmoides Oliver for the Production of Solid Biofuel. Sci. Rep. 2019, 9, 5535. [Google Scholar] [CrossRef] [PubMed]
  53. Lech, M.; Labus, K. The Methods of Brewers’ Spent Grain Treatment towards the Recovery of Valuable Ingredients Contained Therein and Comprehensive Management of Its Residues. Chem. Eng. Res. Des. 2022, 183, 494–511. [Google Scholar] [CrossRef]
  54. Mahendran, G.B.; Ramalingam, S.J.; Rayappan, J.B.B.; Kesavan, S.; Periathambi, T.; Nesakumar, N. Green Preparation of Reduced Graphene Oxide by Bougainvillea Glabra Flower Extract and Sensing Application. J. Mater. Sci. Mater. Electron. 2020, 31, 14345–14356. [Google Scholar] [CrossRef]
  55. BhaskaraRao, B.V.; Pabba, D.P.; Aepuru, R.; Akbari-Fakhrabadi, A.; Lokhande, P.; Udayabhaskar, R.; Rosales-Vera, M.; Espinoza-González, R. Fe3O4 Nanoparticles Intercalated Reduced Graphene Oxide Nanosheets for Supercapacitor and Lithium-Ion Battery Anode Performance. J. Mater. Sci. Mater. Electron. 2023, 34, 1910. [Google Scholar] [CrossRef]
  56. Yu, Y.; Wang, X.; Zhang, H.; Cao, Z.; Wu, H.; Jia, B.; Yang, J.J.; Qu, X.; Qin, M. Large-Scale Synthesis of Ultrafine Fe3C Nanoparticles Embedded in Mesoporous Carbon Nanosheets for High-Rate Lithium Storage. RSC Adv. 2022, 12, 6508–6514. [Google Scholar] [CrossRef]
  57. Horikawa, Y.; Hirano, S.; Mihashi, A.; Kobayashi, Y.; Zhai, S.; Sugiyama, J. Prediction of Lignin Contents from Infrared Spectroscopy: Chemical Digestion and Lignin/Biomass Ratios of Cryptomeria Japonica. Appl. Biochem. Biotechnol. 2019, 188, 1066–1076. [Google Scholar] [CrossRef]
  58. Al-Hazmi, G.H.; Saad, H.A.; Refat, M.S.; Adam, A.M.A. Fe3O4-Carbon-Based Composite Derived from the Charge-Transfer Reaction Using Waste Tea Leaves as the Carbon Precursor for Enhanced Removing of Azocarmine G2, Methyl Violet 2B, Eosin B, and Toluidine Blue from Aqueous Solution. Crystals 2022, 12, 1355. [Google Scholar] [CrossRef]
  59. Li, J.; Lan, H.; Zhang, W.; An, X.; Liu, H.; Qu, J. Characterization on the Formation Mechanism of Fe0/Fe3C/C Nanostructure and Its Effect on PMS Activation Performance towards BPA Degradation. Chem. Eng. J. 2022, 435, 134709. [Google Scholar] [CrossRef]
  60. Xu, Z.; Sun, Z.; Zhou, Y.; Chen, W.; Zhang, T.; Huang, Y.; Zhang, D. Insights into the Pyrolysis Behavior and Adsorption Properties of Activated Carbon from Waste Cotton Textiles by FeCl3-Activation. Colloids Surf. A Physicochem. Eng. Asp. 2019, 582, 123934. [Google Scholar] [CrossRef]
  61. Shen, Y.; Jing, T.; Ren, W.; Zhang, J.; Jiang, Z.G.; Yu, Z.Z.; Dasari, A. Chemical and Thermal Reduction of Graphene Oxide and Its Electrically Conductive Polylactic Acid Nanocomposites. Compos. Sci. Technol. 2012, 72, 1430–1435. [Google Scholar] [CrossRef]
  62. Pusceddu, E.; Santilli, S.F.; Fioravanti, G.; Montanaro, A.; Miglietta, F.; Foscolo, P.U. Chemical-Physical Analysis and Exfoliation of Biochar-Carbon Matter: From Agriculture Soil Improver to Starting Material for Advanced Nanotechnologies. Mater Res. Express 2019, 6, 115612. [Google Scholar] [CrossRef]
  63. Ghosh, D.; Banerjee, R.; Bhaduri, S.N.; Chatterjee, R.; Ghosh, A.B.; Das, S.; Pramanick, I.; Bhaumik, A.; Biswas, P. Fe3C/Fe Decorated N-Doped Carbon Derived from Tetrabutylammonium Tetrachloroferrate Complex as Bifunctional Electrocatalysts for ORR, OER and Zn-Air Batteries in Alkaline Medium. Chem. Asian J. 2024, 19, e202300933. [Google Scholar] [CrossRef] [PubMed]
  64. Dos Reis, G.S.; de Oliveira, H.P.; Larsson, S.H.; Thyrel, M.; Lima, E.C. A Short Review on the Electrochemical Performance of Hierarchical and Nitrogen-Doped Activated Biocarbon-Based Electrodes for Supercapacitors. Nanomaterials 2021, 11, 424. [Google Scholar] [CrossRef] [PubMed]
  65. Gu, W.; Sevilla, M.; Magasinski, A.; Fuertes, A.B.; Yushin, G. Sulfur-Containing Activated Carbons with Greatly Reduced Content of Bottle Neck Pores for Double-Layer Capacitors: A Case Study for Pseudocapacitance Detection. Energy Environ. Sci. 2013, 6, 2465–2476. [Google Scholar] [CrossRef]
  66. Mohammad, F.Z.; Ahmad, I.; Siddiqui, J.J.; Ali, K.M.; Mudsar, M.; Arshad, H. Light Weight RGO/Fe3O4 Nanocomposite for Efficient Electromagnetic Absorption Coating in X-Band. J. Mater. Sci. Mater. Electron. 2018, 29, 19775–19782. [Google Scholar] [CrossRef]
  67. Ma, J.; Wang, X.; Cao, W.; Han, C.; Yang, H.; Yuan, J.; Cao, M. A Facile Fabrication and Highly Tunable Microwave Absorption of 3D Flower-like Co3O4-RGO Hybrid-Architectures. Chem. Eng. J. 2018, 339, 487–498. [Google Scholar] [CrossRef]
  68. Li, Q.; Zhang, Y.; Song, Y.; Yang, H.; Yang, L.; Bai, L.; Wei, D.; Wang, W.; Liang, Y.; Chen, H. Apple Residues Derived Porous Carbon Nanosheets Synthesized with FeCl3 Assisted Hydrothermal Carbonization for Supercapacitors with High Rate Performance. Carbon Lett. 2023, 33, 549–560. [Google Scholar] [CrossRef]
  69. Li, H.; Zhang, M.; Wang, M.; Du, M.; Wang, Z.; Zou, Y.; Pan, G.; Zhang, J.; Li, H.; Zhang, M.; et al. Balancing Edge Defects and Graphitization in a Pt–Fe/Carbon Electrocatalyst for High-Power-Density and Durable Flow Seawater-Al/Acid Hybrid Fuel Cells and Zn–Air Batteries. Adv. Sci. 2024, 11, 2308923. [Google Scholar] [CrossRef]
  70. Chai, Y.; Wan, C.; Cheng, W.; Zeng, Q.; Li, X.; Wu, Y. Wood-Derived Pore-Rich Carbon: A Green Catalyst for Counter Electrodes of Dye-Sensitized Solar Cells. Mater. Sci. Eng. B 2023, 296, 116663. [Google Scholar] [CrossRef]
  71. Chang, B.-Y. The Effective Capacitance of a Constant Phase Element with Resistors in Series and Parallel. SSRN Electron. J. 2022, 13, 479–485. [Google Scholar] [CrossRef]
  72. Kanjana, N.; Maiaugree, W.; Tontapha, S.; Laokul, P.; Chingsungnoen, A.; Pimanpang, S.; Chaiya, I.; Daengsakul, S.; Amornkitbamrung, V. Effect of Carbonization Temperature on the Electrocatalytic Property and Efficiency of Dye-Sensitized Solar Cells Derived from Corncob and Sugarcane Leaf Agricultural Residues. Biomass Convers. Biorefin. 2023, 13, 8361–8371. [Google Scholar] [CrossRef]
  73. Chen, M.; Shao, L.L. Review on the Recent Progress of Carbon Counter Electrodes for Dye-Sensitized Solar Cells. Chem. Eng. J. 2016, 304, 629–645. [Google Scholar] [CrossRef]
  74. Qi, R.; Xu, Z.; Zhou, Y.; Zhang, D.; Sun, Z.; Chen, W.; Xiong, M. Clean Solid Fuel Produced from Cotton Textiles Waste through Hydrothermal Carbonization with FeCl3: Upgrading the Fuel Quality and Combustion Characteristics. Energy 2021, 214, 118926. [Google Scholar] [CrossRef]
  75. Macdermid-Watts, K.; Adewakun, E.; Norouzi, O.; Abhi, T.D.; Pradhan, R.; Dutta, A. Effects of FeCl3 Catalytic Hydrothermal Carbonization on Chemical Activation of Corn Wet Distillers’ Fiber. ACS Omega 2021, 6, 14875–14886. [Google Scholar] [CrossRef] [PubMed]
  76. Hu, Y.C.; Hsu, W.L.; Wang, Y.T.; Ho, C.T.; Chang, P.Z. Enhance the Pyroelectricity of Polyvinylidene Fluoride by Graphene-Oxide Doping. Sensors 2014, 14, 6877–6890. [Google Scholar] [CrossRef]
  77. Kim, H.; Bin, Y.; Karthick, S.N.; Hemalatha, K.V.; Raj, C.J.; Venkatesan, S.; Park, S.; Vijayakumar, G. Natural Dye Extracted from Rhododendron Species Flowers as a Photosensitizer in Dye Sensitized Solar Cell. Int. J. Electrochem. Sci. 2013, 8, 6734–6743. [Google Scholar] [CrossRef]
Figure 1. SEM image of the iron oxide/biochar composite: (a) BSG Fe hydrochar, (b) BSG Fe MW 700, (c) BSG Fe MW 800 and (d) BSG Fe MW 900.
Catalysts 15 00433 g001
Figure 2. Thermogravimetric analysis (TGA) of the developed composite. (a) Thermal decomposition as a function of weight and (b) first derivative of mass loss (DTG) of the composite developed with iron oxide/biochar pyrolyzed at 700, 800 and 900 °C.
Catalysts 15 00433 g002
Figure 3. FTIR spectra of iron oxide/biochar composite pyrolyzed samples at 700, 800 and 900 °C and bagasse.
Catalysts 15 00433 g003
Figure 4. X-ray diffractogram spectra of the iron oxide/biochar composite prepared with iron oxide/biochar pyrolyzed at 700, 800 and 900 °C. The gray heart represents reduced iron oxide (rGO) and the blue spade and green clover represent the presence of magnetite (Fe3O4) and iron carbide (Fe3C), respectively.
Catalysts 15 00433 g004
Figure 5. Raman spectra of iron oxide/biochar composite pyrolyzed at 700, 800 and 900 °C.
Catalysts 15 00433 g005
Figure 6. (a) Cyclic voltammogram of electrodes developed with iron oxide/biochar composite pyrolyzed at 700, 800 and 900 °C, Pt counter electrode, immersed in 30 mM iodide-based redox electrolyte (Iodolyte H30) in acetonitrile with a rate of 0.025 V/s. (b) Electrochemical impedance spectroscopy of electrodes fabricated with iron oxide/biochar-based composite pyrolyzed at 700, 800 and 900 °C and Pt catalyst with 30 mM iodide-based redox electrolyte (Iodolyte H30) in acetonitrile.
Catalysts 15 00433 g006
Figure 7. Tafel curves of symmetrical cells made with composite pyrolyzed at 700, 800 and 900 °C at a scan rate of 0.001 V/s.
Catalysts 15 00433 g007
Figure 8. (a) J-V curve for DSSCs fabricated with iron oxide/biochar composite pyrolyzed at 700, 800 and 900 °C. (b) Power curve for DSSCs fabricated with iron oxide/biochar composite pyrolyzed at 700, 800 and 900 °C.
Catalysts 15 00433 g008
Table 1. Physic-chemical analysis of iron oxide/biochar composites.
Elemental Analysis (wt.%)BET/BJH Analysis
SampleCHNFeSBET (m2/g)VP (cm3/g)DP (nm)
BSG Fe MW 70092.27 ± 1.262.66 ± 0.221.03 ± 0.081.84 ± 0.11110.6400.0281.87
BSG Fe MW 80094.40 ± 0.682.26 ± 0.041.15 ± 0.090.28 ± 0.0013.0870.0291.88
BSG Fe MW 90091.97 ± 1.651.08 ± 0.340.78± 0.060.76 ± 0.379.5610.0371.86
Table 2. Intensity values of D and G bands of the biochar and iron oxide/biochar composite based of residual brewery biomass.
SampleDGID/IG
BSG Fe MW 700133315840.90
BSG Fe MW 800133815880.95
BSG Fe MW 900134815860.94
Table 3. CV parameters for iron oxide/biochar composites pyrolyzed at 700, 800 and 900 °C.
E p c (V) I p c (mA)
Pt−0.20 ± 0.000−3.7 ± 0.0003
BSG Fe MW 700−0.79 ± 0.0003−6.6 ± 0.0009
BSG Fe MW 800−0.54 ± 0.0000−5.3 ± 0.0003
BSG Fe MW 900−0.84 ± 0.0003−5.4± 0.0003
Table 4. EIS parameters of the equivalent circuit.
R S   ( Ω ⋅cm) R CT   ( Ω ⋅cm)CPE (F/cm2)n
Pt27.312614.20.80
BSG Fe MW 70023.378815.80.82
BSG Fe MW 80043.329726.60.80
BSG Fe MW 90029.885518.20.83
Table 5. Exchange current density of catalysts applied in symmetric cells.
J0 (mA/cm2)Jlim
Pt14.6705.607
BSG Fe MW 70011.8265.449
BSG Fe MW 80020.5936.036
BSG Fe MW 9001.14294.781
Table 6. Performance parameters of DSSCs fabricated with counter electrode based on a pyrolyzed iron oxide/biochar composite at 700, 800 and 900 °C, evaluated under standard conditions (1.5 AM and 100 mW/cm2, at 25 °C).
Counter ElectrodeVoc (V)Jsc (mA/cm2)Pmáx
(mW)
FFEfficiency (%)
Pt0.66812.261.1080.544.43
BSG Fe MW 7000.55610.440.5900.412.36
BSG Fe MW 8000.56611.900.7620.443.05
BSG Fe MW 9000.6149.1870.6660.472.66
Disclaimer/Publisher’s Note: The statements, opinions and data contained in all publications are solely those of the individual author(s) and contributor(s) and not of MDPI and/or the editor(s). MDPI and/or the editor(s) disclaim responsibility for any injury to people or property resulting from any ideas, methods, instructions or products referred to in the content.

