Article

Geometric Matching Effect Induced High Dispersion of Na2WO4 Nanocluster on Cristobalite Support for Efficient Methyl Chloride-to-Vinyl Chloride Conversion

Institute of Catalysis, Zhejiang University, Hangzhou 310027, China
*
Authors to whom correspondence should be addressed.
These authors contributed equally to this work.
Catalysts 2025, 15(4), 382; https://doi.org/10.3390/catal15040382
Submission received: 14 March 2025 / Revised: 6 April 2025 / Accepted: 14 April 2025 / Published: 16 April 2025
(This article belongs to the Collection Highly Dispersed Nanocatalysts)

Abstract

:
The oxidative coupling of methyl chloride (CH3Cl) to vinyl chloride (C2H3Cl) (MCTV) represents a promising yet challenging direct conversion route for C2H3Cl production. In this study, a novel catalyst, cristobalite silica, supported Na2WO4 nanoclusters, was fabricated by calcining an intermediate composite composed by β-zeolite and sodium tungstate (Na2WO4). The pore structure of this β-zeolite possesses a regular shape and suitable size distribution, providing an accurate geometric matching effect for Na2WO4 to homogeneously distribute in the entire β-zeolite matrix with high loading. Accordingly, the excellent dispersity of Na2WO4 nanocluster active sites is well maintained even after calcining at 750 °C, and the microporous β-zeolite matrix is completely converted to dense cristobalite phase silica after the calcination. The high-loading and well-dispersed Na2WO4 nanocluster leads to a superior performance in MCTV with a CH3Cl conversion of 81.5%, a C2H3Cl selectivity of 42.4%, and a C2H3Cl yield of 34.6%. Notably, the catalyst exhibits remarkable stability during the catalytic process.

Graphical Abstract

1. Introduction

Polyvinyl chloride (PVC), with its diverse applications in packaging, construction, and manufacturing industries, ranks third in global plastic production [1,2,3]. Currently, the production of its monomer, vinyl chloride (C2H3Cl), mainly relies on various C2 hydrocarbons derived from nonrenewable coal and petroleum [4,5,6,7,8], which are associated with issues such as expensive raw materials, high energy consumption, and severe pollution [9,10,11,12]. It has always been a long-standing goal to upgrade C2H3Cl production to a more sustainable and cost-effective pathway [13]. However, there is still no alternative production route that can compete with the current industry production route in terms of cost and environmental impact.
On the other hand, methyl chloride (CH3Cl) can be easily produced from low-cost and renewable C1 platform molecules, including methane and methanol [14,15,16,17]. The low price, large production capacity, and unique chemical properties of CH3Cl attract substantial attention. In recent years, researchers have developed a variety of catalytic conversion processes using CH3Cl as a raw material to produce other high-value chemicals [18,19,20,21]. For example, CH3Cl can be efficiently converted into ethylene and propylene via ZSM-5 catalysts [18]. Very recently, a highly promising synthesis route was proposed for C2H3Cl production, which utilizes the oxidative coupling of methyl chloride to produce vinyl chloride (MCTV) using high-concentration tungstate clusters embedded in a ZrO2 matrix [22]. This new production route uses a cheaper and renewable C1 chemical as a raw material and works at a relatively low reaction temperature, making it a greener and more economical production route. Compared with the currently mainstream ethylene-based balanced process [23,24], it has the potential to significantly reduce climate change impact (24%) and cost (38%) [22]. However, it still needs to develop more effective catalysts with higher selectivity and yield to make this MCTV route outperform the existing production processes in practical terms.
The dispersion states of metal, metal oxide, metal oxalate, etc., as active species, on the support and the interaction with the support, etc., have important impacts on the catalytic performance and stability [25,26]. The tungstate nanocluster was recognized as the catalytically active site in the MCTV process, which determined the conversion pathway of the reaction intermediate ·CH2Cl in a series of reaction steps [22]. Consequently, the dispersion state of sodium tungstate (Na2WO4) on the catalyst support directly influences the yield, selectivity, and stability of the catalyst [22,27]. However, the balance between increasing the loading amount of Na2WO4 to promote the conversion efficiency and preventing the active Na2WO4 nanocluster from aggregating on the catalyst support is always a great challenge. Previous studies indicated that, regardless of whether zirconia, which forms strong interactions with WO42− species [22], or the more commonly employed inert silica support [27], is utilized, the loading of Na2WO4 typically must not exceed 5 wt%. Excessive loading leads to severe aggregation of the active nanocluster species, and the resulting large Na2WO4 crystal dramatically decreases the catalytic performance. To date, the synthesis of high-loading Na2WO4/support materials while maintaining their high dispersion remains a great challenge.
In this work, a pure silica β-zeolite was adopted as a precursor material for the silica support of the target catalyst. Na2WO4 aqueous solution was impregnated into the pore channels of β-zeolite with a high loading of 10 wt%, forming a densely but still uniformly dispersed intermediate composite. The MCTV catalyst was thereafter fabricated by calcining the intermediate composite at a high temperature of 750 °C. Due to the accurate shape- and size-matching effect [28,29,30,31], the Na2WO4 maintained a perfect nanocluster state despite the microporous β-zeolites matrix being completely converted to a highly crystallized cristobalite phase silica support after the calcination. Since MCTV is a recently proposed reaction route, no material has been recognized as a benchmark catalyst for this process. As comparative samples, a mesoporous silica FDU-12 with an amorphous silica framework and a large pore size of ~10 nm, and two other microporous pure silica zeolites with different pore sizes and geometric shape pore channels, ZSM-22 and S-1, as well as a non-porous cristobalite powder, were analogously used to fabricate catalysts with 10 wt% Na2WO4 loading following the same impregnation–calcination process. None of them achieved a similarly good dispersion of Na2WO4 nanoclusters, emphasizing the importance of the specific and accurate shape- and size-matching effect between Na2WO4 and β-zeolite, which can be regarded as the key to achieving a high loading of Na2WO4 nanoclusters with a well-dispersed state. Catalytic performance data for the MCTV process further validated the superior performance of the Na2WO4/β-C catalyst in the oxidative coupling of CH3Cl, demonstrating not only high activity and excellent selectivity but also a prolonged catalyst lifetime. This research holds promise for addressing the challenges of complex synthesis processes and low reactivity in existing MCTV catalysts, offering a novel strategy for the green production of C2H3Cl.

2. Results and Discussion

2.1. Structural Characterization

A mesoporous silica FDU-12, and three pure silica zeolites, including β-zeolite, ZSM-22, and S-1 zeolite, were synthesized according to the hydrothermal methods reported in the literature [32,33,34,35]. XRD analysis results confirmed that the FDU-12 was in an amorphous state, and the three other zeolites possessed the expected crystal structure, consistent with the corresponding literature (Figure S1). These materials showed different particle morphologies in their SEM images due to their different crystal structures (Figure S2). The particle sizes of the β-zeolite, S-1 zeolite, ZSM-22 zeolite, and FDU-12 [36] were in the range of 5–10 µm, 0.2–0.5 µm, 2–5 µm, and 20–50 µm, respectively.
Diffraction peaks belonging to Na2WO4 were recorded in all these samples but with noticeable differences in their peak intensities, indicating that the dispersion state of Na2WO4 is apparently different in these cases. Once again, the catalyst fabricated from β-zeolite exhibited the weakest peaks of Na2WO4, indicating that Na2WO4 maintains better dispersion during the transformation of β-zeolite to α-cristobalite [37]. In contrast, the other four catalysts exhibited more pronounced Na2WO4 diffraction peaks. To semi-quantitatively assess the dispersion of Na2WO4 species, we calculated the intensity ratio of the two strongest diffraction peaks of Na2WO4 and α-cristobalite: 27.8° and 22.2°, respectively. This method is widely used in the semi-quantitative analysis of metal species in composite catalysts [38,39]. As shown in Figure 1c, the I27.8°/I22.2° ratio for 10W/β-C is only 4.1%, while for 10W/C, 10W/FDU-C, 10W/S1-C, and 10W/Z22-C, the ratios are 15.1, 16.2, 16.8, and 25.6%. These results indicate a distinct better dispersion of Na2WO4 on 10W/β-C, and they suggest that the confinement effect of β-zeolite effectively maintains the dispersion of Na2WO4 even after a high-temperature calcination treatment, preventing sintering or deactivation phenomena [40].
The Raman spectra of the five calcined catalysts with 10 wt% Na2WO4 fabricated from different silica precursors are shown in Figure 1d. All catalysts exhibited two main bands at 233 and 471 cm−1, corresponding to the α-cristobalite support. Except for 10W/β-C, the other four catalysts all displayed a distinct Raman band at 933 cm−1, attributed to the W=O bond in isolated four-coordinated Na2WO4. This is unique to the coexistence of WOx and Na promoters, indicating Na2WO4 aggregation forms on their surfaces. The extremely weak 933 cm−1 band for the 10W/β-C sample indicates highly dispersed Na2WO4 sites [41].
The transmission electron microscopy (TEM) image of 10W/β-C (Figure S2) shows a homogeneous contrast without any nanoporosity and large Na2WO4 particles. This further demonstrates that the microporous zeolite was converted to dense silica support and that the Na2WO4 was homogeneously distributed with an extremely small size. The 10W/β-C catalyst retains its particle uniformity without noticeable sintering between particles after the calcination treatment (Figure S3). The other two catalysts fabricated from S-1 and ZSM-5 zeolites exhibit significant particle sintering, which can be ascribed to the large amount of Na2WO4 on the surface acting as a sintering aid in these two cases. This result is further proof of the significantly better dispersion of Na2WO4 on the 10W/β-C catalyst.
The distribution of Na2WO4 species in 10W/β-C, 10W/Z22-C, and 10W/C catalysts was investigated using energy-dispersive X-ray spectroscopy (EDS) mapping (Figure 2a). It demonstrates the uniform dispersion of W and Na elements across the entire silica surface for the 10W/β-C catalyst, indicating the presence of a large number of uniformly distributed clusters. HR-TEM images confirm that Na2WO4 clusters are uniformly dispersed on the SiO2 substrate (Figure S4a) and the average size of the nanoclusters is ~1.6 nm (Figure S4b). In contrast, for 10W/C and 10W/Z22-C, the EDS maps reveal the significant aggregation of W and Na elements. These aggregated regions agree with the locations of the large particles observed in the SEM images, with particle sizes exceeding 100 nm (Figure 2b,c), confirming that the aggregated particles are Na2WO4. The SEM results, along with the XRD, Raman, ICP, and XPS results, all demonstrate that only when β-zeolite was used as a support did the Na2WO4 in the composite catalyst possess a uniform and highly dispersed nanocluster status. Conversely, non-porous cristobalite, mesoporous amorphous silica FDU-12, and other microporous zeolites like ZSM-22 lead to a clear aggregation status of Na2WO4 nanoparticles on the composite catalysts.
Since the dispersion of Na2WO4 on the catalyst fabricated from β-zeolite is better than others, a group of samples with different Na2WO4 loading amounts was analogously prepared following the same procedure. Before calcination, all the samples exhibited the typical β-zeolite structure in their XRD patterns (Figure S5a). No detectable Na2WO4 peaks were observed when the loading amount was 5 and 10 wt%, indicating that Na2WO4 species are highly dispersed within the β-zeolite in these cases. When the loading amount was increased to 15 wt%, weak Na2WO4 peaks were recorded, and the peak intensity significantly increased when the loading amount was further increased to 20 wt% and 30 wt%, suggesting that an excessive loading amount leads to a noticeable aggregation of Na2WO4 crystals on the surface of zeolite, and the maximum effective loading capacity is between 10 and 15 wt%. After it was calcined at 750 °C for 5 h, the crystal phase of the silica substrate was converted from the β-zeolite to α-cristobalite phase for each sample (Figure S5b). Meanwhile, the diffraction peaks of Na2WO4 for 5W/β-C and 10W/β-C were very weak, and only when the Na2WO4 loading amount reached 15 wt% and above, the peaks of Na2WO4 could be clearly observed. The corresponding I27.8°/I22.2° ratios for samples with 5, 10, 15, 20, and 30 wt% loading were 5.8, 8.8, 93.5, 232.1, and 269.5, which clearly suggests that the dispersion of Na2WO4 only became worse after the loading reached 15 wt%.
The inductively coupled plasma mass spectrometry (ICP-MS) and X-ray photoelectron spectroscopy (XPS) are employed to quantitatively analyze the W/Si molar ratios for the five catalysts (Figure 3a). XPS is a surface analysis technique that detects photoelectrons emitted from the material’s surface, typically probing the top 0.5–4 nm. ICP-MS involves the complete digestion of the sample and the detection of atomic emission spectra, providing bulk information. For ICP results, all samples exhibited bulk W/Si ratios close to the theoretical value calculated based on the loading amount, indicating that the impregnation–calcination treatment effectively retained the Na2WO4 in the composite catalysts. However, XPS results revealed that only the surface W/Si ratio of 10W/β-C was close to the theoretical feed ratio, while the surface W/Si ratios of the other four samples were much higher than the theoretical feed ratio, exceeding 45% to 75%. This suggests that Na2WO4 was more concentrated on the surfaces of these supports due to the severe surface aggregation. In other words, Na2WO4 species remained in the composite catalysts for all samples with no detectable loss, and the Na2WO4 species were uniformly distributed in the 10W/β-C sample across both the surface and bulk phases, while the Na2WO4 species tended to form surface aggregation on the other four samples.
Figure 3b presents the W 4f XPS spectra of the five catalysts. All spectra show two characteristic peaks at 36.9 eV and 34.9 eV, corresponding to the W 4f7/2 and W 4f5/2 photoelectrons of Na2WO4. To further investigate the coordination structure and chemical environment of tungsten species under reaction conditions, we collected W L1 edge X-ray absorption near the edge structure (XANES) spectra of the 10W/β-C catalyst (Figure 3c), which showed characteristic pre-edge peaks at ~12,115 eV, indicating that W species in the catalyst feature tetrahedral WO4 rather than octahedral WO6 structures. Meanwhile, the W 4f peaks showed no significant shifts across different silica supports, indicating that the chemical environment of tungstate remains largely unchanged regardless of the support type. These two characterization techniques confirm that after calcination, regardless of the type of silica support, the tungsten species present in the catalyst remain as sodium tungstate rather than tungsten oxide, which is consistent with the XRD and Raman results.

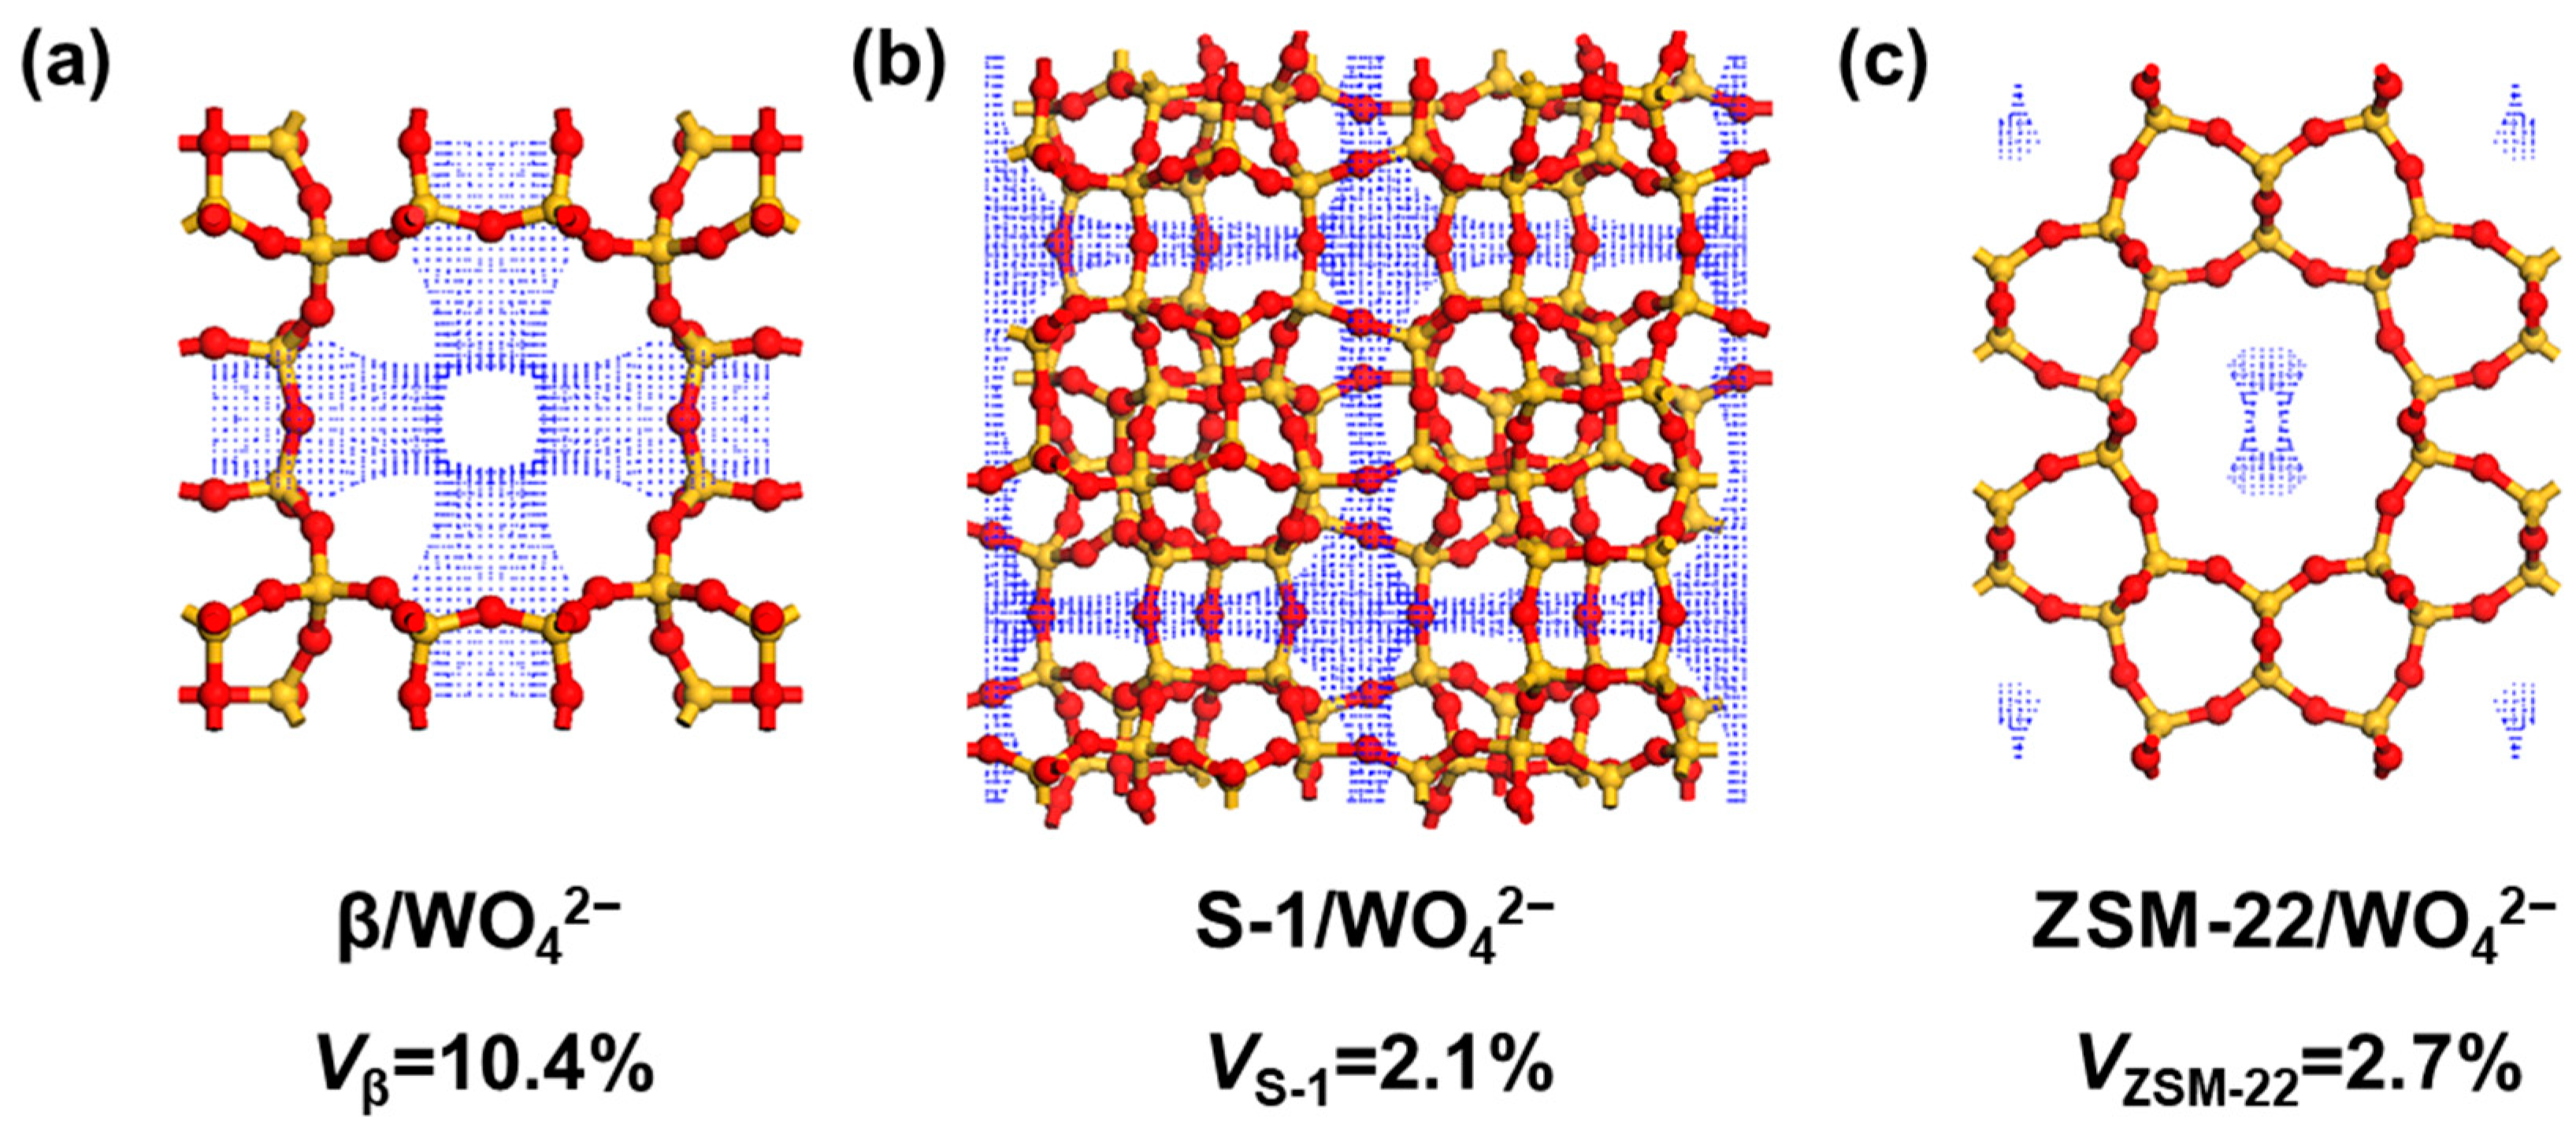
2.2. Zeolite Characterization and Calculation

As demonstrated above, β-zeolite showed significantly different behavior in confining the Na2WO4 in its pore channels compared to the other two zeolites, despite these three materials being all pure silica zeolites with microporosity. The pore size of β-zeolite is approximately 0.64 × 0.74 nm, which is slightly larger than that of ZSM-22 (0.46 × 0.57 nm) and S-1 (0.53 × 0.56 nm). The pore sizes of these three zeolites all seem to be significantly larger than the sizes of WO42− (0.39 nm) and Na+ (~0.2 nm), suggesting that Na2WO4 can be filled inside their pore channels. N2 adsorption–desorption analysis results (Table S1) show that the specific surface area of β-zeolite is 543 m2/g, and the pore volume is 0.93 cm3/g, whereas the specific surface areas of ZSM-22 and S-1 are only 371 and 261 m2/g, and the pore volumes are 0.49 and 0.34 cm3/g, respectively. The higher effective loading capacity for β-zeolite compared to S-1 and ZSM-22 zeolites can be partially ascribed to the difference in their pore volume. However, the dramatic difference between β-zeolite and the other samples cannot be simply ascribed to the difference in the pore volume of the surface areas. For example, FDU-12 possesses a similar surface area and pore volume to β-zeolite, and Na2WO4 can be efficiently filled inside the pore channels, while severe aggregation occurred after the high temperature calcination. This indicates that, to a certain extent, a zeolite with a larger pore volume and an appropriate pore size that is only slightly larger than the size of WO42− and Na+ can provide the most effective confinement environment for a large amount of Na2WO4 nanoclusters, which can be described as seamless embedding and a lock-up mechanism. A smaller pore volume cannot hold enough Na2WO4, and a large pore size cannot lock up the active species on the spot. Notably, after being subjected to high-temperature calcination, the surface area of the 10W/β-C catalyst decreased to 14 m2/g, and the pore volume decreased to 0.01 cm3/g. These findings confirm the collapse of the zeolite framework due to high-temperature transitions, resulting in an almost microporous diatomaceous structure. Despite the significant decrease in porosity and surface area after the silica phase transitions, Na2WO4 particles remained highly dispersed on the diatomaceous substrate.
In order to obtain more detailed information, we calculated the spatial regions within different zeolites that can accommodate WO42− based on van der Waals interactions [42,43]. As shown in Figure 4, the region enclosed by the blue dotted surface represents the accessible volume available for WO42− within the zeolite framework. The results suggest that WO42− preferentially resides in the largest pores of the zeolite. Furthermore, we calculated the ratio of accessible volume to the total unit cell volume, offering an estimate of the maximum theoretical Na2WO4 loading within the zeolite under ideal conditions [44]. For β-zeolite, this volume ratio is 10.4%, which is attributed to its relatively large pore size and thinner pore wall. This feature facilitates the penetration of Na2WO4 into the zeolite interior, minimizing its accumulation on the external surface during impregnation. In contrast, S-1 and ZSM-22 zeolites exhibit significantly lower volume ratios of 2.1% and 2.7%, respectively, owing to their smaller and more tortuous pore structures. These results suggest that although the pore volumes of S-1 and ZSM-22 are equivalent to 52.7% and 36.6% of that of β-zeolite, their effective volumes are only equivalent to 20.2% and 26.6% of that of β-zeolite. In other words, the pore space of β-zeolite has a much higher utilization efficiency due to its geometric characteristics. This implies that the geometric shape is also very important because it can significantly affect the utilization of limited pore space. In one word, the shape- and size-matching effect between the β-zeolite and Na2WO4 cluster plays an important role in this impregnation–calcination process, which ensures a seamless embedding and lock-up mechanism to maintain the extremely high uniform distribution of Na2WO4 cluster.

2.3. Catalytic Performance

The catalytic performances of the materials fabricated in this work were evaluated in the MCTV reaction under atmospheric pressure in a temperature-controlled continuous-flow fixed-bed reactor. A gas mixture of CH3Clinlet, O2, and N2 with a molar ratio of 1:2:57 was fed into the reactor, and the products were analyzed online. The catalyst material, reaction temperature, and the corresponding CH3Cl conversion rate, C2H3Cl selectivity, and C2H3Cl yield were recorded. The impact of the reaction temperature on catalytic performances was evaluated and is summarized in Table 1. A lower reaction temperature leads to an insufficient CH3Cl conversion rate. Although a higher temperature can further increase the CH3Cl conversion rate, the best C2H3Cl selectivity and highest C2H3Cl yield were achieved at 700 °C (Table 1). The silica substrate fabricated from β-zeolite without any Na2WO4 (0W/β-C) exhibited a CH3Cl conversion of 66.1% with a C2H3Cl selectivity of 2.6% at 700 °C, which led to a C2H3Cl yield of only 1.7% (Table 1). The major product is COX with a selectivity of 93.3%, indicating that the catalyst did not exhibit significant catalytic activity in the oxidative coupling reaction when Na2WO4 was not loaded. Since the MCTV reaction is a complex non-elementary reaction (Figure S6), the difference in the reaction orders cannot be directly associated with the change in the reaction pathway. Pure Na2WO4 exhibited a CH3Cl conversion rate of only about 10% and a C2H3Cl selectivity of 24.3% under the same reaction conditions, confirming that Na2WO4 species, without dispersion, also exhibited detectable but weak catalytic activity. On the other hand, the 10%W/β-C composite catalyst exhibited significantly improved MCTV catalytic activity, with a CH3Cl conversion rate of 75.5%, a C2H3Cl selectivity of 47.2%, and a C2H3Cl yield of 35.6%, which is approximately 14–21 times higher compared to pure silica support or Na2WO4 without support.
A series of MCTV catalytic tests was performed on the five catalysts fabricated from different silica support precursors with the same 10 wt% Na2WO4 loading at temperatures ranging from 650 °C to 725 °C. These five catalysts give a similar conversion rate of approximately 80% at 700 °C (Figure 5a and Figure S7a). The catalyst fabricated from β-zeolite exhibited the best C2H3Cl selectivity of 43%. This is significantly higher than the other four catalysts, which are only in the range of 18–23% (Figure 5a and Figure S7b). Consequently, the C2H3Cl yield of 10W/β-C was much higher, reaching 34.6% at 700 °C, while the yields of the other four catalysts did not exceed 17%. Actually, in the entire temperature range from 650 °C to 725 °C, 10W/β-C maintained a noticeably higher C2H3Cl selectivity than all the other four catalysts (Figure S7b), which should be attributed to the clearly better dispersion of the Na2WO4 nanocluster in this catalyst induced by the accurate shape- and size-matching effect between the pore channel of β-zeolite and Na2WO4. The plot of the C2H3Cl yield against relative peak intensity I27.8°/I22.2° reveals an increasing trend in C2H3Cl yield with a decline in the Na2WO4 intensity ratios to cristobalite (Figure 5b). This trend suggests that the MCTV catalytic performance enhances as the dispersion of Na2WO4 increases under the same loading.
For catalysts with different Na2WO4 loading amounts from 5 wt% to 30 wt% (Figure S8), the CH3Cl conversion rates all increased with the temperature increase, and the differences in their conversion rates at the same temperatures were not significant, except for the catalyst with 30 wt% Na2WO4, which gives a lower conversion rate. The best C2H3Cl selectivity for each catalyst was obtained at 675–700 °C, and they were all higher than 30%. Accordingly, the highest yield was mainly achieved at 700 °C for each catalyst. Notably, 10W/β-C exhibited the best C2H3Cl selectivity of 42.4% and the highest yield of 34.6%. Based on the above catalyst material characterization results, we infer that within a certain loading range, below 10 wt% in this case, a higher Na2WO4 loading indeed leads to a higher conversion, a better selectivity, and a higher yield, as shown in Figure S5a,b, which can be attributed to the higher loading increasing the dispersion density of highly active Na2WO4 nanocluster species for the 10W/β-C catalyst compared to the 5W/β-C catalyst. However, when the loading exceeds this range, excessive Na2WO4 forms aggregates which actually decrease the amount of active nanoclusters [27]. Consequently, the catalyst’s C2H3Cl selectivity and yield were significantly inhibited, as shown in Figure S8a–c for 15W/β-C, 20W/β-C, and 30W/β-C catalysts. We propose that this work follows the homogeneous–heterogeneous reaction mechanism as was followed when the MCTV catalytic route was first proposed [22]: Firstly, CH3Clinlet undergoes self-thermal cracking to produce chloromethyl radicals in the gas phase driven by a high temperature (650–750 °C). Subsequently, ·CH2Cl is captured by highly dispersed Na2WO4 clusters on the surface of the catalyst, and controllable coupling occurs to generate C2H3Cl, followed by the removal of hydrogen chloride to produce chloroethylene. The degree of dispersion of Na2WO4 has a direct impact on the performance of the MCTV reaction: only dispersed Na2WO4 active sites can exhibit the ability to couple chloromethyl radicals; a high concentration of Na2WO4 nanocages is the key to achieving the controllable generation of chloroethylene from chloromethane.
The catalyst mass effect on MCTV catalytic activity was also optimized for 10W/β-C under the same other reaction conditions. The CH3Cl conversion rate increased with the increase in catalyst mass at 700 °C, from 39.1% at 50 mg to 96.2% at 250 mg (Figure 5c). However, the C2H3Cl selectivity gradually decreased but still remained above 37% for catalyst amounts below 200 mg. When the catalyst amount reached 250 mg, the selectivity further decreased to around 30% (Figure S9). Consequently, the C2H3Cl yield showed a trend of first increasing and then decreasing with catalyst mass, reaching the maximum value of 34.6% at 150 mg, which is considered the optimal amount for all other experiments reported in this work. To assess the impact of oxygen content, we performed catalytic tests using 150 mg of the 10W/β-C catalyst under varying molar ratios of CH3Clinlet/O2 (1:1, 1:2, 1:3, and 1:6). The key findings are as follows (Figure S10). CH3Cl conversion increases with the increase in the oxygen ratio. At 700 °C, the conversion rises from 56.0% at a 1:1 ratio to 88.3% at a 1:6 ratio. C2H3Cl selectivity initially increases with the increase in the oxygen ratio, peaking at 42.4% under a 1:2 ratio at 700 °C, then declines with further increases in oxygen content. The optimal alkoxy/oxygen ratio for this catalyst is 1:2, yielding a maximum C2H3Cl yield of 34.6% at 700 °C. Although a 1:3 ratio yields a similar performance (33.9%), the selectivity is lower. Thus, a molar ratio of 1:2 is the optimal condition for this catalyst.
The stability of the catalyst is a crucial indicator of catalytic performance. Figure 5d shows the 24 h stability test data for 10W/β-C at 700 °C. It demonstrates that the 10W/β-C catalyst remained relatively stable over 24 h, with only a slight decrease in C2H3Cl yield. The spent catalyst was characterized by XRD and HR-TEM. As shown in Figure S4d, the XRD patterns of the catalyst after the stability test closely resemble those before the reaction. Notably, no significant changes were observed, and the characteristic peaks of Na2WO4 remain absent both pre- and post-reaction. This indicates that the highly dispersed Na2WO4 nanoclusters retain their structural integrity during the reaction process. The HR-TEM images shown in Figure S4c reveal that the Na2WO4 nanoclusters remain highly dispersed on the support even after the long-term stability test. No evidence of aggregation or coarsening was observed, confirming the exceptional stability of the active sites. Combining the previous structural characterization and theoretical calculation results, we infer that on one hand, the unique microporous structure of β-zeolite restricts the free movement of Na2WO4 molecules, forcing them to align in specific orientations. This confinement effect allows the active centers (W=O species) to disperse more easily and participate in reactions, thereby increasing the utilization of active sites. On the other hand, the interaction between the zeolite’s pore structure and surface hydroxyl groups (Si-OH) forms strong interactions with Na2WO4, inhibiting the migration or aggregation of tungsten–oxygen species at high temperatures, effectively controlling the reaction path and preferentially generating the target product, C2H3Cl, while suppressing side reactions.

3. Materials and Methods

3.1. Precursor Material Synthesis

β-zeolite [32]: 9.1 g of tetraethyl orthosilicate (TEOS, 99 wt%; Sinopharm Chemical Reagent Co., Ltd.; Shanghai, China) was added into 6.8 g of tetraethylammonium hydroxide aqueous solution (TEAOH, 35 wt%; Shanghai Macklin Biochemical Co., Ltd.; Shanghai, China). After approximately 4 h of TEOS hydrolysis under stirring, 0.8 g of hydrofluoric acid (HF, 40 wt%; Sinopharm Chemical Reagent Co., Ltd.; Shanghai, China) was slowly added dropwise while maintaining continuous stirring for an additional 4 h. The resulting mixture was then transferred to a 100 mL Teflon-lined stainless-steel autoclave and heated at 140 °C for 7 days.
S-1 zeolite [33]: 8.8 g of TEOS was mixed with 20 g of deionized water and 5.5 g of tetrapropylammonium hydroxide aqueous solution (TPAOH, 40 wt%; Shanghai Macklin Biochemical Co., Ltd.; Shanghai, China) under stirring for 6 h. The mixture was subsequently transferred to a 100 mL Teflon-lined stainless-steel autoclave and heated at 170 °C for 2 days.
ZSM-22 zeolite [34]: an organic template solution was prepared by dissolving 4.2 g of 1,6-diaminohexane (DAH, 99.5 wt%; Shanghai Macklin Biochemical Co., Ltd.; Shanghai, China) and 1.9 g of potassium hydroxide (KOH, 99%; Sinopharm Chemical Reagent Co., Ltd.; Shanghai, China) in 44.2 g of deionized water. A silicate solution was prepared separately by mixing 18 g of colloidal silica (40 wt%) with 31 g of deionized water. The silicate solution was then added to the organic template solution and stirred for 2 h to form a gel. The gel was transferred to a 100 mL Teflon-lined stainless-steel autoclave and heated at 170 °C for 2 days.
FDU-12 mesoporous silica [35]: 2.0 g of Pluronic F127 (99.5 wt%; Shanghai Aladdin Biochemical Technology Co., Ltd.; Shanghai, China) was dissolved in a mixture containing 2.0 g of tetramethylbenzidine (TMB, 98%; Shanghai Macklin Biochemical Co., Ltd.; Shanghai, China), 5.0 g of KCl, and 120 mL of 2 M HCl, followed by stirring at 40 °C for 24 h. Subsequently, 8.3 g of TEOS was added to the reaction mixture, which was stirred at room temperature for another 24 h. The mixture was then transferred to a 100 mL Teflon-lined stainless-steel autoclave and heated at 100 °C for 1 day.
After the hydrothermal treatment, the four solid products were separately collected by centrifugation, thoroughly washed with deionized water and ethanol three times, and dried at 80 °C for 12 h. The organic template was then removed by calcination in air at 550 °C for 6 h to obtain the final products.

3.2. Synthesis of Catalysts

The n%W/z-C catalyst was prepared by an incipient wetness impregnation method: 0.75 g of the above silica support precursor material was mixed with the calculated amount of Na2WO4 dihydrate (Na2WO4·2H2O) and 20 g of deionized water. The mixture was stirred at 65 °C until all water was completely evaporated. The resulting composite product was denoted as n% W/zeolite (n = 5, 10, 15, 20, 30; W = Na2WO4; z = zeolite). The n% W/zeolite material was then calcined in air at 750 °C for 5 h. The final calcined product was designated as n% W/z-C (z = zeolite; C = cristobalite). For more concise and intuitive names, the names of the corresponding impregnated samples, FDU-12, ZSM-22, and S-1, were named FDU, Z22, and S1, respectively. The non-porous silica-based product was prepared using the same method described above, by impregnating a certain amount of Na2WO4·2H2O onto commercial cristobalite, which was calcined in air at 1350 °C for 2 h. The resulting product was denoted as 10W/C.

3.3. Material Characterization Methods

X-ray diffraction (XRD) was tested on a Rigaku Ultima IV diffractometer (Rigaku Corporation; Tokyo, Japan) with 30 mA, 40 kV, Cu Ka radiation with a scanning range of 5–60° and a scanning rate of 10°/min. Scanning electron microscopy (SEM) and energy-dispersive X-ray spectroscopy (EDS) were performed on a Hitachi S-4800 microscope (Hitachi Limited; Tokyo, Japan) with a field emission electron gun operating at 25 kV. Transmission electron microscopy (TEM) analysis was conducted using a Hitachi HT-7700 microscope (Hitachi Limited; Tokyo, Japan), with the samples prepared on copper grids with a diameter of 3 mm. High-resolution transmission electron microscopy (HR-TEM) was performed on the JEM2100F model (JEOL Japan Electronics Co., Ltd.; Tokyo, Japan). Inductively coupled plasma emission spectrometry (ICP-MS) data were acquired on the PerkinElmer nexion 300x ICP-MS (PerkinElmer; Waltham, MA, USA). The sample was generally dissolved with aqua regia or hydrofluoric acid, and an appropriate amount of deionized water was added to bring the solution to be measured to reach the test concentration range. X-ray photoelectron spectroscopy (XPS) data were collected in PHI1600 (Ulvac Japan Ltd.; Chigasaki, Japan) with Mg Kα rays as the light source, and C1s (284.5 eV) was used as the internal standard to correct the charge of the electron binding energy of the sample. The XAFS spectrum was collected on a laboratory device (easyXAFS300+; easyXAFS LLC; Washington, DC, USA), which is based on Rowland circle geometries with spherically bent crystal analyzers and operated by a Mo X-ray tube source and a silicon drift detector.

3.4. Catalytic Performance Evaluation

The catalytic tests for methyl chloride oxidative coupling to vinyl chloride were conducted under atmospheric pressure in a temperature-controlled continuous-flow fixed-bed reactor. The exhaust gas was directly analyzed using a gas chromatograph equipped with dual detectors: a thermal conductivity detector (TCD) and a flame ionization detector (FID). The reaction tube was 300 mm in length and 9 mm in inner diameter, and the reaction was carried out at atmospheric pressure. A small piece of cristobalite wool was placed in the middle of the reaction tube to support the catalyst powder. The reaction tube was positioned vertically inside a heating furnace, with a thermocouple installed inside to monitor the bed temperature.
For each test, the reactor was loaded with 150 mg of catalyst. A gas mixture of CH3Clinlet, O2, and N2 with a molar ratio of 1:2:57 was fed into the reactor at a total flow rate of 60 mL/min. After stabilizing the reaction temperature for 30 min, samples were injected, and the products were analyzed online. The product analysis was performed using a gas chromatograph equipped with an FID and a TCD. The FID was used to quantify CH3Cl outlet, CH4, C2H4, C2H2, and C2H3Cl, while the TCD was used to measure CO and CO2.
Product detection and analysis method:
All carbon-containing products from the experiment were quantified using the standard curve method. The CH3Cl conversion rate, C2H3Cl selectivity, and yield were calculated using the following equations.
CH 3 Cl   Conv . = | CH 3 Cl inlet | | CH 3 Cl outlet | | CH 3 Cl inlet | × 100 %
C 2 H 3 Cl   Sel .   = 2 × | C 2 H 3 Cl | | CH 3 Cl inlet | | CH 3 Cl outlet | × 100 %
C 2 H 3 Cl   Yield . = C H 3 Cl   Conv .   × C 2 H 3 Cl   Sel . × 100 %

4. Conclusions

The selection of the support material is of significant importance for achieving high concentrations of MCTV reactive sites—sodium tungstate clusters. In this study, we compared several zeolite materials with different structures and found that the pore size and structure of the zeolites have a notable impact on the high dispersion of sodium tungstate. Experimental data indicate that using β-zeolite-supported Na2WO4 catalysts results in C2H3Cl yields of over 34%, far exceeding other support materials such as cristobalite, FDU-12, S-1, and ZSM-22. The exceptional performance of pure silica beta zeolite in dispersing high concentrations of Na2WO4 can be primarily attributed to its optimal pore structure—characterized by suitable pore sizes, high specific surface area, and substantial cavity volume—as well as its effective regulation of reaction pathways. These features enable Na2WO4 molecules to enter and remain stably confined within the internal channels of the zeolite. These properties collectively ensure that Na2WO4 maintains good dispersion under high-temperature conditions, preventing aggregation and making β-zeolite an ideal catalyst support for the oxidative coupling of methyl chloride to vinyl chloride. This suggests that optimizing the zeolite’s size, surface area, cavity volume, and other structural features is crucial to achieving the best balance between the confinement of active species and catalytic performance. This study provides valuable insights for the design of highly active catalytic materials and the understanding of structure–activity relationships.

Supplementary Materials

The following supporting information can be downloaded at: https://www.mdpi.com/article/10.3390/catal15040382/s1, Figure S1: XRD patterns of SiO2 supports before impregnation in comparison with reference bands of Na2WO4; Figure S2: TEM image of 10W/β-C catalyst; Figure S3: SEM images of various silica supports; Figure S4: Structural characterization of 10W/β-C. The high-resolution transmission electron microscopy images of 10W/β-C: (a) fresh; (c) spent. (b) Size distribution of Na2WO4 nanoclusters in fresh 10W/β-C. (d) XRD patterns of 10W/β-C in comparison with reference bands of Na2WO4. Figure S5: XRD patterns of n%W/β catalysts before (a) and after (b) calcination; Table S1: Pore structure parameters of β, S-1, and ZSM-22 zeolites and 10W/β-C; Figure S6: The dependence of the rate of CH3C1 conversion over various catalysts at different PCH3Cl/Ptotal ratios. Reaction conditions: 150 mg of catalyst, P = 1.01 bar, T10W/β-C = 625 °C, Tβ = 615 °C, TBlank = 840 °C, O2 flow rate = 2 mL min−1, and total gas flow rate = 60 mL min−1. Figure S7: Catalytic performance of 10W/z-C catalysts for the oxidative coupling of chloromethane: (a) CH3Cl conversion rate; (b) C2H3Cl selectivity; (c) C2H3Cl yield (reaction conditions: 150 mg of catalyst, CH3Cl/O2/N2 = 1:2:57, total gas flow rate of 60 mL min−1); Figure S8: The catalytic performances of n %W/β-C for the oxidative coupling of chloromethane. (a) CH3Cl conversion; (b) C2H3Cl selectivity; (c) C2H3Cl yield (reaction conditions: 150 mg of catalyst, CH3Cl/O2/N2 = 1:2:57, total gas flow rate = 60 mL min−1); Figure S9: Catalytic performance of 10W/β-C catalysts with varying masses under chloromethane oxidative coupling reaction conditions: (a) CH3Cl conversion rate; (b) C2H3Cl selectivity; (c) C2H3Cl yield (reaction conditions: CH3Cl/O2/N2 = 1:2:57; total gas flow rate of 60 mL min−1) Figure S10: Catalytic performance of 10W/β-C catalysts with varying molar ratios of CH3Cl/O2 under chloromethane oxidative coupling reaction conditions: (a) CH3Cl conversion rate; (b) C2H3Cl selectivity; (c) C2H3Cl yield; (d) catalytic performance at 700 °C. (Reaction conditions: CH3Cl/O2/N2 = 1:x:57, and total gas flow rate of 60 mL min−1).

Author Contributions

Conceptualization, N.L. and J.F.; methodology, N.L. and X.C.; formal analysis, Y.R. and Y.S.; investigation, N.L., Y.W. and Z.W.; resources, N.L., X.S. and Y.W.; data curation, N.L.; writing—original draft preparation, N.L. and Y.S.; writing—review and editing, J.F., X.C. and Y.S.; visualization, N.L.; supervision, J.F.; project administration, J.F.; funding acquisition, J.F. All authors have read and agreed to the published version of the manuscript.

Funding

This work was funded by the National Natural Science Foundation of China grant (92045301, 91845203, and 22372051).

Data Availability Statement

Data are contained within the article and Supplementary Materials.

Conflicts of Interest

The authors declare no conflicts of interest.

References

  1. Lin, R.; Amrute, A.P.; Pérez-Ramírez, J. Halogen-mediated conversion of hydrocarbons to commodities. Chem. Rev. 2017, 117, 4182–4247. [Google Scholar] [CrossRef]
  2. Zhang, J.; Liu, N.; Li, W.; Dai, B. Progress on cleaner production of vinyl chloride monomers over non-mercury catalysts. Front. Chem. Sci. Eng. 2011, 5, 514–520. [Google Scholar] [CrossRef]
  3. Malta, G.; Kondrat, S.A.; Freakley, S.J.; Davies, C.J.; Lu, L.; Dawson, S.; Thetford, A.; Gibson, E.K.; Morgan, D.J.; Jones, W.; et al. Identification of single-site gold catalysis in acetylene hydrochlorination. Science 2017, 355, 1399–1403. [Google Scholar] [CrossRef] [PubMed]
  4. Zhao, J.; Xu, J.; Xu, J.; Ni, J.; Zhang, T.; Xu, X.; Li, X. Activated-carbon-supported gold-cesium(I) as highly effective catalysts for hydrochlorination of acetylene to vinyl chloride. ChemPlusChem 2015, 80, 196–201. [Google Scholar] [CrossRef]
  5. Medrano-García, J.D.; Giulimondi, V.; Ceruti, A.; Zichittella, G.; Pérez-Ramírez, J.; Guillén-Gosálbez, G. Economic and environmental competitiveness of ethane-based technologies for vinyl chloride synthesis. ACS Sustain. Chem. Eng. 2023, 11, 13062–13069. [Google Scholar] [CrossRef] [PubMed]
  6. Leofanti, G.; Marsella, A.; Cremaschi, B.; Garilli, M.; Zecchina, A.; Spoto, G.; Bordiga, S.; Fisicaro, P.; Prestipino, C.; Villain, F.; et al. Alumina-supported copper chloride: 4. Effect of Exposure to O2 and HCl. J. Catal. 2002, 205, 375–381. [Google Scholar] [CrossRef]
  7. Schobert, H. Production of acetylene and acetylene-based chemicals from coal. Chem. Rev. 2014, 114, 1743–1760. [Google Scholar] [CrossRef]
  8. Hutchings, G.; Grady, D. Hydrochlorination of acetylene: The effect of mercuric chloride concentration on catalyst life. Appl. Catal. 1985, 17, 155–160. [Google Scholar] [CrossRef]
  9. Kaiser, S.K.; Fako, E.; Manzocchi, G.; Krumeich, F.; Hauert, R.; Clark, A.H.; Safonova, O.V.; López, N.; Pérez-Ramírez, J. Nanostructuring unlocks high performance of platinum single-atom catalysts for stable vinyl chloride production. Nat. Catal. 2020, 3, 376–385. [Google Scholar] [CrossRef]
  10. Johnston, P.; Carthey, N.; Hutchings, G.J. Discovery, development, and commercialization of gold catalysts for acetylene hydrochlorination. J. Am. Chem. Soc. 2015, 137, 1454–14557. [Google Scholar] [CrossRef]
  11. Zhou, K.; Wang, W.; Zhao, Z.; Luo, G.; Miller, J.T.; Wong, M.S.; Wei, F. Synergistic gold bismuth catalysis for non-mercury hydrochlorination of acetylene to vinyl chloride monomer. ACS Catal. 2014, 4, 3112–3116. [Google Scholar] [CrossRef]
  12. Zichittella, G.; Pérez-Ramírez, J. Ethane-based catalytic process for vinyl chloride manufacture. Angew. Chem. Int. Ed. 2021, 60, 24089–24095. [Google Scholar] [CrossRef] [PubMed]
  13. Liu, Y.; Deng, D.; Bao, X. Catalysis for selected C1 chemistry. Chem 2020, 6, 2497–2514. [Google Scholar] [CrossRef]
  14. Singla, M.; Rasmussen, M.L.; Hashemi, H.; Wu, H.; Glarborg, P.; Pelucchi, M.; Faravelli, T.; Marshall, P. Ab initio calculations and kinetic modeling of thermal conversion of methyl chloride: Implications for gasification of biomass. Phys. Chem. Chem. Phys. 2018, 20, 10741–10752. [Google Scholar] [CrossRef] [PubMed]
  15. Terlingen, B.; Oord, R.; Ahr, M.; Hutter, E.; van Lare, C.; Weckhuysen, B.M. Mechanistic insights into the lanthanide-catalyzed oxychlorination of methane as revealed by operando spectroscopy. ACS Catal. 2021, 11, 10574–10588. [Google Scholar] [CrossRef]
  16. Pelucchi, M.; Cavallotti, C.; Frassoldati, A.; Ranzi, E.; Glarborg, P.; Faravelli, T. Theoretical and kinetic modeling study of chloromethane (CH3Cl) pyrolysis and oxidation. Int. J. Chem. Kinet. 2021, 53, 403–418. [Google Scholar] [CrossRef]
  17. Valecillos, J.; Manzano, H.; Aguayo, A.T.; Bilbao, J.; Castaño, P. Kinetic and deactivation differences among methanol, dimethyl ether and chloromethane as stock for hydrocarbons. ChemCatChem 2019, 11, 5444–5456. [Google Scholar] [CrossRef]
  18. Ibáñez, M.; Gamero, M.; Ruiz-Martínez, J.; Weckhuysen, B.M.; Aguayo, A.T.; Bilbao, J.; Castaño, P. Simultaneous coking and dealumination of zeolite H-ZSM-5 during the transformation of chloromethane into olefins. Catal. Sci. Technol. 2016, 6, 296–306. [Google Scholar] [CrossRef]
  19. Olsbye, U.; Saure, O.V.; Muddada, N.B.; Bordiga, S.; Lamberti, C.; Nilsen, M.H.; Lillerud, K.P.; Svelle, S. Methane conversion to light olefins-how does the methyl halide route differ from the methanol-to-olefins (MTO) route? Catal. Today 2011, 171, 211–220. [Google Scholar] [CrossRef]
  20. Wei, Y.; Zhang, D.; Liu, Z.; Su, B.-L. Highly efficient catalytic conversion of chloromethane to light olefins over HSAPO-34 as studied by catalytic testing and in situ FTIR. J. Catal. 2006, 238, 46–57. [Google Scholar] [CrossRef]
  21. Wei, Y.; Zhang, D.; Xu, L.; Liu, Z.; Su, B.-L. New route for light olefins production from chloromethane over HSAPO-34 molecular sieve. Catal. Today 2005, 106, 84–89. [Google Scholar] [CrossRef]
  22. Wang, Y.; Zou, S.; Nabera, A.; Chen, X.; Pan, Y.; Wei, K.; Bao, Y.; Hu, J.; Zhao, Y.; Liu, C.; et al. C1-based route for vinyl chloride synthesis with environmental and economic benefits. J. Am. Chem. Soc. 2025, 147, 7757–7764. [Google Scholar] [CrossRef] [PubMed]
  23. Ma, H.; Wang, Y.; Qi, Y.; Rout, K.R.; Chen, D. Critical review of catalysis for ethylene oxychlorination. ACS Catal. 2020, 10, 9299–9319. [Google Scholar] [CrossRef]
  24. Ma, H.; Ma, G.; Qi, Y.; Wang, Y.; Chen, Q.; Rout, K.R.; Fuglerud, T.; Chen, D. Nitrogen-doped carbon-assisted one-pot tandem reaction for vinyl chloride production via ethylene oxychlorination. Angew. Chem. Int. Ed. 2020, 59, 22080–22085. [Google Scholar] [CrossRef]
  25. Hassan, H.M.; Alruwaili, H.A.; Alhumaimess, M.S.; Alanazi, A.H.; El-Aassar, M.; Alshammari, M.S.; Hussein, M.F.; Alsohaimi, I.H. Sustainable nitrophenol reduction using ce-mof-808-supported bimetallic nanoparticles optimized by response surface methodology. Environ. Res. 2025, 264 Pt 1, 120340. [Google Scholar] [CrossRef]
  26. Hassan, H.M.; Alruwaili, M.S.; Alsohaimi, I.H.; El-Hashemy, M.A.; Alqadami, A.A.; Alshammari, K.; Alali, I.K.; Alanazi, S.J.; El-Aassar, M.R. Electrospun polyacrylonitrile nanofiber composites integrated with Al-MOF/mesoporous carbon for superior CO2 capture and VOC removal. Diam. Relat. Mater. 2024, 149, 111649. [Google Scholar] [CrossRef]
  27. Zou, S.; Li, Z.; Zhou, Q.; Pan, Y.; Yuan, W.; He, L.; Wang, S.; Wen, W.; Liu, J.; Wang, Y.; et al. Surface coupling of methyl radicals for efficient low-temperature oxidative coupling of methane. Chin. J. Catal. 2021, 42, 1117–1125. [Google Scholar] [CrossRef]
  28. Qajar, A.; Peer, M.; Rajagopalan, R.; Foley, H.C. Characterization of micro- and mesoporous materials using accelerated dynamics adsorption. Langmuir 2013, 29, 12400–12409. [Google Scholar] [CrossRef]
  29. Santiso, E.E.; George, A.M.; Turner, C.H.; Kostov, M.K.; Gubbins, K.E.; Buongiorno-Nardelli, M.; Sliwinska-Bartkowiak, M. Adsorption and catalysis: The effect of confinement on chemical reactions. Appl. Surf. Sci. 2005, 252, 766–777. [Google Scholar] [CrossRef]
  30. Holbrook, B.P.M.; Rajagopalan, R.; Dronvajjala, K.; Choudhary, Y.K.; Foley, H.C. Molecular sieving carbon catalysts for liquid phase reactions: Study of alkene hydrogenation using platinum embedded nanoporous carbon. J. Mol. Catal. A-Chem. 2013, 367, 61. [Google Scholar] [CrossRef]
  31. Zhu, S.; Zhang, D.; Zhang, X.; Zhang, L.; Ma, X.; Zhang, Y.; Cai, M. Sonochemical incorporation of nanosized TiO2 inside mesoporous silica with high photocatalytic performance. Micropor. Mesopor. Mat. 2009, 126, 20–25. [Google Scholar] [CrossRef]
  32. Tong, M.; Zhang, D.; Fan, W.; Xu, J.; Zhu, L.; Guo, W.; Yan, W.; Yu, J.; Qiu, S.; Wang, J.; et al. Synthesis of chiral polymorph A-enriched zeolite Beta with an extremely concentrated fluoride route. Sci. Rep. 2015, 5, 11521. [Google Scholar] [CrossRef] [PubMed]
  33. He, J.; Zhang, J.; Chen, J.; Zhang, J.; Wang, G.; Shi, Z.; Yang, F.; Zhao, J.; Zhuo, R.; Wang, R. Re-dispersion of active Zn species on modified S-1 zeolite as an efficient catalyst for direct dehydrogenation of propane. Micropor. Mesopor. Mat. 2022, 348, 112402. [Google Scholar] [CrossRef]
  34. Jamil, A.K.; Muraza, O. Facile control of nanosized ZSM-22 crystals using dynamic crystallization technique. Micropor. Mesopor. Mat. 2016, 227, 16–22. [Google Scholar] [CrossRef]
  35. Fan, J.; Yu, C.; Gao, F.; Lei, J.; Tian, B.; Wang, L.; Luo, Q.; Tu, B.; Zhou, W.; Zhao, D. Cubic mesoporous silica with large controllable entrance sizes and advanced adsorption properties. Angew. Chem. Int. Ed. 2003, 115, 3146–3150. [Google Scholar] [CrossRef] [PubMed]
  36. Yuan, P.; Lei, X.-Q.; Sun, H.-M.; Zhang, H.-W.; Cui, C.-S.; Yue, Y.-Y.; Liu, H.-Y.; Bao, X.-J.; Wang, T.-H. Effects of pore size, mesostructure and aluminum modification on FDU-12 supported NiMo catalysts for hydrodesulfurization. Petrol. Sci. 2020, 17, 15. [Google Scholar] [CrossRef]
  37. Wang, B.; Yang, Q. Optimization of roasting parameters for recovery of vanadium and tungsten from spent SCR catalyst with composite roasting. Processes 2021, 9, 1923. [Google Scholar] [CrossRef]
  38. Kovacheva, P.; Predoeva, A.; Arishtirova, K.; Vassilev, S. Oxidative methylation of toluene with methane using X zeolite catalyst modified with alkali earth oxides. Appl. Catal. A Gen. 2002, 223, 121–128. [Google Scholar] [CrossRef]
  39. Hajjar, R.; Millot, Y.; Man, P.P.; Che, M.; Dzwigaj, S. Two Kinds of framework Al sites studied in BEA zeolite by X-ray diffraction, fourier transform infrared spectroscopy, NMR techniques, and V Probe. J. Phys. Chem. C 2008, 112, 20167–20175. [Google Scholar] [CrossRef]
  40. Yildiz, M.; Aksu, Y.; Simon, U.; Kailasam, K.; Goerke, O.; Rosowski, F.; Schomäcker, R.; Thomas, A.; Arndt, S. Enhanced catalytic performance of MnxOy-Na2WO4/SiO2 for the oxidative coupling of methane using an ordered mesoporous silica support. Chem. Commun. 2014, 50, 14440–14442. [Google Scholar] [CrossRef]
  41. Kiani, D.; Sourav, S.; Wachs, I.E.; Baltrusaitis, J. Synthesis and molecular structure of model silica-supported tungsten oxide catalysts for oxidative coupling of methane (OCM). Catal. Sci. Technol. 2020, 10, 3334–3345. [Google Scholar] [CrossRef]
  42. Connolly, M.L. Analytical molecular surface calculation. J. Appl. Crystallogr. 1983, 16, 548–558. [Google Scholar] [CrossRef]
  43. Connolly, M.L. Solvent-accessible surfaces of proteins and nucleic acids. Science 1983, 221, 709–713. [Google Scholar] [CrossRef]
  44. Yu, Y.; Zhang, K. Size-Sieving Separation of hard-sphere mixtures through cylindrical pores. Soft Matter. 2021, 17, 10025–10031. [Google Scholar] [CrossRef] [PubMed]
Figure 1. XRD patterns of the composite samples (a) before and (b) after calcination; (c) I27.8°/I22.2° ratios for Na2WO4 and α-cristobalite diffraction peaks; (d) Raman spectra of calcined catalysts.
Catalysts 15 00382 g001
Figure 2. SEM image of (a) 10W/β-C, (b) 10W/Z22-C, and (c) 10W/C, along with the corresponding elemental distribution maps for the selected regions. Artificially superimposed white circles highlight the selected areas for analysis.
Catalysts 15 00382 g002
Figure 3. (a) Surface and bulk W/Si ratios measured by XPS and ICP-MS; (b) W 4f XPS spectra of calcined catalysts; (c) W L1-edge XANES spectra for 10W/β-C compared to Na2WO4 and WO3 references. The arrows in the figure were added manually to more accurately indicate the positions of the molecular peaks.
Catalysts 15 00382 g003
Figure 4. Volumetric occupancy of WO42− in different zeolites. (a) β, (b) ZSM-22, and (c) ZSM-22 (Si and O atoms are represented by yellow and red spheres, respectively).
Catalysts 15 00382 g004
Figure 5. (a) Catalytic performance of 10W/z-C catalyst for the methyl chloride oxidative coupling reaction at 700 °C. (b) C2H3Cl yield at different I27.8°/I22.2° ratios of 10W/z-C. The pink shadow in the figure is artificially added to highlight the positive correlation trend, in order to facilitate the visualization of the trend. (c) Exploring the effect of the catalyst amount on the catalytic performances of 10W/β-C. (d) Catalytic stability test of 10W//β-C (Reaction conditions: 150 mg of catalyst, CH3Clinlet/O2/N2 = 1:2:57, total gas flow rate 60 mL min−1).
Catalysts 15 00382 g005
Table 1. Summary of catalytic performance for 10W/z-C catalysts.
CatalystT (°C)CH3Cl Conv. (%)Sel. (%)C2H3Cl Yield (%)
CH4C2H4C2H2C3H3ClC2COx
10W/β-C65027.55.93.12.935.141.116.89.6
67555.91.33.31.141.544.920.223.2
70075.51.23.52.947.253.621.435.6
72592.10.92.56.237.646.348.134.6
0W/β-C70066.11.30.50.62.63.793.31.7
Na2WO470010.20.71.90.224.326.440.22.5
10W/C70082.20.71.41.522.325.268.218.3
10W/FDU-C70079.81.11.72.322.326.360.813.8
10W/S1-C70077.50.81.61.321.023.969.816.3
10W/Z22-C70076.10.71.41.716.920.072.312.9
Disclaimer/Publisher’s Note: The statements, opinions and data contained in all publications are solely those of the individual author(s) and contributor(s) and not of MDPI and/or the editor(s). MDPI and/or the editor(s) disclaim responsibility for any injury to people or property resulting from any ideas, methods, instructions or products referred to in the content.

