Article

Advanced Ozone Oxidation Systems for Organic Pollutant Degradation: Performance Evaluation and Mechanism Insights

College of Ecology and the Environment, Nanjing Forestry University, Nanjing 210037, China
*
Author to whom correspondence should be addressed.
These authors contributed equally to this work.
Catalysts 2025, 15(11), 1057; https://doi.org/10.3390/catal15111057
Submission received: 30 September 2025 / Revised: 1 November 2025 / Accepted: 4 November 2025 / Published: 6 November 2025
(This article belongs to the Special Issue Cutting-Edge Catalytic Strategies for Organic Pollutant Mitigation)

Abstract

Textile dyeing wastewater, rich in recalcitrant organic compounds such as azo and anthraquinone dyes, poses significant environmental concerns. This study investigates the degradation of methyl orange (MO) using two ozone (O3) oxidation systems—O3/H2O2 and O3/K2S2O8—and analyzes the degradation products and toxicity via ESR characterization. The O3/K2S2O8 system shows a higher removal rate in the initial stage (<4 min) due to rapid ·SO4- radical generation. However, O3/H2O2 produces more ·OH radicals, leading to better overall degradation performance. The O3/K2S2O8 system is more effective for pollutants with electron-rich groups, such as Congo red and sulfamethoxazole, while O3/H2O2 performs better in natural lake water. Mechanistic studies reveal that ·O2- is the dominant oxidizing species in O3/H2O2, while ·SO4- and ·O2- dominate in O3/K2S2O8. The toxicity of degradation products is assessed, showing lower bioaccumulation and developmental toxicity in most intermediate products compared to MO. This research provides valuable insights into the use of combined ozonation-peroxidation coupling technology for effective wastewater treatment.
Keywords:
O3; H2O2; K2S2O8; organic

1. Introduction

With the rise in modern industry, the complexity of organic pollutants in wastewater has highlighted the limitations of single ozone (O3) oxidation [1,2,3]. O3 exhibits low removal rate for persistent organic compounds such as perfluorinated compounds (PFCs) and polycyclic aromatic hydrocarbons, and its high reaction selectivity is influenced by water quality parameters. Additionally, the limited yield of hydroxyl radicals (·OH) from O3 decomposition hinders complete mineralization of complex pollutants, and harmful byproducts such as hydroxylated and ring-opened Intermediates may form [4]. Consequently, the integration of O3 with other oxidants has led to advanced O3 oxidation technologies, which leverage multi-oxidant synergy for enhanced pollutant removal.
Ozonation technology is an advanced oxidation process leveraging the strong oxidizing properties of O3 [5]. Its core mechanism involves either direct oxidation by O3 molecules or indirect oxidation of pollutants via ·OH generated from O3 decomposition, effectively degrading recalcitrant organic compounds. This technology features rapid reaction rates, no secondary residues, and environmental friendliness, making it particularly suitable for complex pollutant systems challenging to treat with conventional biological methods [6]. Recent advances in catalytic O3 oxidation, process coupling, and reactor optimization have broadened the application scope of O3, with significant progress made in the combined use of O3 with other oxidants, particularly in O3/hydrogen peroxide (H2O2) and O3/persulfate systems for water treatment [7,8]. H2O2 effectively promotes O3 decomposition and catalyzes chain reactions to generate ·OH radicals while suppressing bromate formation. Additionally, potassium persulfate (K2S2O8), a type of persulfate, features a relatively low O-O bond energy (approximately 140 kJ/mol) that readily breaks under activation conditions to produce sulfate radicals (·SO4-). This free radical, characterized by a high oxidation potential (2.5–3.1 V) and extended half-life, efficiently attacks hydrophobic groups or aromatic rings of recalcitrant organic compounds, attracting significant research attention [9]. Wang et al. demonstrated that O3 can activate K2S2O8 via direct electron transfer to generate ·SO4- and ·OH, forming a synergistic double-radical oxidation system [10]. This approach enhances the removal rate of PFCs by 2–3 times across a pH range of 3–9, with the ·SO4- radical dominating the oxidation process under acidic conditions. These technologies overcome the limitations of standalone O3 oxidation through synergistic effects, enhancing pollutant removal rate while reducing byproduct formation [11]. Wang et al. combined O3 with TiO2 photocatalysis, utilizing ultraviolet light (UV) to excite TiO2 and generate electron-hole pairs. This synergized with O3 decomposition to produce ·OH and superoxide radicals (·O2-), increasing the removal rate of sulfonamide antibiotics by 35%. Additionally, Fu et al. employed O3 combined with electrochemical oxidation (O3/EO), generating active chlorine species in situ on electrode surfaces to efficiently degrade nitrogen-containing organic compounds [12]. Furthermore, the combined use of O3 with oxidants such as H2O2 and persulfates for pollutant degradation has garnered significant attention. Li et al. earlier elucidated the mechanism whereby H2O2 promotes O3 decomposition via chain reactions to generate ·OH radicals, significantly enhancing the removal rate of organic pollutants [13]. Regarding the synergistic O3/persulfate system, research has primarily focused on the mechanism of O3-activated persulfate generating ·SO4-. Sani et al. discovered that O3 activates peroxymonosulfate via electron transfer to produce ·SO4-, forming a dual oxidation pathway [14]. The degradation of methyl orange (MO) by ozone-based advanced oxidation systems has been widely investigated. In the O3/H2O2 system, H2O2 promotes ozone decomposition to generate ·OH radicals, significantly enhancing azo bond cleavage and mineralization rate [15,16,17,18]. Chen et al. demonstrated that MO decolorization strongly depends on pH and oxidant dosage, with near-neutral conditions favoring optimal rate [19]. Dong et al. further showed that improved gas–liquid transfer in microbubble reactors accelerates MO degradation kinetics [20]. In the O3/SO4- system, ozone activates persulfate to form ·SO4- and ·OH radicals, achieving rapid initial decolorization and higher selectivity toward electron-rich azo structures [21]. Mohd Razali et al. reported that O3/persulfate achieved efficient MO removal within minutes, though excessive persulfate reduced the rate due to radical self-quenching [22]. However, there remains a lack of thorough research on the effects and comparisons of the O3/H2O2 system and the O3/SO4- system in the presence of different oxidants. This paper conducts an in-depth study on the detailed process of organic matter degradation in O3/H2O2 and O3/K2S2O8 systems and investigates the influence of different factors on the degradation process, providing valuable references for other similar systems.
This paper investigates the following aspects of ozonation technology to elucidate its degradation efficacy and mechanisms. In O3/H2O2 and O3/K2S2O8 systems, the effects of initial H2O2 and K2S2O8 concentrations, initial pH, and reaction time on MO degradation were explored. Optimal reaction conditions were determined based on reaction rate constants. Identifying primary strong oxidizing species in O3/H2O2 and O3/K2S2O8 systems through radical scavenging and ESR experiments. Analyzing reaction intermediates via Liquid Chromatograph Mass Spectrometer (LC-MS) and assessing their toxicity using Toxicity Estimation Software Tool (T.E.S.T.) software (Version 5.1) [23]. By degrading different types of pollutants, the removal rate of the O3/H2O2 and O3/K2S2O8 systems was compared for various recalcitrant organic pollutants and natural lake water.

2. Results and Discussion

2.1. The Degradation Effectiveness of Pollutants in O3/H2O2 and O3/K2S2O8 Systems

2.1.1. The Initial Concentration of H2O2 and K2S2O8 Affects

The effect of O3 with different H2O2 and K2S2O8 dosages on MO simulated wastewater is shown in Figure 1. As the H2O2 dosage concentration increased, the removal rate of MO initially rose and then decreased (Figure 1a). When the H2O2 concentration reached 3.5 mmol/L, the removal degree reached 97.8 ± 2.4%. Subsequently, the removal rate gradually decreased with further increases in H2O2 concentration. This may be attributed to two factors: on one hand, excess H2O2 at very high concentrations reacts with ·OH radicals to form ·HO2 with weaker oxidizing capacity, reducing the concentration of effective free radicals. On the other hand, excess H2O2 may accelerate the decomposition of O3, causing it to react preferentially with H2O2 rather than directly oxidizing MO or generating ·OH. Subsequently, due to the rapid depletion of O3, the reaction system cannot maintain sufficient oxidizing capacity. Therefore, the optimal H2O2 concentration for MO removal is 3.5 mmol/L. Further analysis at 3.5 mmol/L H2O2 concentration shows that the removal rate rapidly reaches 94.2 ± 2.4% within 5 min. As time progresses, the removal rate gradually stabilizes, peaking at 97.8 ± 2.4% at 10 min. The removal rate decreases over time due to the consumption of the dye as well as decrease in concentration of reagents.
As shown in Figure 1b, the degradation process of MO under different H2O2 concentrations was further modeled using first-order kinetic curve fitting, with the reaction rate constant represented by the k value [24]. It can be observed that the reaction rate constant first increases and then decreases with increasing H2O2 concentration. Under the reaction conditions of O3 with 3.5 mmol/L H2O2, the reaction rate constant k for MO reaches a maximum of 0.398, which is 1.4 times that under pure O3 conditions. This trend aligns with the reaction time curves observed at different H2O2 concentrations, indicating that 3.5 mmol/L represents the optimal H2O2 addition concentration.
The effect of O3 and varying K2S2O8 dosages on MO simulated wastewater is shown in Figure 1c,d. As the K2S2O8 dosage concentration increases, the removal rate of MO gradually decreases. When the K2S2O8 concentration reaches 1.1 mmol/L, the removal rate peaks at 96.8 ± 2.4%. Subsequently, the removal rate decreased slightly with further increases in K2S2O8 concentration (Figure 1c). During the first 2 min, the removal rate of MO increased with rising K2S2O8 concentration. However, the maximum removal rate was achieved at a K2S2O8 concentration of 1.1 mmol/L. This may be attributed to the decomposition of excess K2S2O8, which generates a large amount of ·SO4- radicals. Excessively high ·SO4- radical concentrations reduced pollutant concentrations, leading to fewer effective collisions between radicals and pollutants. Additionally, radicals may undergo self-quenching reactions, diminishing the oxidative capacity of the reaction system. Therefore, the optimal K2S2O8 concentration for MO removal is 1.1 mmol/L. Further analysis at 1.1 mmol/L K2S2O8 shows that the removal rate rapidly reaches 95.0 ± 2.4% within 7 min. As time progresses, the removal rate gradually stabilizes, peaking at 96.8 ± 2.4% at 10 min. The reaction reaches equilibrium, and with prolonged duration, pollutant concentration decreases. Excess ·SO4- may be consumed through self-recombination reactions, reducing utilization rate and diminishing MO degradation effectiveness.
As shown in Figure 1d, fitting the degradation process of MO at different K2S2O8 concentrations using first-order kinetic curves reveals that the reaction rate constant gradually decreases with increasing K2S2O8 concentration. The reaction was treated as pseudo–first-order since the rate constants were determined from the initial reaction phase, where oxidant concentrations remained nearly constant. Under the reaction conditions of O3 with 1.1 mmol/L H2O2, the reaction rate constant k for MO reached a maximum of 0.35, which is 1.23 times that under pure O3 conditions. This trend is consistent with the reaction time curves for different K2S2O8 concentrations, indicating that the optimal K2S2O8 addition concentration is 1.1 mmol/L [25].

2.1.2. Effect of Initial pH on the O3/H2O2 and O3/K2S2O8 Systems

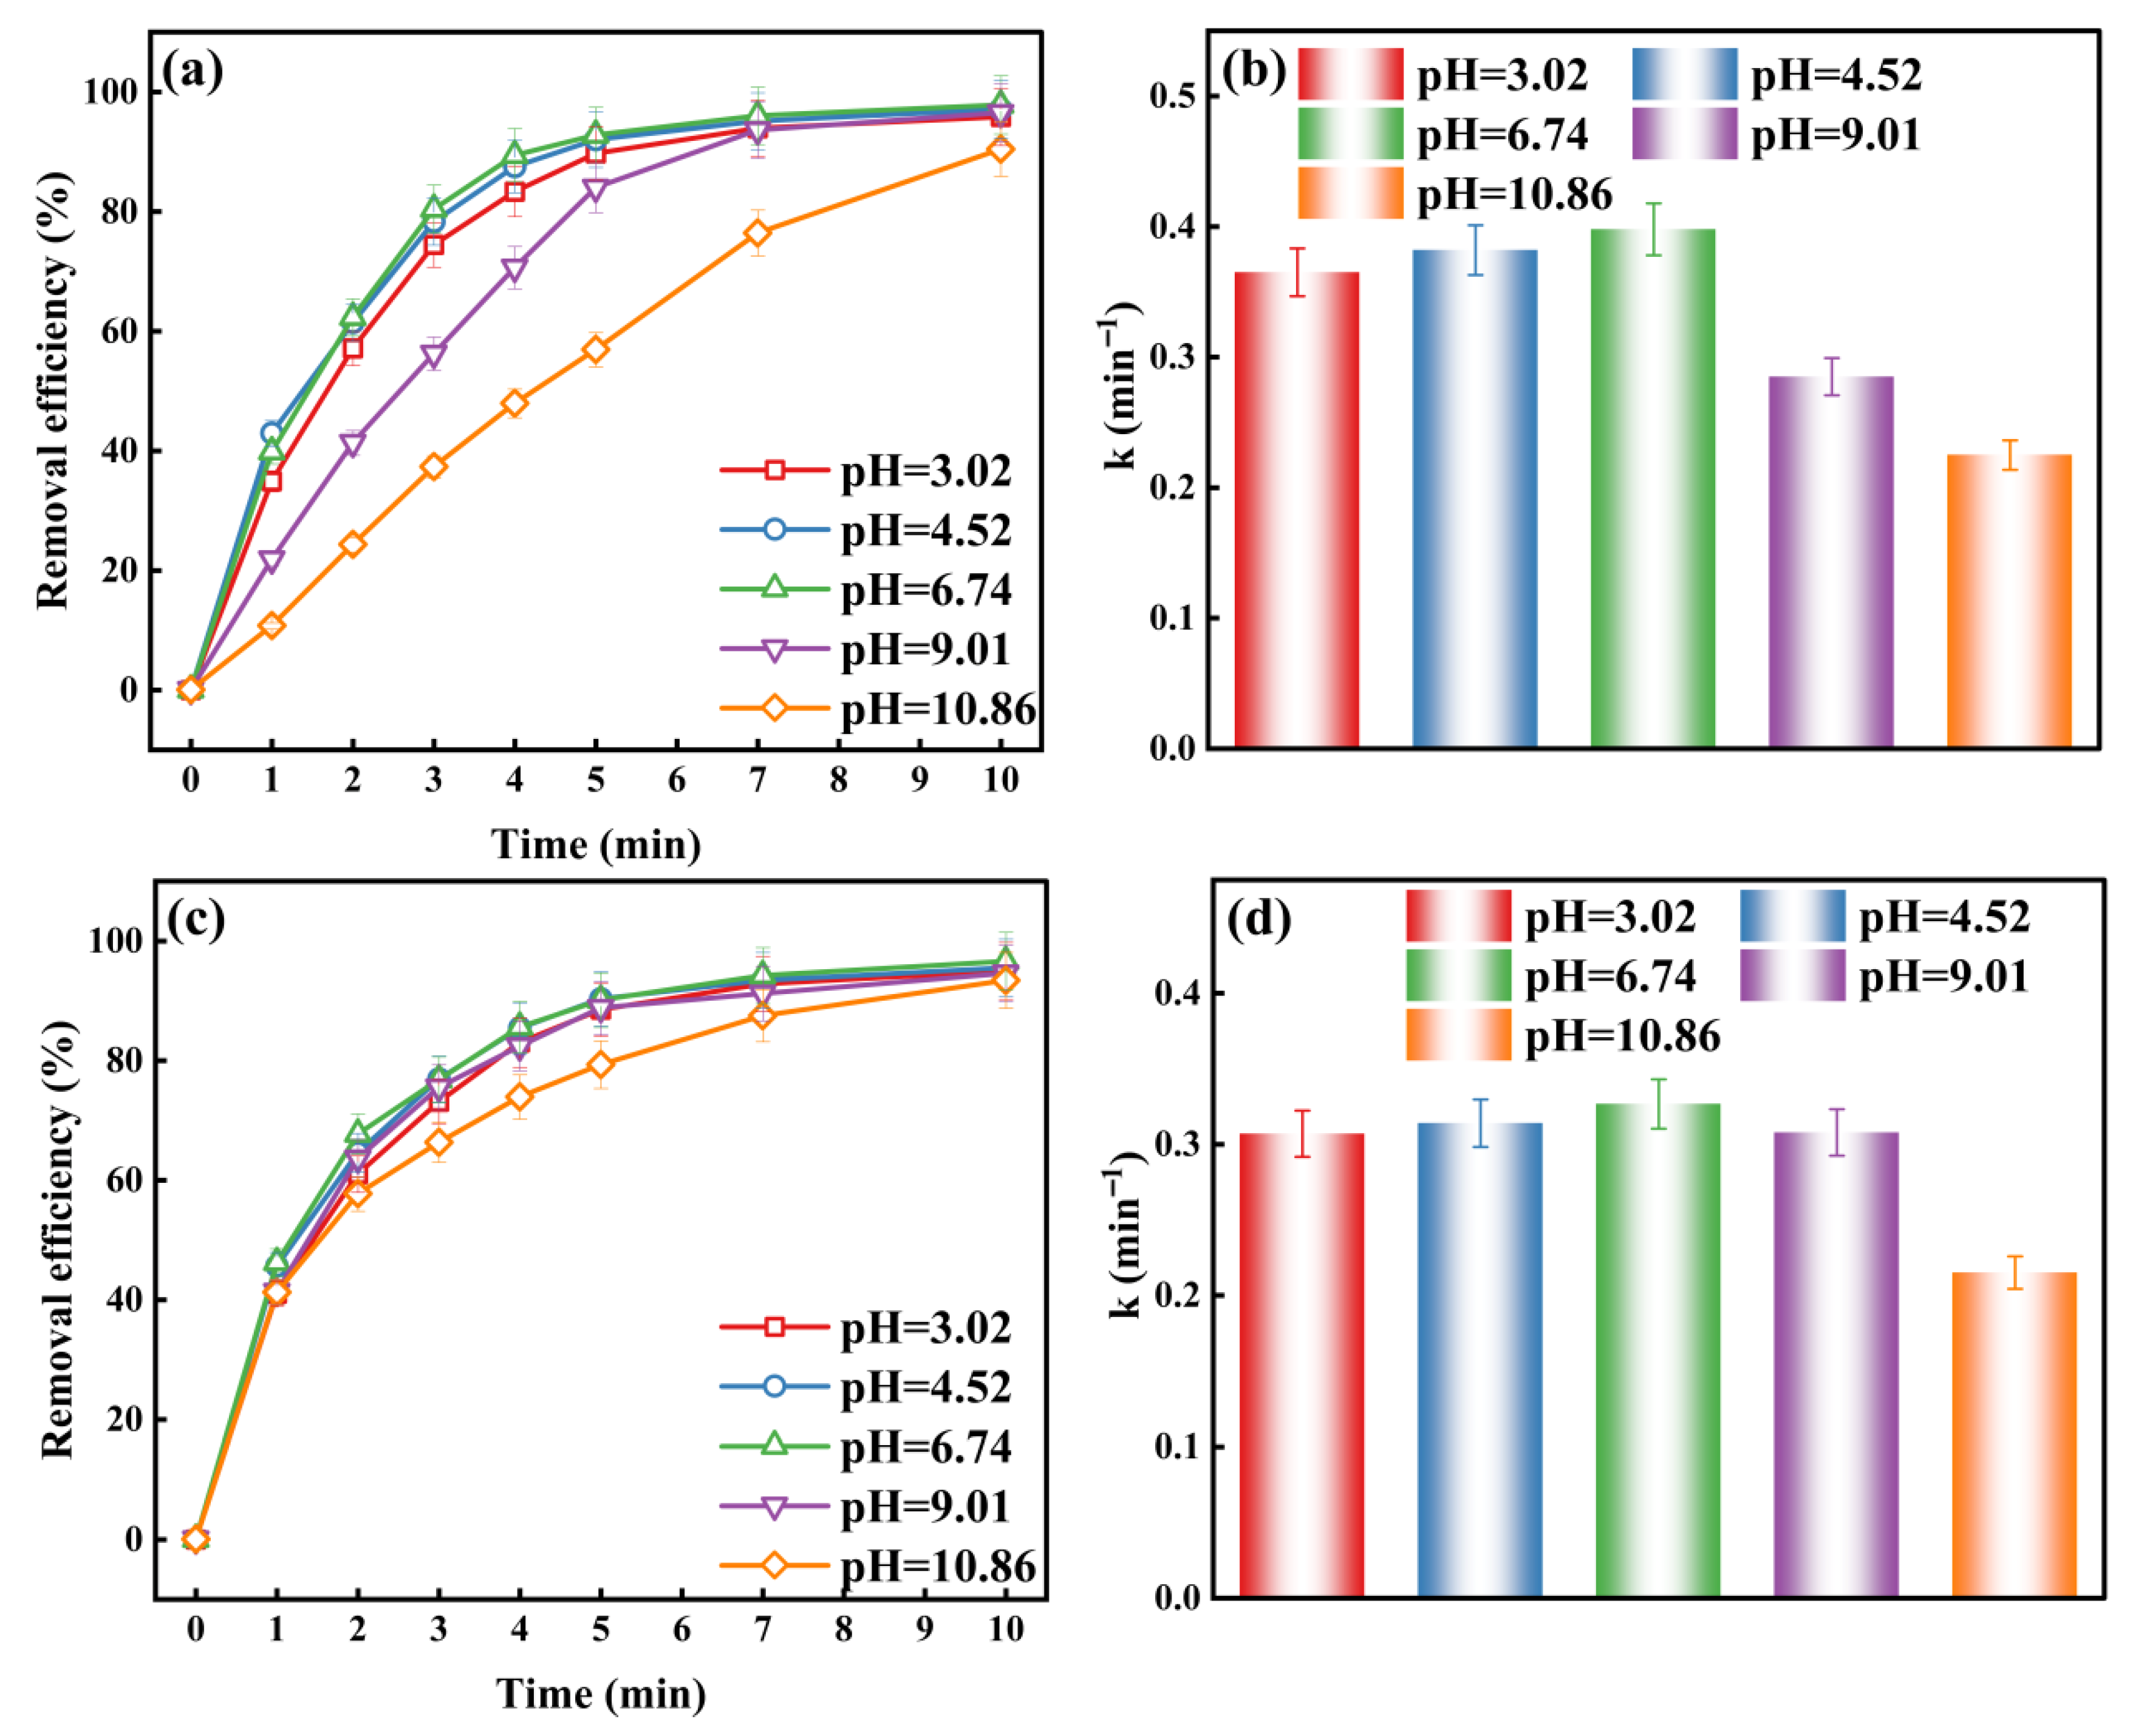
Figure 2 illustrates the effect of initial pH on the O3/H2O2 and the O3/K2S2O8 system. In the O3/H2O2 system, removal rates are higher under acidic pH conditions, with the highest removal rate of 97.8 ± 2.4% observed at pH 6.74 (Figure 2a). Under strongly acidic conditions (pH < 4), O3 primarily oxidizes pollutants directly in its molecular form, O3. However, its direct oxidation capacity is limited for complex aromatic structures like MO. At this pH, the decomposition rate of H2O2 is also relatively slow, resulting in weaker oxidation capabilities. As pH increases, the reaction rate between O3 and hydroxide ions (OH-) in water to form ·OH significantly accelerates. Moreover, MO readily converts to its azo structure at pH 4–9, making its conjugated system more susceptible to radical attack and substantially enhancing removal rate [26]. Under strongly alkaline conditions (pH > 9), O3 rapidly decomposes into ·OH radicals. However, these radicals may be consumed by quenching reactions or by reacting with excess OH-, leading to a sharp decline in removal rate. Additionally, as shown in Figure 2b, the reaction rate constant varies with initial pH. At pH 6.74, the maximum rate constant reaches 0.398, consistent with the trends observed in reaction time curves across different pH conditions. Thus, under weakly acidic conditions, O3 and H2O2 exhibit higher stability in acidic environments, enabling efficient generation of reactive radicals that accelerate the oxidative degradation of MO.
In the O3/K2S2O8 system, removal rates are higher under weakly acidic conditions, with the highest removal rate of 96.6 ± 2.4% observed at pH 6.74 (Figure 2c). Within the pH range of 3–10, the removal rate of MO by the O3/K2S2O8 system shows little variation, indicating strong adaptability across different pH levels, though degradation performance is superior under acidic conditions. Under strongly acidic conditions (pH < 4), excessively high H+ concentration quenches the ·SO4- radical, relying solely on direct O3 oxidation. However, this approach exhibits limited oxidation capacity for complex aromatic structures like MO, resulting in weaker performance. In strongly alkaline conditions (pH > 9), excessive decomposition of O3 into ·OH radicals occurs, while OH- readily reacts with ·SO4-, leading to reduced ·SO4- concentration. Under weakly acidic or weakly alkaline conditions, the synergistic interaction between direct O3 oxidation and ·SO4- radical-assisted degradation achieves optimal equilibrium. This avoids both radical inhibition under strong acidity and radical quenching effects under alkaline conditions. Further analysis of reaction rate constants at different initial pH values is shown in Figure 2b. The maximum reaction rate constant of 0.327 occurs at pH 6.74, with reaction rates being higher under acidic than alkaline conditions. This trend aligns with the reaction time curves observed at different pH levels [27].

2.1.3. The Effect of Active Substances on the O3/H2O2 and O3/K2S2O8 Systems Degradation of MO

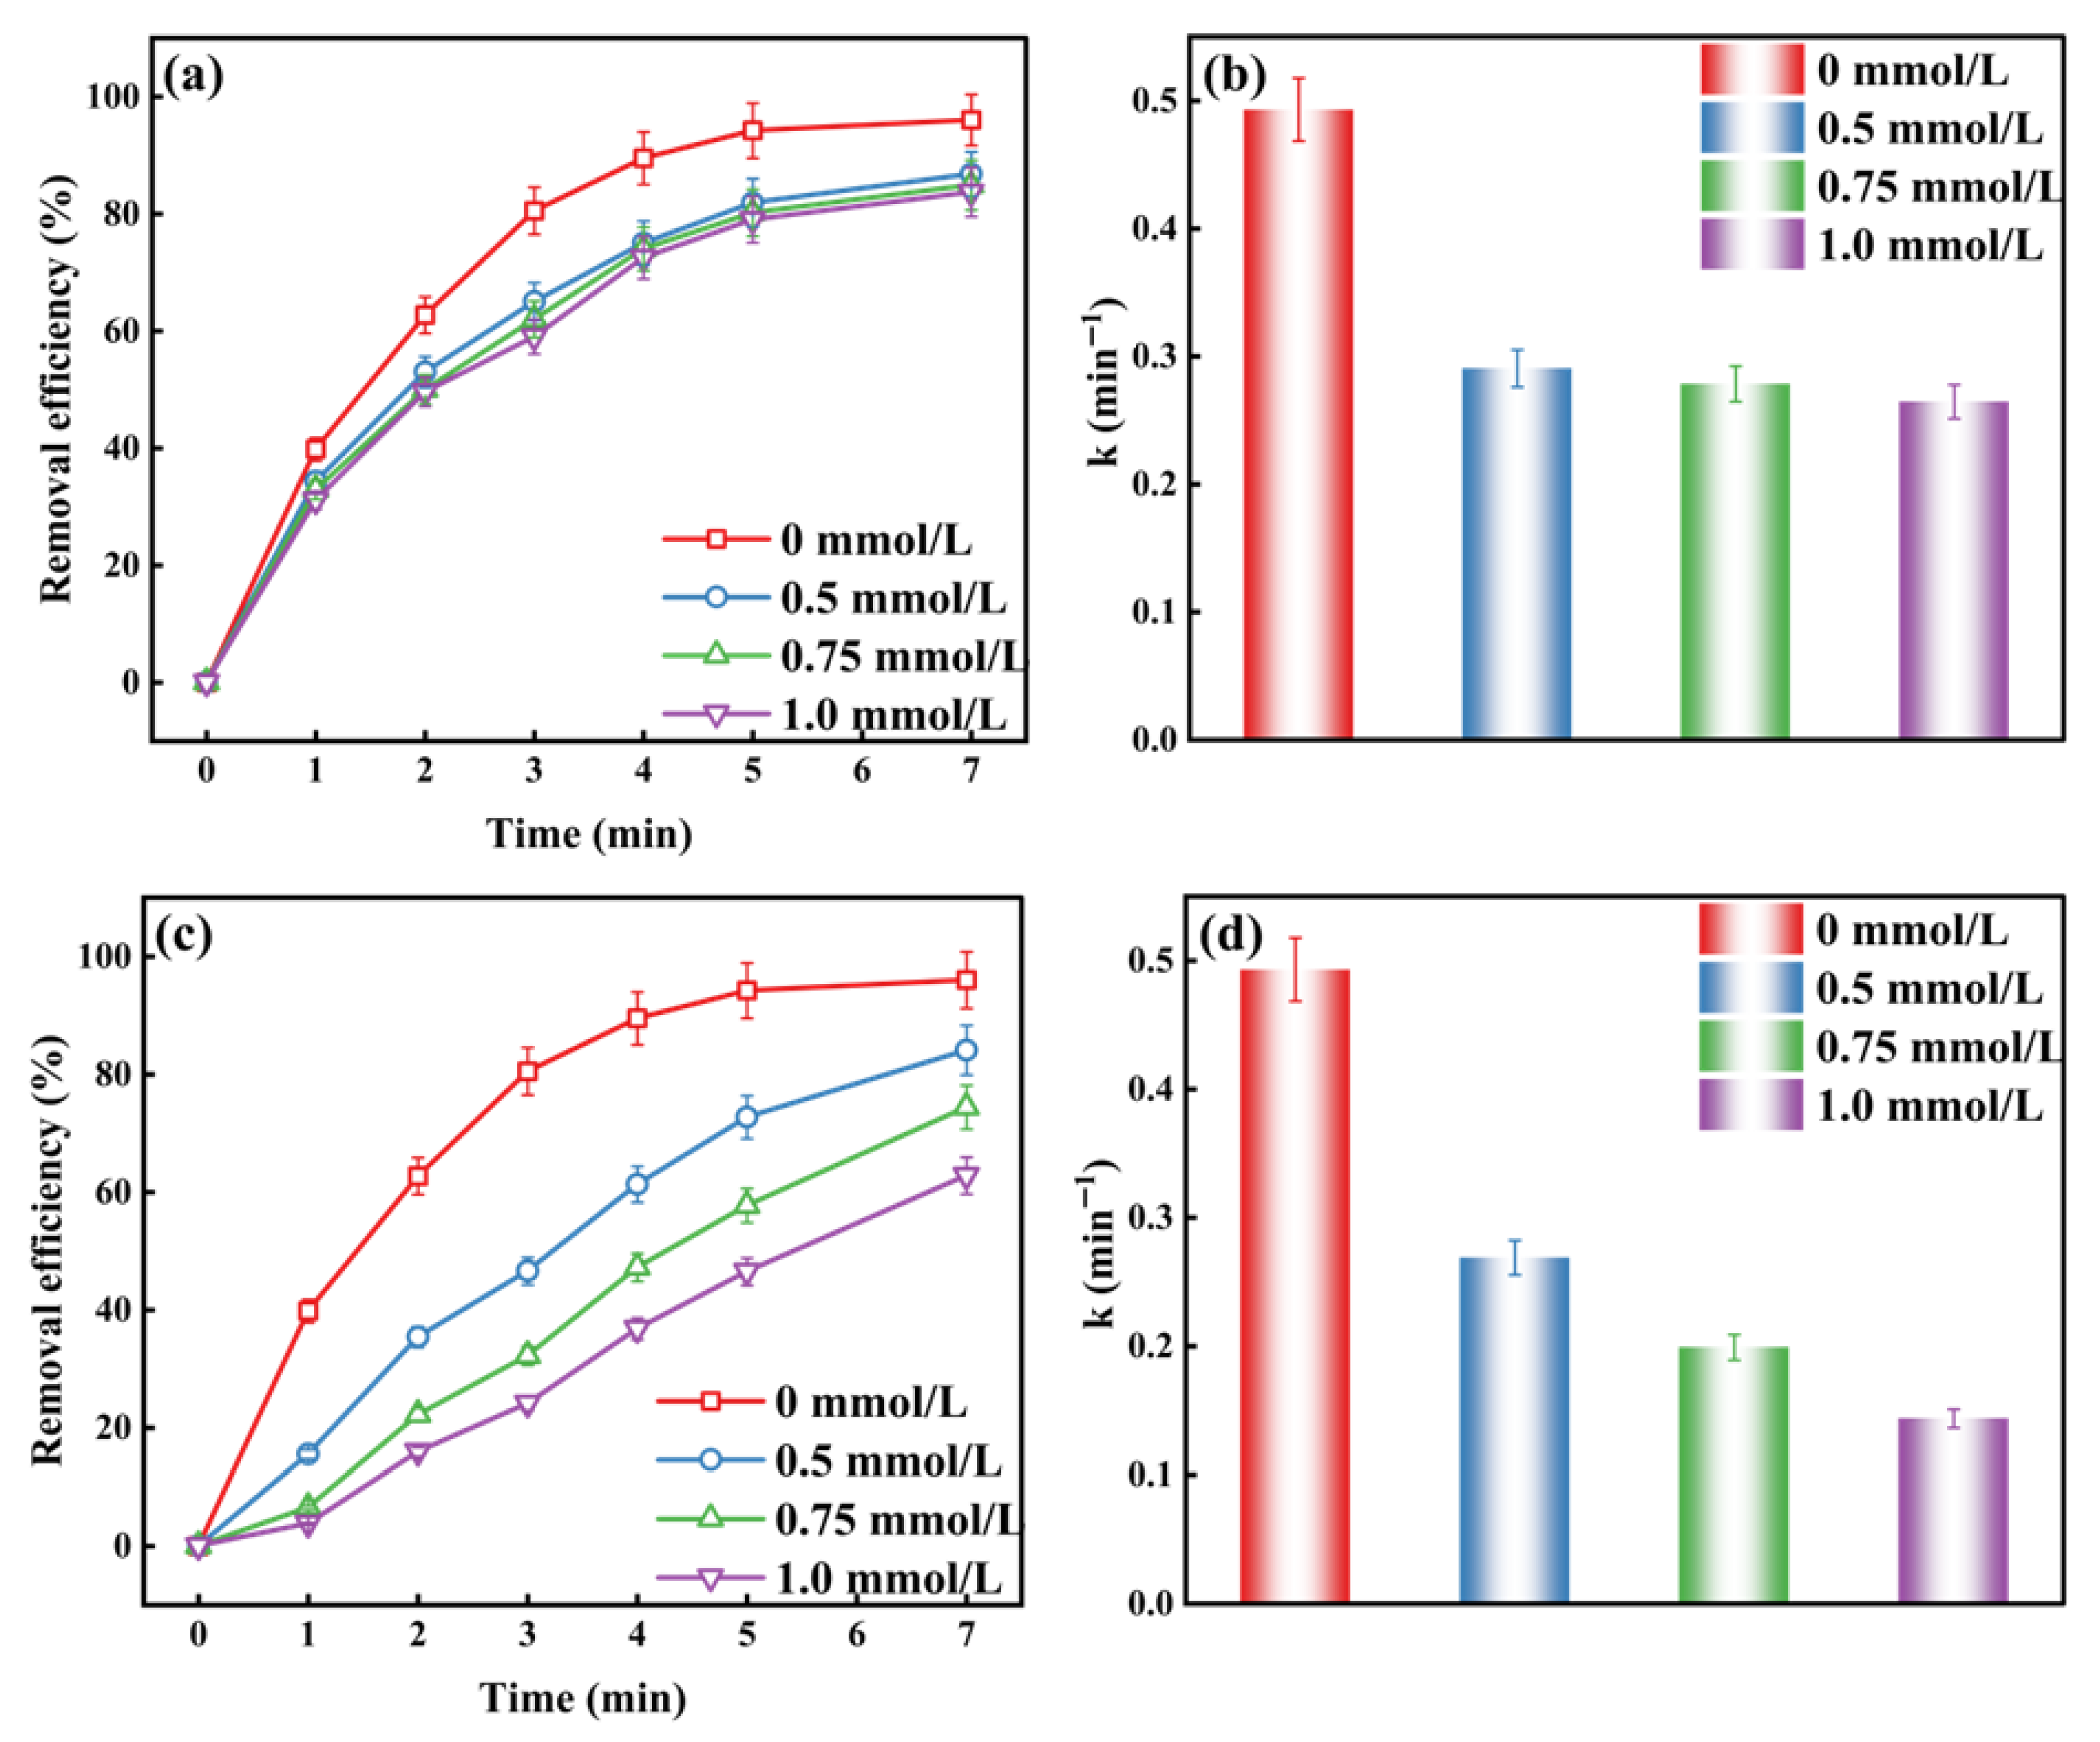
To investigate the effect of reactive species generated in the O3/H2O2 system on the degradation of MO, radical scavenging studies were conducted using IPA and BQ to capture ·OH and ·O2- radicals, respectively. By adding different doses of IPA and BQ to the O3/H2O2 system, their degradation effects on MO were studied, with results shown in Figure 3.
Figure 3a,b illustrate the impact of varying IPA concentrations on removal rate. IPA addition significantly reduced the O3/H2O2 system’s degradation of MO. As IPA concentration increased, the removal rate stabilized. At 1 mmol/L IPA, the removal rate decreased from 96.0 ± 2.2% to a minimum of 83.7 ± 2.1%. With the corresponding removal rate constant decreasing from 0.493 min−1 to 0.265 min−1, a reduction of 0.46 times compared to the control without IPA. This indicates that ·OH radicals play a dominant role in the oxidation system.
Figure 3c,d illustrate the effects of different BQ concentrations on degradation. BQ addition significantly reduced the O3/H2O2 degradation of MO. As BQ concentration increased, the removal rate gradually decreased. At 1 mmol/L BQ, the removal rate dropped from 96.0 ± 2.2% to a minimum of 62.8 ± 1.6%. The corresponding removal rate constant decreased from 0.493 min−1 to 0.144 min−1, representing a 0.71-fold reduction compared to the system without BQ. This indicates that the ·O2- radical plays a dominant role in the oxidation system. Comparing the degradation efficiencies of the two oxidants, the ·O2- radical is the stronger oxidant in the O3/H2O2 system.
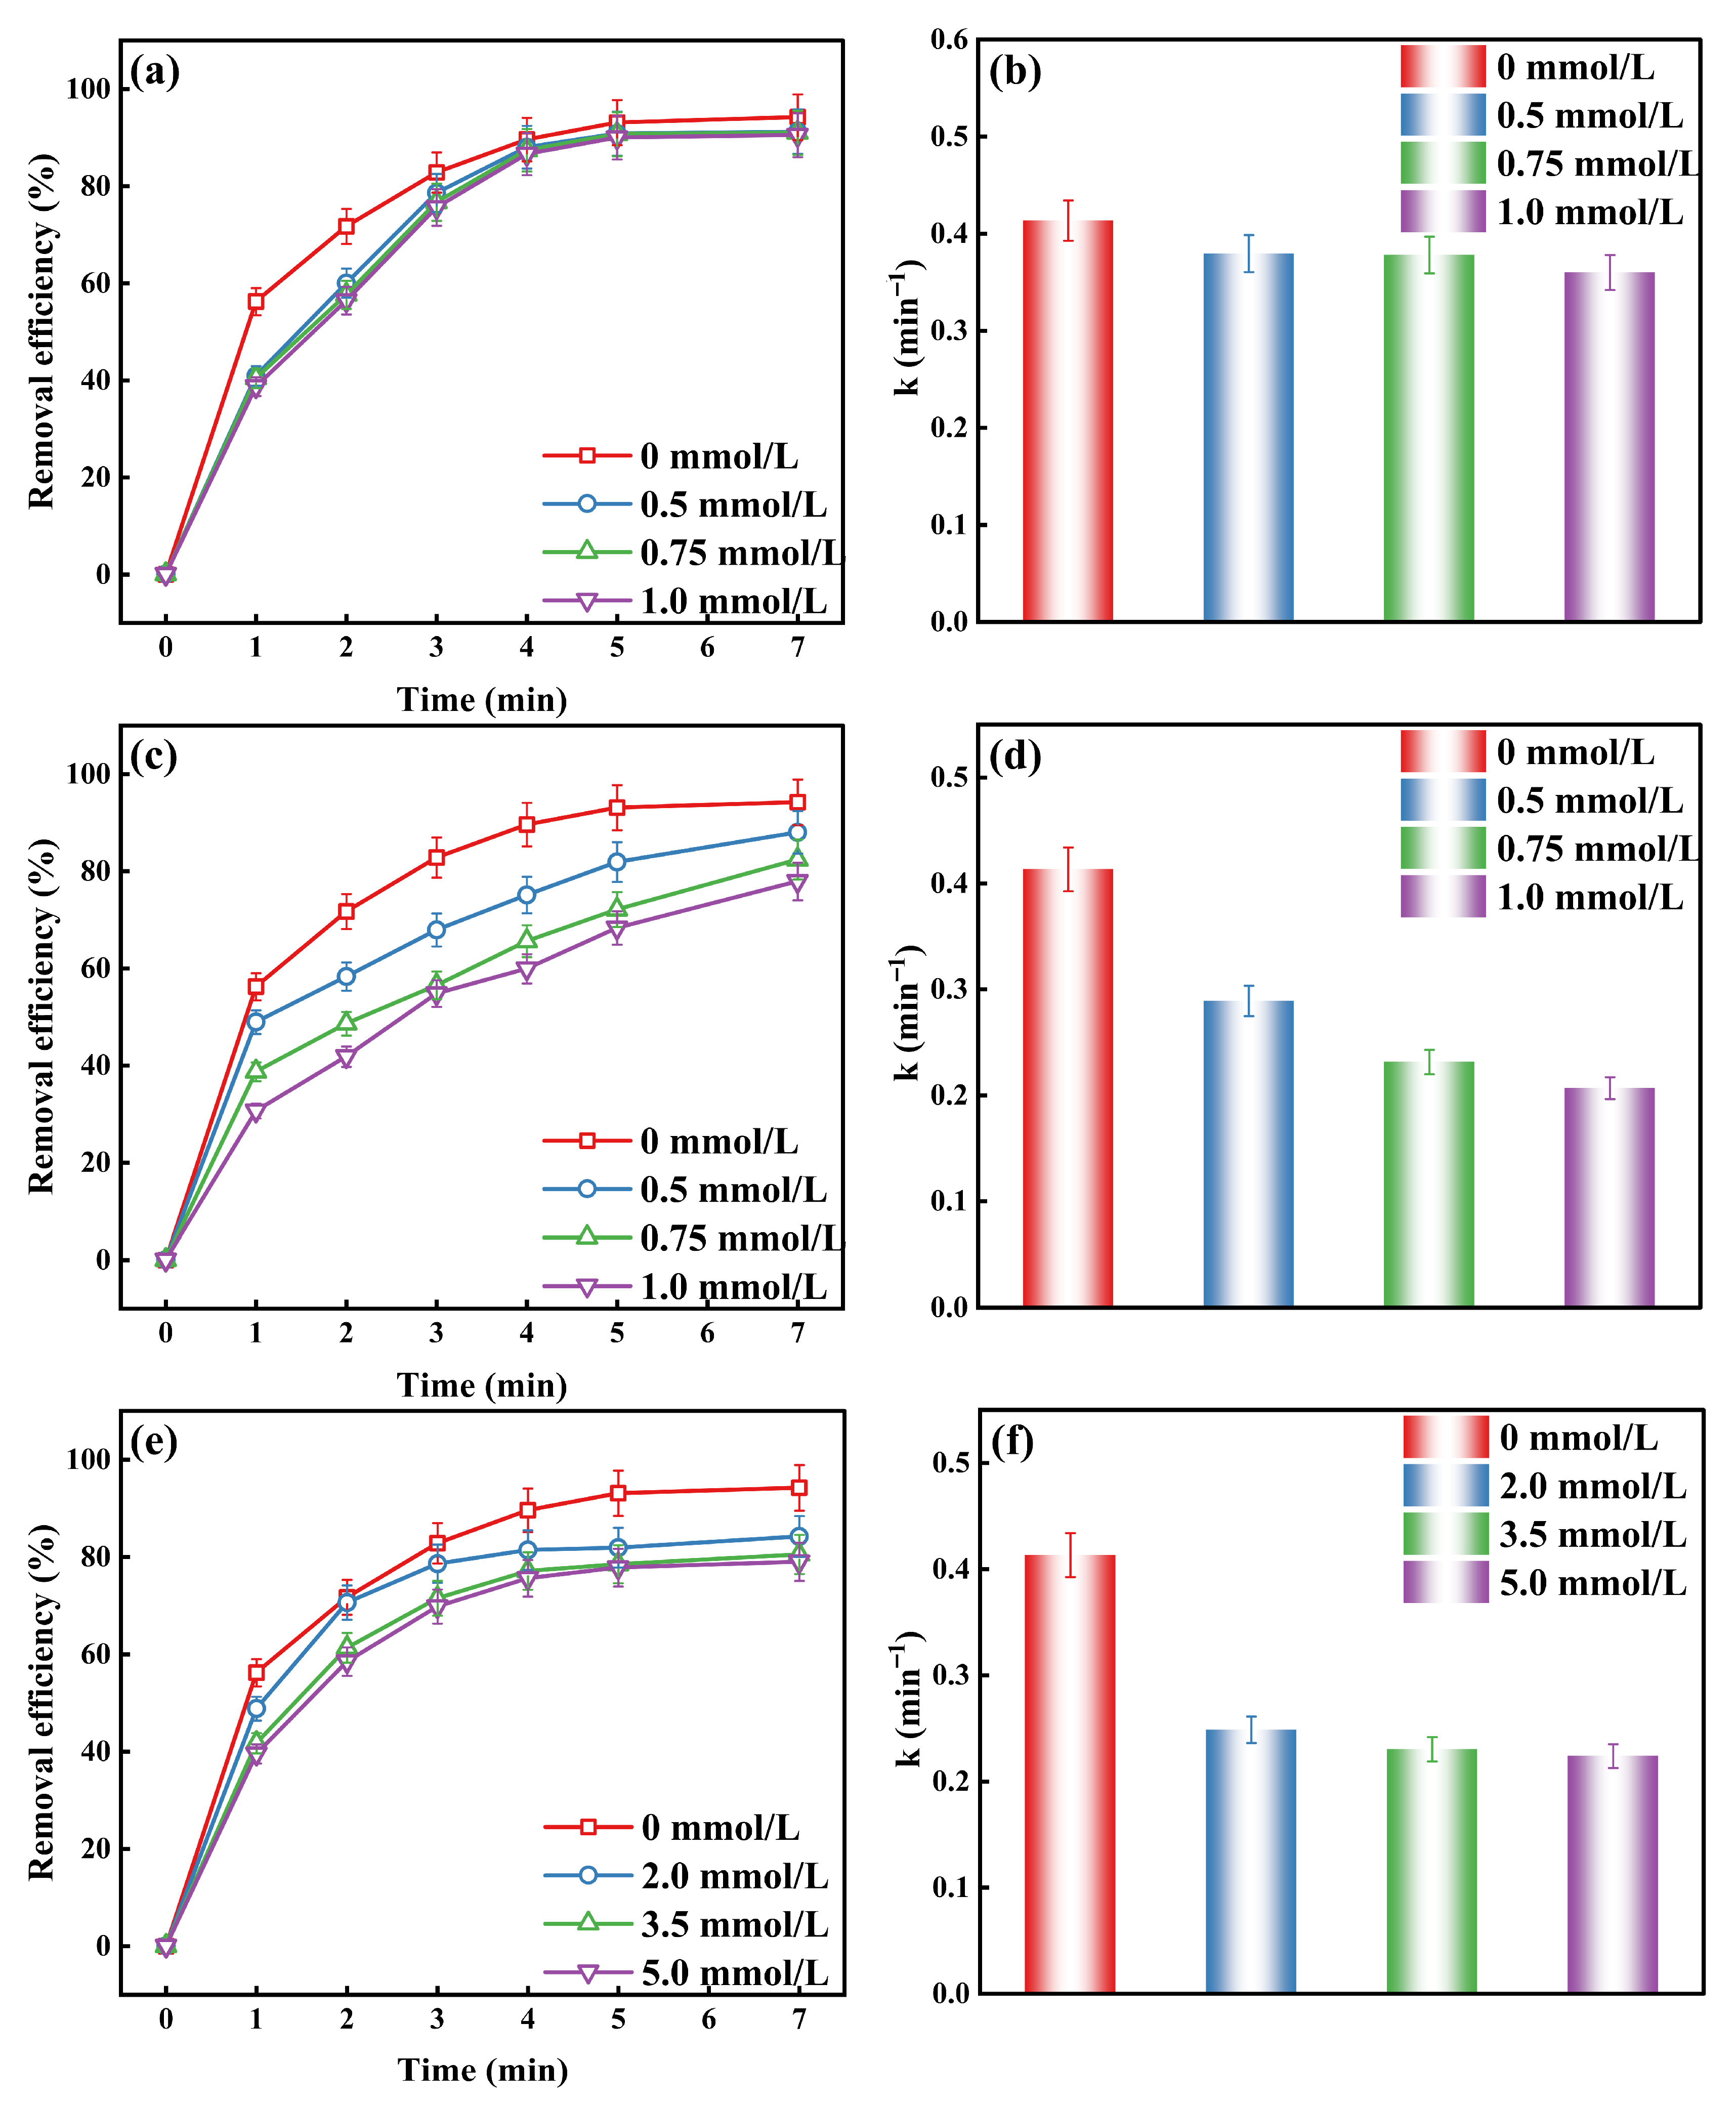
To investigate the role of reactive species generated in the O3/K2S2O8 system in the degradation of MO, radical scavenging studies were conducted using IPA, BQ, and NaNO2 to capture ·OH, ·O2-, and ·SO4- radicals, respectively. By adding different doses of IPA, BQ, and NaNO2 to the O3/K2S2O8 system, their effects on ·O2-, and ·SO4- radicals, respectively. By adding different doses of IPA, BQ, and NaNO2 to the O3/K2S2O8 system, their effects on MO degradation were investigated, with results shown in Figure 4.
Figure 4a,b illustrate the effect of varying IPA concentrations on removal rate. IPA addition slightly reduced the O3/K2S2O8 system degradation of MO, with removal rates stabilizing as IPA concentration increased. At 1 mmol/L IPA, the removal rate decreased from 94.2 ± 2.4% to a minimum of 90.5 ± 2.3%; correspondingly, the removal rate constant decreased from 0.413 min−1 to 0.36 min−1, representing a 0.13-fold reduction compared to the control without IPA addition. This indicates that ·OH radicals play a significant role in the oxidation system.
Figure 4c,d illustrate the effect of different BQ concentrations on removal rate. BQ addition significantly reduced the degradation of MO by the O3/K2S2O8 system, with removal rates gradually decreasing as BQ concentration increased. At 1 mmol/L BQ, the removal rate dropped from 94.2 ± 2.4% to a minimum of 77.9 ± 1.9%; correspondingly, the removal rate constant decreased from 0.413 min−1 to 0.207 min−1, representing a 50% reduction compared to the control without BQ. This indicates that the ·O2- radical plays a dominant role in the oxidation system.
Figure 4e,f illustrate the effect of varying NaNO2 concentrations on removal rate. NaNO2 addition also significantly reduced the O3/K2S2O8 system degradation of MO. As NaNO2 concentration increased, the removal rate gradually decreased. At 5 mmol/L NaNO2, the removal rate dropped from 94.2 ± 2.4% to a minimum of 79.0 ± 2.0%. with the corresponding removal rate constant decreasing from 0.413 min−1 to 0.224 min−1, a reduction of 0.46 times compared to the control without NaNO2. This indicates that the ·SO4- radical plays a dominant role in the oxidation system. Comparing the degradation efficiencies of the three oxidants, the ·O2- and ·SO4- radicals are the strongest oxidants in the O3/K2S2O8 system [28].
It should be noted that the use of scavengers like IPA, which can react with multiple radical species to varying degrees, may introduce some uncertainty in the quantitative contribution of each radical. Therefore, the interpretations presented here are based on the relative inhibitory effects observed, with the ‘no scavenger’ condition serving as the baseline control.

2.1.4. ESR Characterization

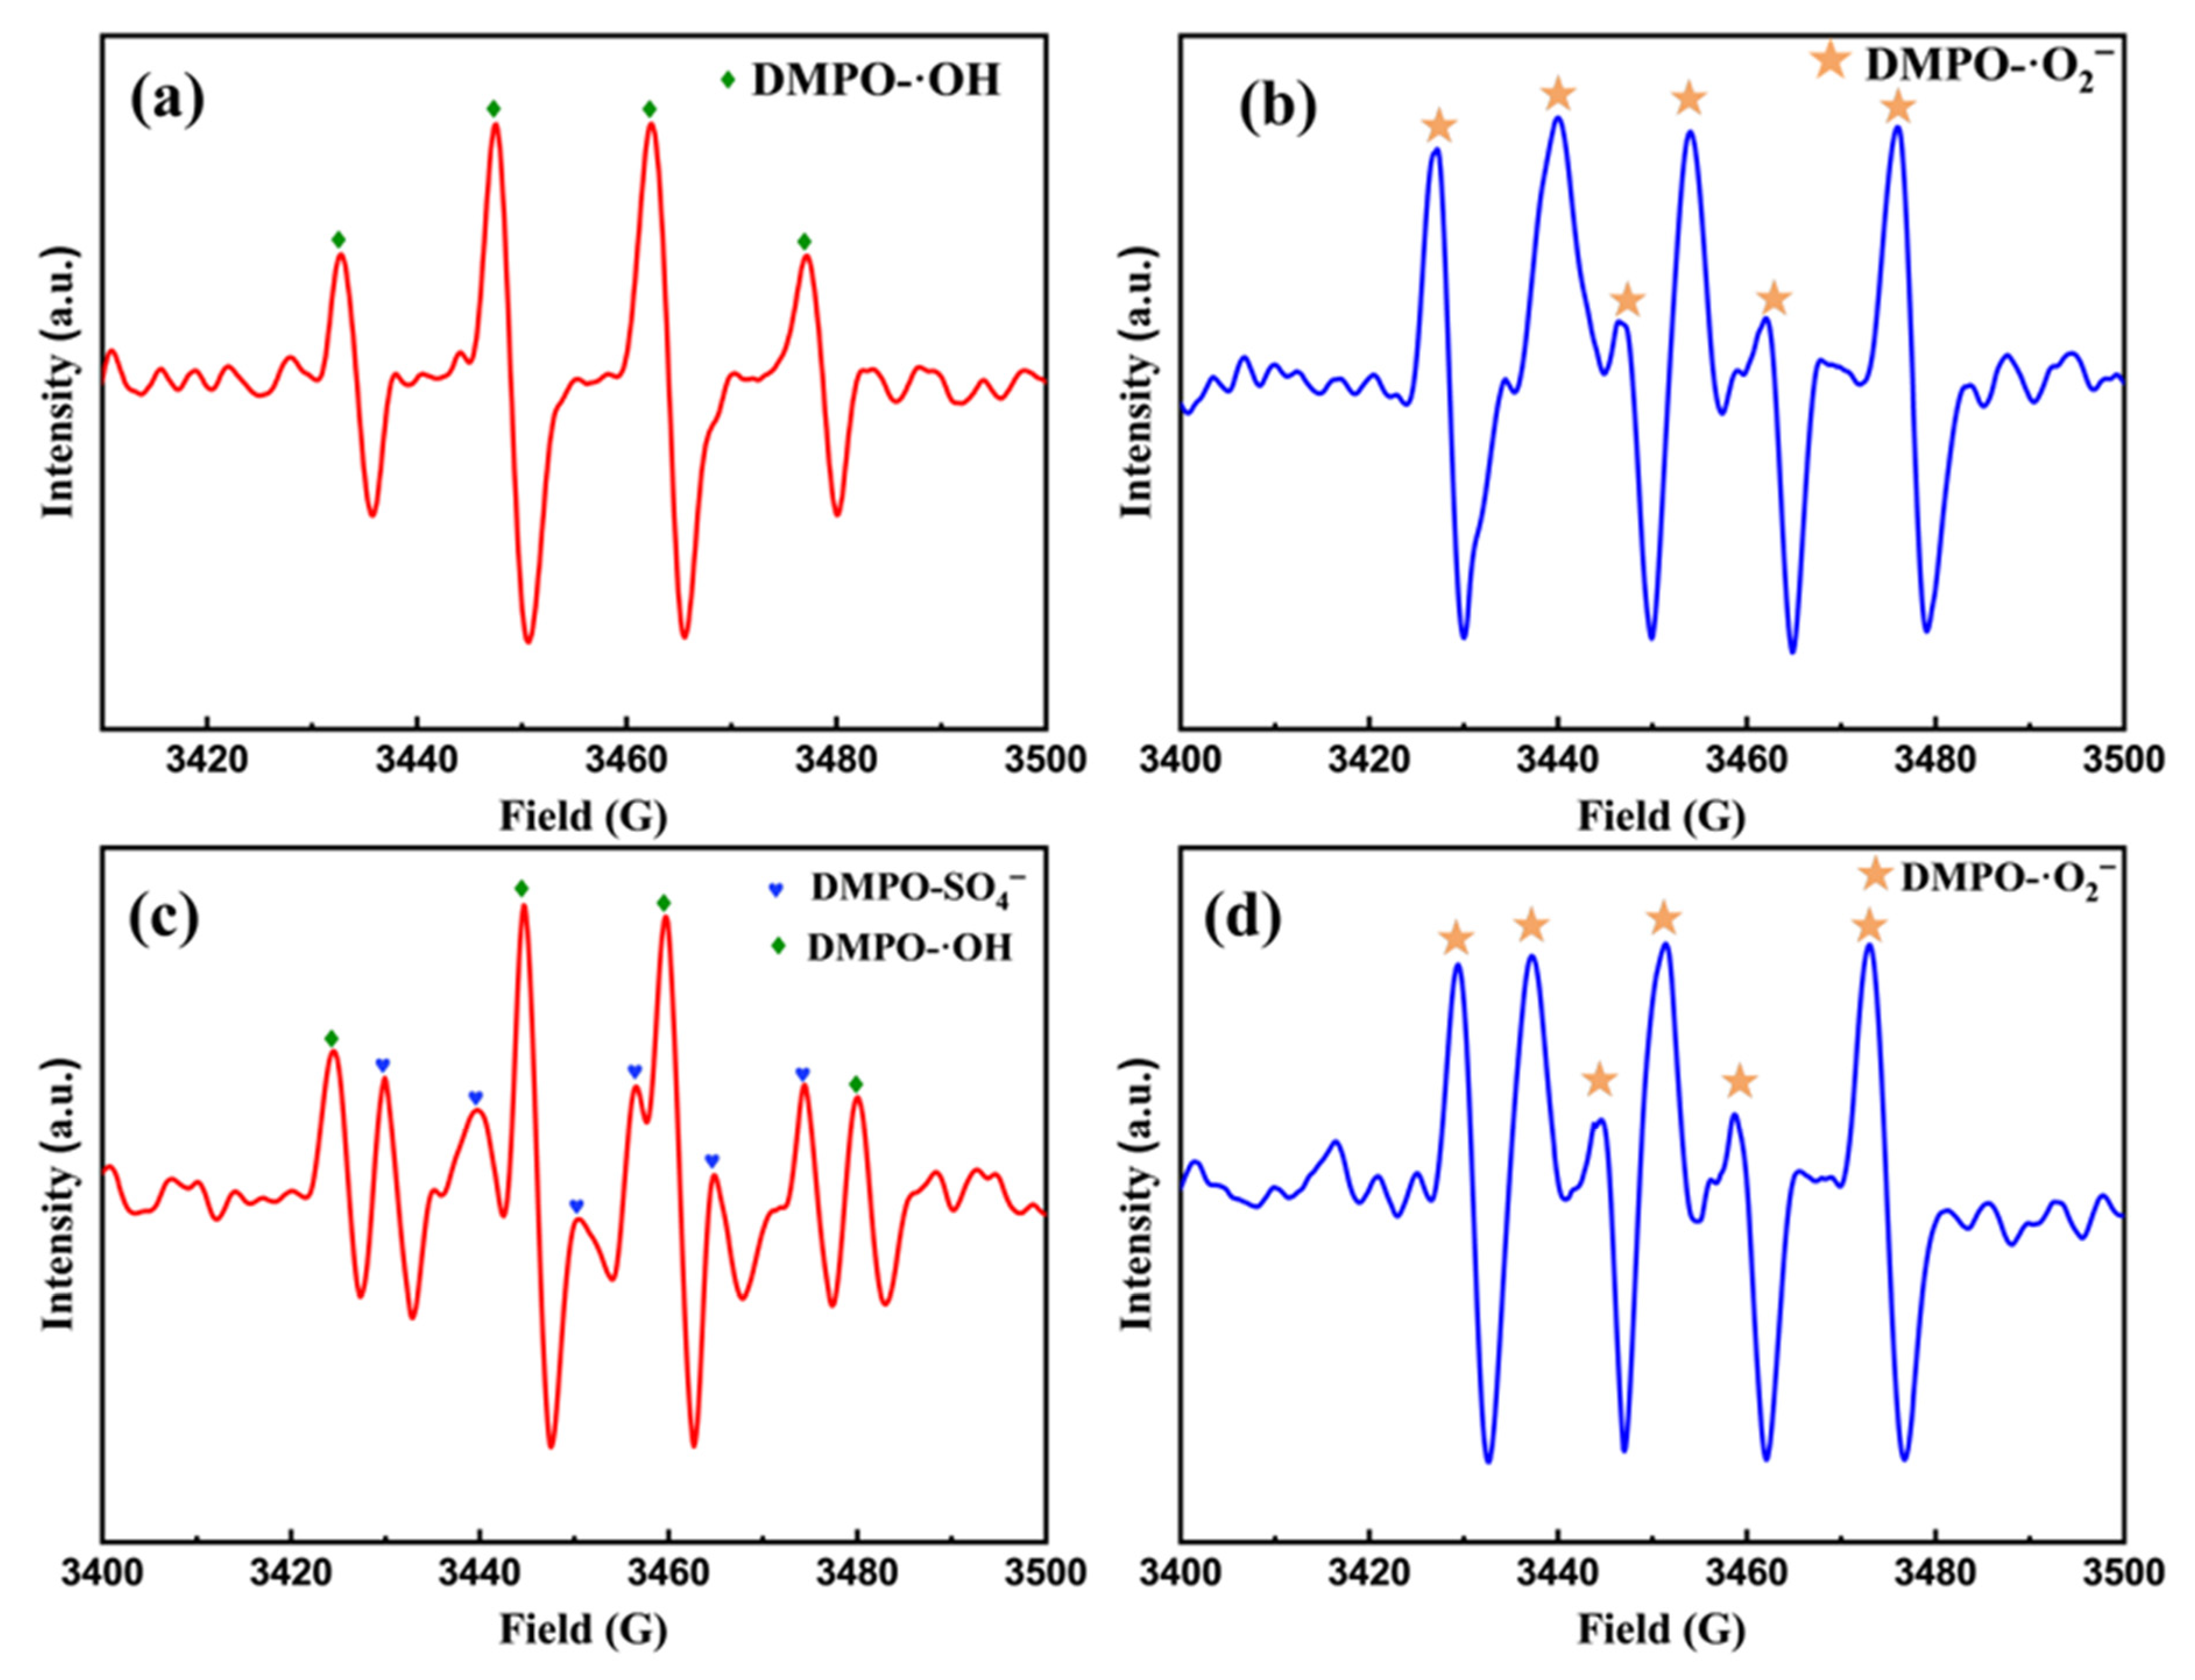
In the O3/H2O2 system of MO, active radicals were detected and analyzed using ESR technology combined with the spin trap DMPO (5,5-dimethyl-1-pyrroline-N-oxide). Generally, the intensity of the ESR spectrum increases with the number of active species generated. As shown in Figure 5a, the DMPO-HO· adduct with a peak ratio of 1:2:2:1 was distinctly detected. Its ESR spectrum closely matched the standard spectrum of the ·OH radical, confirming the generation of ·OH in the degradation system. This radical primarily originates from the intermediate product (·O2-) generated by the reaction between O3 and H2O2, which undergoes further conversion through chain reactions. Its strong oxidizing power plays a crucial role in destroying the aromatic ring structure of MO (Equations (1) and (2)) [29].
O3 + H2O → 2·OH + O2
O3 + H2O2 → ·OH + ·HO2 + O2
In Figure 5b, the ESR signal of the DMPO-·O2- adduct further indicates the presence of ·O2- radicals in the system. ·O2- radicals primarily originate from the decomposition of O3 under alkaline conditions or the homolytic cleavage of H2O2. The stronger ESR signal for the ·O2- adduct, consistent with its characteristic spectrum, suggests it may play a more significant role compared to ·OH under these conditions, which is further supported by the pronounced inhibitory effect of BQ in scavenging experiments (Figure 3c,d) [30]. The synergistic action of both radicals markedly enhances the removal rate of MO. ·OH directly attacks the molecular structure of organic compounds, while ·O2- maintains the continuity of the radical chain reaction by regulating the reaction pathway (Equations (3) and (4)).
O3 + e- → ·O3- → ·O2- + O
O3 + H2O2 → ·OH + ·HO2 + O2
In the O3/K2S2O8 system for MO, active free radicals were analyzed using electron spin resonance (ESR) technology combined with the radical scavenger DMPO. As shown in Figure 5c, the spectrum revealed characteristic signals of the DMPO-·OH adduct with a peak ratio of 1:2:2:1, alongside a signal composed of six characteristic peaks from DMPO-SO4-. This indicates that K2S2O8 decomposition generates ·SO4- radicals, while O3 undergoes chain reactions in water to produce ·OH radicals. Furthermore, ·SO4- may react with water molecules to generate ·OH, creating synergistic effects between the two radicals (Equations (5)–(7)).
S2O82- → 2·SO4-
O3 + H2O → 2·OH + O2
·SO4- + H2O → SO42- + ·OH + H+
The signal from the six characteristic peaks of the DMPO-O2- adduct in Figure 5d indicates the presence of ·O2- radicals in the system. Their origin may be related to the decomposition of O3 or secondary reactions between ·SO4- and O3. ·OH, ·SO4-, and ·O2- attack the azo structure and aromatic ring of MO through oxidation, electron transfer, and other pathways, leading to its degradation. The intensity of characteristic peaks confirms ·SO4- and ·O2- as the primary oxidizing agents, while the O3/K2S2O8 system operates via a multi-radical synergistic mechanism [31].

2.1.5. Analysis of Degradation Products in the O3/H2O2 and O3/K2S2O8 Systems

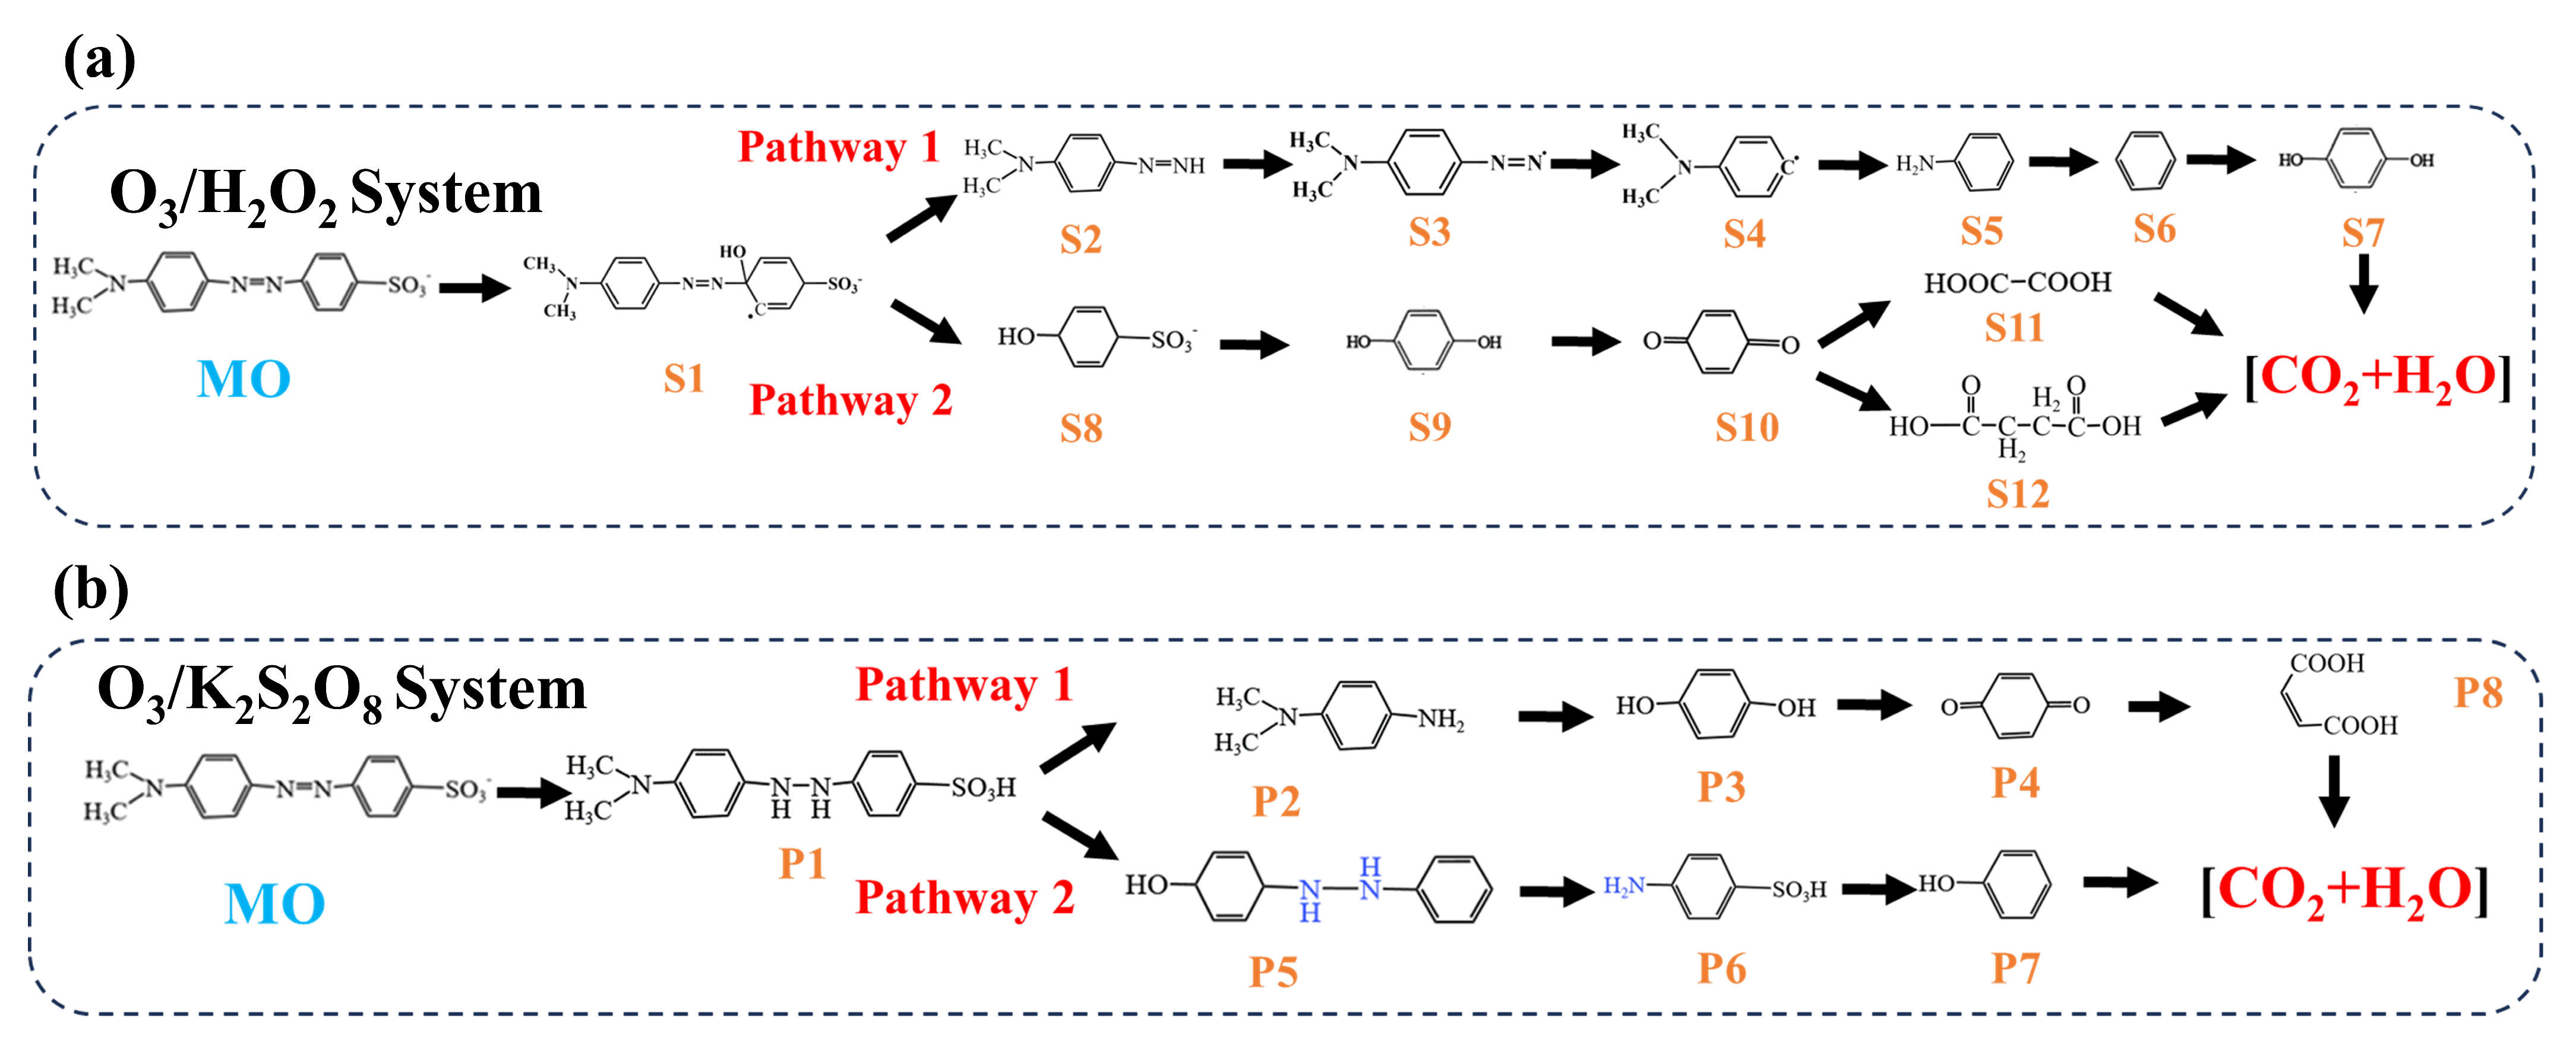
The degradation intermediates were identified based on their m/z values obtained from LC-MS, and their proposed structures were assigned by comparison with previously reported intermediates in the degradation of MO and similar azo dyes [32,33]. Analysis of LC-MS identification results for the O3/H2O2 system revealed a total of 11 distinct intermediate products, as detailed in Table S1. Only three products have an m/z ratio less than 100, while the m/z ratios of the other eight products are all greater than 100. Among these, the benzene ring served as the primary intermediate structural motif, present in nine of the identified intermediates. Four intermediates contained a dimethylamino structure. Combining relevant literature analysis with degradation pathways, as shown in Figure 6a, the ·OH radical first interacts with the azo linkage by abstracting an electron, inducing cleavage of the -N=N- bond. Subsequently, ·OH and ·O2- radicals attack the resulting aromatic fragments, forming hydroxylated intermediates. This causes the MO molecule to cleave at the middle into two distinct aromatic compounds. Through two distinct pathways and the combined action of multiple radicals, various organic compounds containing benzene rings are formed. In pathway two, benzoquinone is generated. Due to its instability, it undergoes ring-opening degradation into S11 oxalic acid and S12 succinic acid, ultimately mineralizing into CO2 and H2O [34].
In the O3/K2S2O8 system, based on LC-MS identification results and relevant literature references, a total of eight intermediate products were identified (Table S2). Seven of these contained benzene rings and had mass-to-charge ratios (m/z) greater than 100, while only one product had an m/z below 100. Both the number of intermediate types and the proportion of low mass-to-charge ratio products were lower than in the O3/H2O2 system. Among these, two intermediate products were arylhydrazine-type organic compounds. Based on the identified intermediates (Table S2) and previously reported mechanisms for azo dye degradation, a plausible degradation pathway for MO in the O3/K2S2O8 system is proposed in Figure 6b [35,36]. The proposed degradation pathway begins with an oxidative cleavage of the -N=N- bond by ·SO4- and ·O2- radicals. This step generates nitrogen-centered radical intermediates that can undergo transient hydrogen abstraction from water or ·HO2 radicals, forming short-lived hydrazine-like intermediates (-NH-NH-). These species subsequently undergo further oxidation and hydroxylation to yield phenolic and arylhydrazine-type compounds. Therefore, the apparent hydrogen addition shown in the schematic represents a radical stabilization step under oxidative conditions, not a true reduction or hydrogenation. Under the experimental pH (≈6.7), the sulfonate group remains deprotonated as -SO3-. Protonation occurs preferentially on nitrogen atoms of amino or hydrazine groups. The figure illustrates this process schematically to indicate charge neutrality, but in practice, the system remains strongly oxidative and near-neutral [37].
The proposed structures of intermediates are based on LC-MS analysis and comparison with identified compounds reported in the literature for similar reaction systems [38]. The pathways were constructed considering the known reactivity of ·OH and ·SO4- radicals with azo dyes [39,40].

2.1.6. Toxicity Analysis in O3/H2O2 and O3/K2S2O8 Systems

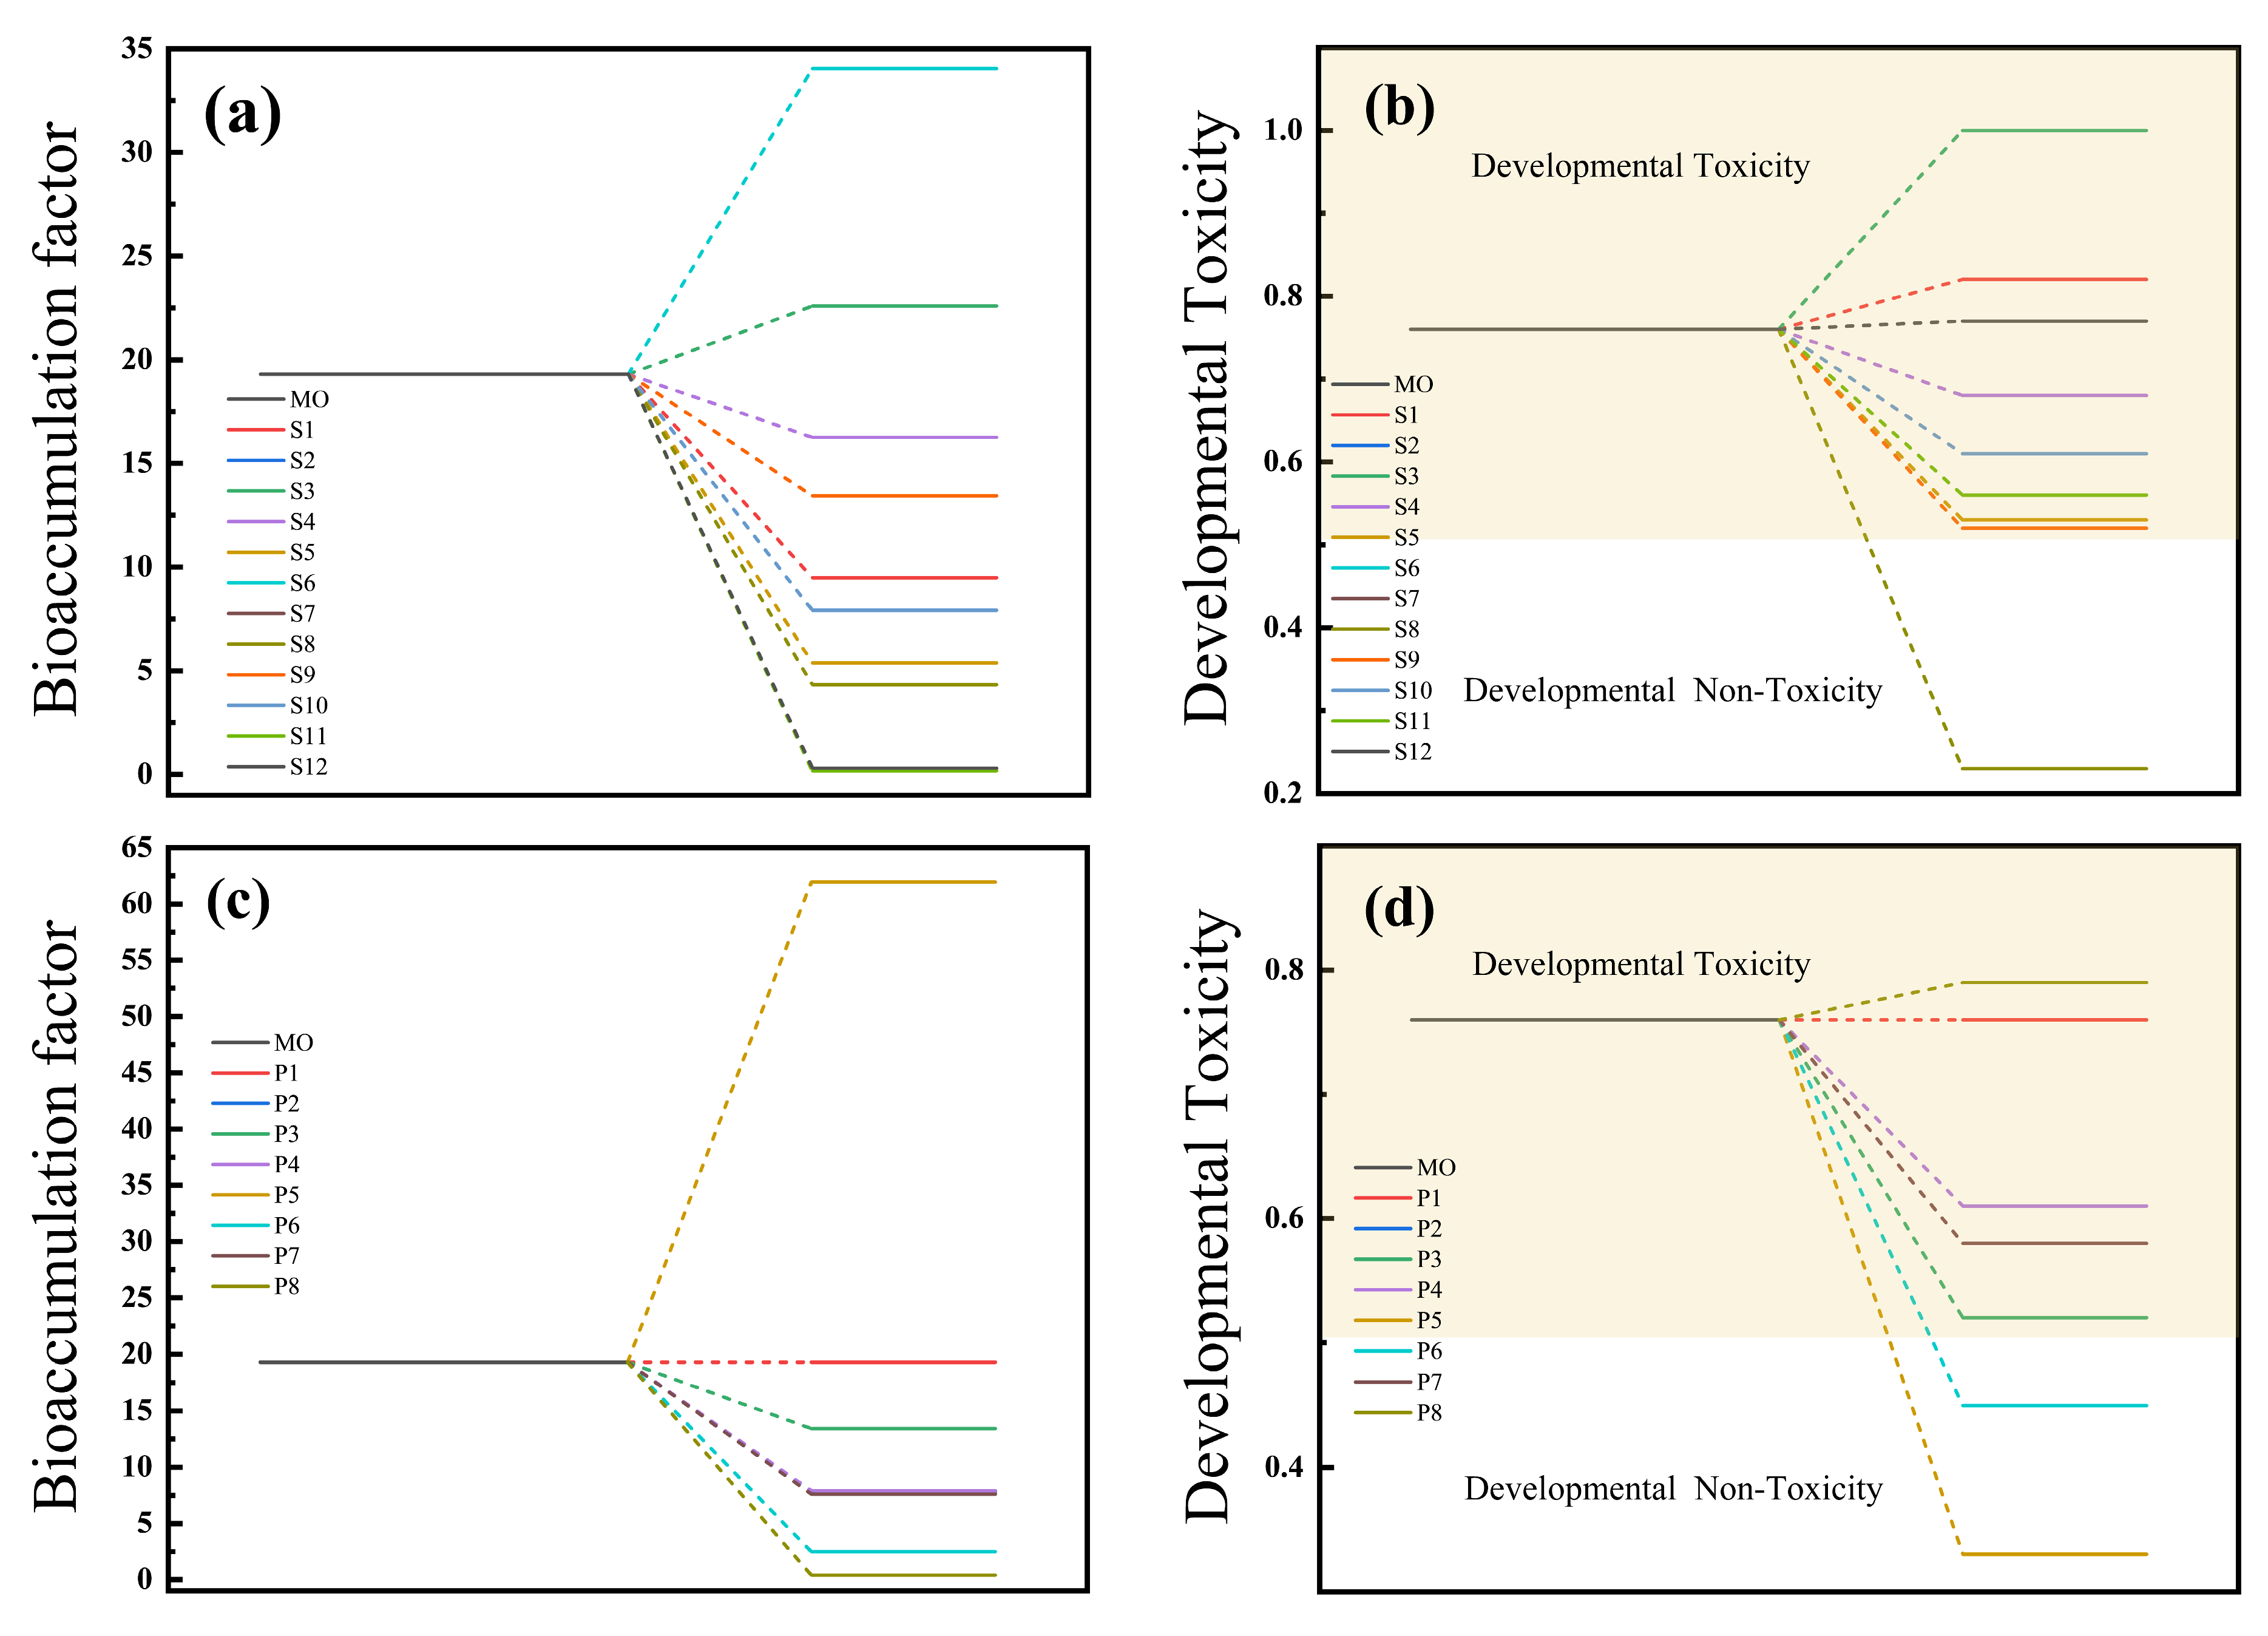
Due to the generation of numerous degradation intermediates during the ozonation-based degradation of methyl orange, the potential environmental risks of the two experimental systems were assessed based on the preceding analysis of degradation intermediates and pathways. The bioaccumulation factor serves as a key indicator for evaluating a chemical’s tendency to accumulate in living organisms, while developmental toxicity reflects the adverse effects of exogenous physical and chemical factors on offspring before maturity. Based on this, the toxicity of methyl orange and its degradation intermediates was predicted using QSAR methods with T.E.S.T. software (Version 5.1). The toxicity of both systems was evaluated according to their bioaccumulation coefficients and developmental toxicity, with the results shown in Figure 7a,b. The figure indicates that twelve intermediate products were generated during methyl orange degradation in the O3/H2O2 system. Among these, nine intermediates exhibited significantly reduced bioaccumulation coefficients, with product S11 showing the lowest value of only 0.17. Analysis of developmental toxicity revealed that, except for four intermediates (S1, S2, S3, and S12), the developmental toxicity of all other intermediates decreased compared to methyl orange. Among them, S6 and S8 have the lowest toxicity.
As shown in Figure 7c,d, in the O3/K2S2O8 system, except for intermediate P5 exhibiting a relatively high bioconcentration factor and P1 maintaining an identical factor, the remaining six intermediates showed significantly reduced bioconcentration factors compared to MO. This demonstrates that the degradation process in this system diminishes the tendency for accumulation within biological organisms. Analysis of developmental toxicity effects revealed reduced toxicity in six of the eight intermediates. Two products (P5 and P6) can be considered to be less toxic, confirming that the system reduces toxicity to some extent during degradation. Combining the bioaccumulation factor and developmental toxicity analyses of both systems, both degradation pathways reduce the residual toxicity of MO. Among them, the O3/K2S2O8 system exhibits weaker toxicity during degradation, exerting less impact on environmental organisms and thus being more suitable for practical application [41].

2.2. Comparison of O3 with H2O2 and K2S2O8

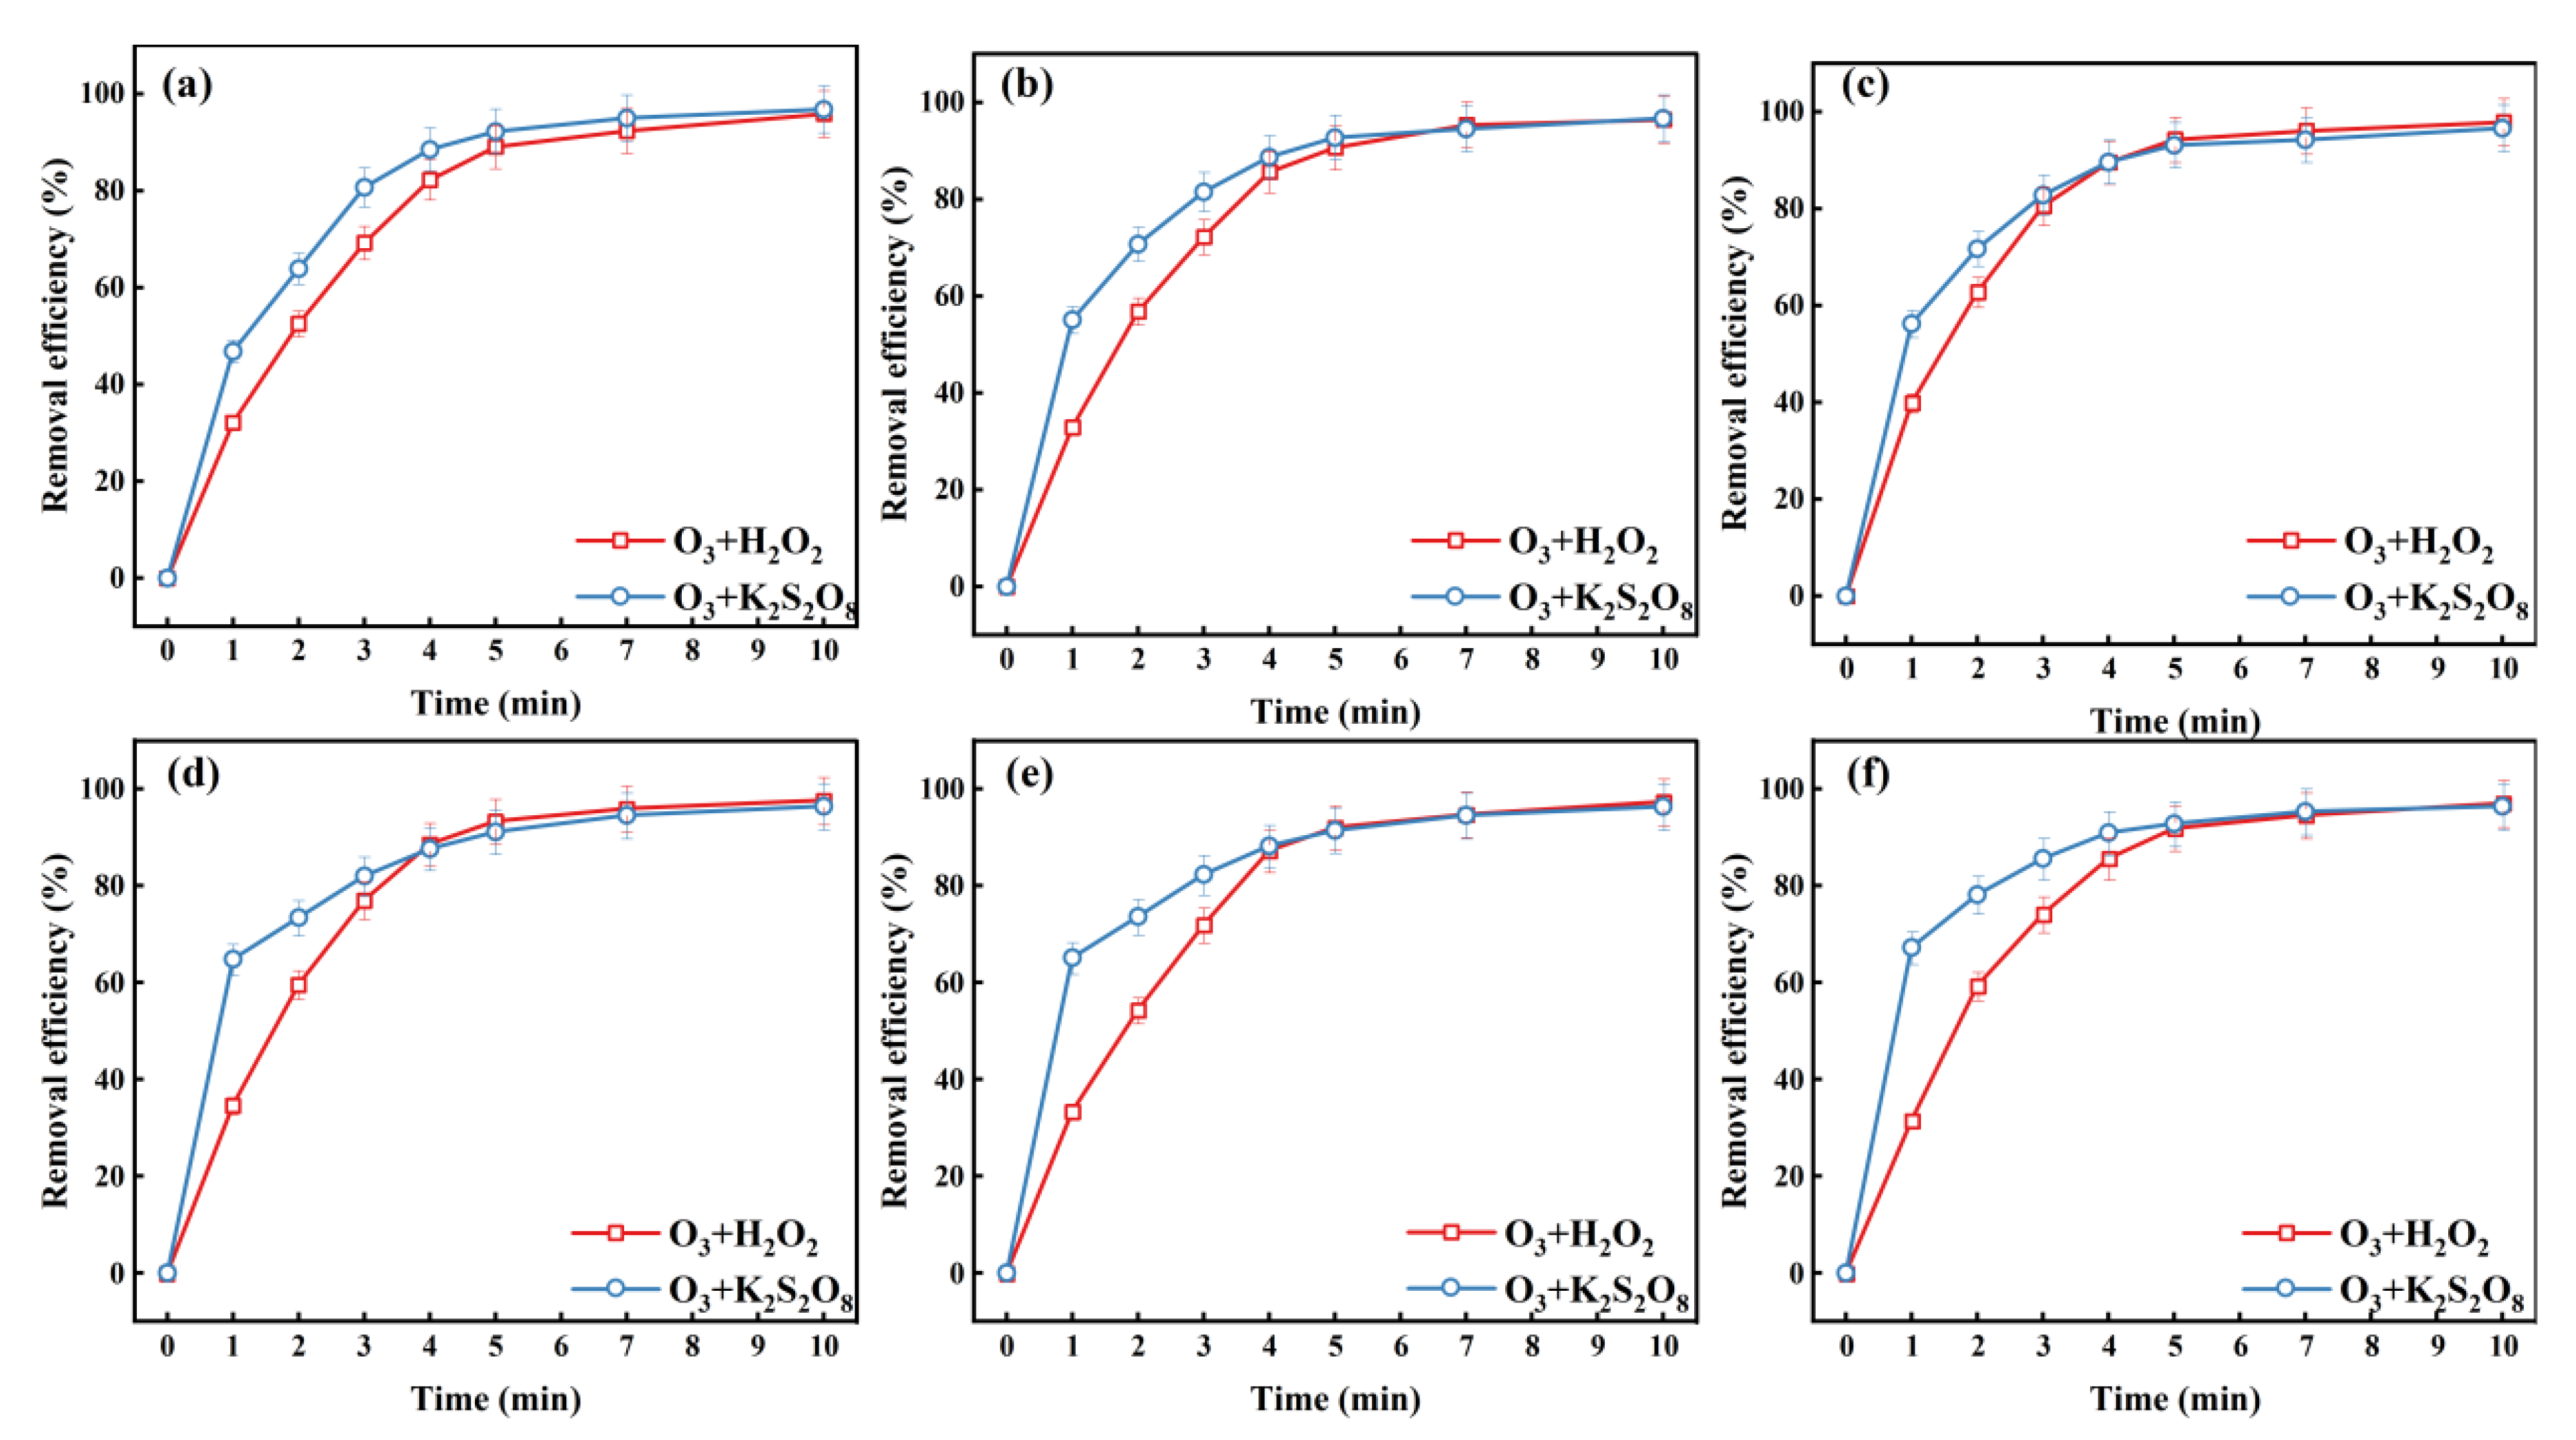
Figure 8 shows the time-response curves for the degradation of MO by H2O2, K2S2O8, and O3 at the same concentration. The figure indicates that within 4 min, the oxidation reaction system of O3 with K2S2O8 exhibits a higher rate. This is because K2S2O8 and O3 can rapidly react within a short time to form ·SO4-, which rapidly attacks the azo bond and other structures of MO, leading to a high removal rate in a short time. In contrast, H2O2 and O3 generate ·OH through a chain reaction. The radical concentration is low at the beginning of the reaction and gradually accumulates through continuous chain reactions as the reaction progresses.
On the other hand, when the initial concentrations of H2O2 and K2S2O8 are <2.2 mmol/L, the O3/K2S2O8 system degrades faster than the O3/H2O2 system. This is because at low concentrations, O3 can directly activate persulfate (S2O82-) to efficiently generate ·SO4-. This reaction pathway is simpler with lower activation energy, and the longer half-life of ·SO4- enables sustained pollutant degradation within the system. In contrast, H2O2 and O3 require a chain reaction to generate ·OH, involving complex steps dependent on H2O2 concentration. At low H2O2 levels, the reaction rate between H2O2 and O3 is insufficient, limiting radical production. Conversely, elevated H2O2 concentrations effectively promote O3 decomposition into ·OH, thereby enhancing the removal rate of methyl.

2.3. Impact of Different Types of Wastewater Applications

2.3.1. Degradation of Congo Red and Sulfamethoxazole by O3/H2O2 and O3/K2S2O8 Systems

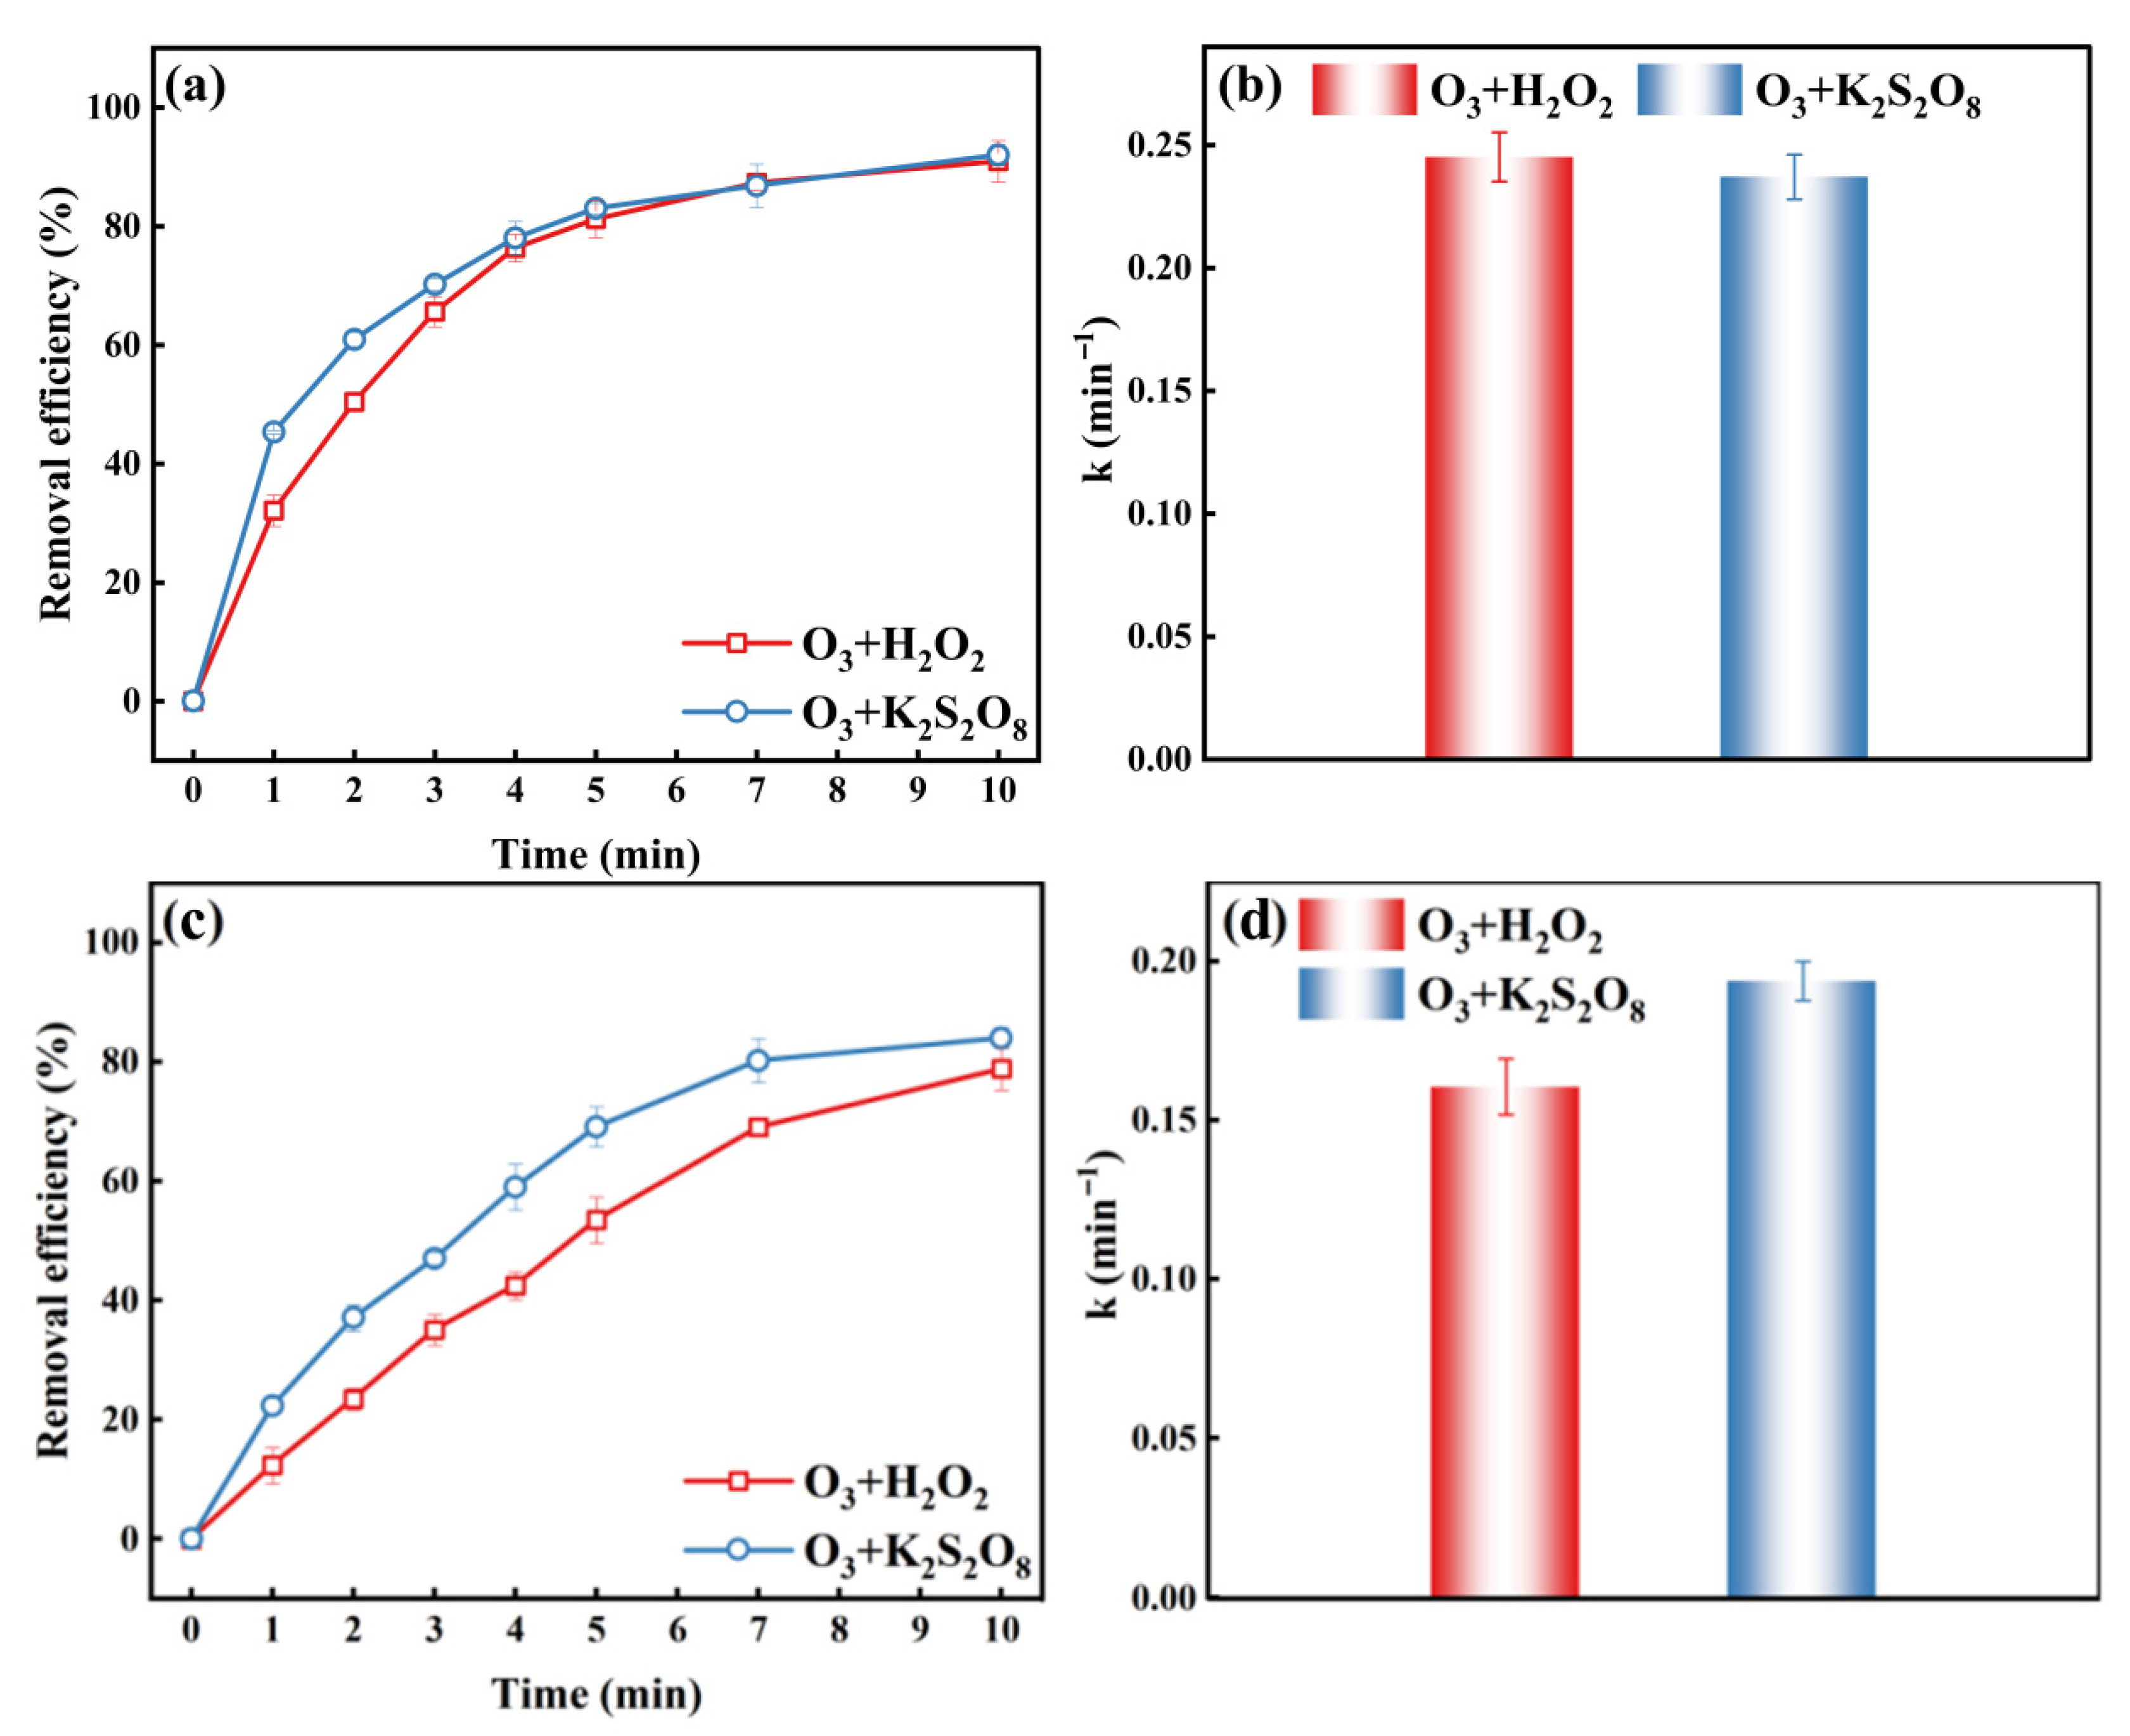
The degradation effects of O3, H2O2, and K2S2O8 on Congo red (CR) are shown in Figure 9a,b. During the initial phase of the reaction, the O3/K2S2O8 system demonstrated a higher removal rate, which can be attributed to the rapid generation of ·SO4- radicals. Ultimately, both systems reached comparable degradation efficiencies (92% for O3/K2S2O8 system vs. 90.9% for O3/H2O2 system). Further analysis of reaction rate constants revealed that the O3/H2O2 system exhibited a higher rate constant than O3/K2S2O8. Comparing this to MO degradation, as an azo dye, ·OH can rapidly cleave the azo bond to form small-molecule intermediates, while ·SO4- exhibits lower direct attack efficiency on the azo bond. For CR, which contains multiple fused aromatic rings and sulfonate groups, the electron transfer capability of ·SO4- can preferentially attack electron-rich aromatic rings, disrupting the conjugated system. Consequently, O3/K2S2O8 demonstrates superior degradation efficacy for CR [42].
The degradation effects of O3, H2O2, and K2S2O8 on sulfamethoxazole (SMX) are shown in Figure 9c,d. Under identical oxidant concentrations, the O3/K2S2O8 system demonstrated superior removal rate for CR, reaching 84%, while O3/H2O2 achieved 78.8% degradation. Analysis of reaction rate constants revealed that O3/K2S2O8 exhibited a higher rate constant than O3/H2O2. SMX possesses complex functional group structures, including sulfonyl (-SO2NH-), pyrimidine ring, and imidazole ring. The high oxidation potential of ·SO4- and its specificity toward electron-rich groups such as aromatic rings, amino groups, and sulfonic acid groups contribute to the superior removal rate of the O3/K2S2O8 system toward SMX.

2.3.2. O3/H2O2 and O3/K2S2O8 Systems for Degrading Natural Lake Water

To further evaluate the degradation performance of O3 and H2O2, as well as K2S2O8 systems in natural lake water, degradation tests were conducted under both oxidation systems using Xuanwu Lake water samples as the aquatic background, with all other conditions held constant.
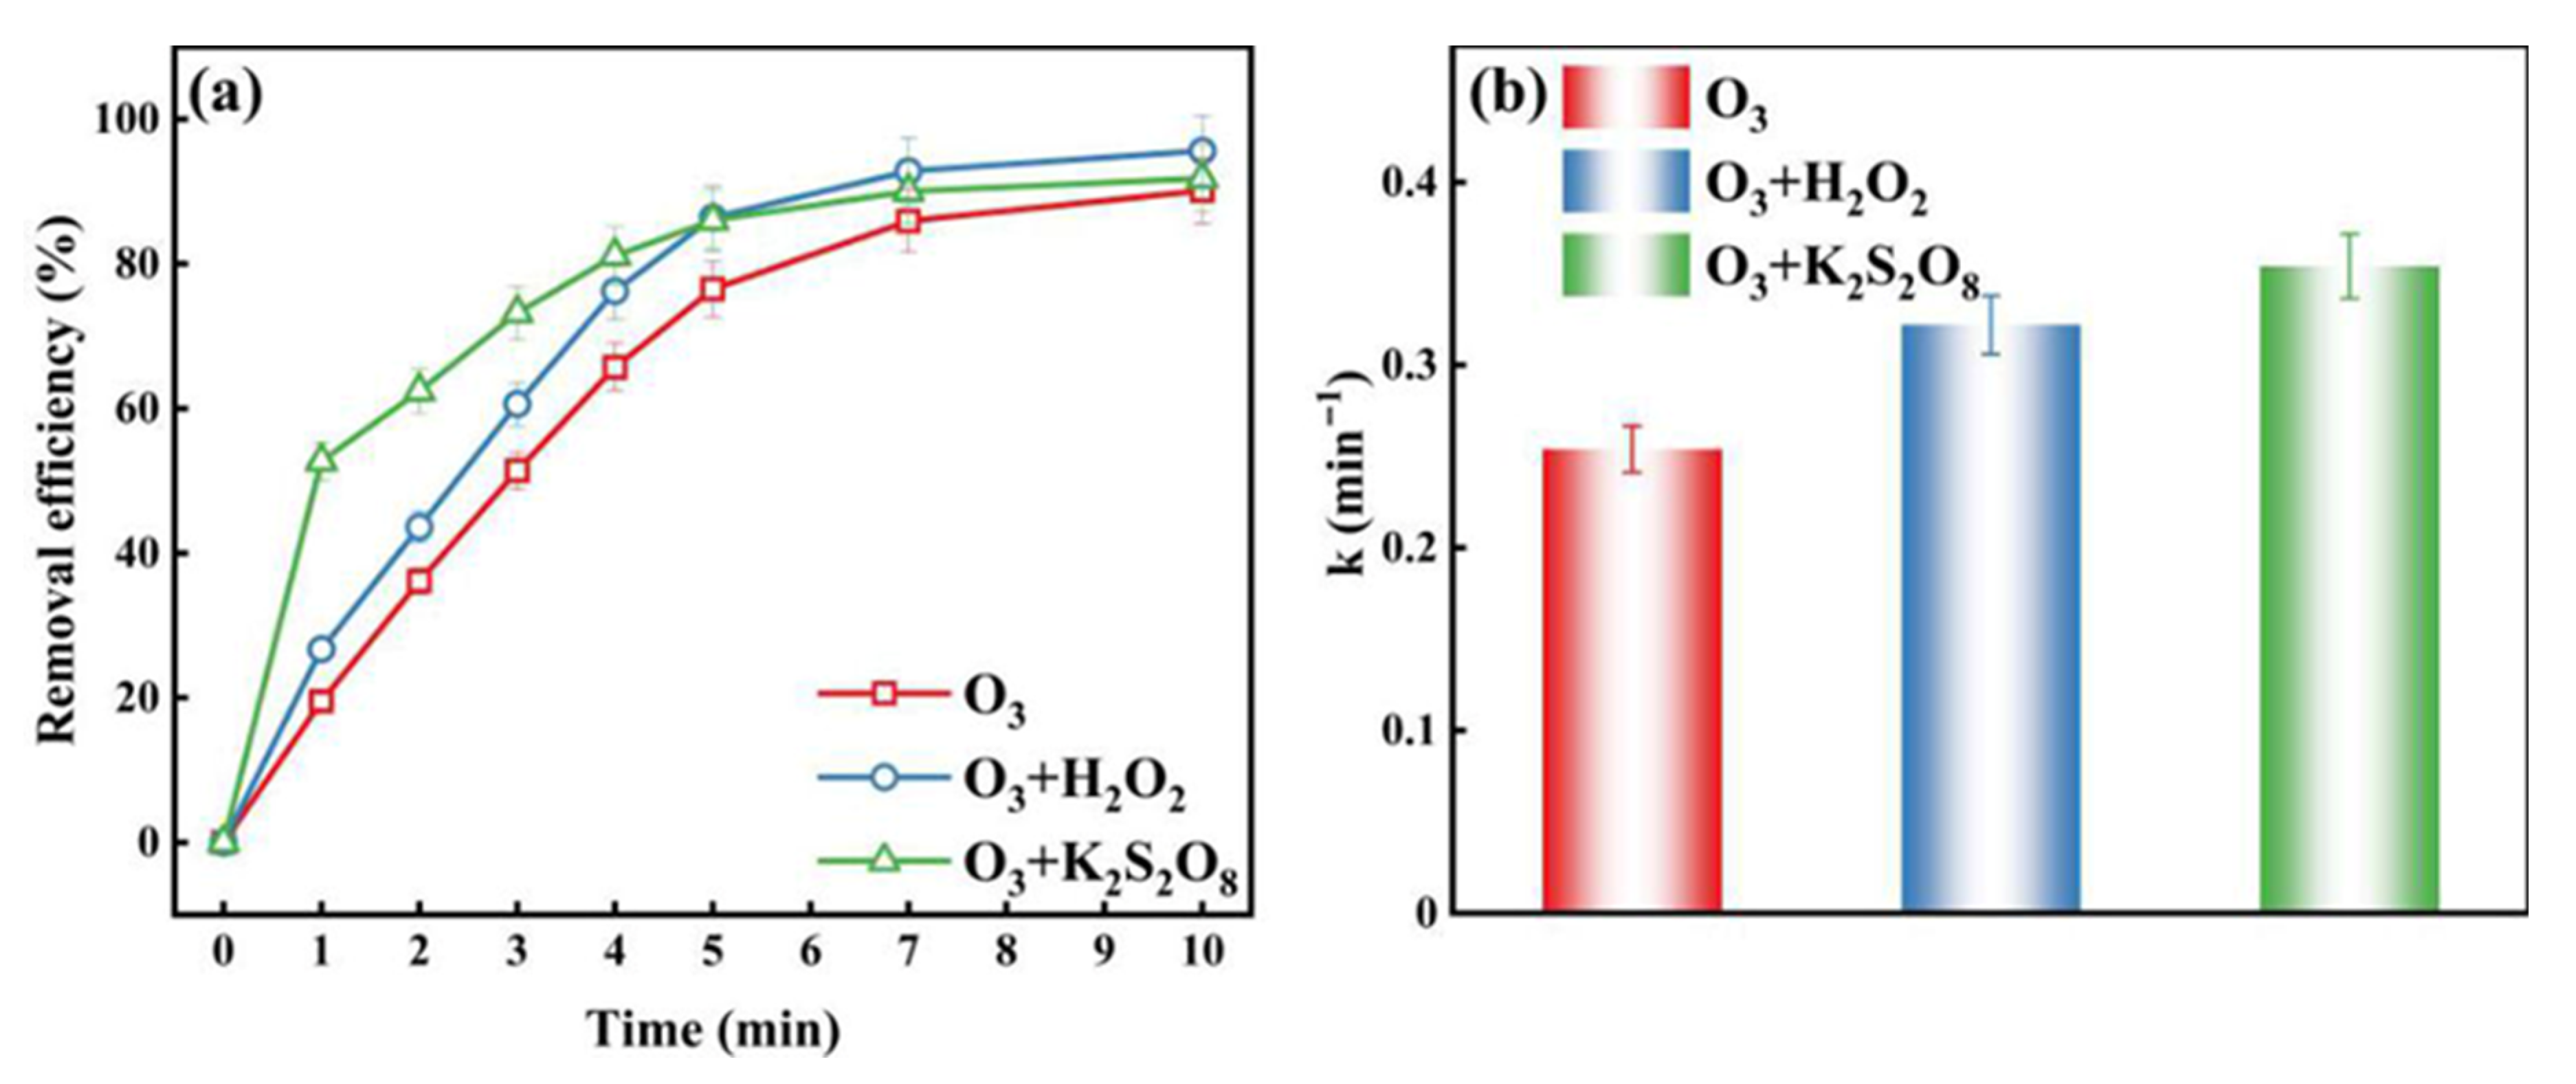
As shown in Figure 10, within 10 min, the O3/H2O2 system achieved a maximum removal rate of 95.6%, while the O3/K2S2O8 system achieved a maximum removal rate of 91.8%. However, within the first 5 min, the degradation performance of the O3/K2S2O8 system surpassed that of the O3/H2O2 system. This aligns with the previously discussed conclusion that the O3/K2S2O8 system exhibits stronger degradation performance in the short term. Analysis and comparison of the reaction rate constants for both degradation pathways reveal that the overall reaction rate of the O3/K2S2O8 system is significantly higher than that of the O3/H2O2 system. This is closely related to the rapid formation of ·SO4- within a short time frame upon reaction between K2S2O8 and O3. However, in practical applications, consideration must be given not only to degradation performance and removal rate but also to degradation cost. Although this research is still in the laboratory stage and the processing cost is higher than that of some popular technologies, its degradation mechanism has already shown great potential. Given that H2O2 is generally less expensive than K2S2O8 on a molar basis, and considering the comparable degradation effects observed in this study, the O3/H2O2 system suggests a potential economic advantage for future consideration. This, however, would need to be verified by a comprehensive cost analysis that includes operational energy consumption on a larger scale.

3. Experimental

3.1. Chemicals and Experimental Setup

Detailed information on reagents is shown in Table S3. All solutions were prepared with deionized water. The primary instruments and equipment utilized in the experiments are listed in Table S4. The liquid chromatograph and the ultraviolet spectrophotometer were employed for the detection of MO, CR, and SMX.

3.2. Experimental Setup

Figure S1 illustrates the diagram of the experimental setup, and is primarily consists of a power supply and a plasma reaction device.

3.3. Calculation and Analysis

The concentrations of the pollutants MO, CR, and SMX used in the experiment were measured using a UV spectrophotometer. The wavelengths employed were 464 nm, 496 nm, and 263 nm, respectively. The removal rate was calculated as follows (Equation (8)):
η = (C0 − Ct)/C0
where η is the organic removal rate, %; C0 is the initial concentration of the organic compound, mg/L; Ct is the concentration of the pollutant after treatment for t min, mg/L.
According to literature, the degradation of organic pollutants by O3 and ozonated water systems follows first-order kinetic models. Therefore, the degradation kinetics of organic pollutants were analyzed using a first-order kinetic model (Equation (9)):
k = ln(C0/Ct)
where C0 and Ct are defined before; k is the reaction rate constant, min−1. The standard curve for MO is shown in Figure S2.

4. Conclusions

This study provided a systematic, side-by-side comparison of O3/H2O2 and O3/K2S2O8 systems’ advanced oxidation processes for treating MO wastewater. By integrating performance evaluation, radical identification, intermediate analysis, and toxicity assessment under identical conditions, this work delivers a clearer mechanistic distinction and practical selection criteria between these two systems. To further investigate the treatment efficacy of O3/H2O2 and O3/K2S2O8 systems on different types of sewage and natural lake water, degradation studies were conducted on CR and SMX simulated wastewater, followed by the degradation of simulated natural lake water from Xuanwu Lake. The main conclusions are as follows. In the O3/H2O2 system, the optimal H2O2 concentration was 3.5 mmol/L, pH = 6.74 yielded the best degradation effect, achieving a maximum MO removal rate of 97.8 ± 2.4%. At these conditions, the reaction rate constant k was 0.398 min−1, 1.4 times that of the pure O3 system. Radical trapping experiments and ESR experiments indicated that both ·OH and ·O2- were active oxidizing species, with ·O2- being the primary strong oxidizing agent. Eleven intermediate products were identified via LC-MS, nine of which contained benzene rings. Following azo bond cleavage, these intermediates progressively mineralized into small-molecule acids. Toxicity assessment using T.E.S.T. software (Version 5.1) indicated that the bioconcentration factors and developmental toxicity of these nine intermediates were significantly lower than those of MO, demonstrating that the O3/H2O2 system effectively reduces environmental risks. In the O3/K2S2O8 system, the optimal K2S2O8 dosage was 1.1 mmol/L. With the highest removal rate at pH = 6.74, achieving a removal rate of 96.8 ± 2.4%. The reaction rate constant k at this point was 0.35, 1.23 times that under pure O3 conditions. Radical trapping and ESR experiments indicated that ·OH, ·SO4-, and ·O2- were all active oxidizing species, with ·SO4- and ·O2- being the primary strong oxidizing agents. Eight intermediate products were identified via LC-MS, with only one exhibiting an I/C ratio below 100. Toxicity assessments revealed significantly reduced bioaccumulation factors and developmental toxicity for six of these products. Compared to the O3/H2O2 system, the O3/K2S2O8 degradation yields fewer products with lower toxicity but incurs higher costs. Comparing the two systems revealed that during MO degradation, the O3/K2S2O8 system shows a higher removal rate due to rapid ·SO4- generation. Conversely, the O3/H2O2 system produced increasing amounts of ·OH over time, resulting in superior overall removal rate. Adaptability analysis for different pollutants indicates that free radicals in the O3/K2S2O8 system exhibit stronger attack capabilities on electron-rich groups, leading to superior degradation of CR and SMX, which contain polycyclic aromatic hydrocarbons. When treating natural lake water, the O3/H2O2 system demonstrated better final degradation performance. Considering also the lower cost of H2O2 compared to K2S2O8, the O3/H2O2 system presents a more favorable profile for potential scale-up based on the inherent cost of chemicals and effectiveness in a complex water matrix. However, a definitive assessment of its real-world applicability would require future pilot-scale testing and a detailed techno-economic analysis that includes energy consumption.

Supplementary Materials

The following supporting information can be downloaded at: https://www.mdpi.com/article/10.3390/catal15111057/s1, Figure S1: Experimental device diagram; Figure S2: Standard curve: MO solution; Table S1: The degradation intermediates of MO under the O3/H2O2 system were identified using liquid chromatography-mass spectrometry; Table S2: The degradation intermediates of MO under the O3/K2S2O8 system were identified using liquid chromatography-mass spectrometry; Table S3: Chemical reagent; Table S4: Experimental apparatus.

Author Contributions

Methodology, L.X. and S.Y.; Formal analysis, L.X.; Data curation, L.X.; Writing—original draft, L.X. and S.Y.; Project administration, H.G. All authors have read and agreed to the published version of the manuscript.

Funding

This research received no external funding.

Data Availability Statement

Data are contained within the article and Supplementary Materials.

Conflicts of Interest

The authors declare no conflicts of interest.

References

  1. Amaral-Silva, N.; Martins, R.C.; Catro-Silva, S.; Quinta-Ferreira, R.M. Ozonation and perozonation on the biodegradability improvement of a landfill leachate. J. Environ. Chem. Eng. 2016, 4, 527–533. [Google Scholar] [CrossRef]
  2. Park, J.; Pineda, M.; Peyot, M.; Yargeau, V. Degradation of oxytetracycline and doxycycline by ozonation: Degradation pathways and toxicity assessment. Sci. Total Environ. 2023, 856, 159076. [Google Scholar] [CrossRef] [PubMed]
  3. Issaka, E.; Amu-Darko, J.N.; Yakubu, S.; Fapohunda, F.O.; Ali, N.; Bilal, M. Advanced catalytic ozonation for degradation of pharmaceutical pollutants-A review. Chemosphere 2022, 289, 133208. [Google Scholar] [CrossRef] [PubMed]
  4. Esplugas, S.; Giménez, J.; Contreras, S.; Pascual, E.; Rodríguez, M. Comparison of different advanced oxidation processes for phenol degradation. Water Res. 2002, 36, 1034–1042. [Google Scholar] [CrossRef]
  5. Huang, N.; Wang, W.L.; Xu, Z.B.; Lee, M.Y.; Wu, Q.Y.; Hu, H.Y. A study of synergistic oxidation between ozone and chlorine on benzalkonium chloride degradation: Reactive species and degradation pathway. Chem. Eng. J. 2020, 382, 122856. [Google Scholar] [CrossRef]
  6. Wu, Q.Y.; Yang, Z.W.; Du, Y.; Ouyang, W.Y.; Wang, W.L. The promotions on radical formation and micropollutant degradation by the synergies between ozone and chemical reagents (synergistic ozonation): A review. J. Hazard. Mater. 2021, 418, 126327. [Google Scholar] [CrossRef]
  7. Padmanabhan, V.; Song, W.H.; Puttabyatappa, M. Praegnatio Perturbatio-Impact of Endocrine-Disrupting Chemicals. Endocr. Rev. 2021, 42, 295–353. [Google Scholar] [CrossRef]
  8. Hong, Y.; Feng, C.L.; Yan, Z.F.; Wang, Y.; Liu, D.Q.; Liao, W.; Bai, Y. Nonylphenol occurrence, distribution, toxicity and analytical methods in freshwater. Environ. Chem. Lett. 2020, 18, 2095–2106. [Google Scholar] [CrossRef]
  9. Bello, M.M.; Raman, A.A.A.; Asghar, A. A review on approaches for addressing the limitations of Fenton oxidation for recalcitrant wastewater treatment. Process Saf. Environ. Prot. 2019, 126, 119–140. [Google Scholar] [CrossRef]
  10. Wang, J.L.; Wang, S.Z. Activation of persulfate (PS) and peroxymonosulfate (PMS) and application for the degradation of emerging contaminants. Chem. Eng. J. 2022, 334, 1504–1521. [Google Scholar] [CrossRef]
  11. Droguett, C.; Salazar, R.; Brillas, E.; Sirés, I.; Carlos, C.; Marco, J.F.; Thiam, A. Treatment of antibiotic cephalexin by heterogeneous electrochemical Fenton-based processes using chalcopyrite as sustainable catalyst. Sci. Total Environ. 2020, 740, 140154. [Google Scholar] [CrossRef] [PubMed]
  12. Fu, L.; Wu, C.Y.; Zhou, Y.X.; Zou, J.N.; Song, G.Q.; Tan, Y. Ozonation reactivity characteristics of dissolved organic matter in secondary petrochemical wastewater by single ozone, ozone/H2O2 and ozone/catalyst. Chemosphere 2019, 233, 34–43. [Google Scholar] [CrossRef]
  13. Li, C.H.; Jiang, F.; Sun, D.Z.; Qiu, B. Catalytic ozonation for advanced treatment of incineration leachate using (MnO2-Co3O4)/AC as a catalyst. Chem. Eng. J. 2017, 325, 624–631. [Google Scholar] [CrossRef]
  14. Sani, S.; Dashti, A.F.; Adnan, R. Applications of Fenton oxidation processes for decontamination of palm oil mill effluent: A review. Arab. J. Chem. 2020, 13, 7302–7323. [Google Scholar] [CrossRef]
  15. Staehelin, J.; Hoigné, J. Decomposition of ozone in water: Rate of initiation by hydroxide ions and hydrogen peroxide. Environ. Sci. Technol. 1982, 16, 676. [Google Scholar] [CrossRef]
  16. Nöthe, T.; Fahlenkamp, H.; Sonntag, C.V. Ozonation of wastewater: Rate of ozone consumption and hydroxyl radical yield. Environ. Sci. Technol. 2009, 43, 5990. [Google Scholar] [CrossRef] [PubMed]
  17. Mérenyi, G.; Lind, J.; Naumov, S.; Sonntag, C.V. Reaction of ozone with hydrogen peroxide (peroxone process): A revision of current mechanistic concepts based on thermokinetic and quantum-chemical considerations. Environ. Sci. Technol. 2010, 44, 3505. [Google Scholar] [CrossRef]
  18. Fischbacher, A.; Sonntag, J.V.; Sonntag, C.V.; Schmidt, T.C. The (•)OH radical yield in the H2O2 + O3 (peroxone) reaction. Environ. Sci. Technol. 2013, 47, 9959. [Google Scholar] [CrossRef] [PubMed]
  19. Chen, L. Effects of factors and interacted factors on the optimal decolorization process of methyl orange by ozone. Water Res. 2000, 34, 974. [Google Scholar] [CrossRef]
  20. Dong, J.; Yao, J.; Tao, J.; Shi, X.; Wei, F. Degradation of Methyl Orange by ozone microbubble process with packing in the bubble column reactor. Environ. Sci. Technol. 2022, 44, 2512. [Google Scholar] [CrossRef]
  21. Xia, X.; Zhu, S.; Liu, J.; Zhou, R. A Review Study on Sulfate-Radical-Based Advanced Oxidation Processes for Domestic/Industrial Wastewater Treatment: Degradation, Efficiency and Mechanism. Front. Chem. 2020, 8, 592056. [Google Scholar] [CrossRef]
  22. Razali, N.A.; Abidin, C.Z.A.; An, O.S.; Ridwan, F.M.; Ibrahim, A.H.; Sabri, S.N.; Kow, S.H. Preliminary screening: Oxidative degradation of methyl orange using ozonation/persulfate. E3S Web Conf. 2018, 34, 02038. [Google Scholar]
  23. CCTE; EPA. Toxicity Estimation Software Tool (TEST); The United States Environmental Protection Agency’s Center for Computational Toxicology and Exposure: Triangle Park, NC, USA, 2022. [CrossRef]
  24. Du, X.D.; Oturan, M.A.; Zhou, M.H.; Belkessa, N.; Su, P.; Cai, J.J.; Trellu, C.; Mousset, E. Nanostructured electrodes for electrocatalytic advanced oxidation processes: From materials preparation to mechanisms understanding and wastewater treatment applications. Appl. Catal. B 2021, 296, 120332. [Google Scholar] [CrossRef]
  25. Qu, C.; Soomro, G.S.; Ren, N.; Liang, D.W.; Lu, S.F.; Xiang, Y.; Zhang, S.J. Enhanced electro-oxidation/peroxone (in situ) process with a Ti-based nickel-antimony doped tin oxide anode for phenol degradation. J. Hazard. Mater. 2020, 384, 121398. [Google Scholar] [CrossRef]
  26. Zhao, Y.Q.; Ji, J.; Wu, Y.; Chen, S.Q.; Xu, M.Y.; Cao, X.; Liu, H.L.; Wang, Z.; Bi, H.Y.; Guan, G.A.; et al. Nonylphenol and its derivatives: Environmental distribution, treatment strategy, management and future perspectives. Chemosphere 2024, 352, 141377. [Google Scholar] [CrossRef] [PubMed]
  27. Li, H.; Yang, Y.L.; Ren, J.W.; Zhou, Z.W.; Li, X.; Liu, Y.K.; Feng, J.Y. Fate of organic fractions of greywater in combined process of vacuum-ultraviolet (VUV/UV)/ozone pre-oxidation with enhanced coagulation. J. Environ. Chem. Eng. 2022, 10, 107417. [Google Scholar] [CrossRef]
  28. Wang, J.; Liu, H.B.; Ma, D.F.; Wang, Y.; Yao, G.P.; Yue, Q.Y.; Gao, B.Y.; Wang, S.E.; Xu, X. Degradation of organic pollutants by ultraviolet/ozone in high salinity condition: Non-radical pathway dominated by singlet oxygen. Chemosphere 2021, 268, 128796. [Google Scholar] [CrossRef] [PubMed]
  29. Zhou, Y.X.; Yan, T.; Pan, W.G. Study on the sorption mechanism of middle-low temperature sorption thermal storage materials from the microscale simulation: A review. Int. J. Energy Res. 2021, 45, 9719–9752. [Google Scholar] [CrossRef]
  30. Peng, Y.; Bin, Z.Y.; Wang, F.; Li, S.L.; Xu, S.W.; Wang, H. Electrocatalytic degradation of p-nitrophenol on metal-free cathode: Superoxide radical (O2•−) production via molecular oxygen activation. J. Hazard. Mater. 2023, 462, 132797. [Google Scholar] [CrossRef]
  31. Rodriguez-Peta, M.; Perez, J.A.B.; Llanos, J.; Saez, C.; Barrera-Díaz, C.E.; Rodrigo, M.A. Electrochemical generation of ozone using a PEM electrolyzer at acidic pHs. Sep. Purif. Technol. 2021, 267, 118672. [Google Scholar] [CrossRef]
  32. Boudissa, F.; Mirilà, D.; Arus, V.; Terkmani, T.; Semaan, S.; Proulx, M.; Nistor, I.; Roy, R.; Azzouz, A. Acid-treated clay catalysts for organic dye ozonation—Thorough mineralization through optimum catalyst basicity and hydrophilic character. J. Hazard. Mater. 2019, 364, 356–366. [Google Scholar] [CrossRef]
  33. Ge, D.; Zeng, Z.Q.; Arowo, M.; Zou, H.K.; Chen, J.F.; Shao, L. Degradation of methyl orange by ozone in the presence of ferrous and persulfate ions in a rotating packed bed. Chemosphere 2016, 146, 413–418. [Google Scholar] [CrossRef]
  34. Amado-Pina, D.; Roa-Morales, G.; Molina-Mendieta, M.; Balderas-Hernández, P.; Romero, R.; Barrera-Díaz, C.E.; Natividad, R. E-peroxone process of a chlorinated compound: Oxidant species, degradation pathway and phytotoxicity. J. Environ. Chem. Eng. 2022, 10, 108148. [Google Scholar] [CrossRef]
  35. Wang, J.J.; Bai, R.B. Formic acid enhanced effective degradation of methyl orange dye in aqueous solutions under UV–Vis irradiation. Water Res. 2016, 101, 103–113. [Google Scholar] [CrossRef]
  36. Zhang, H.; Duan, L.J.; Zhang, D.B. Decolorization of methyl orange by ozonation in combination with ultrasonic irradiation. J. Hazard. Mater. 2006, 138, 53–59. [Google Scholar] [CrossRef]
  37. Gao, Y.; Wang, O.; Ji, G.Z.; Li, A. Degradation of antibiotic pollutants by persulfate activated with various carbon materials. Chem. Eng. J. 2022, 429, 132387. [Google Scholar] [CrossRef]
  38. Chen, S.X.; Huang, Y.F.; Han, X.X.; Wu, Z.L.; Lai, C.; Wang, J.; Deng, Q.; Zeng, Z.L.; Deng, S.G. Simultaneous and efficient removal of Cr(VI) and methyl orange on LDHs decorated porous carbons. Chem. Eng. J. 2018, 352, 306–315. [Google Scholar] [CrossRef]
  39. Zhang, Y.Z.; Sun, B.Y.; Deng, S.H.; Wang, Y.J.; Peng, H.; Li, Y.W.; Zhang, X.H. Methyl orange degradation by pulsed discharge in the presence of activated carbon fibers. Chem. Eng. J. 2010, 159, 47–52. [Google Scholar] [CrossRef]
  40. Ma, Y.H.; Chen, F.; Yang, Q.; Zhong, Y.; Shu, X.Y.; Yao, F.B.; Xie, T.; Li, X.M.; Wang, D.B.; Zeng, G.M. Sulfate radical induced degradation of Methyl Violet azo dye with CuFe layered doubled hydroxide as heterogeneous photoactivator of persulfate. J. Environ. Manag. 2018, 227, 406–414. [Google Scholar] [CrossRef]
  41. Li, S.; Yang, Y.L.; Zhang, H.S.; Zheng, Y.J.; Jing, T.; Ma, J.; Nan, J.; Leong, Y.K.; Chang, J.S. Advanced oxidation process based on hydroxyl and sulfate radicals to degrade refractory organic pollutants in landfill leachate. Chemosphere 2022, 297, 134214. [Google Scholar] [CrossRef] [PubMed]
  42. Ma, C.; Yuan, P.F.; Jia, S.Y.; Liu, Y.Q.; Zhang, X.J.; Huo, S.; Zhang, H.X.; He, Z.G. Catalytic micro-ozonation by Fe3O4 nanoparticles @cow-dung ash for advanced treatment of biologically pre-treated leachate. Waste Manag. 2019, 83, 23–32. [Google Scholar] [CrossRef] [PubMed]
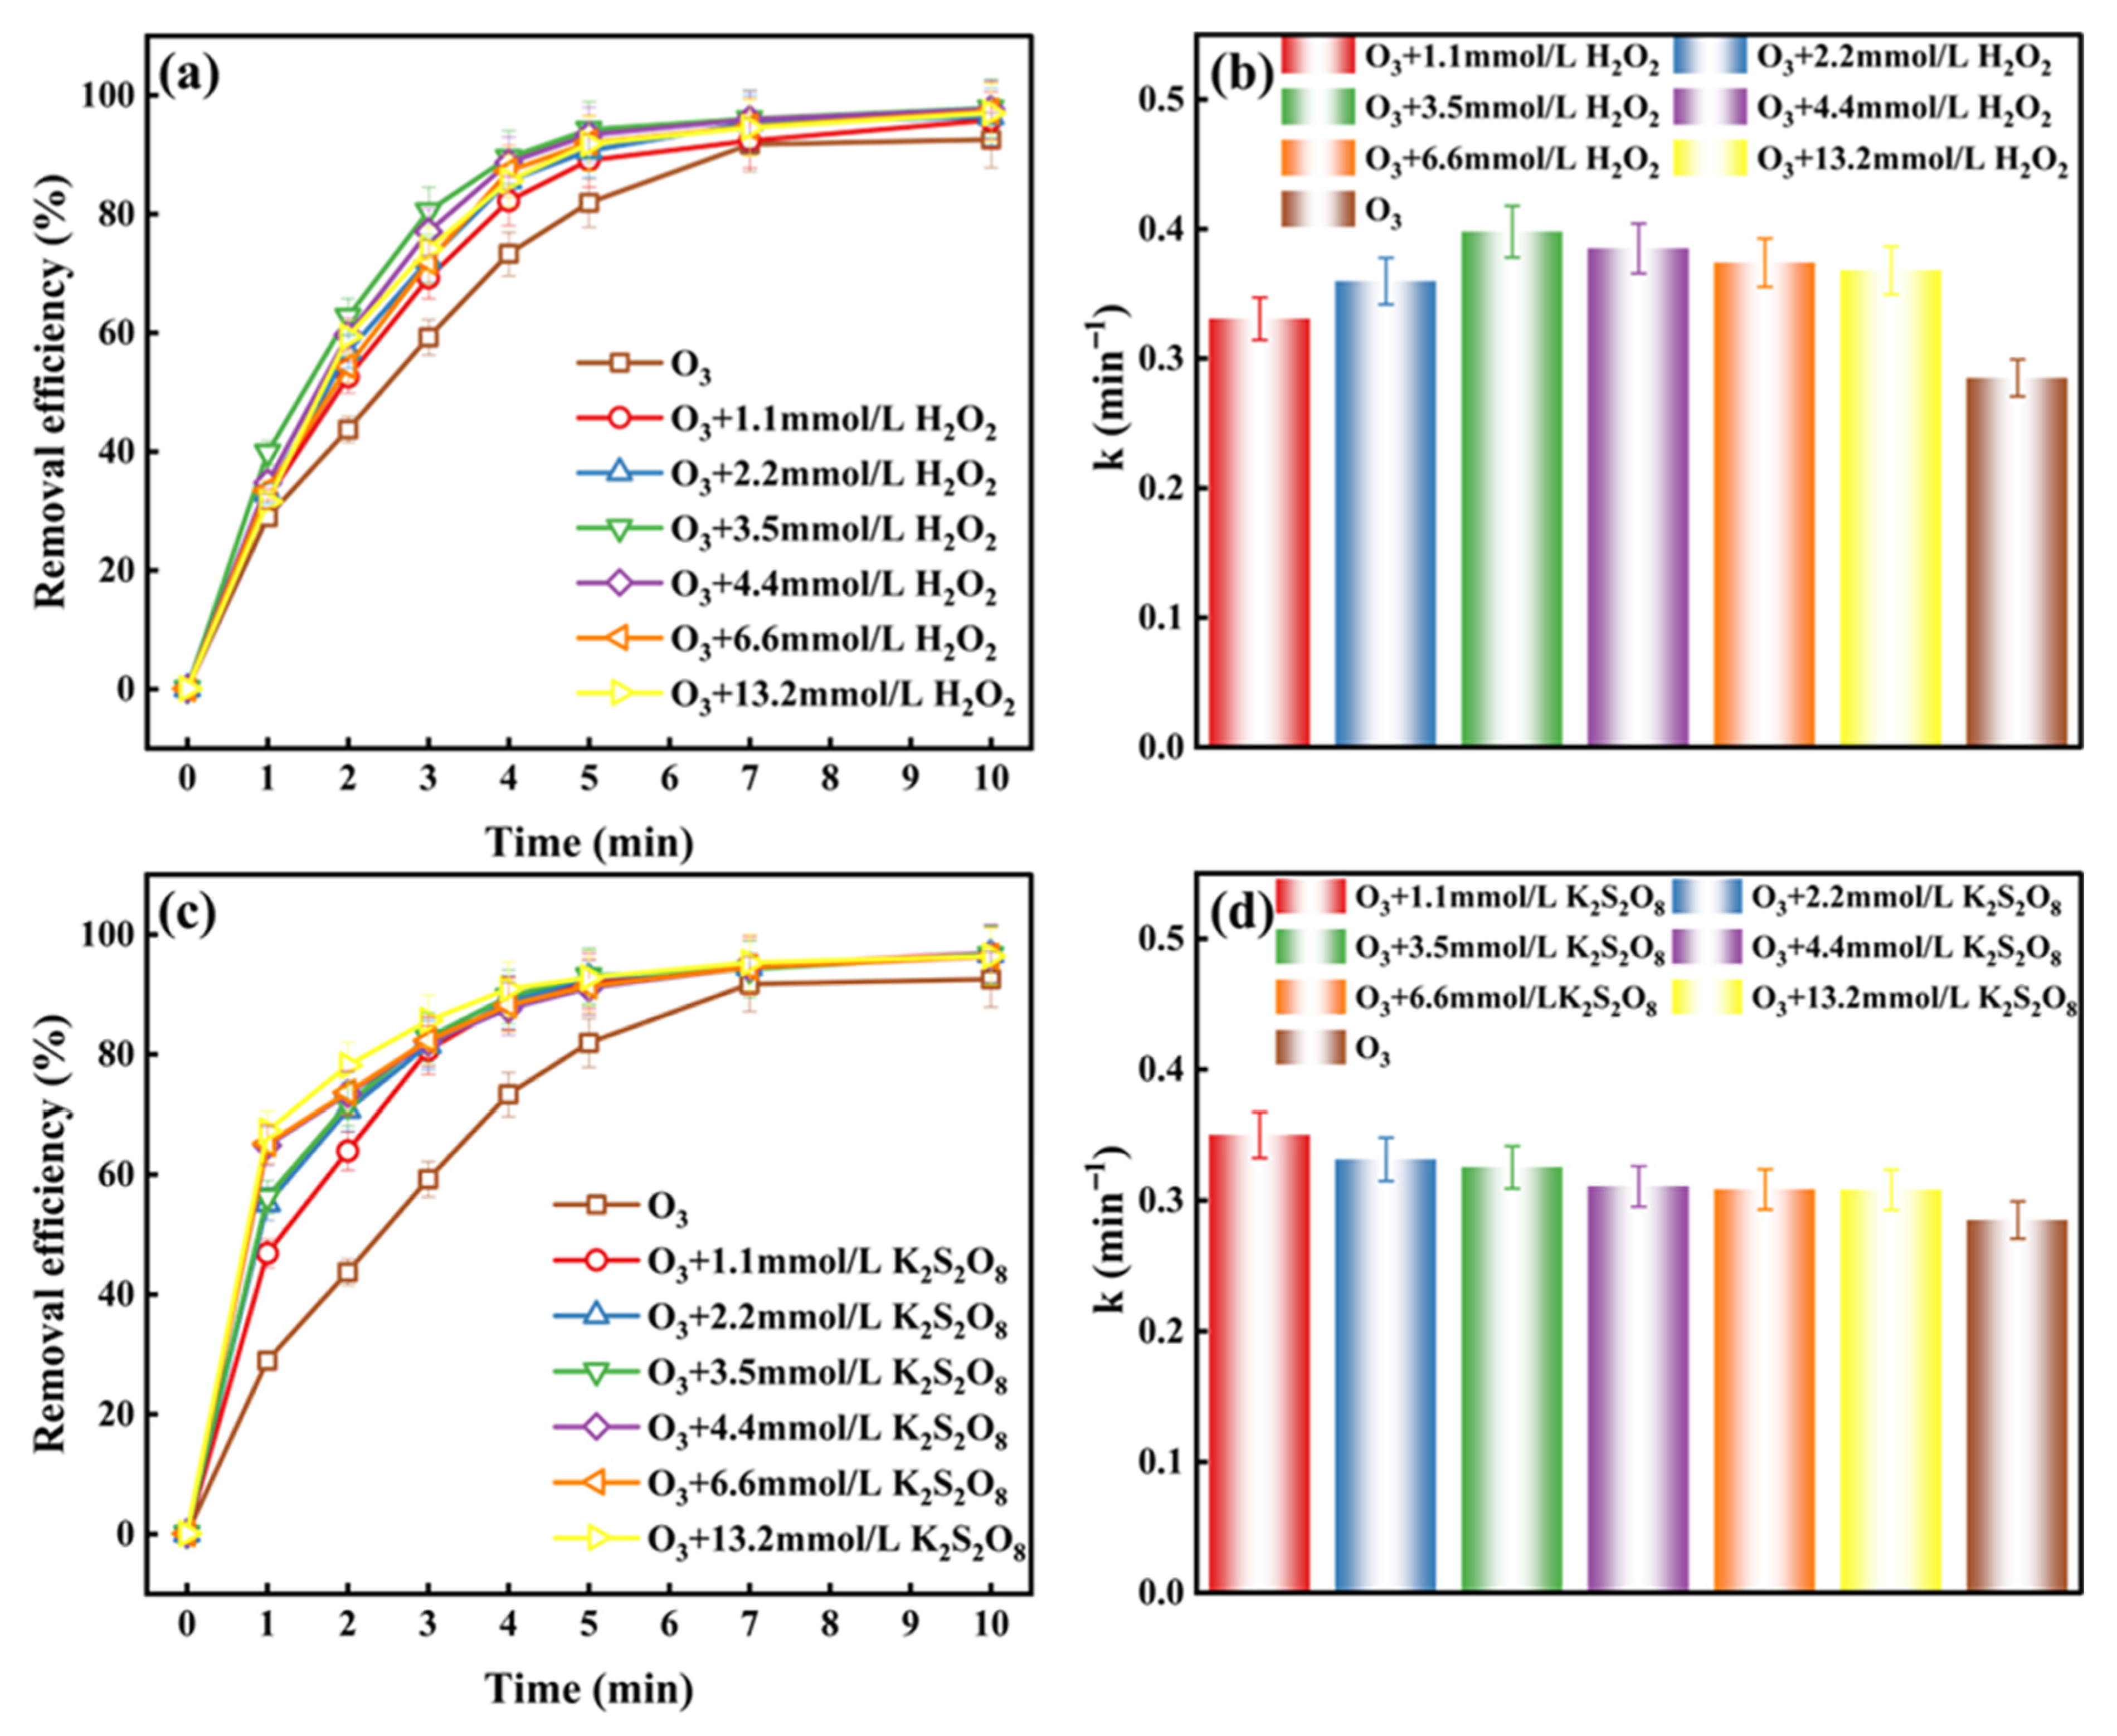
Figure 1. (a) Response time curve at different H2O2 concentrations; (b) response rate constant at different H2O2 concentrations; (c) response time curve at different K2S2O8 concentrations; (d) response rate constant at different K2S2O8 concentrations (ozone flow rate: 1 L/min; volume of the treated solution: 200 mL; the addition concentration of MO: 100 mg/L).
Catalysts 15 01057 g001
Figure 2. (a) Different initial pH reaction time curves and (b) different initial pH reaction rate constants in O3/H2O2 system; (c) different initial pH reaction time curves and (d) different initial pH reaction rate constants in O3/K2S2O8 system (ozone flow rate: 1 L/min; volume of the treated solution: 200 mL; the addition concentration of MO: 100 mg/L; the addition concentration of H2O2 in O3/H2O2 system: 3.5 mmol/L; the addition concentration of K2O2S8 in O3/K2O2S8 system: 3.5 mmol/L).
Catalysts 15 01057 g002
Figure 3. Effects of IPA: (a) removal rate, (b) kinetic constant; and BQ: (c) removal rate, (d) kinetic constant (ozone flow rate: 1 L/min; volume of the treated solution: 200 mL; the addition concentration of MO: 100 mg/L; the addition concentration of H2O2: 3.5 mmol/L).
Catalysts 15 01057 g003
Figure 4. Effects of IPA: (a) removal rate, (b) kinetic constant; BQ: (c) removal rate, (d) kinetic constant; and NaNO2: (e) removal rate, (f) kinetic constant (ozone flow rate: 1 L/min; volume of the treated solution: 200 mL; the addition concentration of MO: 100 mg/L; the addition concentration of K2O2S8: 3.5 mmol/L).
Catalysts 15 01057 g004
Figure 5. ESR spectra of active free radicals: (a) ·OH, (b) ·O2- in O3/H2O2 system; ESR spectra of active free radicals: (c) ·OH and ·SO4-, (d) ·O2- in O3/K2S2O8 system (ozone flow rate: 1 L/min; volume of the treated solution: 200 mL; the addition concentration of MO: 100 mg/L; the addition concentration of H2O2 in O3/H2O2 system: 3.5 mmol/L; the addition concentration of K2O2S8 in O3/K2O2S8 system: 3.5 mmol/L).
Catalysts 15 01057 g005
Figure 6. Degradation pathway of (a) O3/H2O2 and (b) O3/K2S2O8 system.
Catalysts 15 01057 g006
Figure 7. Toxicity assessment of O3/H2O2 system: (a) bioaccumulation factor, (b) developmental toxicity; and O3/K2S2O8 system: (c) bioaccumulation factor, (d) developmental toxicity.
Catalysts 15 01057 g007
Figure 8. Reaction time curves of O3 with H2O2 and K2S2O8 at the same concentration for MO: (a) 1.1 mmol/L, (b) 2.2 mmol/L, (c) 3.5 mmol/L, (d) 4.4 mmol/L, (e) 6.6 mmol/L, (f) 13.2 mmol/L (ozone flow rate: 1 L/min; volume of the treated solution: 200 mL; the addition concentration of MO: 100 mg/L).
Catalysts 15 01057 g008
Figure 9. (a) Degradation curve and (b) reaction rate constant of CR (ozone flow rate: 1 L/min; volume of the treated solution: 200 mL; the addition concentration of CR: 100 mg/L; the addition concentration of H2O2 in O3/H2O2 system: 3.5 mmol/L; the addition concentration of K2O2S8 in O3/K2O2S8 system: 3.5 mmol/L); (c) degradation curve of SMX and (d) reaction rate constant of SMX (ozone flow rate: 1 L/min; volume of the treated solution: 200 mL; the addition concentration of SMX: 100 mg/L; the addition concentration of H2O2 in O3/H2O2 system: 3.5 mmol/L; the addition concentration of K2O2S8 in O3/K2O2S8 system: 3.5 mmol/L).
Catalysts 15 01057 g009
Figure 10. (a) Degradation of natural lake water reaction time curve in Xuanwu Lake; (b) the reaction rate constant of degradation of natural lake water in Xuanwu Lake was determined (ozone flow rate: 1 L/min; volume of the treated solution: 200 mL; the addition concentration of MO: 100 mg/L; the addition concentration of H2O2 in O3/H2O2 system: 3.5 mmol/L; the addition concentration of K2O2S8 in O3/K2O2S8 system: 3.5 mmol/L).
Catalysts 15 01057 g010
Disclaimer/Publisher’s Note: The statements, opinions and data contained in all publications are solely those of the individual author(s) and contributor(s) and not of MDPI and/or the editor(s). MDPI and/or the editor(s) disclaim responsibility for any injury to people or property resulting from any ideas, methods, instructions or products referred to in the content.