Article

Highly Efficient PtSn/Al2O3 and PtSnZnCa/Al2O3 Catalysts for Ethane Dehydrogenation: Influence of Catalyst Pretreatment Atmosphere

by
Seetharamulu Podila
*,
Abdulrahim A. Al-Zahrani
,
Muhammad A. Daous
and
Hesham Alhumade
Chemical and Materials Engineering Department, Faculty of Engineering, King Abdulaziz University, P.O. Box 80204, Jeddah 21589, Saudi Arabia
*
Author to whom correspondence should be addressed.
Catalysts 2024, 14(5), 312; https://doi.org/10.3390/catal14050312
Submission received: 9 April 2024 / Revised: 28 April 2024 / Accepted: 7 May 2024 / Published: 9 May 2024

Abstract

:
Increased demand for ethylene has motivated direct ethane dehydrogenation over Pt-based catalysts. PtSn/γ-Al2O3 and PtSnZnCa/γ-Al2O3 catalysts were investigated with the aim of understanding the effect of the pretreatment environment on the state of dispersed Pt for ethane dehydrogenation. The catalysts were prepared by the impregnation method and pretreated in different environments like static air (SA), flowing air (FA), and nitrogen (N2) atmospheres. A comprehensive characterization of the catalysts was performed using Brunauer–Emmett–Teller (BET), X-ray diffraction (XRD), Temperature-Programmed Reduction (TPR), NH3 Temperature-Programmed Desorption (NH3-TPD), X-ray photoelectron spectroscopy (XPS), and Transmission Electron Microscopy (TEM) techniques. The results reveal that the PtSn on Al2O3 catalyst pretreated in the static air environment (PtSn-SA) exhibits 21% ethylene yield with 95% selectivity at 625 °C. XPS analysis found more platinum and tin on the catalyst surface after static air treatment. The overall acidity of the catalysts decreased after thermal treatment in static air. Elemental mapping demonstrated that Pt agglomeration was pronounced in catalysts calcined under flowing air and nitrogen. These factors are responsible for the enhanced activity of the PtSn-SA catalyst compared to the other catalysts. The addition of Zn and Ca to the PtSn catalysts increases the yield of the catalyst calcined in static air (PtSnZnCa-SA). The PtSnZnCa-SA catalyst showed the highest ethylene yield of 27% with 99% selectivity and highly stable activity at 625 °C for 10 h.

1. Introduction

Ethylene is a versatile chemical that is used as the starting material for many other chemicals, such as polyethylene, ethylbenzene rubber, ethylene oxide, etc. Steam cracking is the most widely used process for ethylene production, but it is an energy-intensive reaction and requires high temperatures. This route follows undesired side reactions and severe coke formation. Specifically, this route contributes CO2 and NOx emissions. Thus, an alternative and eco-friendly process for ethylene production is needed. The surge in ethane supply resulting from the shale gas revolution has made direct dehydrogenation of ethane a promising route for ethylene production [1,2,3].
Many metals have been tested for ethane dehydrogenation; among them, Cr-, Pt-, Fe-, and Co-containing systems are common catalysts [4,5,6,7,8]. Chromium catalysts are a cost-effective option for the non-oxidative dehydrogenation of ethane, but they are susceptible to early deactivation [9]. Pt-based catalysts are more promising for direct dehydrogenation than all other catalysts [7,10]. They exhibit stability at elevated temperatures (>600 °C), which is essential for overcoming the unfavorable Gibbs free energy associated with direct dehydrogenation of ethane.
However, platinum has low selectivity for ethylene and tends to deep ethane dehydrogenation, which eventually leads to coke deposition and catalyst deactivation. Deep dehydrogenation, encompassing hydrogenolysis and coking, is a structure-sensitive process demanding substantial Pt ensembles, whereas ethane dehydrogenation, being structure-insensitive, can be catalyzed by small Pt ensembles. Disappointingly, the supported Pt invariably undergoes sintering during ethane dehydrogenation (EDH), resulting in a misconception regarding the impact of Pt particle structure on reaction performance.
Hence, the stability of the supported Pt active phase structure is crucial for discovering the activity and stability of the ethane dehydrogenation (EDH) reaction at higher temperatures. The addition of promoter metals, like Sn, In, Ga, Ir, Cu, or Au, to Pt-based catalysts has been shown to increase selectivity by stabilizing Pt particles [11,12,13,14,15,16,17,18]. The addition of promoter metals like tin to platinum weakens the bond between the ethene and the catalyst surface. This makes it easier for the product to desorb from the catalyst surface more easily than from pure platinum (Pt) [19,20]. On the other hand, the addition of Zn to a Pt-based catalyst increased the lifetime of the catalyst [1].
According to the literature, it was demonstrated that acidic supports, such as Al2O3 and MFI zeolites, aided in the dispersion and stabilization of the active metal phase for the ethane dehydrogenation (EDH) catalyst. However, the acid function of the supports simultaneously catalyzed undesired reactions such as polymerization and coking [21,22].
Researchers also studied the addition of alkali or alkali earth metal to the Pt-based catalyst to overcome the coke formation problem [23,24]. Among these promoters, the calcium (Ca) addition improves the catalyst performance. Long et al. [25] studied the addition of calcium (Ca) to PtSnIn on γ-Al2O3 for propane dehydrogenation. The author reported that with the addition of Ca to γ-Al2O3, the catalyst stability increased, and the acidity decreased.
The ethane dehydrogenation reaction is an endothermic reaction. Most ethane dehydrogenation studies have been conducted at low temperatures (550–600 °C) to achieve high selectivity and avoid coke formation. However, the low temperatures result in low conversions due to thermodynamic constraints. High temperatures allow for higher conversions of ethane to ethylene but increase the risk of coke formation. There is a trade-off between conversion and stability, so it is necessary to balance the conversion and stability of the ethane dehydrogenation reaction. The goal of this research is to create a highly efficient catalyst for ethane dehydrogenation at high temperatures (625 °C). We synthesized PtSn/Al2O3 and subsequently examined the influence of the catalyst pretreatment environment on its activity and properties at a reaction temperature of 625 °C. We also investigated the promoter effect of Zn and Ca addition to PtSn/Al2O3 catalysts and studied the catalyst pretreatment effect. Improved yield and stability were obtained with PtSnZnCa/Al2O3 for ethane dehydrogenation. Numerous advanced analytical methods, such as X-ray diffraction (XRD), Brunauer–Emmett–Teller (BET) analysis, temperature-programmed desorption of ammonia (NH3-TPD), transmission electron microscopy (TEM), hydrogen temperature-programmed reduction (H2-TPR), and X-ray photoelectron spectroscopy (XPS), were employed to investigate how the pretreatment of the catalyst influences its catalytic characteristics.

2. Results and Discussion

2.1. Surface Area Studies

Table 1 shows the BET surface areas of the calcined support and Pt catalysts measured by nitrogen physisorption. The calcined γ-alumina support showed 186.7 m2/g specific surface area. The physisorption isotherm and pore distribution of pure Al2O3 are presented in Figure S1. Introducing Pt and Sn to the support and performing calcination under different atmospheres induces a slight change in the textural properties of PtSn catalysts compared to their pure support. The catalyst calcined in a non-oxidizing atmosphere, i.e., in nitrogen, showed a higher surface area than the catalyst calcined in flowing air and static air. The physisorption isotherms of all catalysts calcined in different atmospheric conditions are similar (Figure 1). All catalysts exhibited a type IV isotherm with H3-type hysteresis, reminiscent of the types of their support material, Al2O3.
The pore-size distribution is also observed similar for all catalysts. The pores are distributed in 5–10 nm size range (Figure S2). The surface area outcomes of spent catalysts are presented in Table S1. The spent PtSn-SA catalyst showed an increased surface area compared to that of the calcined catalyst. On the other hand, the surface areas of PtSn-N2 and PtSn-FA catalysts area decreased. This might be due to slight coke formation in the case of PtSn-SA, which creates more pores in spent catalysts and agglomeration of metal particles in PtSn-N2 and PtSn-FA either during reduction or during reaction.
The PtSnZnCa catalysts showed slightly higher surface areas than the PtSn catalysts. The adapted preparation method might be the reason for higher surface areas. It is noteworthy that there is minimal disparity in surface area values between the PtSnCaZn-N2 and PtSn-N2 catalysts.
The PtSnZnCa catalysts showed a similar type of isotherm and pore size distribution as that of the PtSn catalysts (Figure 1 and Figure S2). The surface area values of the used PtSnZnCa catalysts calcined in different atmospheric conditions are presented in Table S1. The used PtSnZnCa-N2 and PtSnZnCa-FA catalysts showed higher surface area values compared to that of its calcined catalysts. On the other hand, PtSnZnCa-SA showed a lower surface area value than that of its calcined catalyst. The results indicate that coke might have formed after the reaction in the PtSnZnCa-N2 and PtSnZnCa-FA catalysts. Whereas the surface area decrease in PtSnZnCa-SA is due to slight agglomeration during the reaction.

2.2. XRD

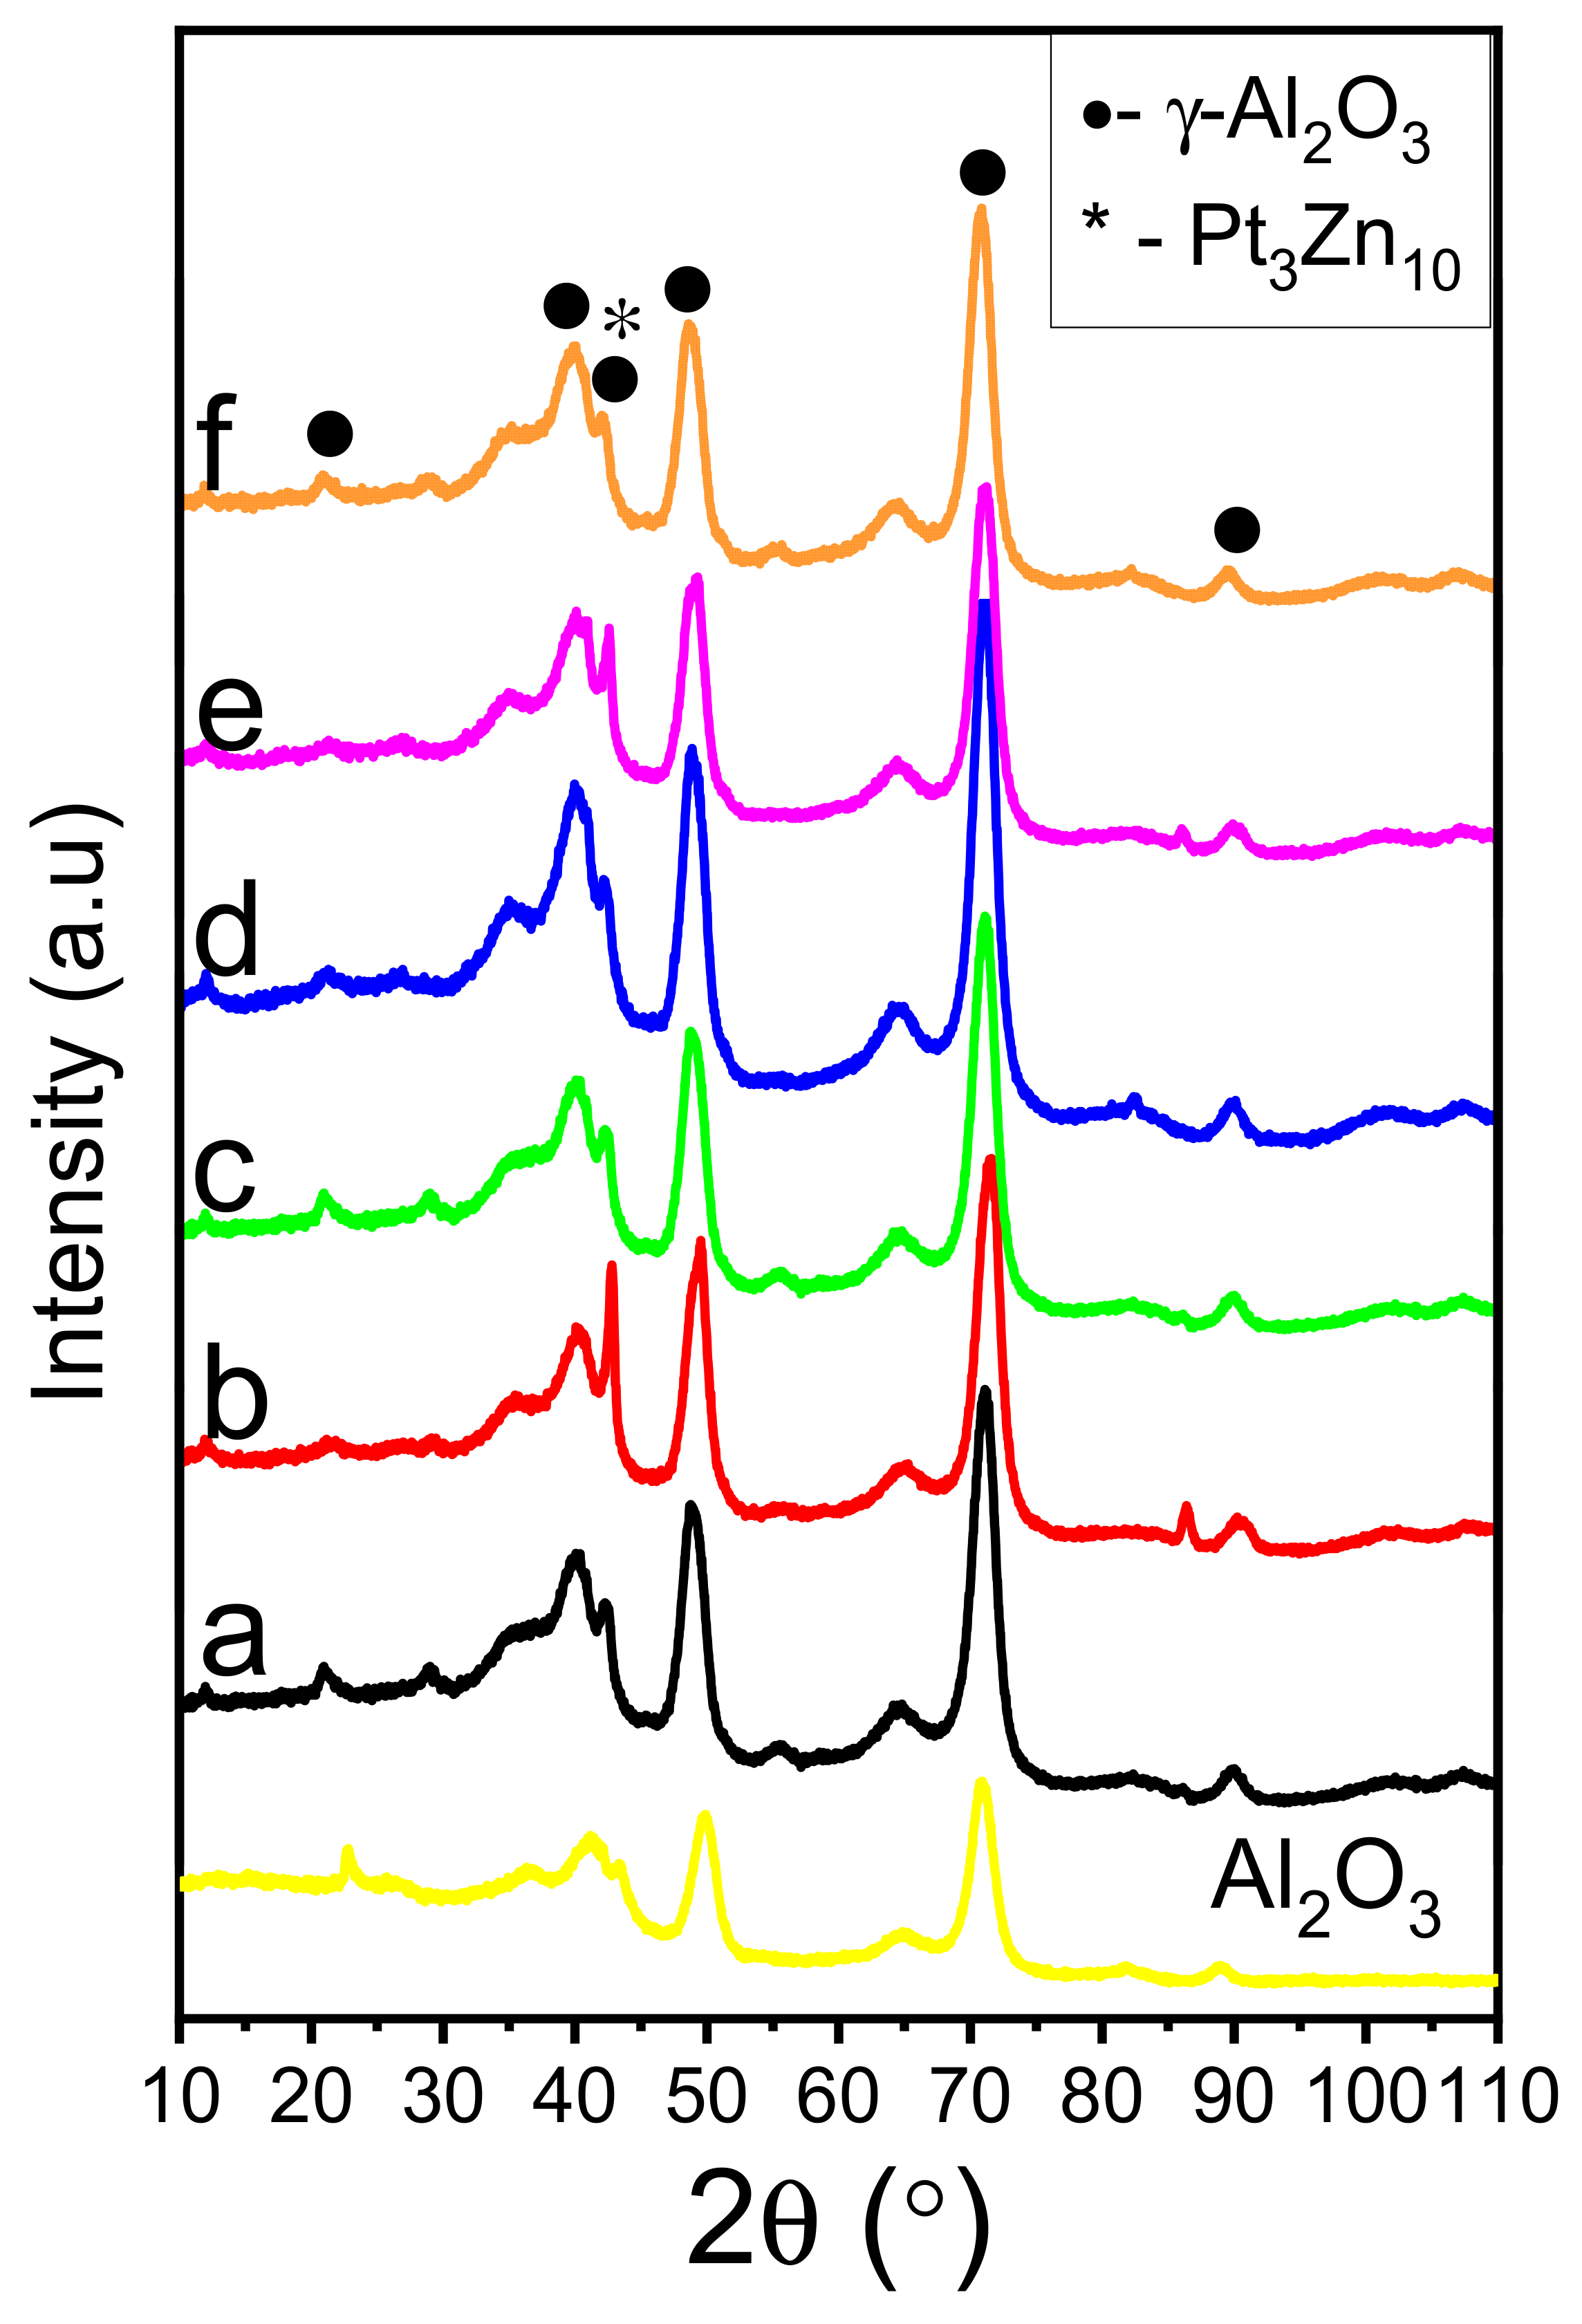
Figure 2 displays the XRD patterns of all catalysts that have been freshly calcined under various atmospheric conditions. The XRD pattern of the support showed the γ-Al2O3 phase [PDF: 01-079-1557]. Regardless of the different calcination atmosphere treatments, the XRD patterns of all catalysts are similar to that of Al2O3 support. The catalysts calcined in static air and flowing air showed no phases related to Pt and different promoters, suggesting these species are either in amorphous form or having low crystallinity less than the detection limit. On the other hand, the catalysts subjected to N2 calcination exhibited a heightened signal at 42.8 degrees, observed in both PtSn-N2 and PtSnZnCa-N2. This signal indicates the alloy formation of Pt with Sn or Zn, and according to the database, it is identified as the Pt3Zn10 phase [PDF: 03-065-4913] in the PtSnZnCa-N2 catalyst. The precise PtSn phase was not identified in the PtSn-N2 catalyst. The results clearly indicate that the crystallinity increased in the catalysts pretreated in the N2 atmosphere. The diffraction patterns of used catalysts are presented in Figure S3. The results showed that there was no considerable change observed before and after the reactions.

2.3. XPS

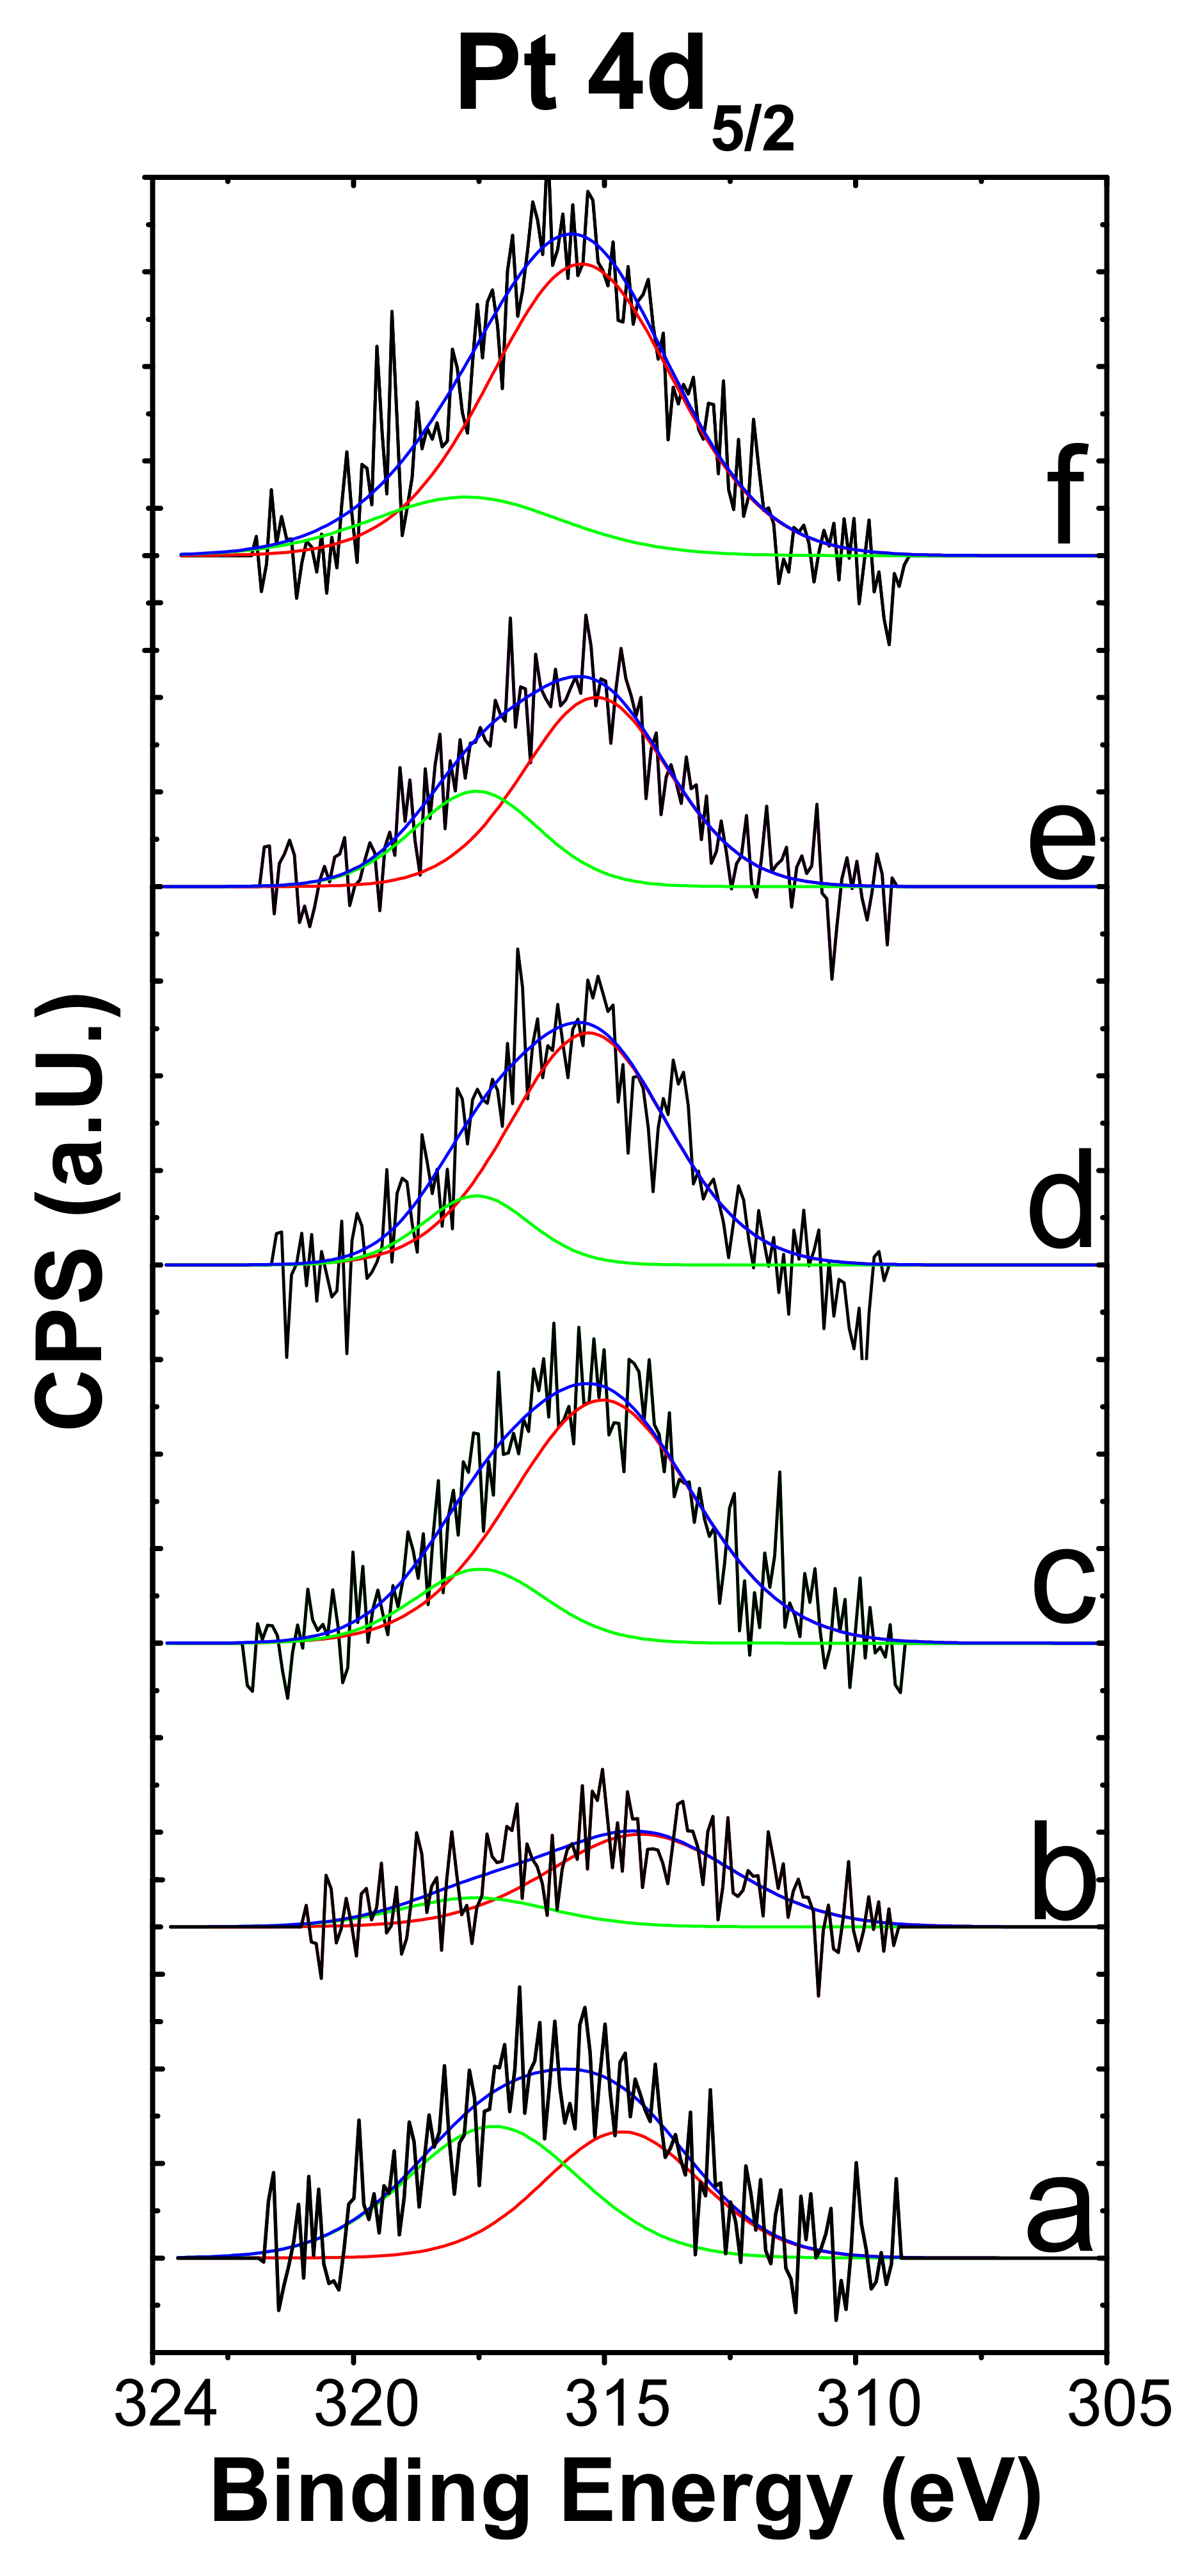
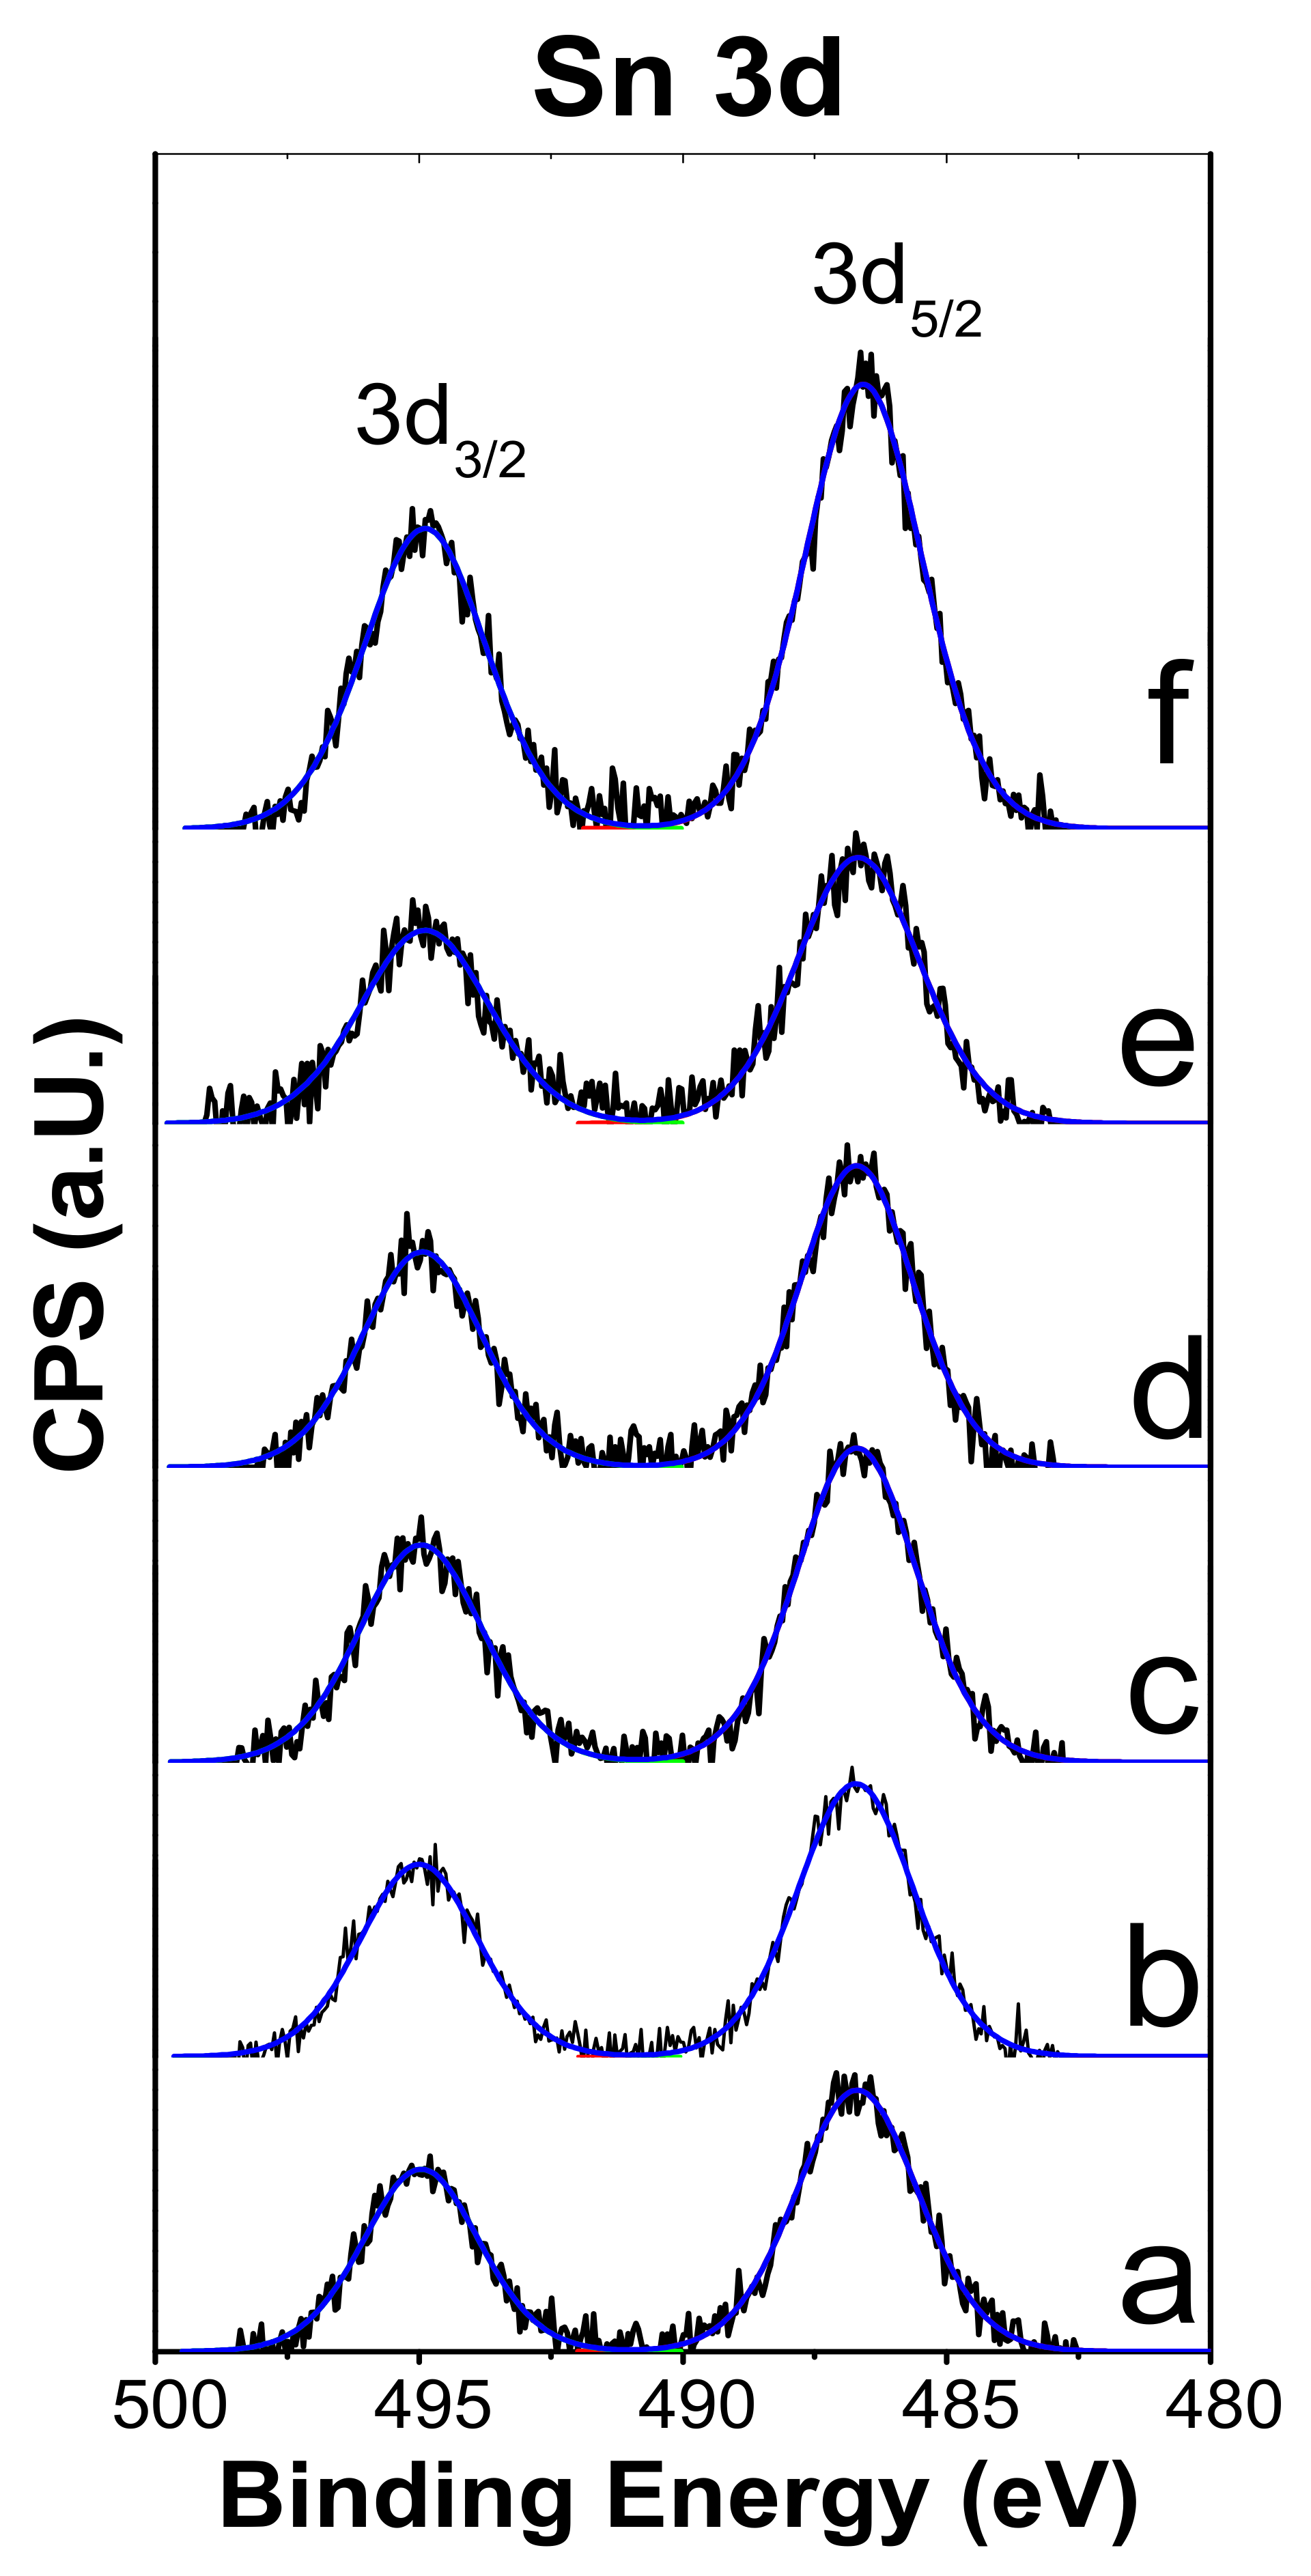
The XPS analysis of all calcined catalysts was conducted to examine the chemical state and the surface elemental composition of catalysts. The XPS spectra of Pt4f peaks overlap with the Al 2p peaks of the alumina, thus considered Pt 4d spectra [26]. The core level spectra of Pt 4d for all catalysts are shown in Figure 3. The deconvoluted spectra of Pt 4d indicate the presence of Pt0 and Pt2+ species at 315.3 and 317.3 eV, respectively [27]. There are three interesting changes observed in XPS results by changing the catalyst calcination atmosphere: (i) There is a slight shift towards a lower binding energy of Pt4d5/2 in the case of the catalysts calcined in the nitrogen atmosphere compared to the B.E. of Pt4d5/2 in the catalysts calcined in static air and flowing air. (ii) The ratio between Pt0/Pt2+ is higher in the case of the catalysts calcined in static air compared to that of the catalysts calcined in N2 and flowing air. (iii) The amount of surface Pt is higher in the case of the catalysts calcined in static air compared to the other catalysts (Table 2). The XPS spectra of the Sn3d level of catalysts are presented in Figure 4. All catalysts showed only one peak each at 486.4 and 494.7 for Sn 3d5/2 and Sn3d3/2, respectively, which corresponds unequivocally to Sn4+/Sn2+ species [28]. These results confirm the presence of surface metallic Pt and Sn4+/Sn2+ species in high concentrations, indicating the absence of alloy particles with Pt on the surface. The possibility of alloy formation during reduction cannot be avoided. The surface Pt and Sn are higher in the PtSnZnCa catalysts than in the PtSn catalysts, especially in the case of the catalysts calcined in static air. On the other hand, PtSnZnCa-N2 has a high surface concentration of Zn, while PtSnZnCa-FA has a high surface concentration of Ca (Table 2). All catalysts have surface Cl due to the precursor salt, which is removed during the reduction step. The survey spectra of all prepared catalysts are presented in Figure S4. Due to the low concentrations of Pt, Sn, Zn, and Ca, the XPS signals cannot be seen in the survey spectra.

2.4. TPR

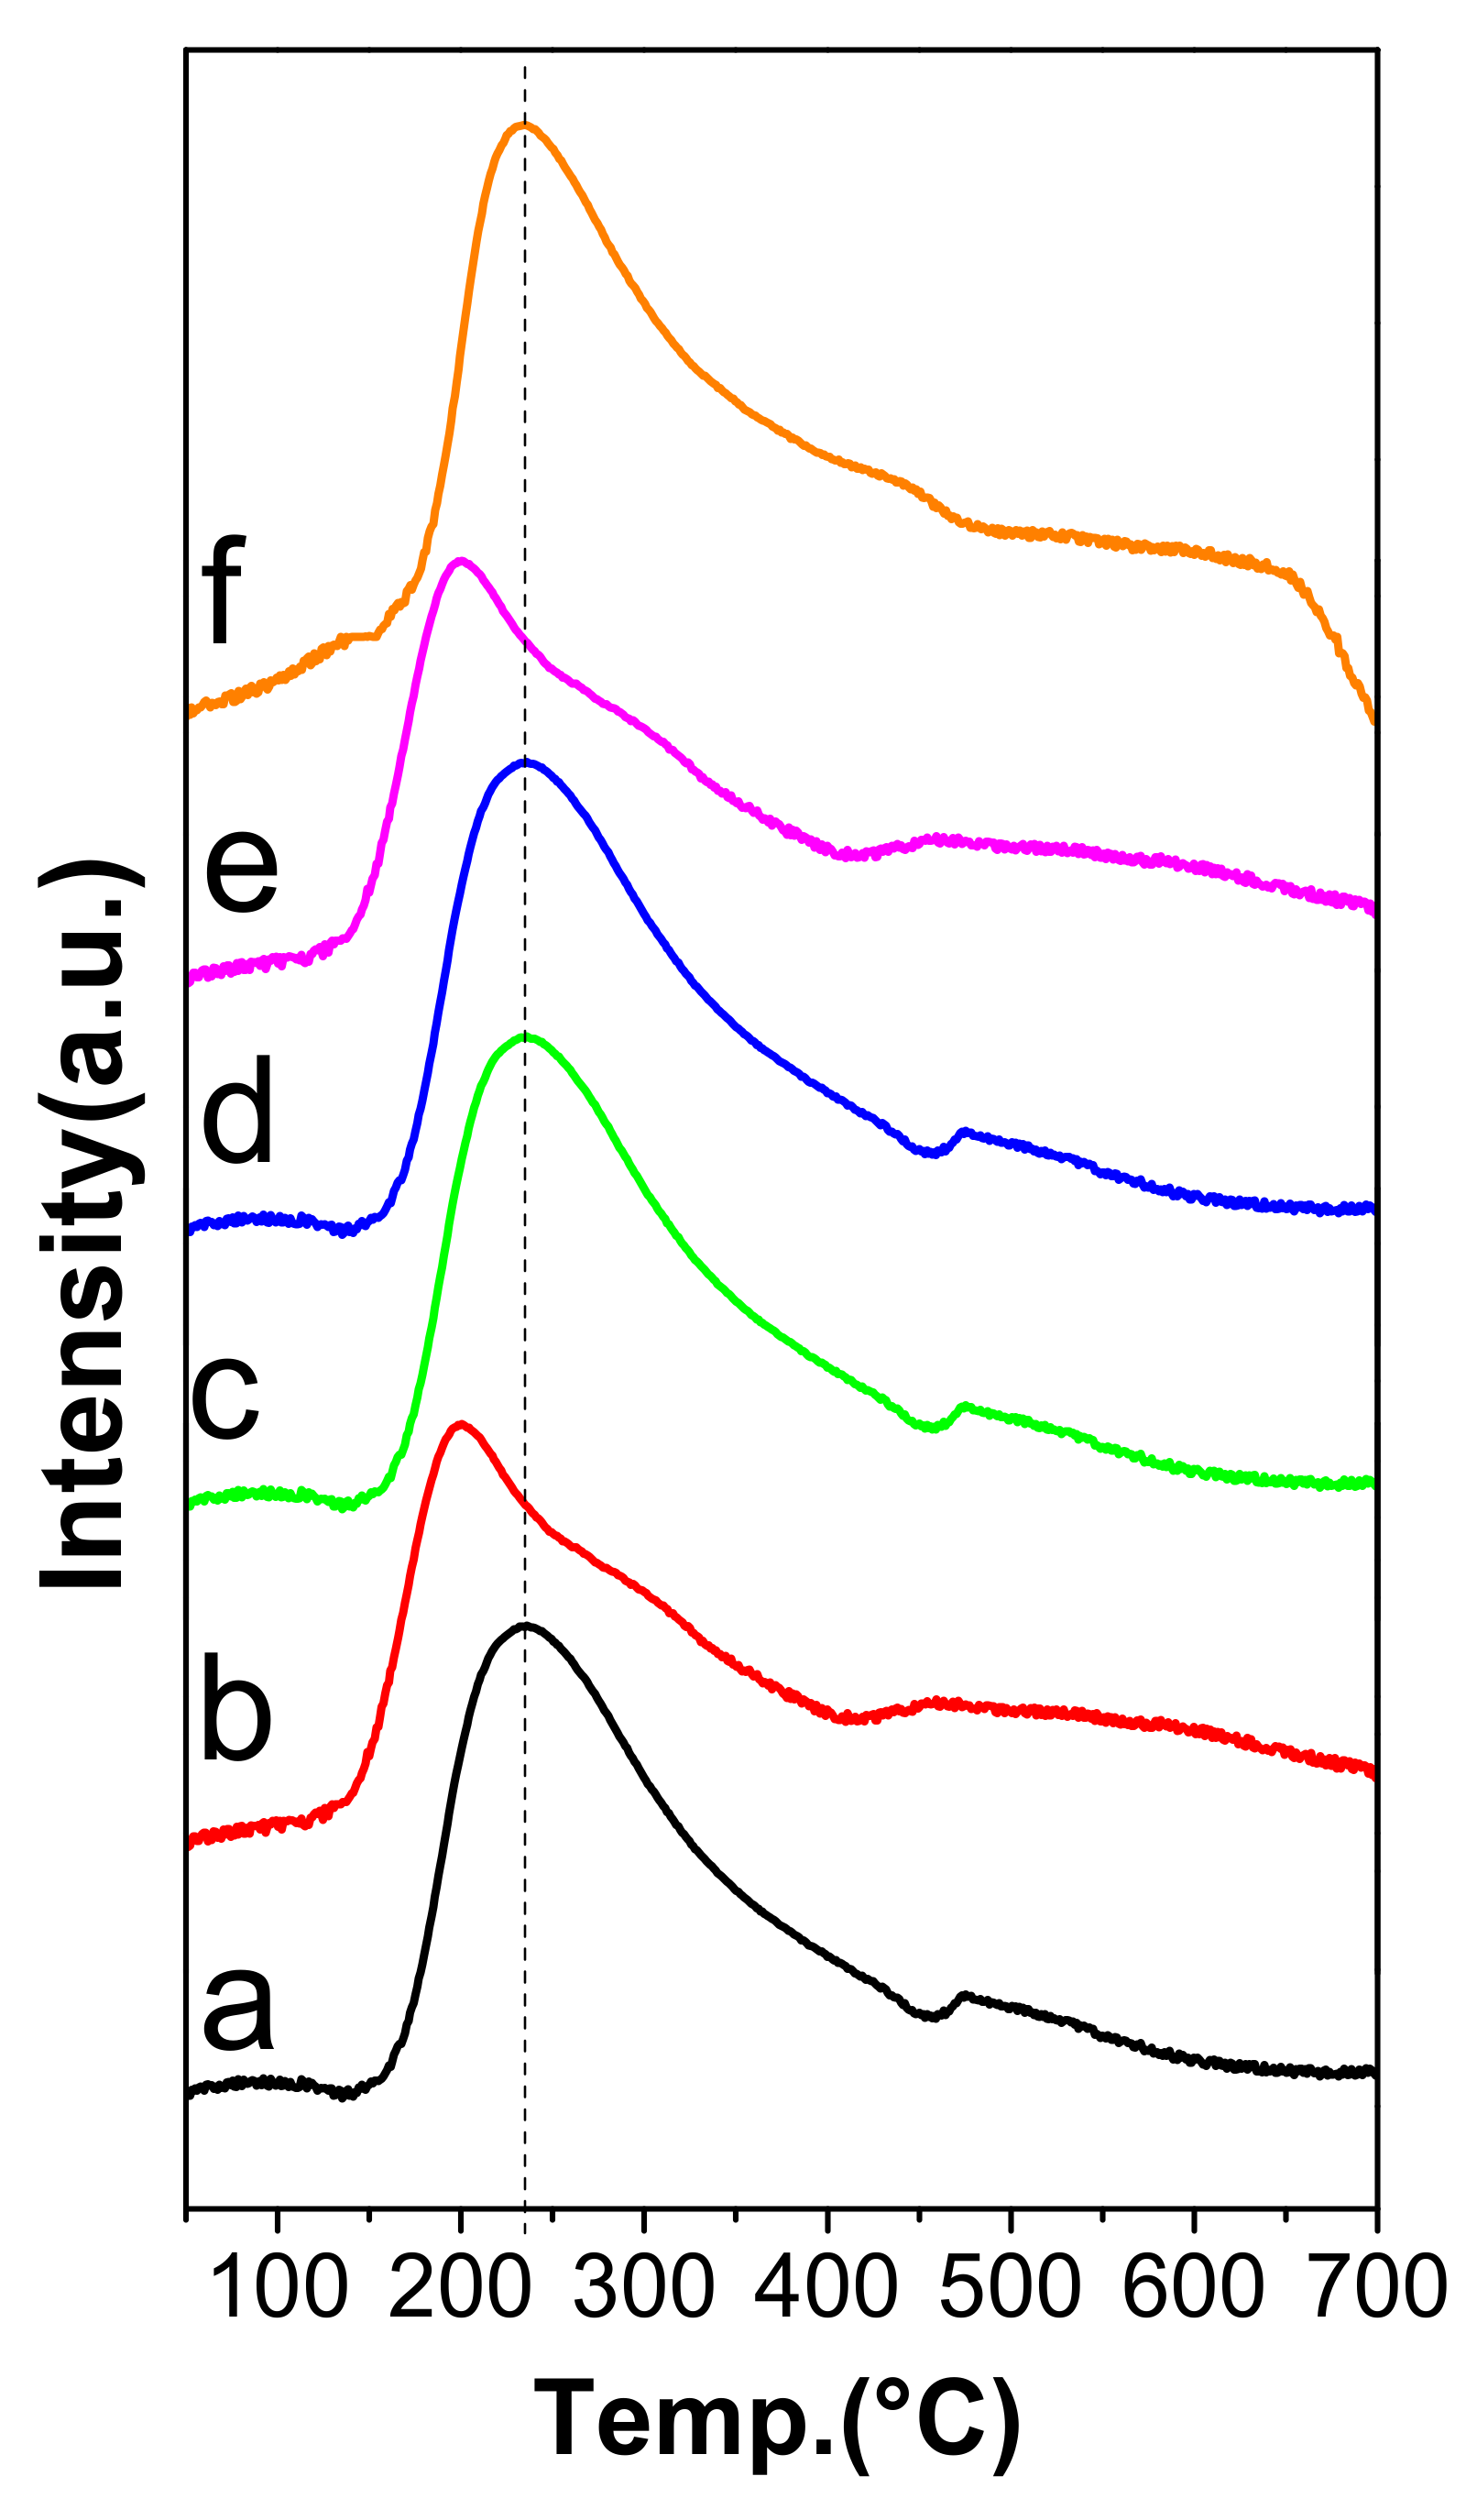
TPR analysis was performed to obtain insights into the chemical nature of active sites in catalysts. The TPR profiles of all prepared samples are displayed in Figure 5. All catalysts showed a major peak with Tmax at 230 °C except the catalysts calcined in the N2 atmosphere. The Tmax in PtSn-N2 and PtSnCaZn-N2 showed at 200 °C. According to the literature [29,30,31], the Pt oxide species will reduce in a temperature range of 200–250 °C. Thus, the above-mentioned peaks correspond to the reduction in Pt oxide species in the catalysts.
On the other hand, the reduction in Sn4+ to Sn2+ species appears as a broad reduction band in a temperature range of 300–400 °C. The TPR results in Figure 6 show that the reduction band of Sn4+ to Sn2+ species overlaps with the reduction band of Pt oxides. The results indicate that the interaction between Pt and Sn oxide species is high in those catalysts calcined in static air and flowing air conditions in comparison to that of catalysts calcined in N2. In addition, hydrogen consumption is low for the catalysts calcined in N2 compared to other catalysts. It has been reported that the interaction of Sn modifies the nature of Pt in electronic and geometric properties. The hydrogen consumption data are reported in Table 1. From the data, it is clear that there is less variation in hydrogen consumption before and after the addition of Ca and Zn in the catalysts. The catalysts calcined in N2 showed low H2 consumption compared to other catalysts.

2.5. NH3-TPD

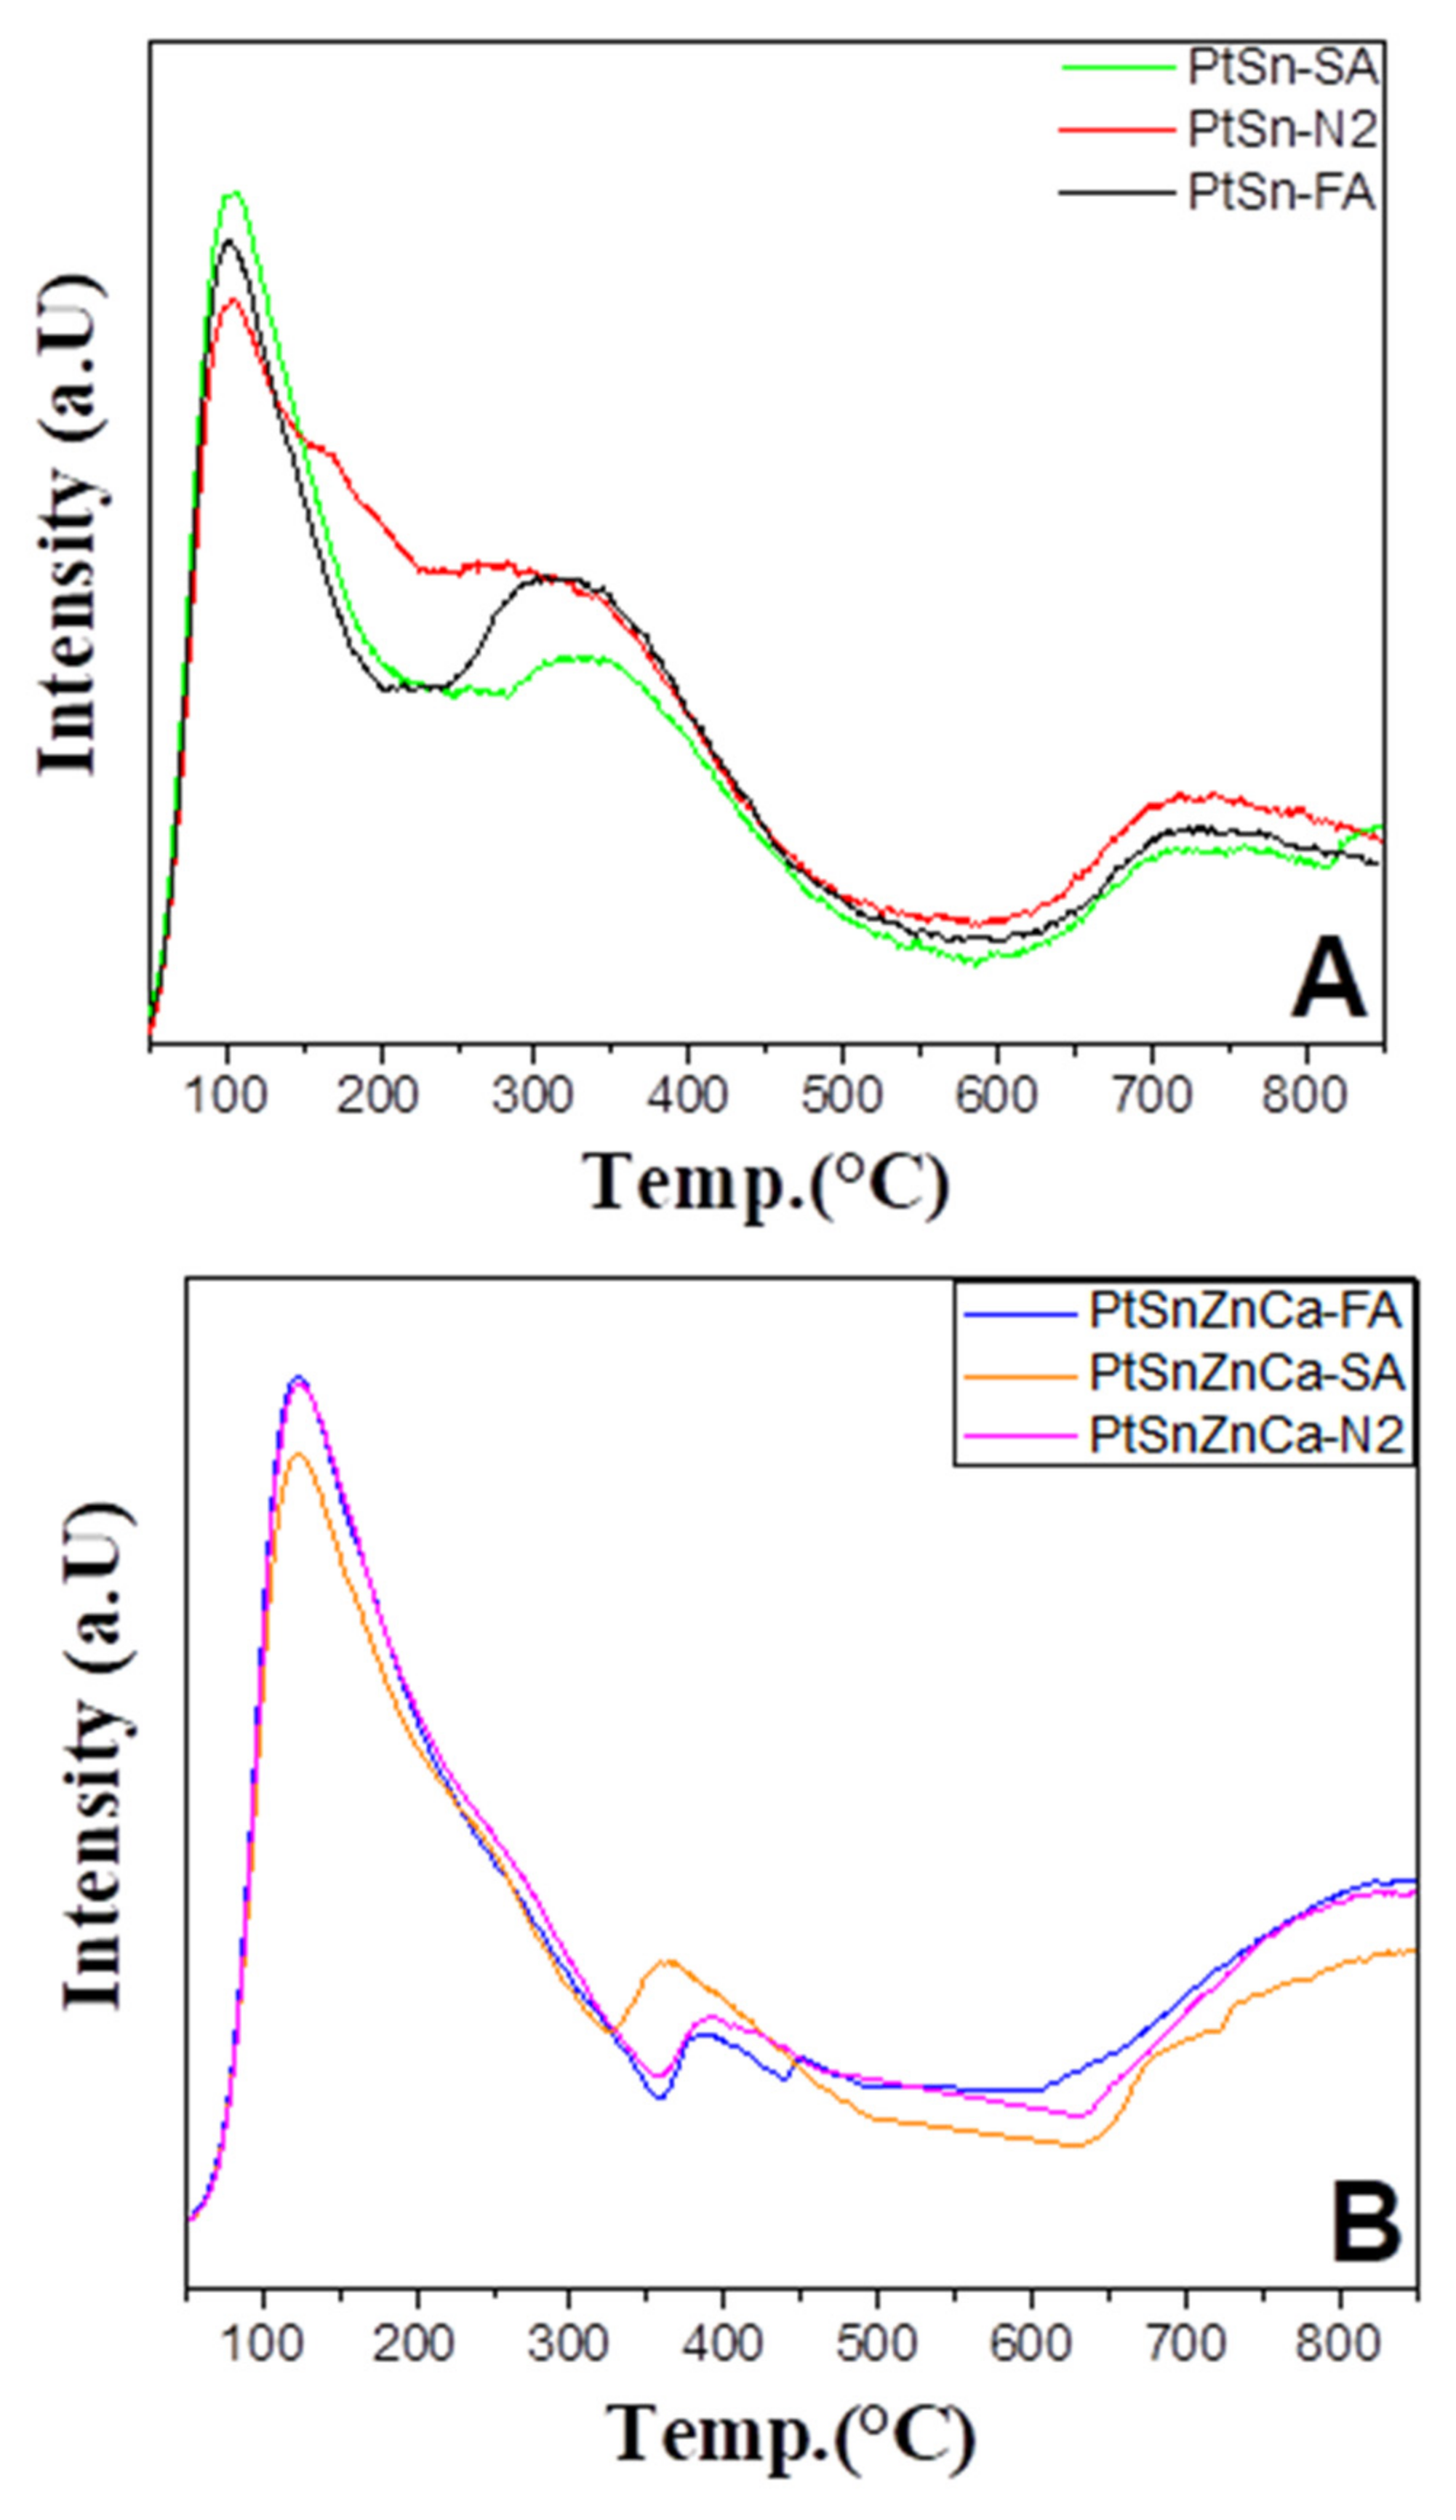
According to the literature, acid sites will influence the catalytic activity for ethane dehydrogenation because acid sites are responsible for side reactions like cracking, isomerization, and polymerization [32]. Coke deposition initiates from Lewis acidic sites on alumina [33]. NH3-TPD experiment was performed to examine the acid properties of catalysts. The NH3-TPD curves of the PtSn/Al2O3 and PtSnZnCa/Al2O3 catalysts calcined in different atmospheres are illustrated in Figure 6. The quantitative analysis outcomes of the catalyst acidity are exhibited in Table 1. As per previous reports, in PtSn catalysts, the Sn neutralizes the acidic sites of Al2O3 [32,34].
The PtSn catalysts calcined in different atmospheres showed similar patterns of acidity curves containing three types of curves corresponding to weak, moderate, and strong acidic sites. From Table 1 and Figure 6, it can be noticed that when the PtSn catalyst was calcined in static air, the total acidity decreased, especially at moderate acidic sites, compared to that of the PtSn-N2 and PtSn-FA catalysts. The acidic site distribution changed in the PtSnZnCa catalysts. The weak acidic sites increased, and medium acidic sites significantly decreased in the PtSnZnCa catalysts compared to that of the PtSn catalysts. According to Garidzirai et al., with the addition of Zn to Pt/Al2O3 catalysts, the acidity, especially at weak acidic sites, will increase [35]. On the other hand, the addition of alkali earth metal (Ca) decreased medium acidic sites. The calcination atmosphere also influences the acidity of the catalysts. The catalysts calcined in static air showed lower acidity in comparison to that of catalysts calcined in different atmospheres. These results suggest that the calcination atmosphere can markedly influence the acidity of the catalysts. The PtSn-SA and PtSnZnCa-SA catalysts showed the lowest fraction of medium acid sites and relatively low total acidity.

2.6. TEM Studies

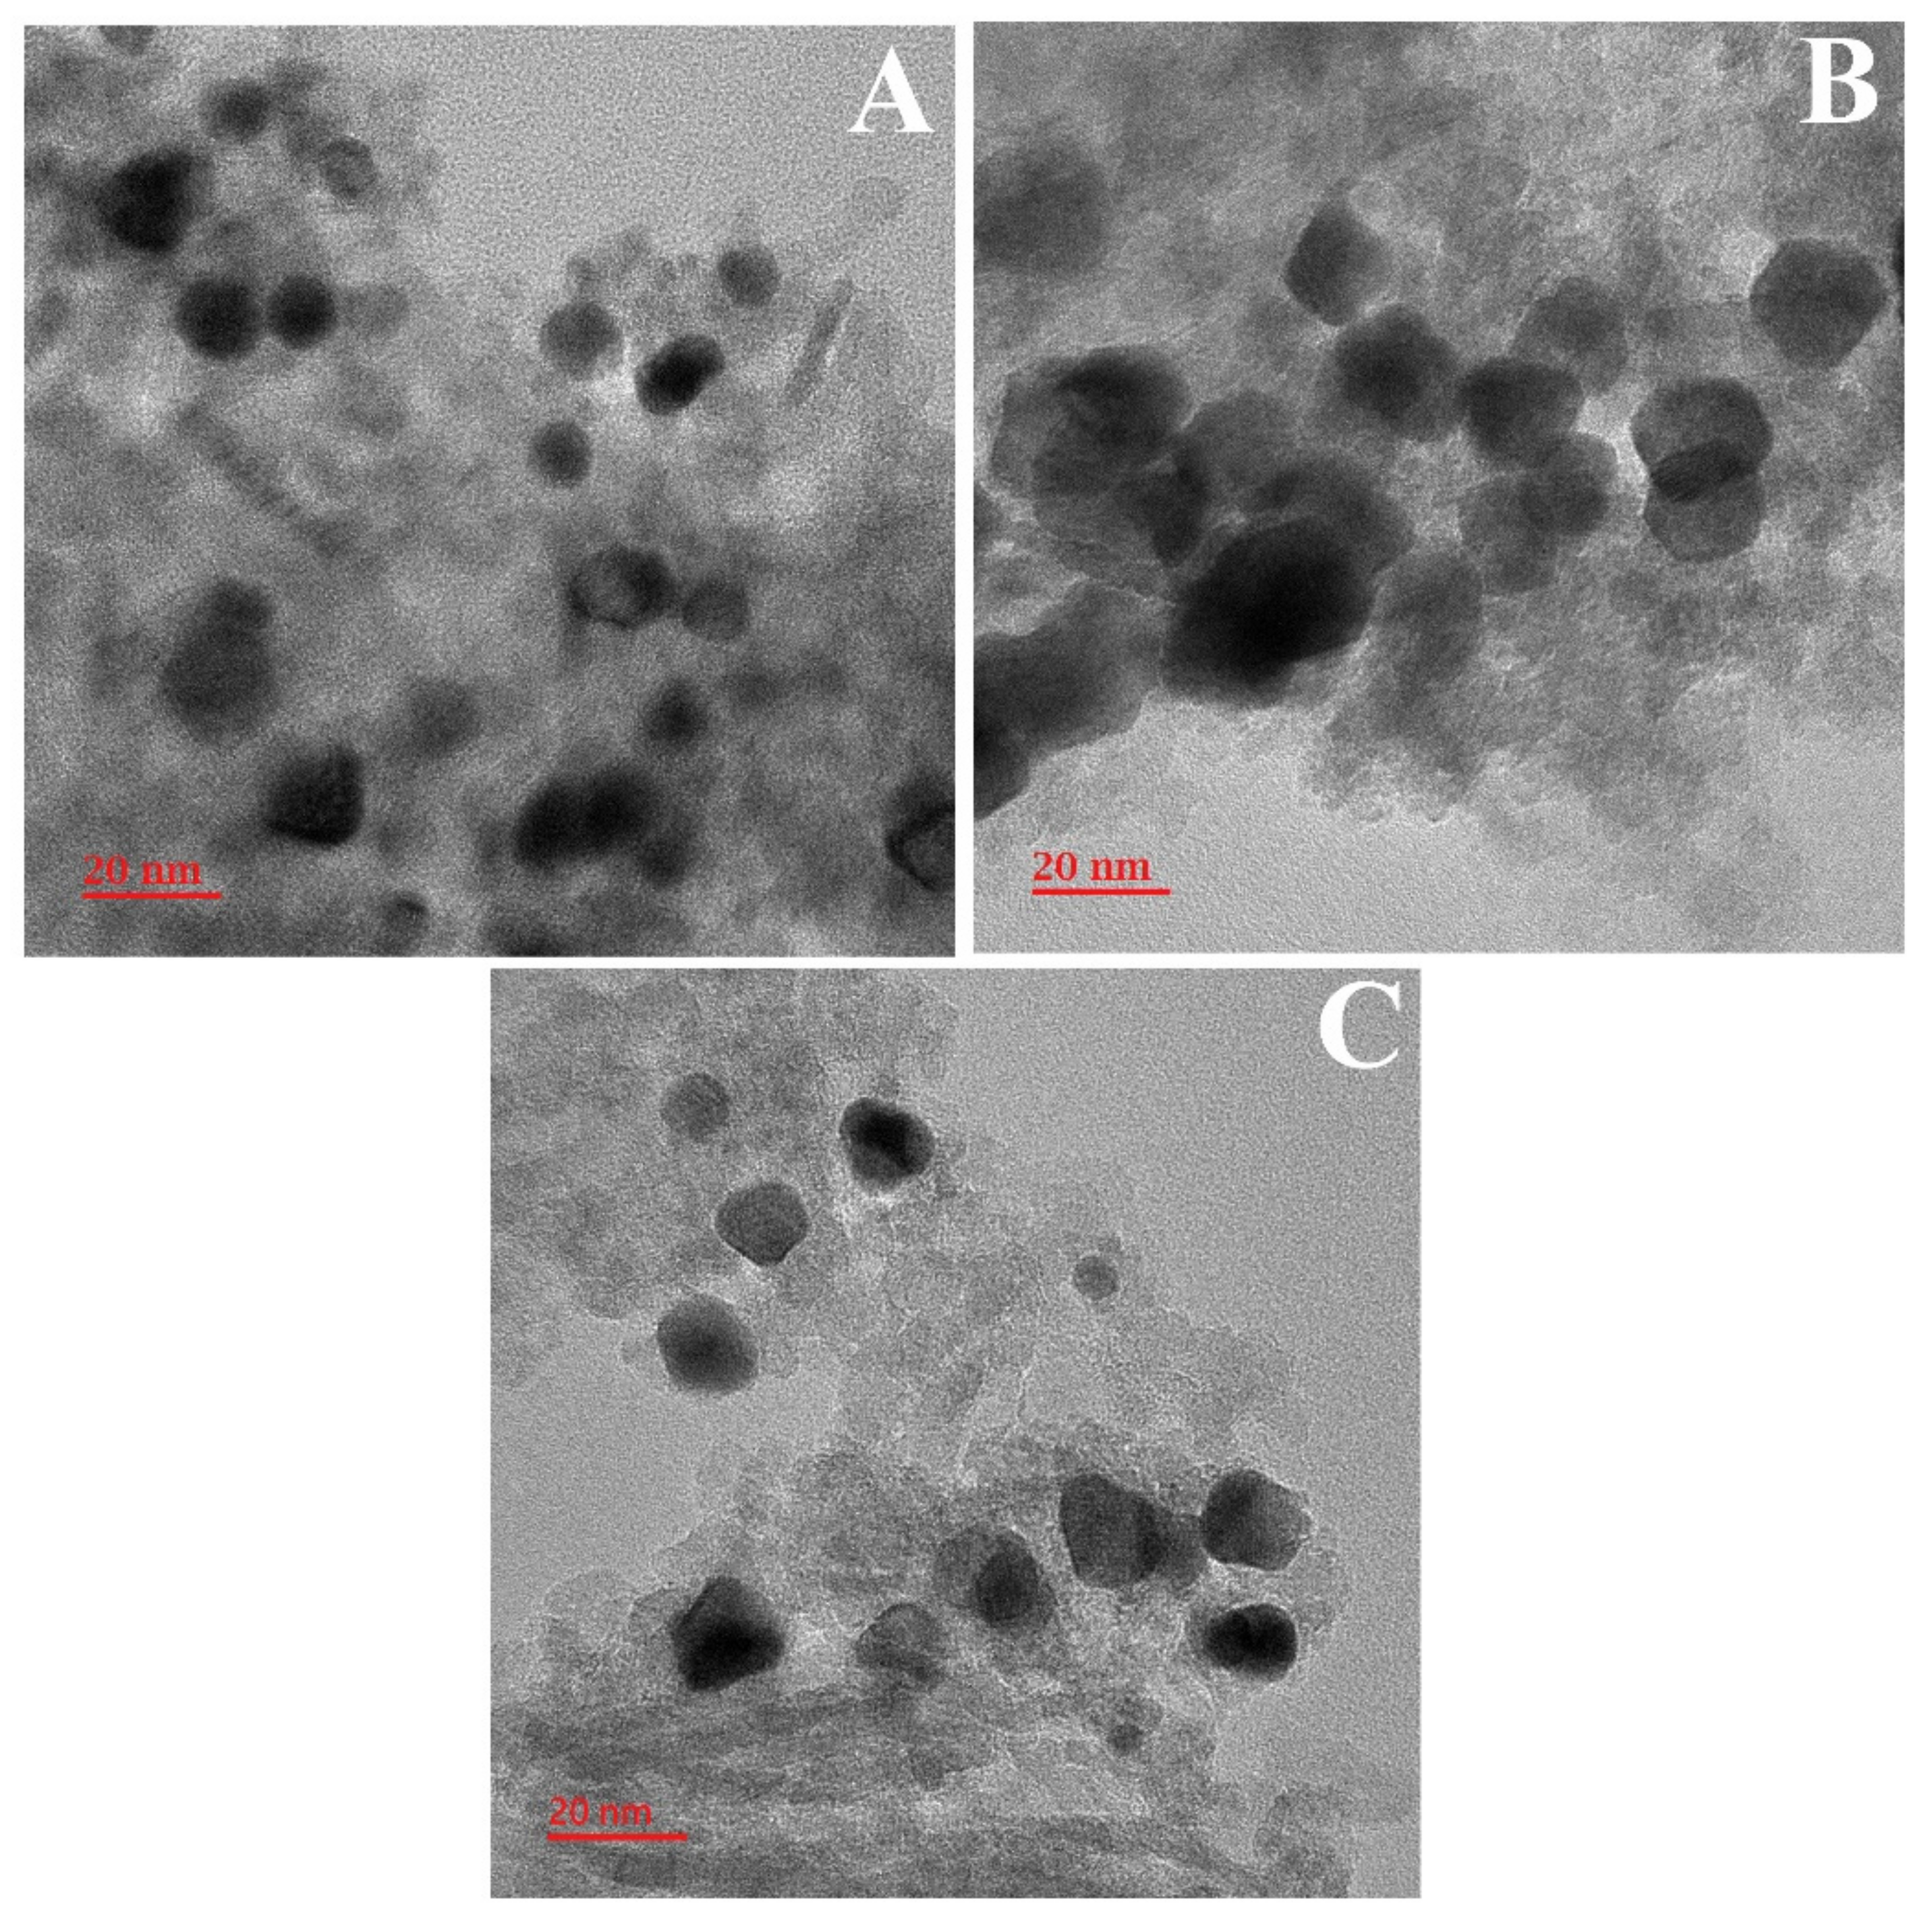
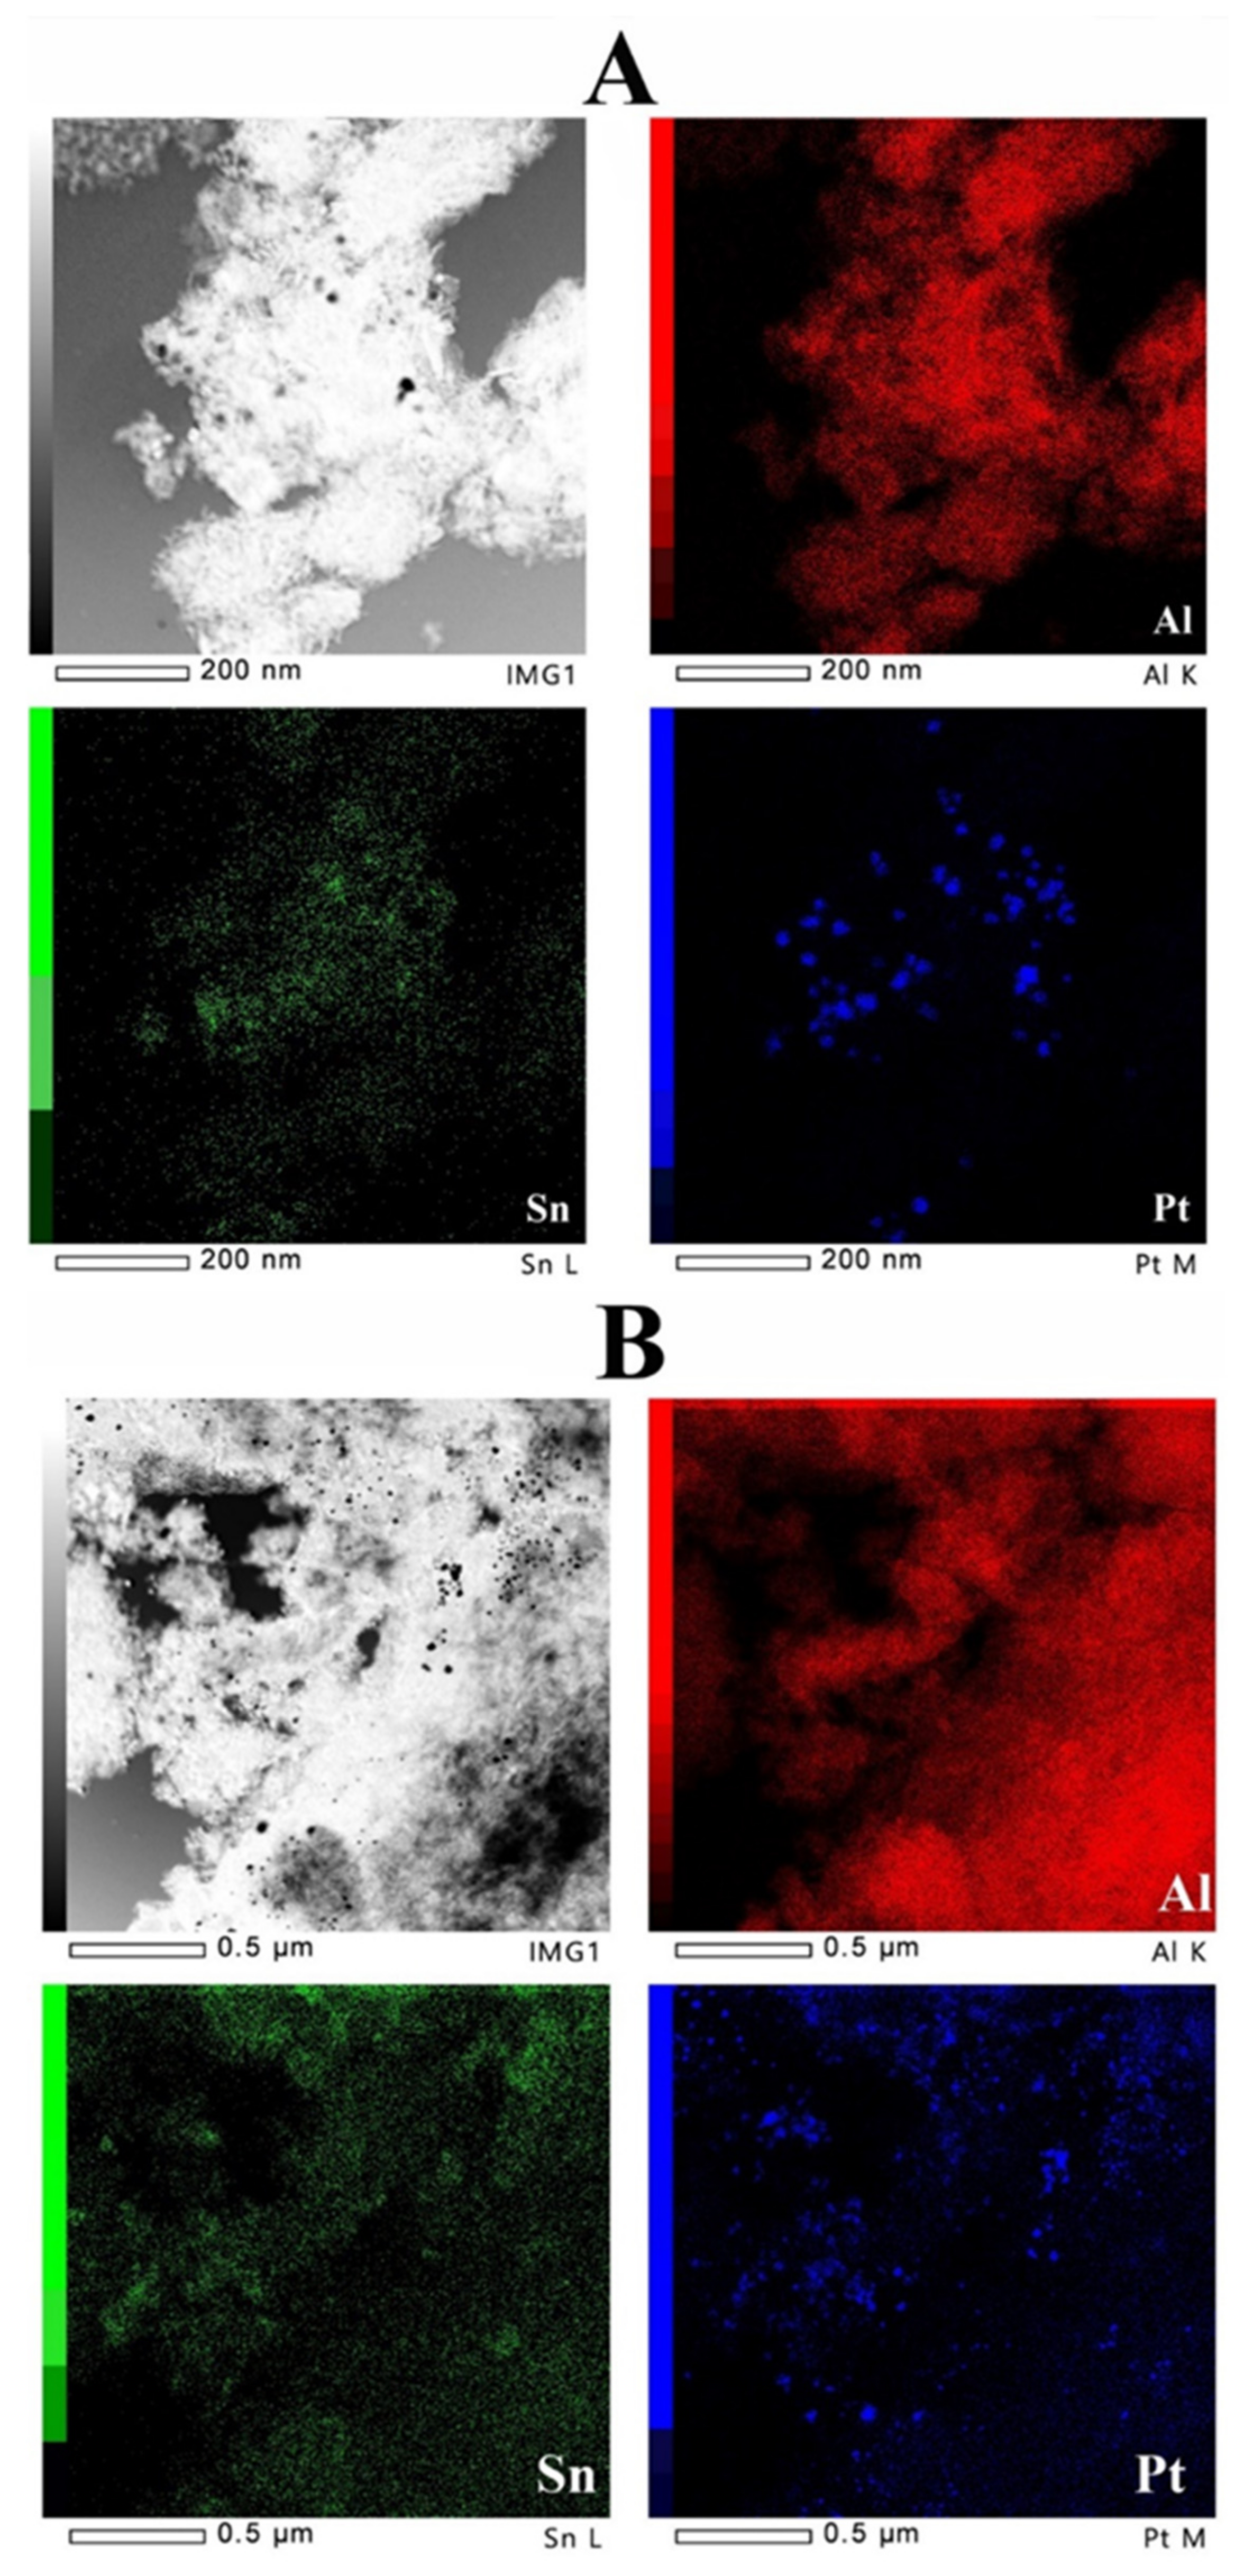
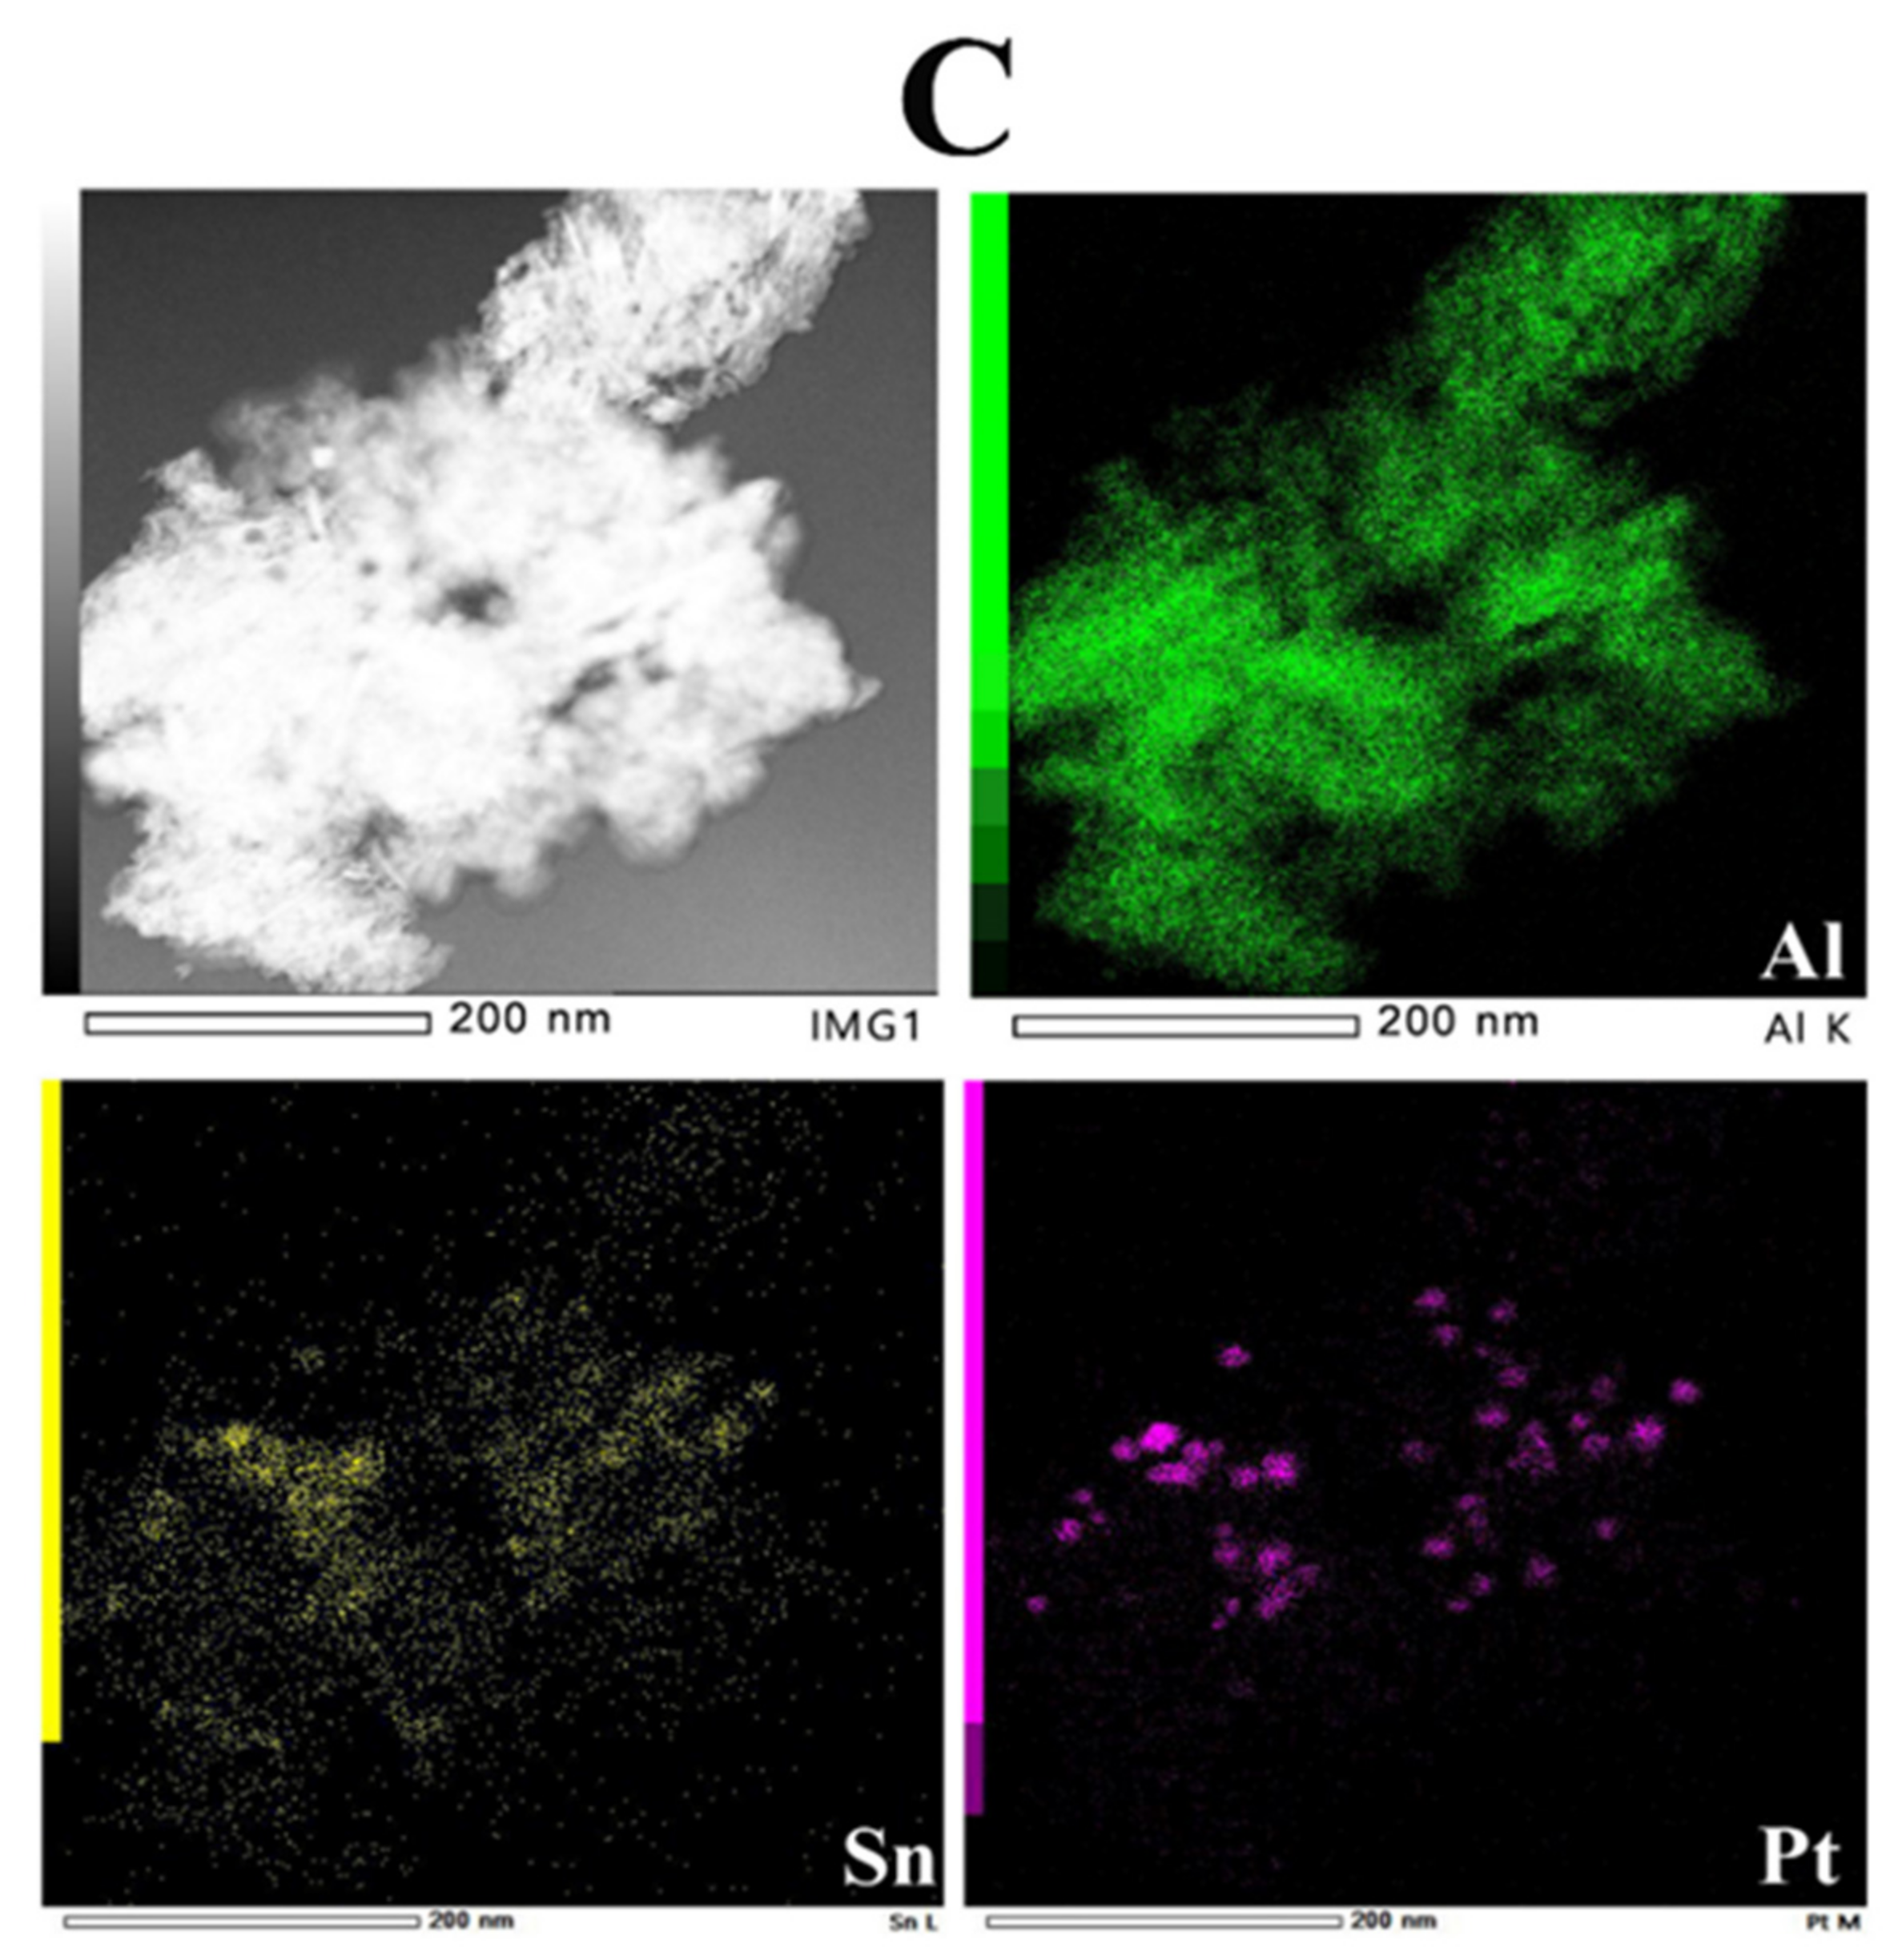
The TEM images of PtSn catalysts calcined in different atmospheres are presented in Figure 7. The TEM images revealed the presence of Pt nanoparticles, which are indicated by dark dispersed spherical particles (see Figure 7). It is noticed from the TEM results that the agglomeration of Pt particles is more in the case of PtSn-FA and PtSn-N2 compared to the PtSn-SA catalyst. Hence, it is obvious that catalyst pretreatment affects active metal distribution. To clarify the possibility of Pt distribution, elemental mapping was performed on PtSn catalyst calcined different atmospheres in several areas, and some of the representative images are exhibited in Figure 8. From the results, it is noted that the Sn nanoparticles dispersed homogenously throughout the catalyst, but the Pt particles dispersed as small lumps. The order of Pt particle agglomeration observed is as follows: PtSn-FA > PtSn-N2 > PtSn-SA.
The TEM and HRTEM images of the PtSnZnCa-SA catalyst are presented in Figure 9. As shown in Figure 9, the sizes of the Pt nanoparticles are not uniform and are estimated in the range of 2 to 7 nm. The average particle size is estimated to be less than 5 nm.
The high-resolution TEM (HRTEM) image is shown in the inset of Figure 9. The HRTEM image depicts diffraction fringes with a d-spacing of 0.23 nm, relating to the Pt (111) plane of the FCC structure. Pt (111), which is frequently observed in a spherical form, possesses the lowest surface energy for Pt-based catalysts [36,37]. Also, it is generally accepted that the surface energy of metals decreases with increasing coordination number of surface atoms, which promotes the sintering of nanoparticles. The results indicate that the sintering of Pt particles is low in the case of the PtSnZnCa-SA catalyst [1]. Lee et al. [38] reported that the Pt will form an alloy with Sn/Zn during the reduction step. Therefore, PtSn or PtZn alloys may form during the reduction step.

2.7. Activity

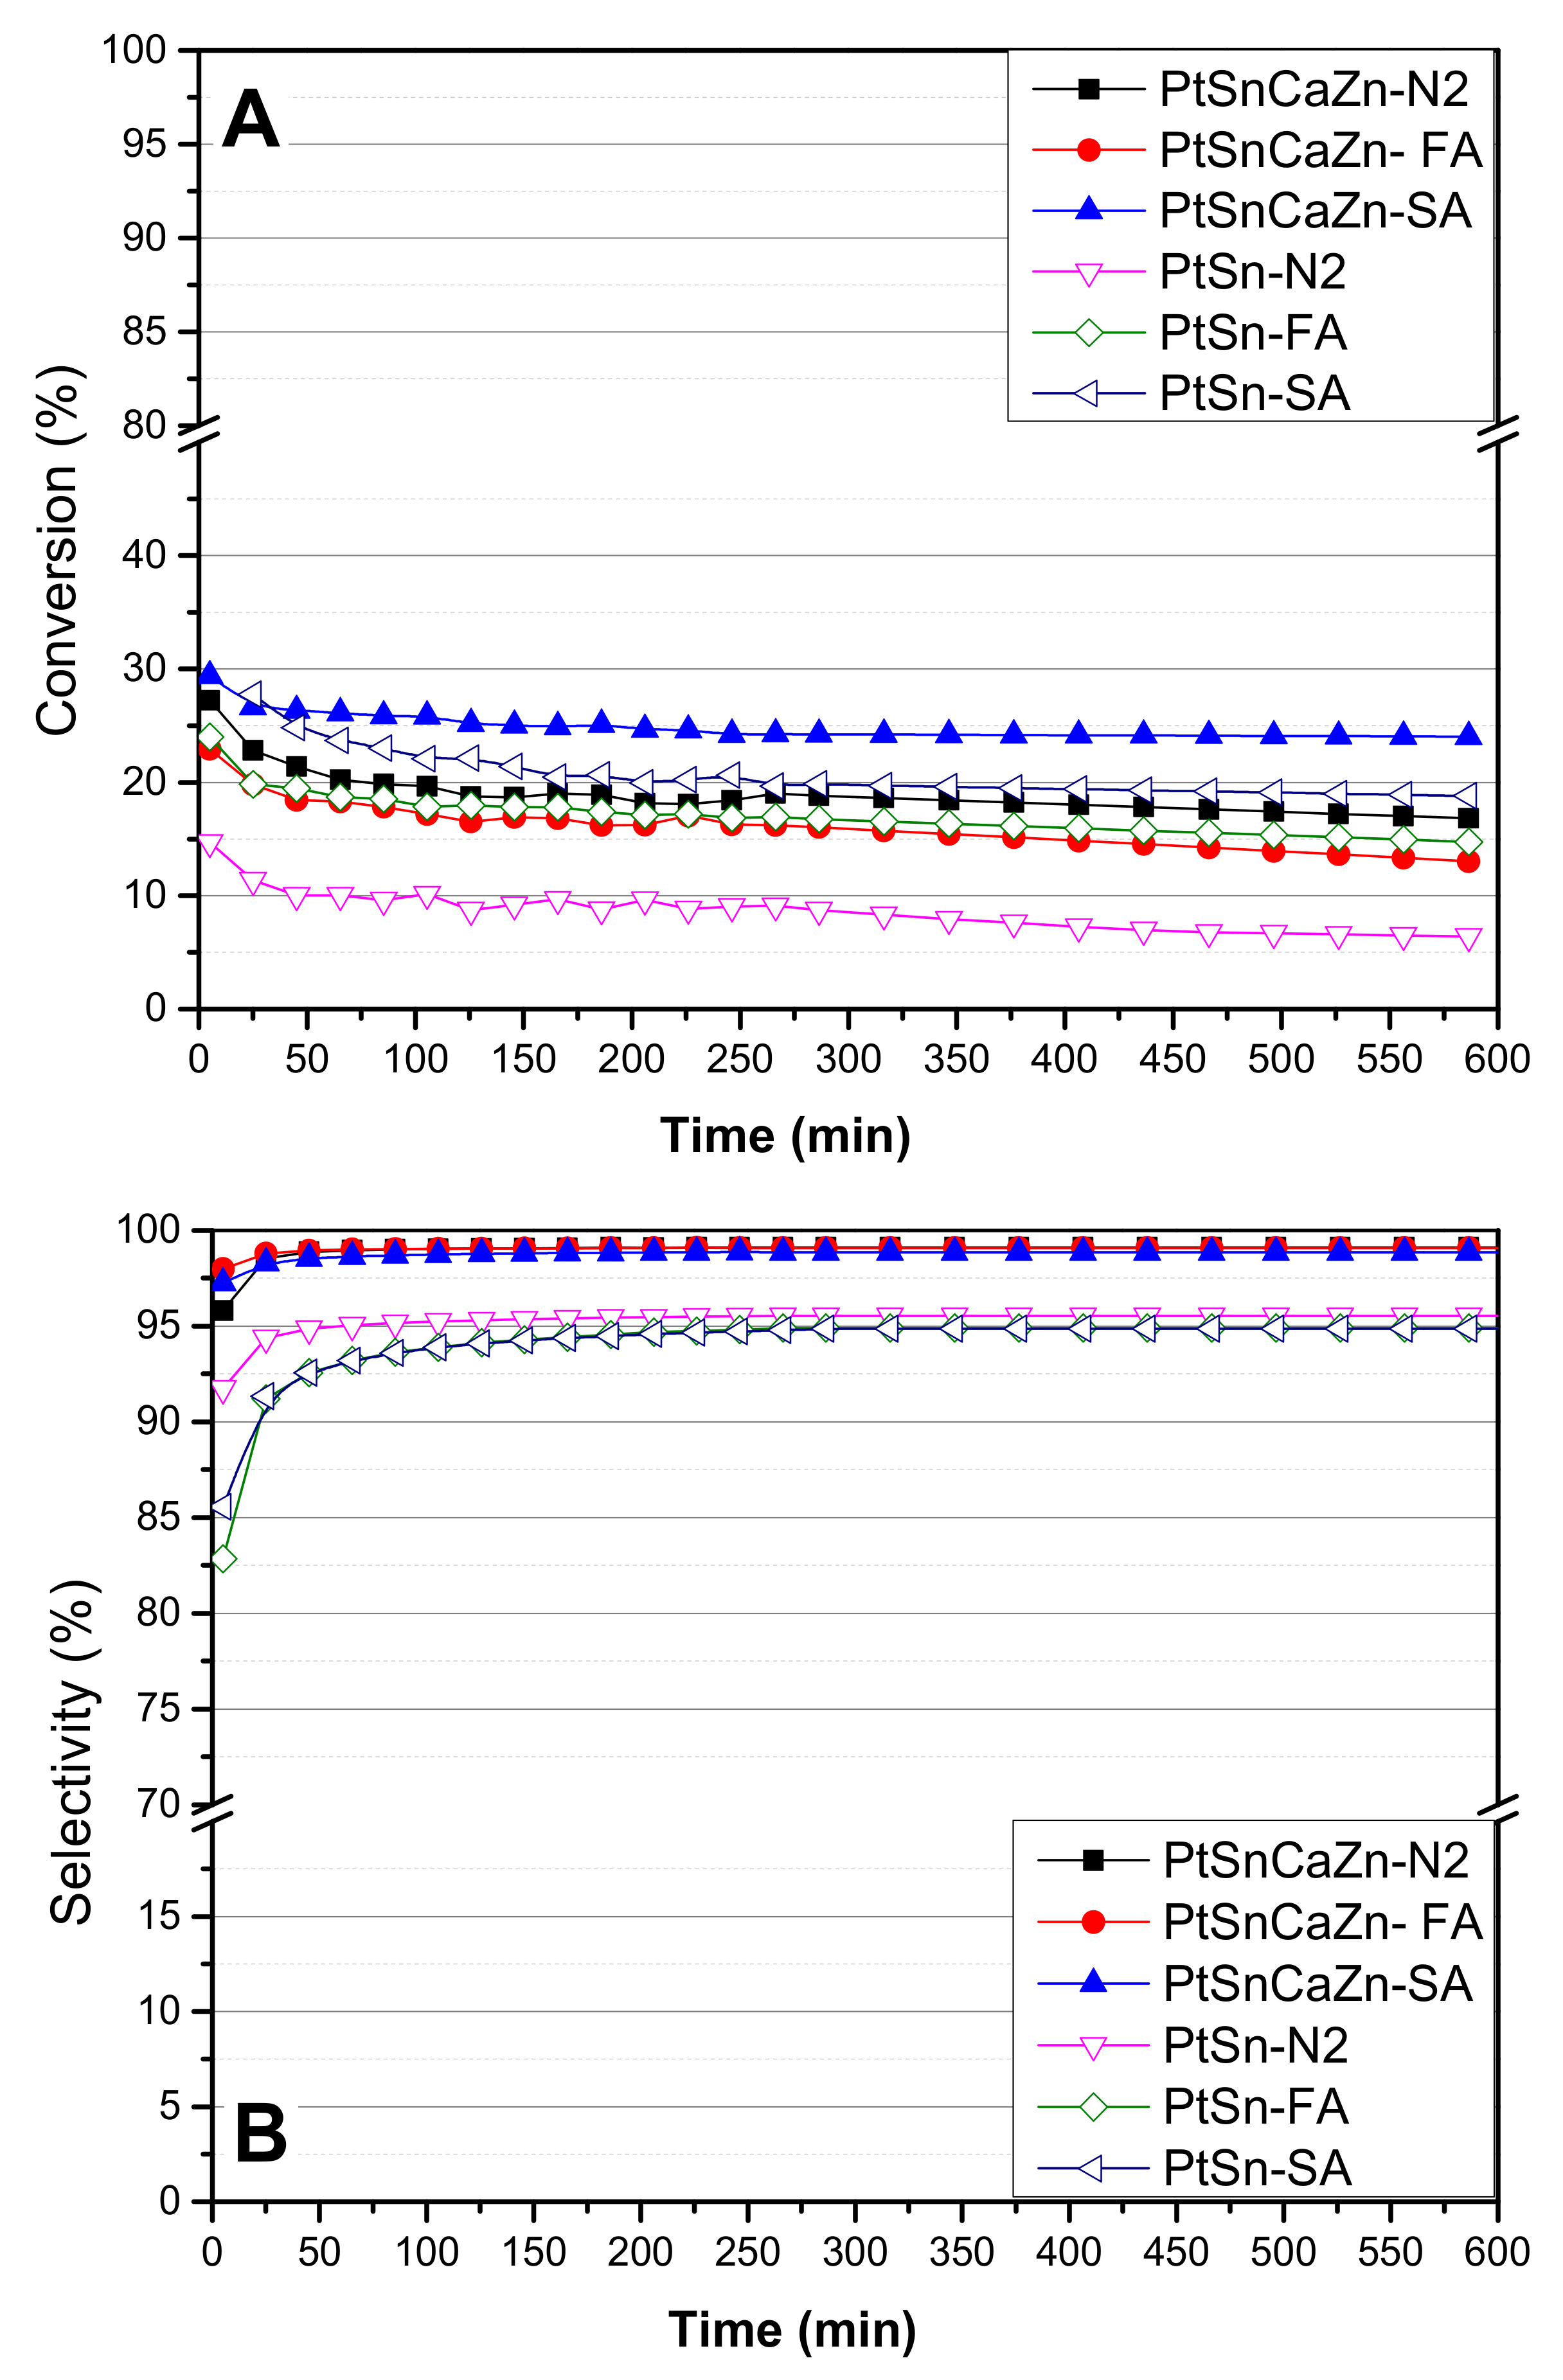
Figure 10 shows the ethane conversion and ethylene selectivity with respect to reaction time on Pt-based catalysts calcined under different atmospheres. According to the literature, Pt/Al2O3 catalysts show high conversion and low selectivity [34]. The endothermic ethane dehydrogenation reaction (EDH) reaction is equilibrium limited; thus, attaining a high degree of conversion requires high reaction temperatures. At these reaction conditions, an intensive coke formation on the catalyst surface takes place, and fast catalyst deactivation is observed [18,39]. Among the three PtSn catalysts calcined in three different atmospheres, PtSn-SA exhibits the highest ethane conversion, whereas the PtSn-N2 catalyst displays the lowest ethane conversion. On the other hand, the ethylene selectivity observed is slightly higher in the PtSn-N2 catalyst compared to that of the PtSn-SA and PtSn-FA catalysts. The higher activity of the PtSn-SA catalyst is due to the presence of a high surface Pt on the catalyst surface (from XPS results) and a lower metal agglomeration (from TEM results).
Based on the literature, it is known that the Pt species in PtSn/γ-Al2O3 catalyst distributed in two kinds of active Pt species existed on the surfaces of γ-Al2O3 named M1 and M2 sites. In M1, the Pt species are directly anchored on the γ-Al2O3 surface. In M2, the Pt species are anchored on the Sn surfaces. M1 sites are favorable for low-temperature H2 adsorption and responsible for hydrogenolysis reaction and carbon deposition. On the other hand, M2 sites adsorb H2 at higher temperatures and are resistant to deactivation due to less carbon deposition in the dehydrogenation reaction [30,40]. As per the literature, the interactions between Pt species and the alumina surface are notably stronger, particularly with chloride precursor [41,42]. The calcination process removes the water from the catalyst. The effect of the calcination atmosphere came into play on how efficiently water was removed during calcination [43]. The presence of water vapor weakens the metal support interaction. However, it leads to platinum particle agglomeration. The catalyst calcination in static air removes water vapor progressively and may help with M2 site formation. On the other hand, catalyst calcination under flowing air and the N2 atmosphere might lead to M1 sites. The TEM results clearly showed that Pt agglomeration is less in the PtSn-SA catalyst compared to the other catalysts, which indicates M2 sites.
The impact of adding Zn and Ca individually to the PtSn catalyst calcined in static air was studied. The results are displayed in Figure 11. The results clearly show that the yield is decreased with the addition of Zn and Ca individually to the PtSn catalyst. The ethane conversion and ethylene selectivity results with respect to reaction time on PtSnZn-SA and PtSnCa-SA catalysts at 625 °C are displayed in Figure S5. The PtSnZn-SA catalyst showed higher selectivity (98%) than the PtSn-SA catalyst, but the conversion was slightly decreased than the PtSn-SA catalyst. On the other hand, the PtSnCa-SA catalyst showed almost equal conversion to that of the PtSn-SA catalyst, but the selectivity was significantly lower.
The addition of Ca and Zn together to the catalyst composition has a positive effect on the catalytic properties of the PtSn catalysts. The conversion and selectivity both increased after the addition of Ca and Zn to the PtSn-based catalysts (Figure 10). According to the literature [1], the Zn promoter preferentially covers Pt step sites, which are responsible for severe dehydrogenation; as a result, the stability of the catalysts increases. On the other hand, the catalyst acidity is also important for ethane dehydrogenation. According to reports, the promoter Zn does not modify the support acidity [35]. Hence, the addition of a calcium promoter reduced the catalyst acidity, resulting in an increase in the catalyst’s activity. The highest activity was obtained by the PtSnZnCa-SA catalyst among all prepared catalysts. The surface Pt is increased after the addition of Zn and Ca. The ethylene selectivity increased significantly in the case of the PtSnZnCa catalysts compared to that of the PtSn catalysts. The main reason for this might be due to the interaction between Sn and Zn with Pt particles. According to the literature [34], alloying platinum with tin or zinc reduces the adsorption strength of ethylene, which restricts deep dehydrogenation and increases selectivity. The ethylene selectivity is also increased in the PtSnZnCa catalysts compared to the PtSn catalysts calcined in different atmospheres.
In addition, the catalyst stability increased with Zn and Ca addition. All catalytic experiments were performed for 10 h. The PtSn catalysts showed a decrease in ethane conversion over time. To better understand this trend, we calculated the deactivation parameter (kd) for all catalysts. Table 3 illustrates a comparison of catalytic activity between this study and previously reported Pt-based catalysts. The data in the table clearly demonstrate that some of the Pt-based systems exhibited effective performance at lower temperatures [13,39]. It is important to note that their enhanced performance was tested over relatively short time periods. Furthermore, certain literature sources indicate high catalyst stability, but the preparation of these catalysts is labor-intensive, and they are associated with high costs of metal precursors [1,44]. The deactivation parameter is low for the catalysts prepared in this work compared to many other catalysts reported in the literature (Table 3) [13,39,45,46,47]. The PtSn catalysts calcined in static air showed low deactivation compared to that of other catalysts. In addition, the deactivation is still low for the PtSnZnCa catalysts compared to that of the PtSn catalysts. The PtSnZnCa-SA catalyst showed the highest conversion and selectivity among all prepared catalysts.
The literature has reported that the activity for ethane dehydrogenation increases monotonically as the Pt particle size is in the range of 2–8 nm. This is because smaller Pt particles have a higher surface area to volume ratio, which provides more active sites for the reaction. Additionally, smaller Pt particles are more likely to be in a bimetallic state, which can also improve the catalytic activity [3,48]. This might be one of the reasons for the higher catalytic activity of PtSnZnCa-SA compared to the other catalysts. The PtSnZnCa-SA catalyst showed excellent stability in the long run, even at high temperatures, i.e., 625 °C.

3. Materials and Methods

3.1. Chemicals

All chemicals were purchased from Merck (Darmstadt, Germany), Fluka (Seelze, Germany), and Aldrich company (St. Louis, MO, USA). They were used without any additional purification. The chemicals PtCl4 (Aldrich), SnCl2 (Aldrich), CaCl2 (Merck), ZnCl2 (Panreac, Barcelona, Spain), and γ-Al2O3 (BASF, Ludwigshafen, Germany) were utilized in catalyst preparation. The 1% stock solutions were prepared for individual metal chloride precursors and used in catalyst preparation. The stock solutions were prepared by dissolving 1 g of metal chloride in 100 mL of deionized water.

3.2. Catalyst Preparation

A high-purity commercial γ-Al2O3 with a sieve size in the range of 300–600 microns was used as a support material, and it was calcined at 650 °C for 6 h in a conventional muffle furnace under static air. All the catalysts in this work were prepared by the wet impregnation method. For the preparation of 5 g of PtSn/γ-Al2O3 catalyst, 8.7 mL of 1% PtCl4 solution and 9.5 mL of 1% SnCl2 solution were taken from their stock solutions in a small beaker. This mixed solution was heated at 60 °C for 30 min under stirring conditions. Next, the mixed metal solution was added to the 4.9 g of calcined γ-Al2O3 support material for impregnation in a Buchi rotary evaporator. A nominal 1 wt% Pt and 1 wt% Sn were maintained in the catalyst. After completion of impregnation, the catalyst was dried at 110 °C for 6 h in a conventional oven. The prepared sample was divided into three portions and calcined at 600 °C for 6 h under static air, flowing air (100 mL/min), and N2 flow (100 mL/min), respectively. The calcined catalysts were denoted as PtSn-SA, PtSn-FA, and PtSn-N2, respectively. The PtSnZnCa/γ-Al2O3 catalyst was prepared by sequential impregnation method. At first, the calcined support material (γ-Al2O3) was impregnated with CaCl2. An appropriate amount of PtCl4 and ZnCl2 solutions were taken from their stock solutions in a small beaker and heated at 60 °C for 30 min under stirring conditions. Next, the mixed metal solution is added to the support material for impregnation. Similarly, PtCl4 and SnCl2 solutions were taken and heated at 60 °C for 30 min under stirring conditions. Finally, this mixed solution was added to the support material for impregnation. After the addition of all metal chloride precursors to the support, the catalyst was dried at 110 °C for 6 h in a conventional oven. The prepared sample was divided into three portions and calcined at 600 °C for 6 h under static air, flowing air (100 mL/min), and N2 flow (100 mL/min), respectively. The calcined catalysts were denoted as PtSnZnCa-SA, PtSnZnCa-FA, and PtSnZnCa-N2, respectively. In the prepared catalysts, the 1 wt% Pt, 1 wt% Sn, 1 wt% Zn, and 1 wt% Ca contents were maintained. A similar procedure was followed for the preparation of the PtSnZn/γ-Al2O3 and PtSnCa/γ-Al2O3 catalysts, and these catalysts were calcined at 600 °C for 6 h under static air. These catalysts are referred to as PtSnZn-SA and PtSnCa-SA, respectively.

3.3. Characterization

The surface area and pore size of the catalysts were measured using a Nova Station Quanta chrome instrument (Anton Paar, Boynton Beach, FL, USA) at −196 °C. Before analysis, all the samples were heated to 200 °C under vacuum for 2 h to remove any adsorbed impurities. The specific surface area and average pore diameter were then calculated from the nitrogen adsorption–desorption isotherms.
The structure of the catalyst was analyzed using XRD on an Inel Equinox 1000 diffractometer (Thermo Scientific, Waltham, MA, USA). A cobalt X-ray tube was used, operating at 40 kV and 30 mA with Cu Kα radiation (wavelength = 1.546 Å). The XRD pattern was collected over a range of diffraction angles from 10 to 115 degrees. The diffraction data were analyzed using Match Crystal Impact software (Match 1.11g) to identify the crystalline phases present in the catalyst.
A Micromeritics Auto-Chem 2950 instrument (Norcross, GA, USA) was employed to execute temperature-programmed reduction (TPR) fitted with a thermal conductivity detector (TCD). A sample of catalyst (about 150 mg) was charged in a quartz reactor and heated to 800 °C at a 10 °C per minute rate. A 10% H2 in argon mixed gas flowed over the catalyst at a rate of 50 mL per minute during the heating process.
XPS analysis tests were conducted using a high-vacuum multi-technique surface analysis system manufactured by Specs GmbH (Berlin, Germany). The instrument was furnished with an Mg-Kα X-ray source, emitting X-rays with an energy level of 1253.6 eV. In accordance with standard XPS procedures, the binding energy reference for charge correction was established using the adventitious hydrocarbon C 1s line, which registers at 284.8 eV and corresponds to the C-C bond.
NH3-TPD analysis was carried out on an Auto-Chem 2950 instrument. Before the TPD experiment, 100 milligrams of calcined catalyst was reduced in a 10% H2 in argon gas mixture at 600 °C for two hours. Then, the temperature was lowered to 50 °C in a flow of helium gas. After cooling, 10% ammonia in helium gas flowed over the catalyst bed at 50 °C for 1 h. Next, the catalyst was purged with helium gas, and the reactor temperature was raised to 800 °C at a rate of 10 °C per minute.
A Tecnai G2 F20 Super-Twin transmission electron microscope (TEM, FEI, Hillsboro, OR, USA) operating at 200 kV with an LaB6 electron source was used to analyze the catalysts. The microscope was equipped with an EDX detector for elemental analysis and a high-angle annular dark-field detector for scanning transmission electron microscopy (STEM) imaging.

3.4. Catalytic Performance Test

The performance of catalysts for ethane dehydrogenation was evaluated in a fixed-bed quartz microreactor (outer diameter 9 mm) using 0.5 g of catalyst. The catalyst was activated in a mixed gas of hydrogen and nitrogen (volume ratio 3:1) at 600 °C for 3 h prior to measurement. The reactor system was then heated to 625 °C and purged with nitrogen. A gas mixture of nitrogen, ethane, and hydrogen in a ratio of 3.6:1:0.4 was fed into the reactor at a space velocity of 3000 h−1. An Agilent 7890B gas chromatograph (GC, Santa Clara, CA, USA) fitted with flame ionization (FID) and TCD detectors was used to analyze the reaction products and unconverted reactants.
The following equations were used to calculate the overall ethane conversion and selectivity of C2H4 and CH4:
C 2 H 6 conversion % = C 2 H 6 in C 2 H 6 out C 2 H 6 in × 100
C 2 H 4 Selectivity   % = C 2 H 4 C 2 H 4 + 0.5 CH 4 × 100
CH 4 selectivity % = 0.5 CH 4 C 2 H 4 + 0.5 CH 4 × 100
where [C2H6]in and [C2H6]out are the concentrations of ethane at the inlet and outlet of the reactor, respectively. [C2H4] and [CH4] are the concentrations of ethylene and methane in the outlet gas. The error bounds were observed ±2% for the ethane conversion and ±0.5% for ethylene selectivity, which were established by repeating the catalyst synthesis and catalytic tests multiple times.
The deactivation rate constant (kd) was determined by assuming a first-order deactivation mechanism. To calculate the deactivation rate constant, the following equation is used:
k d h 1 = ln 1 X end X end   ln ( 1 X start X start ) t
where Xstart and Xend denote the conversion at the beginning and end of the experiment, respectively, and t is the duration of the experiment in hours.

4. Conclusions

PtSn/Al2O3 and PtSnZnCa/Al2O3 catalysts were prepared by impregnation method for use in ethane dehydrogenation. The impact of the calcination atmosphere on the catalytic characteristics of PtSn/Al2O3 and PtSnZnCa/Al2O3 catalysts for ethane dehydrogenation was investigated. The catalysts were pretreated in static air, flowing air, and in a N2 atmosphere. The PtSn/Al2O3 catalyst calcined in static air exhibits higher activity for ethane dehydrogenation than the catalyst calcined in flowing air and in the N2 atmosphere. The surface-active Pt species are high in the catalyst calcined in static air. The NH3-TPD results suggest that the acidic sites are effectively suppressed in the catalyst calcined in the static air atmosphere. The TEM and elemental mapping showed that the catalyst calcined in the static air atmosphere is beneficial for the formation of small Pt and Sn particles. The ethylene selectivity increased to 99% with the addition of Zn and Ca to the PtSn/Al2O3 catalyst. The PtSnZnCa/Al2O3 catalyst showed the highest activity among all the prepared catalysts at high temperatures. This enhanced performance is attributed to strong interactions between Pt and the promoter in the catalysts pretreated in static air. In contrast, catalyst calcination under flowing air or N2 gas negatively impacts the Pt dispersion. The deactivation rate is very low for PtSnZnCa/Al2O3 catalyst calcined in the static air atmosphere.

Supplementary Materials

The following supporting information can be downloaded at https://www.mdpi.com/article/10.3390/catal14050312/s1. Table S1: Surface area results of used catalysts. Figure S1: (A) Nitrogen adsorption–desorption isotherms, (B) pore-size distribution of calcined Al2O3 support. Figure S2: Pore size distribution curves of the calcined catalysts: a. PtSn-FA, b. PtSn-N2, c. PtSn-SA, d. PtSnZnCa-FA, e. PtSnZnCa-N2, f. PtSnZnCa-SA. Figure S3: X-ray diffraction patterns of used catalysts: a. PtSn-FA, b. PtSn-N2, c. PtSn-SA, d. PtSnZnCa-FA, e. PtSnZnCa-N2, f. PtSnZnCa-SA. Figure S4. XPS survey spectra of all calcined catalysts: a. PtSn-FA, b. PtSn-N2, c. PtSn-SA, d. PtSnZnCa-FA, e. PtSnZnCa-N2, f. PtSnZnCa-SA. Figure S5. Activity results for ethane dehydrogenation at 625°C: (A) PtSnZn-SA (B) PtSnCa-SA.

Author Contributions

Conceptualization, S.P. and A.A.A.-Z.; methodology, M.A.D.; validation, S.P.; investigation, A.A.A.-Z.; resources, H.A.; data curation, S.P.; writing—original draft preparation, S.P.; writing—review and editing, H.A.; visualization, A.A.A.-Z.; supervision, S.P.; project administration, S.P.; funding acquisition, S.P., A.A.A.-Z., M.A.D. and H.A. All authors have read and agreed to the published version of the manuscript.

Funding

This research work was funded by the Ministry of Education and King Abdulaziz University, DSR, through Institutional Fund Projects under grant No. IFPHI-281-135-2020.

Data Availability Statement

Data are contained within the article and Supplementary Materials.

Acknowledgments

The authors gratefully acknowledge technical and financial support from the Ministry of Education and King Abdulaziz University, DSR, Jeddah, Saudi Arabia, for funding this research work by Institutional Fund Projects under grant No. IFPHI-281-135-2020.

Conflicts of Interest

The authors declare no conflicts of interest.

References

  1. Li, X.; Zhou, Y.; Qiao, B.; Pan, X.; Wang, C.; Cao, L. Enhanced stability of Pt/Al2O3 modified by Zn promoter for catalytic dehydrogenation of ethane. J. Energy Chem. 2020, 51, 14–20. [Google Scholar] [CrossRef]
  2. Wang, Y.; Hu, P.; Yang, J.; Zhu, Y.-A.; Chen, D. C–H bond activation in light alkanes: A theoretical perspective. Chem. Soc. Rev. 2021, 50, 4299–4358. [Google Scholar] [CrossRef] [PubMed]
  3. Wu, J.; Peng, Z.; Bell, A.T. Effects of composition and metal particle size on ethane dehydrogenation over PtxSn100−x/Mg (Al) O (70 ≤ x ≤ 100). J. Catal. 2014, 311, 161–168. [Google Scholar] [CrossRef]
  4. Shee, D.; Sayari, A. Light alkane dehydrogenation over mesoporous Cr2O3/Al2O3 catalysts. Appl. Catal. A Gen. 2010, 389, 155–164. [Google Scholar] [CrossRef]
  5. Melnikov, D.; Novikov, A.; Glotov, A.; Reshetina, M.; Smirnova, E.; Wang, H. Dehydrogenation of Light Alkanes (A Review). Pet. Chem. 2022, 62, 1027–1046. [Google Scholar] [CrossRef]
  6. Wang, L.-C.; Zhang, Y.; Xu, J.; Diao, W.; Karakalos, S.; Liu, B. Non-oxidative dehydrogenation of ethane to ethylene over ZSM-5 zeolite supported iron catalysts. Appl. Catal. B Environ. 2019, 256, 117816. [Google Scholar] [CrossRef]
  7. Iizuka, T.; Miura, T.; Sano, M.; Hayashi, T.; Hanaya, M.; Miyake, T. Dehydrogenation of ethane to ethylene on Pt/zincosilicate. Catal. Today 2023, 410, 231–236. [Google Scholar] [CrossRef]
  8. Guo, H.; Miao, C.; Hua, W.; Yue, Y.; Gao, Z. Cobaltous oxide supported on MFI zeolite as an efficient ethane dehydrogenation catalyst. Microporous Mesoporous Mater. 2021, 312, 110791. [Google Scholar] [CrossRef]
  9. Shin, H.H.; McIntosh, S. Proton-conducting perovskites as supports for Cr catalysts in short contact time ethane dehydrogenation. ACS Catal. 2015, 5, 95–103. [Google Scholar] [CrossRef]
  10. Iglesias-Juez, A.; Beale, A.M.; Maaijen, K.; Weng, T.C.; Glatzel, P.; Weckhuysen, B.M. A combined in situ time-resolved UV–Vis, Raman and high-energy resolution X-ray absorption spectroscopy study on the deactivation behavior of Pt and PtSn propane dehydrogenation catalysts under industrial reaction conditions. J. Catal. 2010, 276, 268–279. [Google Scholar] [CrossRef]
  11. Pham, H.N.; Sattler, J.J.; Weckhuysen, B.M.; Datye, A.K. Role of Sn in the regeneration of Pt/γ-Al2O3 light alkane dehydrogenation catalysts. ACS Catal. 2016, 6, 2257–2264. [Google Scholar] [CrossRef] [PubMed]
  12. Wegener, E.C.; Wu, Z.; Tseng, H.-T.; Gallagher, J.R.; Ren, Y.; Diaz, R.E. Structure and reactivity of Pt–In intermetallic alloy nanoparticles: Highly selective catalysts for ethane dehydrogenation. Catal. Today 2018, 299, 146–153. [Google Scholar] [CrossRef]
  13. Zhang, Q.; Zhang, K.; Zhang, S.; Liu, Q.; Chen, L.; Li, X. Ga3+-stabilized Pt in PtSn-Mg (Ga)(Al) O catalyst for promoting ethane dehydrogenation. J. Catal. 2018, 368, 79–88. [Google Scholar] [CrossRef]
  14. Searles, K.; Chan, K.W.; Mendes Burak, J.A.; Zemlyanov, D.; Safonova, O.; Copéret, C. Highly productive propane dehydrogenation catalyst using silica-supported Ga–Pt nanoparticles generated from single-sites. J. Am. Chem. Soc. 2018, 140, 11674–11679. [Google Scholar] [CrossRef]
  15. Wu, J.; Sharada, S.M.; Ho, C.; Hauser, A.W.; Head-Gordon, M.; Bell, A.T. Ethane and propane dehydrogenation over PtIr/Mg (Al) O. Appl. Catal. A Gen. 2015, 506, 25–32. [Google Scholar] [CrossRef]
  16. Marcinkowski, M.D.; Darby, M.T.; Liu, J.; Wimble, J.M.; Lucci, F.R.; Lee, S. Pt/Cu single-atom alloys as coke-resistant catalysts for efficient C–H activation. Nat. Chem 2018, 10, 325–332. [Google Scholar] [CrossRef] [PubMed]
  17. Ren, G.-Q.; Pei, G.-X.; Ren, Y.-J.; Liu, K.-P.; Chen, Z.-Q.; Yang, J.-Y. Effect of group IB metals on the dehydrogenation of propane to propylene over anti-sintering Pt/MgAl2O4. J. Catal. 2018, 366, 115–126. [Google Scholar] [CrossRef]
  18. Ali, A.M.; Zahrani, A.A.; Daous, M.A.; Podila, S.; Alshehri, M.K.; Rather, S.-U. Sequential and/or Simultaneous Wet-Impregnation Impact on the Mesoporous Pt/Sn/Zn/γ-Al2O3 Catalysts for the Direct Ethane Dehydrogenation. J. Nanomater. 2022, 2022, 8739993. [Google Scholar] [CrossRef]
  19. Hook, A.; Massa, J.D.; Celik, F.E. Effect of tin coverage on selectivity for ethane dehydrogenation over platinum–tin alloys. J. Phys. Chem. C 2016, 120, 27307–27318. [Google Scholar] [CrossRef]
  20. Liu, Y.; Zong, X.; Patra, A.; Caratzoulas, S.; Vlachos, D.G. Propane Dehydrogenation on PtxSny (x, y ≤ 4) Clusters on Al2O3(110). ACS Catal. 2023, 13, 2802–2812. [Google Scholar] [CrossRef]
  21. Qiu, B.; Zhang, Y.; Liu, Y.; Zhang, Y. The state of Pt active phase and its surrounding environment during dehydrogenation of ethane to ethylene. Appl. Surf. Sci. 2021, 554, 149611. [Google Scholar] [CrossRef]
  22. Kwak, J.H.; Hu, J.; Mei, D.; Yi, C.-W.; Kim, D.H.; Peden, C.H. Coordinatively unsaturated Al3+ centers as binding sites for active catalyst phases of platinum on γ-Al2O3. Science 2009, 325, 1670–1673. [Google Scholar] [CrossRef]
  23. Naseri, M.; Tahriri Zangeneh, F.; Taeb, A. Effects of Mg, Ca, and K Addition on Pt-Sn/γ-Al2O3 for Propane Dehydrogenation. Iran. J. Chem. Chem. Eng. 2022, 41, 1921–1931. [Google Scholar]
  24. Siri, G.J.; Bertolini, G.R.; Casella, M.L.; Ferretti, O.A. PtSn/γ-Al2O3 isobutane dehydrogenation catalysts: The effect of alkaline metals addition. Mater. Lett. 2005, 59, 2319–2324. [Google Scholar] [CrossRef]
  25. Long, L.-L.; Lang, W.-Z.; Liu, X.; Hu, C.-L.; Chu, L.-F.; Guo, Y.-J. Improved catalytic stability of PtSnIn/xCa–Al catalysts for propane dehydrogenation to propylene. Chem. Eng. J. 2014, 257, 209–217. [Google Scholar] [CrossRef]
  26. Huizinga, T.; Blik, H.v.T.; Vis, J.; Prins, R. XPS investigations of Pt and Rh supported on γ-Al2O3 and TiO2. Surf Sci. 1983, 135, 580–596. [Google Scholar] [CrossRef]
  27. Rimaz, S.; Chen, L.; Kawi, S.; Borgna, A. Promoting effect of Ge on Pt-based catalysts for dehydrogenation of propane to propylene. Appl. Catal. A Gen. 2019, 588, 117266. [Google Scholar] [CrossRef]
  28. Virnovskaia, A.; Jørgensen, S.; Hafizovic, J.; Prytz, Ø.; Kleimenov, E.; Hävecker, M. In situ XPS investigation of Pt (Sn)/Mg (Al) O catalysts during ethane dehydrogenation experiments. Surf. Sci. 2007, 601, 30–43. [Google Scholar] [CrossRef]
  29. Seo, H.; Lee, J.K.; Hong, U.G.; Park, G.; Yoo, Y.; Lee, J. Direct dehydrogenation of n-butane over Pt/Sn/M/γ-Al2O3 catalysts: Effect of third metal (M) addition. Catal. Commun. 2014, 47, 22–27. [Google Scholar] [CrossRef]
  30. Bai, L.; Zhou, Y.; Zhang, Y.; Liu, H.; Sheng, X.; Duan, Y. Effect of calcination atmosphere on the catalytic properties of PtSnNaMg/ZSM-5 for propane dehydrogenation. Catal. Commun. 2009, 10, 2013–2017. [Google Scholar] [CrossRef]
  31. Bocanegra, S.A.; Zgolicz, P.D.; Scelza, O.A.; de Miguel, S.R. New trimetallic catalysts supported on coprecipitated MgAl2O4 for n-paraffins selective dehydrogenation processes. Catal. Commun. 2009, 10, 1463–1466. [Google Scholar] [CrossRef]
  32. Jang, E.J.; Lee, J.; Jeong, H.Y.; Kwak, J.H. Controlling the acid-base properties of alumina for stable PtSn-based propane dehydrogenation catalysts. Appl. Catal. A Gen. 2019, 572, 1–8. [Google Scholar] [CrossRef]
  33. Fang, S.; Zhang, K.; Wang, C.; Ma, L.; Zhang, Q.; Liu, Q. The properties and catalytic performance of PtSn/Mg (x-Ga) AlO catalysts for ethane dehydrogenation. RSC Adv. 2017, 7, 22836–22844. [Google Scholar] [CrossRef]
  34. Sattler, J.J.; Ruiz-Martinez, J.; Santillan-Jimenez, E.; Weckhuysen, B.M. Catalytic dehydrogenation of light alkanes on metals and metal oxides. Chem. Rev. 2014, 114, 10613–10653. [Google Scholar] [CrossRef]
  35. Garidzirai, R.; Modisha, P.; Shuro, I.; Visagie, J.; van Helden, P.; Bessarabov, D. The effect of Mg and Zn dopants on Pt/Al2O3 for the dehydrogenation of perhydrodibenzyltoluene. Catalysts 2021, 11, 490. [Google Scholar] [CrossRef]
  36. Housmans, T.H.M.; Wonders, A.H.; Koper, M.T.M. Structure Sensitivity of Methanol Electrooxidation Pathways on Platinum: An On-Line Electrochemical Mass Spectrometry Study. J. Phys. Chem. B 2006, 110, 10021–10031. [Google Scholar] [CrossRef]
  37. Zhao, Y.; Chen, L.; Meng, Y. The Fabrication of Pt/Co Nanocomposite Supported on Reduced Graphene Oxide for Methanol Oxidation. Int. J. Electrochem. Sci. 2019, 14, 6826–6839. [Google Scholar] [CrossRef]
  38. Lee, M.-H.; Nagaraja, B.M.; Lee, K.Y.; Jung, K.-D. Dehydrogenation of alkane to light olefin over PtSn/θ-Al2O3 catalyst: Effects of Sn loading. Catal. Today 2014, 232, 53–62. [Google Scholar] [CrossRef]
  39. Galvita, V.; Siddiqi, G.; Sun, P.; Bell, A.T. Ethane dehydrogenation on Pt/Mg (Al) O and PtSn/Mg (Al) O catalysts. J. Catal. 2010, 271, 209–219. [Google Scholar] [CrossRef]
  40. Lin, L.; Yang, W.; Jia, J.; Xu, Z.; Zhang, T.; Fan, Y. Surface structure and reaction performances of highly dispersed and supported bimetallic catalysts. Sci. China Ser. B Chem. 1999, 42, 571–580. [Google Scholar] [CrossRef]
  41. Borges, L.R.; Lopez-Castillo, A.; Meira, D.M.; Gallo, J.M.R.; Zanchet, D.; Bueno, J.M.C. Effect of the Pt precursor and loading on the structural parameters and catalytic properties of Pt/Al2O3. ChemCatChem 2019, 11, 3064–3074. [Google Scholar] [CrossRef]
  42. Marceau, E.; Lauron-Pernot, H.; Che, M. Influence of the metallic precursor and of the catalytic reaction on the activity and evolution of Pt (Cl)/δ-Al2O3 catalysts in the total oxidation of methane. J. Catal. 2001, 197, 394–405. [Google Scholar] [CrossRef]
  43. Borg, Ø.; Blekkan, E.A.; Eri, S.; Akporiaye, D.; Vigerust, B.; Rytter, E. Effect of calcination atmosphere and temperature on γ-Al2O3 supported cobalt Fischer-Tropsch catalysts. Top. Catal. 2007, 45, 39–43. [Google Scholar] [CrossRef]
  44. Cybulskis, V.J.; Bukowski, B.C.; Tseng, H.-T.; Gallagher, J.R.; Wu, Z.; Wegener, E. Zinc promotion of platinum for catalytic light alkane dehydrogenation: Insights into geometric and electronic effects. ACS Catal. 2017, 7, 4173–4181. [Google Scholar] [CrossRef]
  45. Siddiqi, G.; Sun, P.; Galvita, V.; Bell, A.T. Catalyst performance of novel Pt/Mg (Ga)(Al) O catalysts for alkane dehydrogenation. J. Catal. 2010, 274, 200–206. [Google Scholar] [CrossRef]
  46. Wu, Z.; Wegener, E.C.; Tseng, H.-T.; Gallagher, J.R.; Harris, J.W.; Diaz, R.E. Pd–In intermetallic alloy nanoparticles: Highly selective ethane dehydrogenation catalysts. Catal. Sci. Technol. 2016, 6, 6965–6976. [Google Scholar] [CrossRef]
  47. Ji, Z.; Lv, H.; Pan, X.; Bao, X. Enhanced ethylene selectivity and stability of Mo/ZSM5 upon modification with phosphorus in ethane dehydrogenation. J. Catal. 2018, 361, 94–104. [Google Scholar] [CrossRef]
  48. Rioux, R.; Song, H.; Hoefelmeyer, J.; Yang, P.; Somorjai, G. High-surface-area catalyst design: Synthesis, characterization, and reaction studies of platinum nanoparticles in mesoporous SBA-15 silica. J. Phys. Chem. B 2005, 109, 2192–2202. [Google Scholar] [CrossRef]
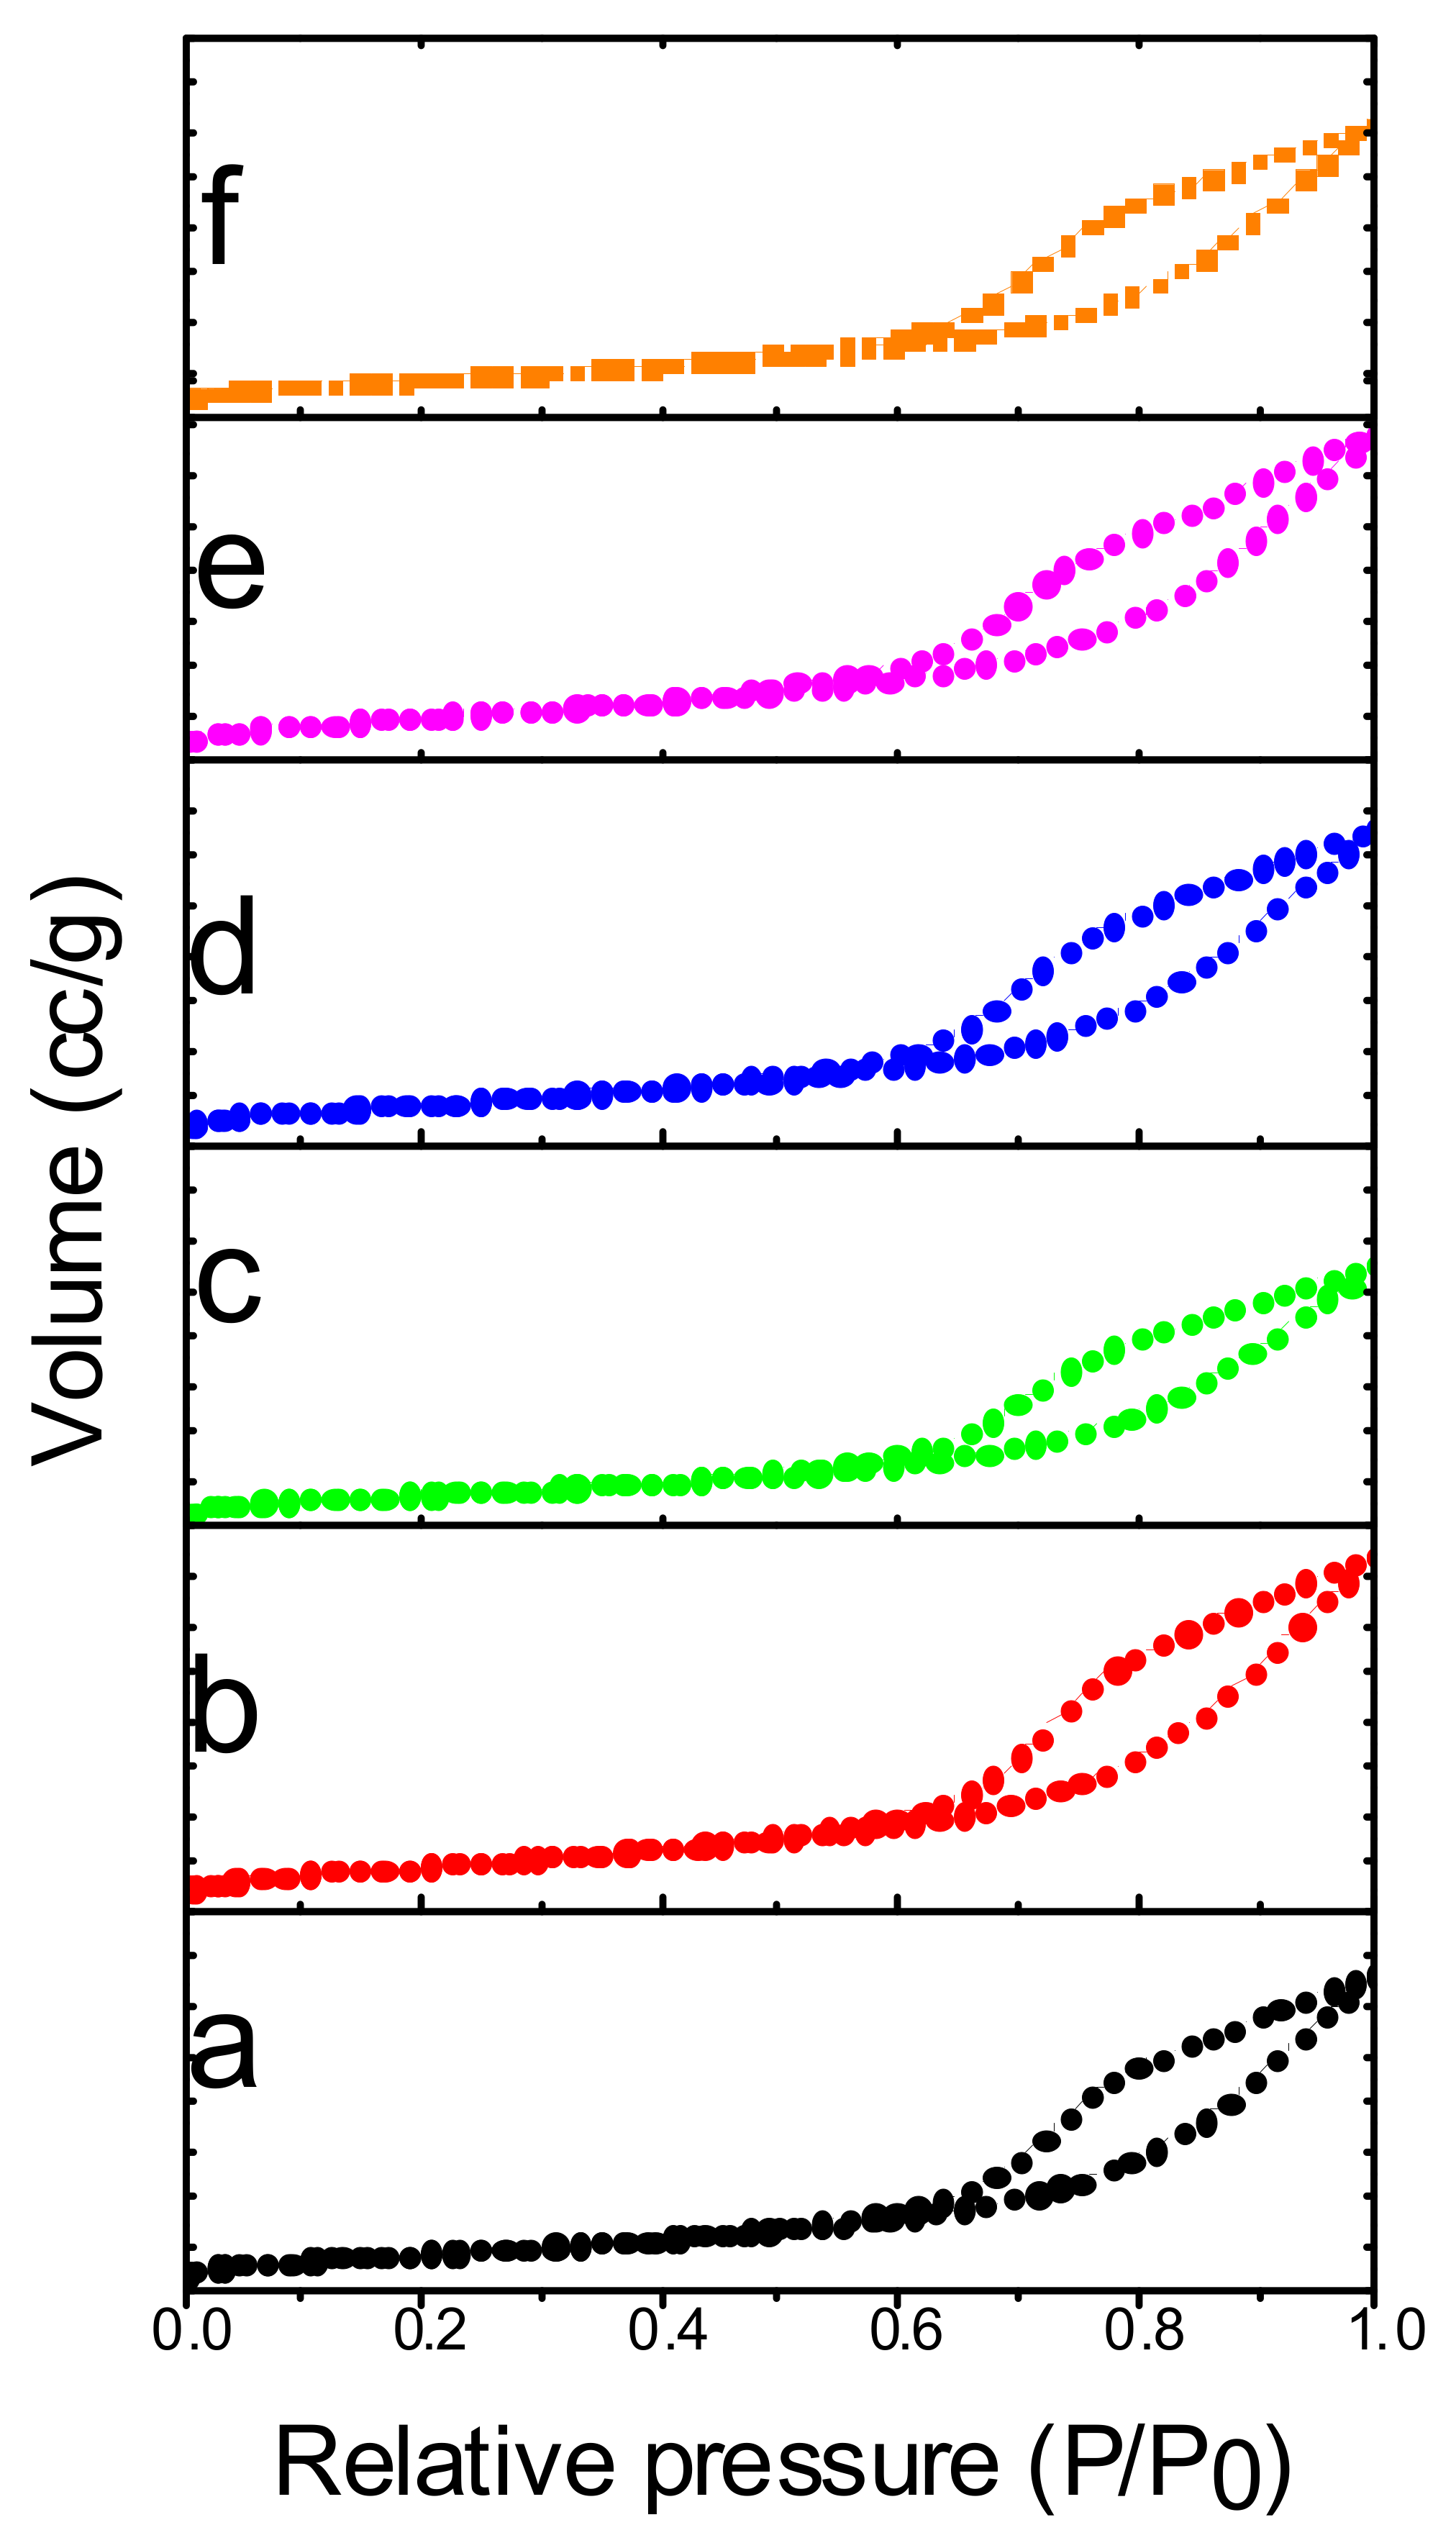
Figure 1. Nitrogen adsorption–desorption isotherms of calcined catalysts: (a) PtSn-FA, (b) PtSn-N2, (c) PtSn-SA, (d) PtSnCaZn-FA, (e) PtSnCaZn-N2, and (f) PtSnCaZn-SA.
Catalysts 14 00312 g001
Figure 2. X-ray diffraction patterns of calcined catalysts: (a) PtSn-FA, (b) PtSn-N2, (c) PtSn-SA, (d) PtSnZnCa-FA, (e) PtSnZnCa-N2, and (f) PtSnZnCa-SA.
Catalysts 14 00312 g002
Figure 3. XPS patterns in Pt 4d5/2 region of all calcined catalysts: (a) PtSn-FA, (b) PtSn-N2, (c) PtSn-SA, (d) PtSnZnCa-FA, (e) PtSnZnCa-N2, and (f) PtSnZnCa-SA.
Catalysts 14 00312 g003
Figure 4. XPS patterns in Sn3d region of all calcined catalysts: (a) PtSn-FA, (b) PtSn-N2, (c) PtSn-SA, (d) PtSnZnCa-FA, (e) PtSnZnCa-N2, and (f) PtSnZnCa-SA.
Catalysts 14 00312 g004
Figure 5. TPR analysis of catalysts calcined in different atmospheres: (a) PtSn-FA, (b) PtSn-N2, (c) PtSn-SA, (d) PtSnZnCa-FA, (e) PtSnZnCa-N2, and (f) PtSnZnCa-SA.
Catalysts 14 00312 g005
Figure 6. NH3-TPD analysis of (A) PtSn, (B) PtSnZnCa catalysts calcined in different atmospheres.
Catalysts 14 00312 g006
Figure 7. TEM images of calcined catalysts: (A) PtSn-SA, (B) PtSn-FA, and (C) PtSn-N2 catalysts.
Catalysts 14 00312 g007
Figure 8. STEM elemental mapping analysis of (A) PtSn-SA, (B) PtSn-FA, and (C) PtSn-N2 catalysts.
Catalysts 14 00312 g008aCatalysts 14 00312 g008b
Figure 9. TEM and HRTEM images of calcined PtSnZnCa-SA catalyst.
Catalysts 14 00312 g009
Figure 10. Activity results for different catalysts for ethane dehydrogenation at 625 °C and atmospheric pressure: (A) ethane conversion vs. time on stream and (B) ethylene selectivity vs. time on stream.
Catalysts 14 00312 g010
Figure 11. Activity results for different catalysts calcined in static air for ethane dehydrogenation at 625 °C and atmospheric pressure.
Catalysts 14 00312 g011
Table 1. Physico-chemical properties of catalysts.
CatalystSurface Area (m2/g)H2 Consumption
(µmol g−1) a
Total Acidity
(µmol g−1)
<125 °C>340 °C
Al2O3186.7-300.1228.8
PtSn-N2179.818.7159.878.4
PtSn-SA134.729.9137.767.1
PtSn-FA159.525.4160.599.6
PtSnZnCa-N2178.417.8195.147.0
PtSnZnCa-SA151.929.2176.828.1
PtSnZnCa-FA165.024.1200.635.2
a H2 consumption calculated from the 100 to 700 °C range.
Table 2. XPS surface atomic percentage of calcined catalysts.
CatalystAl 2sPt 4d5/2Sn 3d5/2O 1sCl 2pCa 2pZn 2p3/2
PtSn-FA29.310.0510.28569.5970.757--
PtSn-N230.260.0230.25468.7260.734--
PtSn-SA29.960.0570.29768.8720.812--
PtSnZnCa-FA29.540.0490.29567.9921.240.6310.259
PtSnZnCa-N228.480.0490.29869.1811.110.5780.306
PtSnZnCa-SA30.200.0620.38367.6090.8880.5930.262
Table 3. Comparison of activity and deactivation parameter of catalysts for ethane dehydrogenation.
CatalystMetal Loading (wt%)Temp. (°C)WHSV a (h−1)Conver. (%)Select. (%)kd
(h−1)
Reaction Time
(h)
Ref.
PtSn-N216250.86.495.50.03310This study
PtSn-SA16250.819.095.00.0210This study
PtSn-FA16250.815.095.00.02310This study
PtSnZnCa-N216250.817.099.10.01310This study
PtSnZnCa-SA16250.824.099.00.00610This study
PtSnZnCa-FA16250.813.099.10.02810This study
PtZn2/Al2O30.26001.219.098.00.00370[1]
PtZn/SiO29.7600--100.00.08518[44]
PtSn/Mg(Ga)(Al)O0.5550-25.0100.00.1442.2[13]
Pt3Ir/Mg(Al)O1.96003.415.095.00.6490.5[15]
PtSn/Mg(Al)O0.860012.520.099.00.8621.7[39]
Pt/Mg(Ga)(Al)O1600398.0100.00.0132[45]
Pt/Zinc silicate15509.614.0100.00.003[7]
PdIn/SiO22 Pd6000.215.0100.00.1935.8[46]
P-Mo/ZSM54.7 Mo6000.6720.070.00.8764.3[47]
a Ethane weight hourly space velocity.
Disclaimer/Publisher’s Note: The statements, opinions and data contained in all publications are solely those of the individual author(s) and contributor(s) and not of MDPI and/or the editor(s). MDPI and/or the editor(s) disclaim responsibility for any injury to people or property resulting from any ideas, methods, instructions or products referred to in the content.