Article

Kinetics of Electrocatalytic Oxygen Reduction Reaction over an Activated Glassy Carbon Electrode in an Alkaline Medium

by
Munira Siddika
1,
Nazmul Hosen
2,
Raed H. Althomali
3,
Jehan Y. Al-Humaidi
4,*,
Mohammed M. Rahman
5 and
Mohammad A. Hasnat
1,*
1
Electrochemistry & Catalysis Research Laboratory (ECRL), Department of Chemistry, School of Physical Sciences, Shahjalal University of Science and Technology, Sylhet 3114, Bangladesh
2
Department of Chemistry and Biochemistry, The University of Southern Mississippi, Hattiesburg, MS 39406, USA
3
Department of Chemistry, College of Art and Science, Prince Sattam bin Abdulaziz University, Wadi Al-Dawasir 11991, Saudi Arabia
4
Department of Chemistry, College of Science, Princess Nourah bint Abdulrahman University, P.O. Box 84428, Riyadh 11671, Saudi Arabia
5
Center of Excellence for Advanced Materials Research (CEAMR) & Chemistry Department, Faculty of Science, King Abdulaziz University, Jeddah 21589, Saudi Arabia
*
Authors to whom correspondence should be addressed.
Catalysts 2024, 14(3), 164; https://doi.org/10.3390/catal14030164
Submission received: 19 January 2024 / Revised: 12 February 2024 / Accepted: 17 February 2024 / Published: 23 February 2024
(This article belongs to the Section Computational Catalysis)

Abstract

:
Hydrogen peroxide is a promising substitute for fossil fuels because it produces non-hazardous by-products. In this work, a glassy carbon GC was anodized in sulphuric acid at +1.8 V to prepare the working electrode. It was utilized to investigate the oxygen reduction reaction (ORR) in a basic medium containing 0.1 M NaOH as a supporting electrolyte. The objective of this investigation was to synthesize hydrogen peroxide. X-ray photoelectron spectroscopy (XPS), electrochemical impedance spectroscopy (EIS), linear polarization, cyclic voltammetry (CV), and rotating disk electrode voltammetry (RDE) were performed for characterization and investigation of the catalytic properties. The RDE analysis confirmed that oxygen reduction reactions followed two electrons’ process at an activated GC electrode. Hence, the prepared electrode generated hydrogen peroxide from molecular oxygen at a potential of around −0.35 V vs. Ag/AgCl (sat. KCl), significantly lower than the pristine GC surface. The transfer coefficient, standard reduction potential, and standard rate constant were estimated to be 0.75, −0.27 V, and 9.5 × 10⁻³ cm s−1, respectively.

Graphical Abstract

1. Introduction

The ORR is of utmost significance for converting and producing electrochemical energy in fuel cells, metal-air batteries, corrosion, microbial fuel cells, and various other industrial processes [1,2,3,4,5,6]. It continues to be a challenge to explore the mechanistic pathway of the ORR because of its complex kinetics and to find cheaper electrocatalysts. ORR is a multi-electron reaction that may involve various elementary steps involving different intermediates. In recent years, much research has been conducted on designing new catalysts to attain ORR in acidic and alkaline media. However, alkaline pH across the electrode-surface interface imparts a surface-independent outer sphere electron transfer process [7]. Moreover, alkaline media instigates faster electron transfer kinetics in ORR and confers enhanced catalyst stability by reducing corrosion compared to an acidic medium. The increasing interest in alkaline hydrogen fuel cells, alkaline metal-air batteries, and alkaline direct alcohol (methanol, ethanol) fuel cells have instigated scientists to develop ORR electrocatalysts suitable for alkaline media. Note that when molecular oxygen is reduced cathodically, it either happens via a series pathway (route 1, Equations (1) and (2)) or a direct pathway (route 2, Equation (3)) in the alkaline solution [3].
Route 1:
O 2 + H 2 O + 2 e H O 2 + O H
H O 2 + H 2 O + 2 e 3 O H
Route 2:
O 2 + 2 H 2 O + 4 e 4 O H
Numerous cathodic materials have been developed for efficient ORR, including metal, metal oxide, alloy, and non-metal. However, researchers are continuously concerned with suitable replacements because of the high cost, lack of reproducibility, non-stability, and low efficiency [5,6,7,8,9,10,11,12,13,14].
The glassy carbon electrode (GCE) is one of the cheapest available electrodes in this connection. As a GCE electrode exhibits sluggish ORR kinetics, many articles have been published related to ORR where, in most cases, the GCE surface has been covered with various nanomaterials [15,16,17,18,19,20]. The faster ORR kinetics directly over a GCE surface at various pH, however, can be attained by treating it with anthraquinone derivative according to Seinberg et al. [20]. Meanwhile, an approach was taken to oxidize a GC electrode with a high amplitude of over-voltage (even up to 250 V pulse) to stimulate the ORR process [21]. As far as we know, no other approach has been suggested to activate a GCE surface to enhance ORR kinetics in an alkaline medium other than these approaches. It is important to note that an electrode surface must be cleaned before applying an electrochemical application, especially by electrochemical procedure. There is no established procedure for cleaning GC in this connection, even though most of its electrocatalytic capabilities are surface-state dependent. Later, the cleaned electrode is either directly employed or its surface is often modified with other materials for studying desired electrochemical studies [22,23,24,25,26,27,28]. A GC electrode is subjected to potential scanning to a specific positive potential (+1.8 V) in the case of electrochemical modification and stabilization [29,30,31]. All the carbon atoms on the surface of a GC electrode are sp2 hybridized in C-C bonds. Therefore, there is a great possibility that the GCE will be functionalized while the electrode is being positively scanned. Such a functionalized state of the GC surface may influence various electrocatalytic reactions, including ORR. Several articles have reported that GCE electrodes exhibit slow kinetics towards ORR and hydrogen peroxide is the final product [4,7,8]. Therefore, the primary objective is to investigate the kinetics of ORR by activated GC and determine if the kinetics are slower or faster than those of pristine GC. In this study, we activated a GCE in an acidic medium by anodic scanning and reported how the functionalized GCE affected the kinetics of ORR in the alkaline medium.

2. Results and Discussion

2.1. Spectral Characterization

Figure 1a displays the XPS spectra of a pristine GC surface, locating the positions of C-C, C-O, and C=O components in terms of binding energy. Three peaks at binding energies 284.5 eV, 285.5 eV, and 288.6 eV were investigated, resembling functional groups C-C, C-O, and C=O, respectively [32,33,34,35,36]. The XPS of C1s on GC surfaces after activating the surfaces at potentials of 0, 0.5, 1.0, 1.5, and 1.8 V are shown in Figure S1, and the corresponding growth of C-C, C-O, and C=O components in terms of the signal ratio of anodized to pristine GCE (Sa/Sp) is shown in Figure 1b. In addition, the intensity of C-C bonds decreased as the activation potential increased. At the same time, the proportion of C=O bonds significantly increased. Yet, the ratio of the C-O bond essentially did not changed at any applied voltage. So, it can be inferred from the XPS analysis that, simply by applying a positive voltage, the carbon atoms on the surface of the GC oxidized and formed more C=O bonds. The formation of C=O bonds on GCE may influence the ORR kinetics.

2.2. OCP and EIS Analyses

The linear polarization of pristine and activated GC in basic media is shown in Figure 2A. In the case of a pristine GC, the open circuit potential was observed as −0.22 V, while for an activated GC, it was found to be −0.09 V. This observation is consistent with the XPS analysis. The development of C=O bonds over the GCE surface made the electrode shift OCP to the positive potential. The shifting of OCP to a positive direction may decrease the potential of electrode-to-solution electron transfer. To support this assumption, EIS spectra of O2-saturated 0.1 M NaOH solution were recorded at a potential of −0.4 V using both electrodes, as shown in Figure 2B. In EIS spectra, the diameter of the semicircle corresponds to the charge transfer resistance (Rct). As a result, the Rct rises as the semicircle’s diameter rises. With circuit fittings, the Rct value was evaluated to be 2.58 MW for a pristine GCE, whereas, for an activated GC, it had a value of 76.62 kW. This result implies that the charge transfer via the activated GC surface was facile at the same provable ORR potential.

2.3. Catalysis

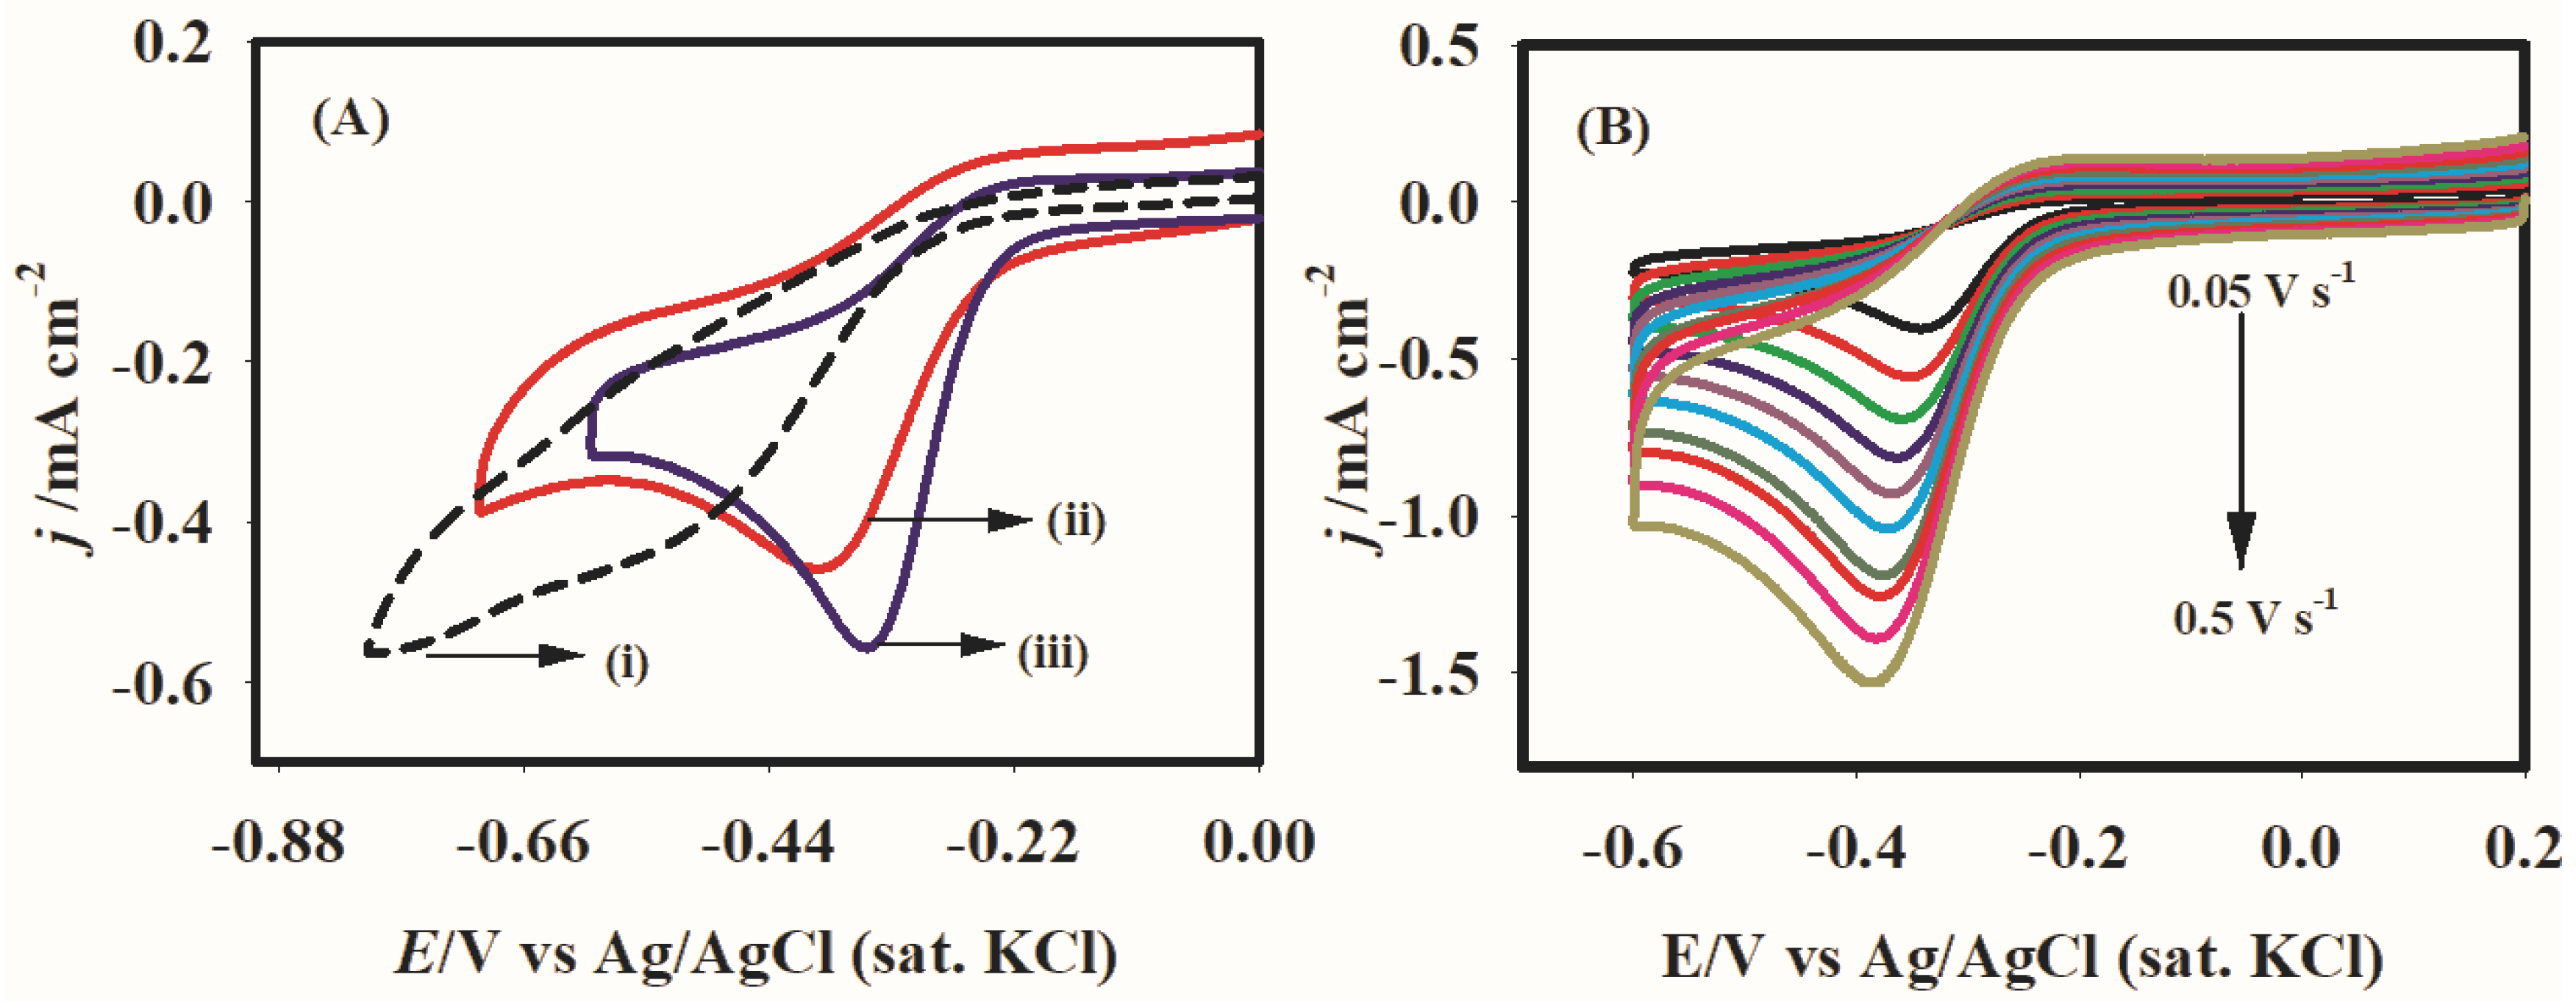
An oxygen-saturated 0.1 M NaOH solution was used to record CV profiles using pristine and activated GCE for ORR at a scan rate of 0.1 Vs−1. A pristine GCE reduces oxygen molecules dissolved in alkaline water with an onset potential (Ei) of −0.28 V, providing a visible reduction wave (Ep) at −0.50 V with a current of −27 mA, as shown in Figure 3A (i). Next, an activated GC prepared by ten times potential scanning (in 0.1 M H2SO4) in the range 0 to +1.5 V was used to scan the same solution under the same experimental condition. It is seen from Figure 3A (ii) that the Ei and Ep shifted to the potentials of −0.22 and −0.39 V, respectively, with a current maximum of 32 µA. Furthermore, the maximum ORR current was 39.0 µA at −0.34 V, while the GCE was activated in the range of 0 to +1.8 V, as shown in Figure 3A (iii). This study implies that activation of the GCE electrode upon being subject to positive potential accelerated the ORR in the basic conditions by increasing the reduction current, lowering both onset and peak overpotentials, and recalling that a GC surface consists of graphitic carbon atoms. The XPS analysis showed that the intensity of the -C=O group increases as the GCE surface is subjected to a potential of +1.8 V. Developing -C=O functional groups might have increased the structural flexibility of C-C bonds over the GCE surface. According to a recent study, by DFT calculations, it has been shown that deformation around the O2 adsorption (carbon ‘C’) sites enables them to be more stable by releasing more free energy in comparison to a nonflexible carbonaceous surface [37]. Thus, a favorable O2 adsorption on carbon atoms over the activated GCE surface could be inferred for bolstering the ORR process due to structural deformability caused by the oxidation of carbon atoms. The comparative ORR performances of several carbon based electrodes functioning in the basic medium are given in Table 1 in terms of onset potential and peak potential.
The scan rate variable CVs are essential for examining the kinetic and mechanistic aspects of an electrochemical process. As a result, cyclic voltammograms were obtained by altering the scan rate from 0.05 to 0.5 Vs−1 by an activated GC electrode in an oxygen-saturated 0.1 M NaOH solution, as shown in Figure 3B. Figure 3B shows that the current increased linearly as the scan rate increased. This is because as scan rate (v) increases, diffusion layer thickness decreases, increasing the mass transfer rate, which in turn raises the current. Scan-rate-dependent data of GC before and after activation was observed, and from that, double-layer capacitance (CDL) can be determined from the graph of peak current vs. scan rate (Figure S3) using the following equation:
I = C D L d v d t
The double-layer capacitance for activated GC and pristine GC was found to be 41.52 μF and 23.67 μF, respectively. Hence, in contrast to pristine GC, the roughness factor was nearly two times greater in activated GC. The roughness factor of activated GC was taken into consideration when plotting all the data in this article.
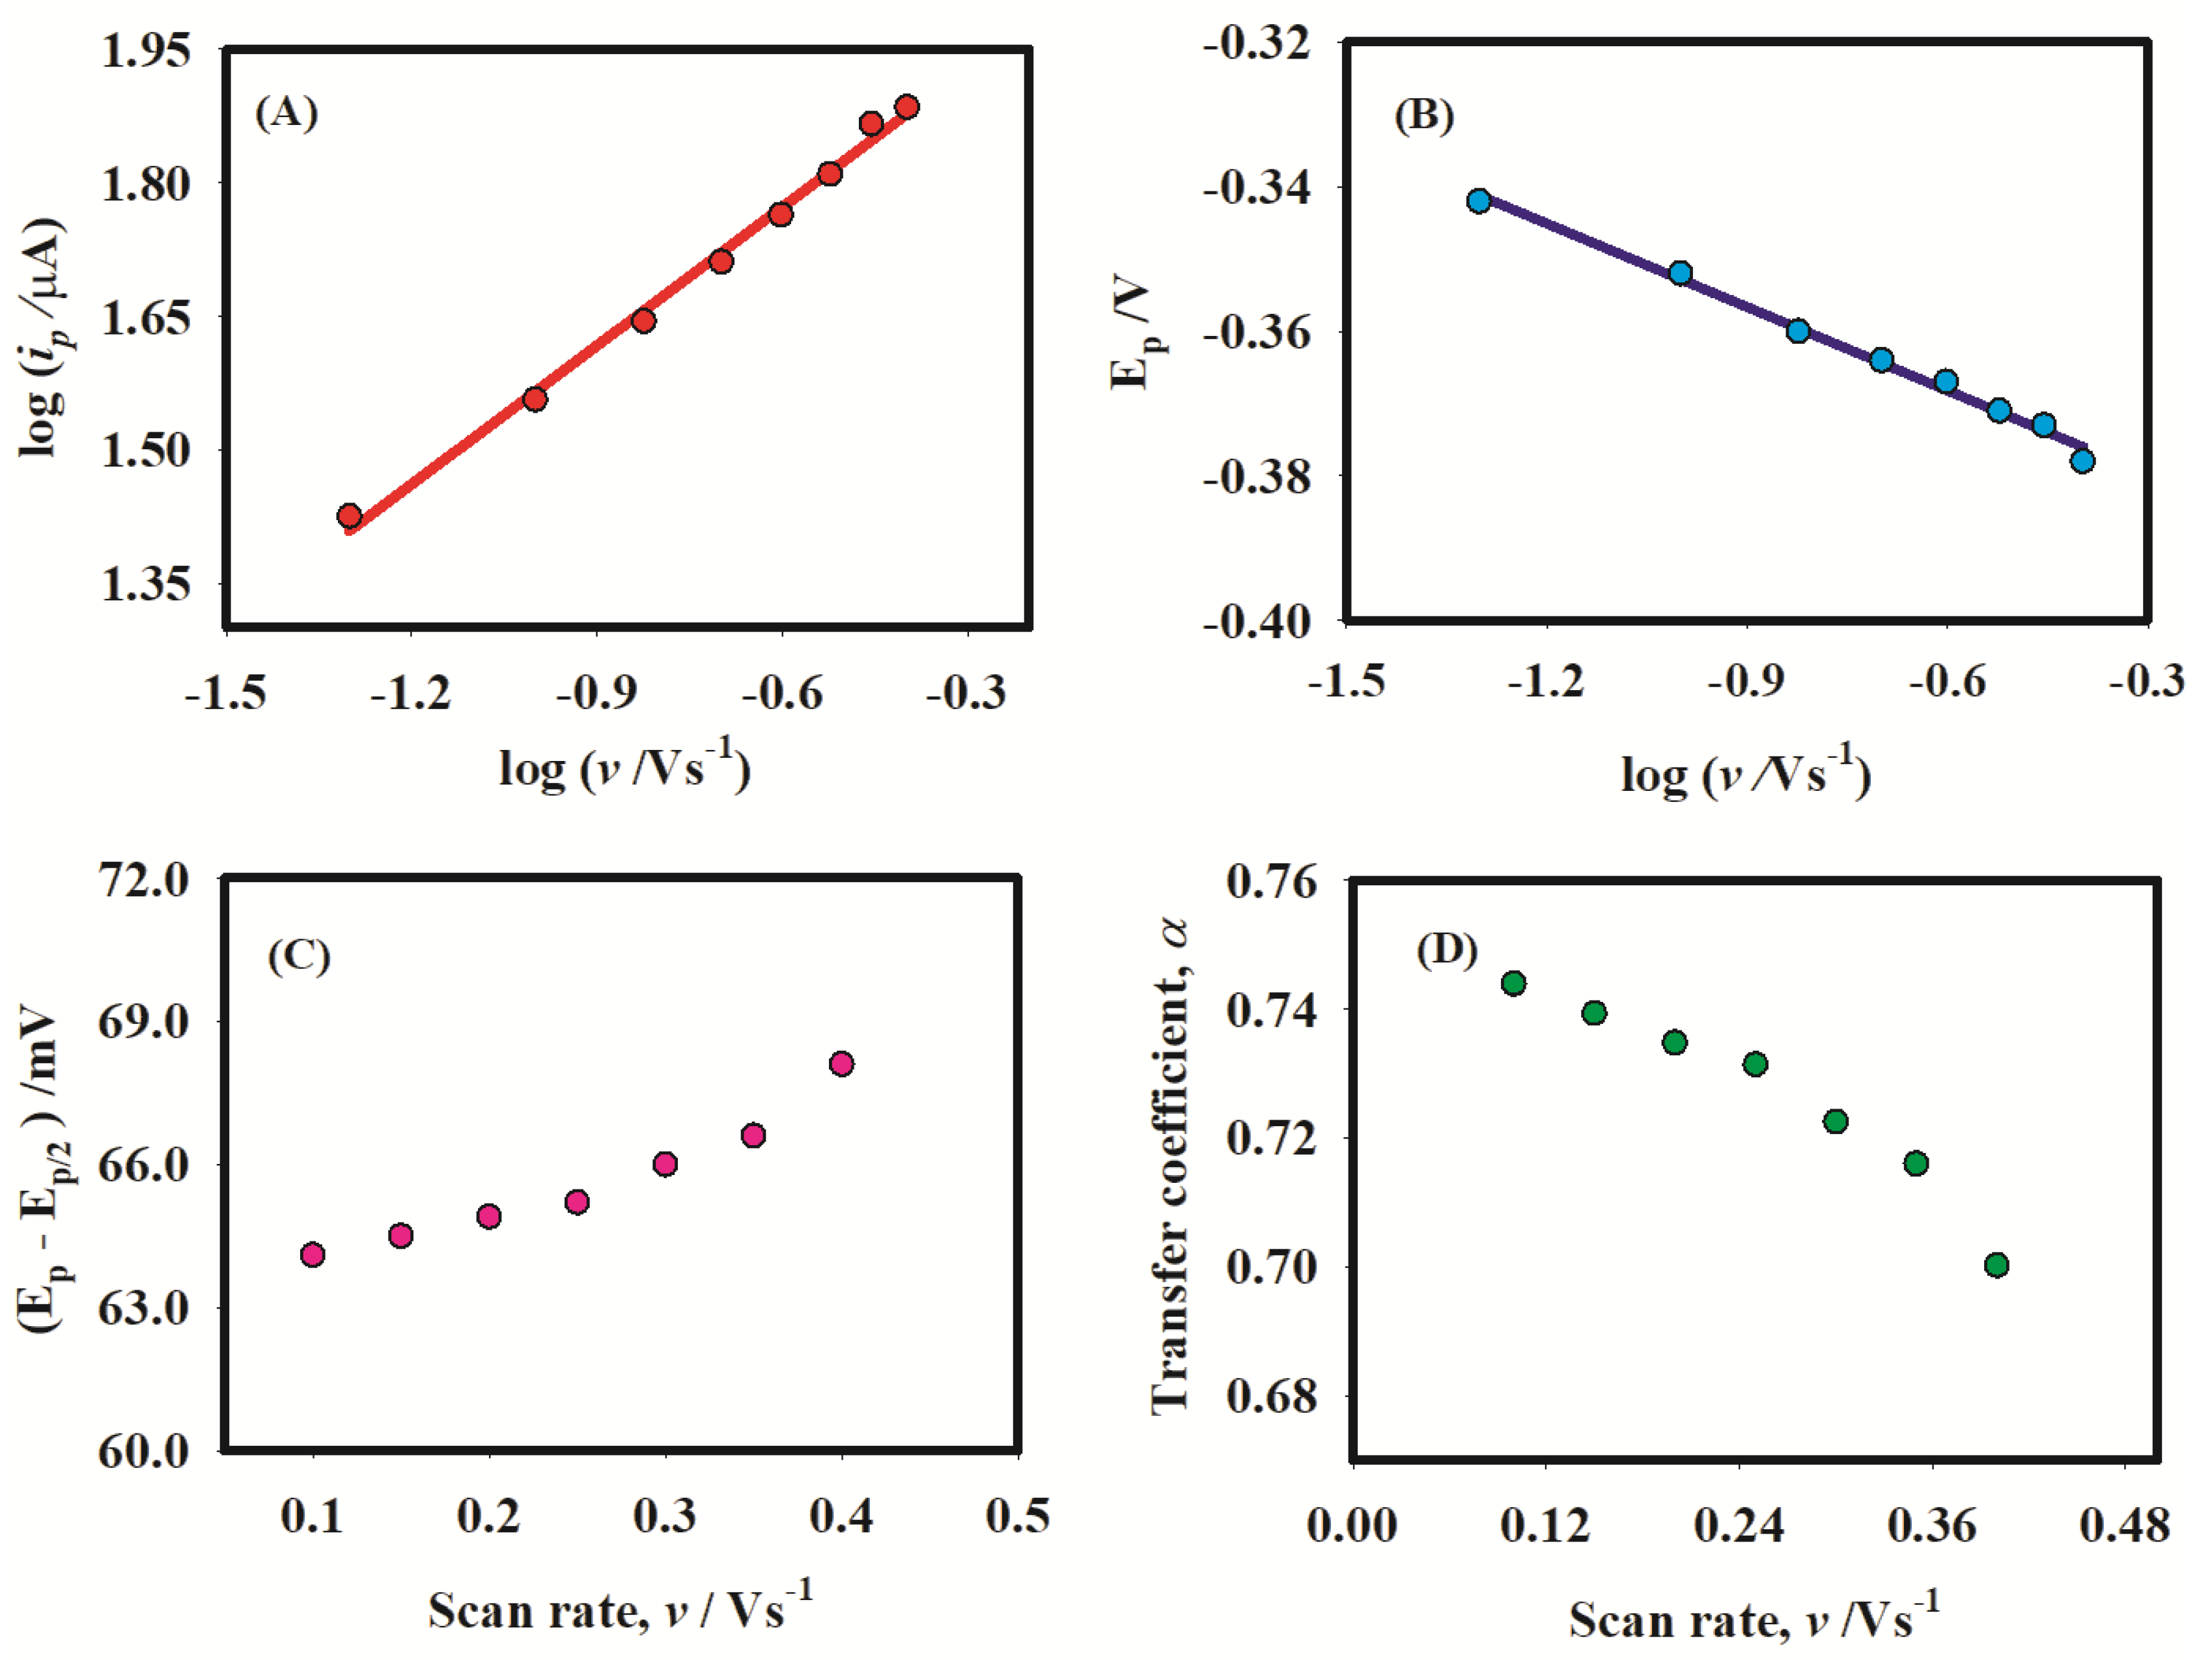
Next, to determine whether the electrochemical process is diffusion or adsorption, the relationship between the log of peak current and the log of scan rate was tracked, as shown in Figure 4A. A linear curve with a slope of 0.53 was obtained while log(ip) was plotted against log (v). This observation implies that ORR came after diffusion-limited kinetics over the activated GC electrode surface. As the scan rate was increased, it was evident from Figure 4B that the peak potential had moved to a negative potential direction; an irreversible electron transfer process exhibits this feature. Later, from Figure 4C, it was found that the values of Ep (maximum potential) − Ep/2 (half potential) varied between 64 mV and 68 mV. The corresponding transfer coefficient (α) was determined using Equation (5).
α = 1.857 R T F E p E p / 2
The obtained value of the transfer coefficient is shown in Figure 4D. The magnitude of the transfer coefficient fluctuates between 0.70 and 0.74. A transfer coefficient value greater than 0.5 indicates that the reaction proceeds through the stepwise mechanism on the electrode surface. As EpEp/2 values remained constant with the change in scan rate, the kinetics associated with this reaction followed the Butler–Volmer (B.–V.) equation.
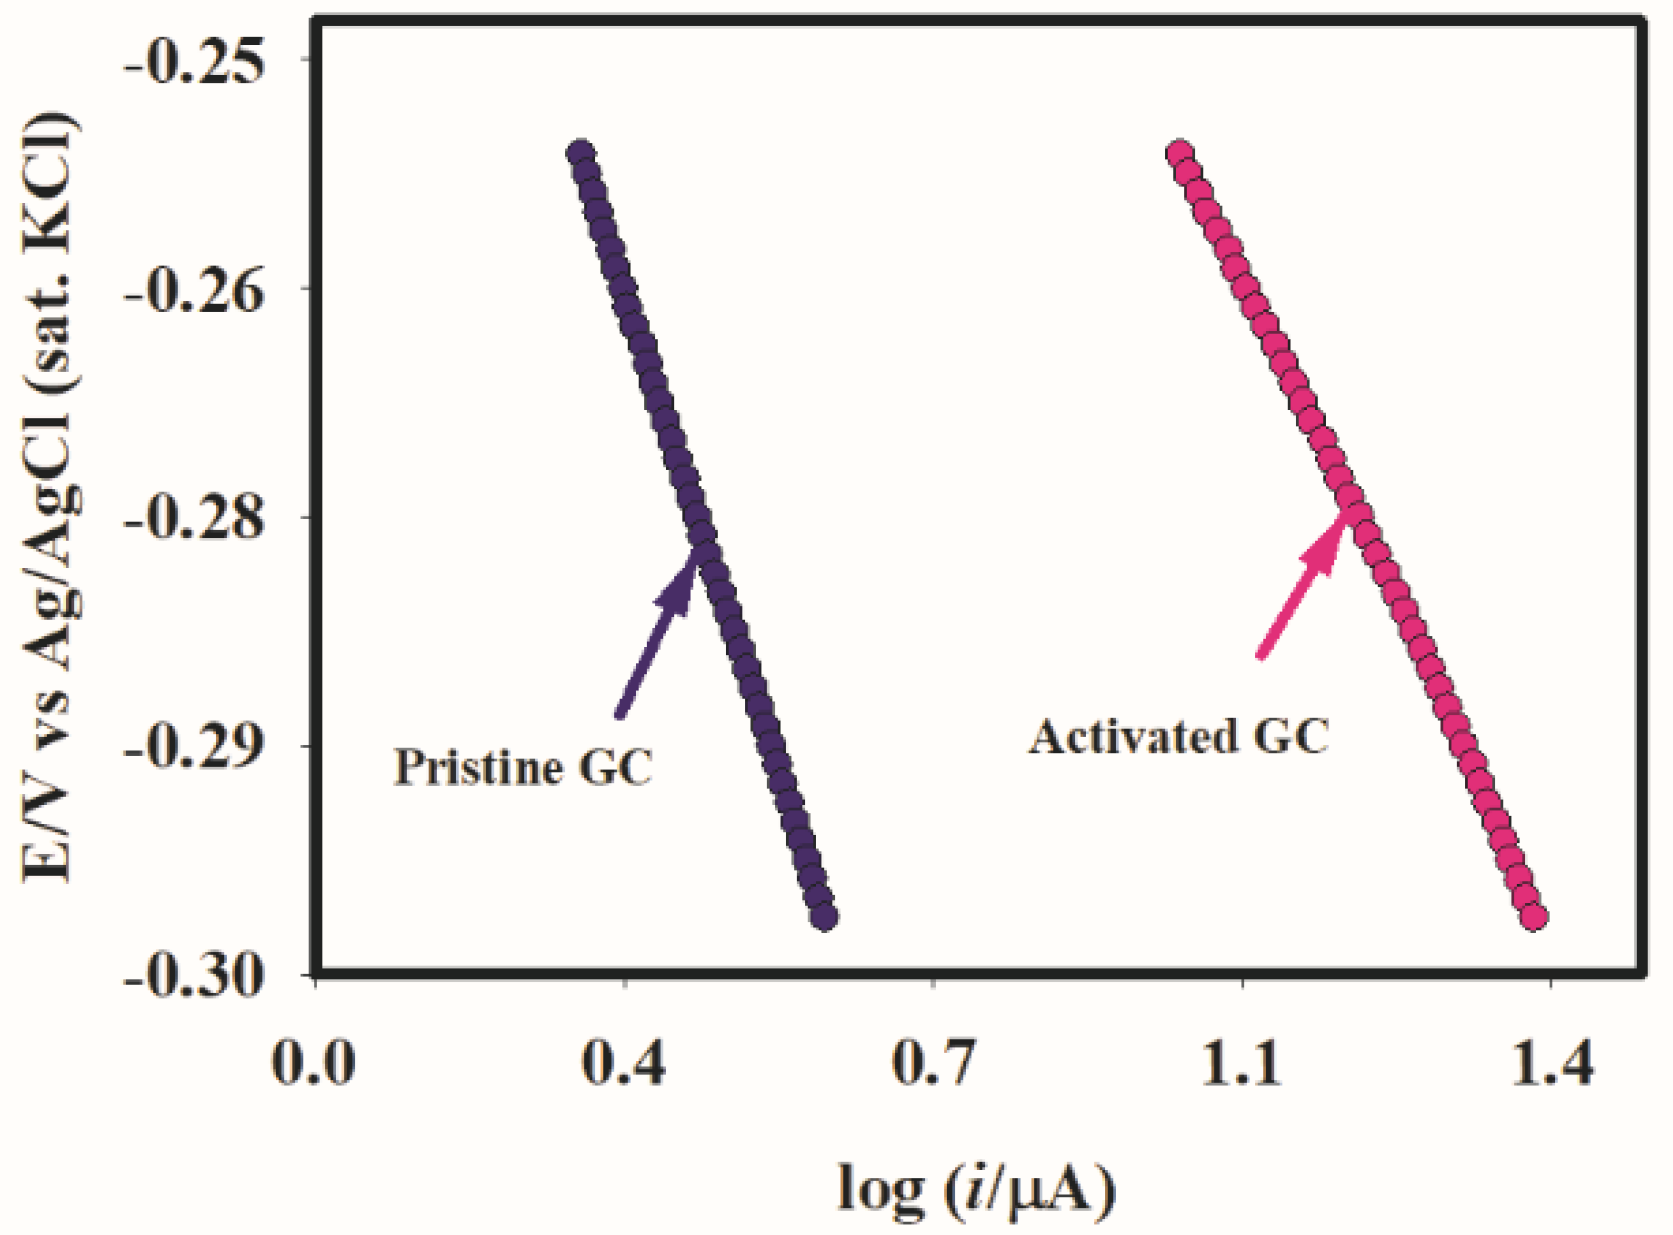
Hence, Tafel analysis was carried out for the CV recorded at 0.1 Vs−1 by the activated GC and pristine GC, as shown in Figure 5. The basis for differentiating between potential reaction mechanisms can be found in the clarification of Tafel slopes. Faradaic current and overpotential (η) are associated using the Tafel equation as follows:
log I = log ( I o )   1 b ( E E ° )
where, E ° is the formal potential, E is the applied potential (vs. Ag/AgCl), b = 2.3.03 R T α F is the Tafel slope, and I o = n F A C k ° is the exchange current while E =   E ° .
According to Equation (6), a lower Tafel slope indicates more efficient electrocatalytic performance, whereas a larger Tafel slope suggests more polarization with unfavorable catalytic activity. The relationship between potential and log(I) in the Tafel region is shown in Figure 5. The Tafel slope for pristine GC and activated GC are found to be 143 mV dec−1 and 98 mV dec−1, respectively. From the Tafel slope analysis, it can be said that the activated GC electrode required less overpotential to generate a large current for the oxygen reduction process. From this analysis, it is also assumed that the first electron transfer determined the overall reaction rate.

2.4. Hydrodynamic Voltammetry

The hydrodynamic voltammograms of the O2-saturated 0.1 M NaOH solutions recorded using the activated GC electrode are shown in Figure 6A, which were recorded between 200 and 1800 rpm at a scan rate of 0.025 Vs−1. At all rotational speeds, distinct sigmoidal-shaped i–E curves were observed. The Levich Equation (7) can define the limiting current (JL for ORR):
j l = 0.62 n F C b u l k D o 2 / 3 v 1 / 6 ω 1 / 2
The terms n, F, and C in the equation above represent the number of electrons transferred per O2 molecule, the Faraday constant (96,485 C mol−1), and the bulk concentration of dissolved O2. Moreover, Do stands for the O2 molecule’s diffusion coefficient, v is kinematic viscosity, and ω (ω = 2πf/60, where f denotes rotation per minute) is the electrode’s rate of angular rotation.
The number of electron transfers involved in any reaction is crucial in unveiling reaction kinetics. Hydrodynamic voltammograms allow for counting the number of electrons involved. If all the other parameters are known, the number of electron transfers can be computed using the Levich Equation (7) from the slope of j l vs. the square root of angular rotation. Figure 6A shows that the current is limited at −0.41 V at 400 rpm and begins to shift towards a more negative voltage with increased rotation. According to Equation (7), j l and ꞷ1/2 are linearly related, and a plot of j l vs. ꞷ1/2 should provide a straight line with a slope equal to 0.62 n F C b u l k D o 2 / 3 v 1 / 6 . When the experimental values were plotted using the j l vs. ꞷ1/2 relationship, a straight line with a slope of 0.1719 mA cm−2 (rad s−1)−1/2 was produced, passing through the origin. The linearity of this plot provides a further demonstration of the diffusion control process.
The kinematic viscosity of 0.1 M NaOH solution, the bulk concentration of O2 during the RDE experiment, and the diffusion coefficient values were employed— 1.1 × 10 2   c m 2 s 1 , 1.0 × 10 6   m o l   c m 3 , and 1.9 × 10 5   c m 2 s 1 in this experiment, respectively [45,46,47]. The theoretical calculation using the two-electron transfer process agreed with the experimental value. Figure 6B shows that the slope for n = 2 was consistent with the experimentally determined slope value. Hence, the oxygen reduction reaction on activated GC (activated up to +1.8 V) is a two-electron transfer mechanism, and the final product is hydrogen peroxide.
Next, the Koutecky–Levich (K.–L.) plot was analyzed to find the standard rate constant and the number of electron transfers. The K.–L. Equation (8) is as follows:
1 j = 1 j k + 1 0.62 n F C b u l k D o 2 / 3 v 1 / 6 ω 1 / 2
where kinetic limited current,   j k = n F C k o   at infinite rotation, in which ko indicates standard rate constant and other symbols have their conventional meanings. So, the plot of 1/j vs. 1/ω½ is a straight line with an intercept of 1/jk. The j values were taken from Figure 6A at various potentials and displayed as a function of ω½ to create K.–L. plots. According to Figure 6C, the K.–L. lines were obtained at potentials of −0.26, −0.42, −0.44, −0.46, and −0.47 V vs. Ag/AgCl sat. KCl electrode. As parallel lines are observed in K.–L. plots (C), it indicates that the reaction follows first-order kinetics. The number of electron transfers was determined to be ~2.23 from the slopes of the K.–L. plots obtained between −0.42 and −0.47 V. This discovery confirms that a 2 e transfer reaction occurred, producing H2O2 as the product at the activated surface during the ORR process. The standard rate constant (k) at −0.26 V was determined from the intercept of the K.–L. plots (−0.26 V) by using Equation (8), which was found to be 9.5 × 10 3 c m   s 1 .
Then, the log j vs. E Tafel plot was drawn to determine the transfer coefficient and standard reduction potential by using Equation (6) (see Figure 6D). From the Tafel slope, the transfer coefficient was calculated to be 0.75. And by evaluation of the Tafel plot and K.–L. plot, the standard reduction potential was obtained: −0.27V.

2.5. Stability

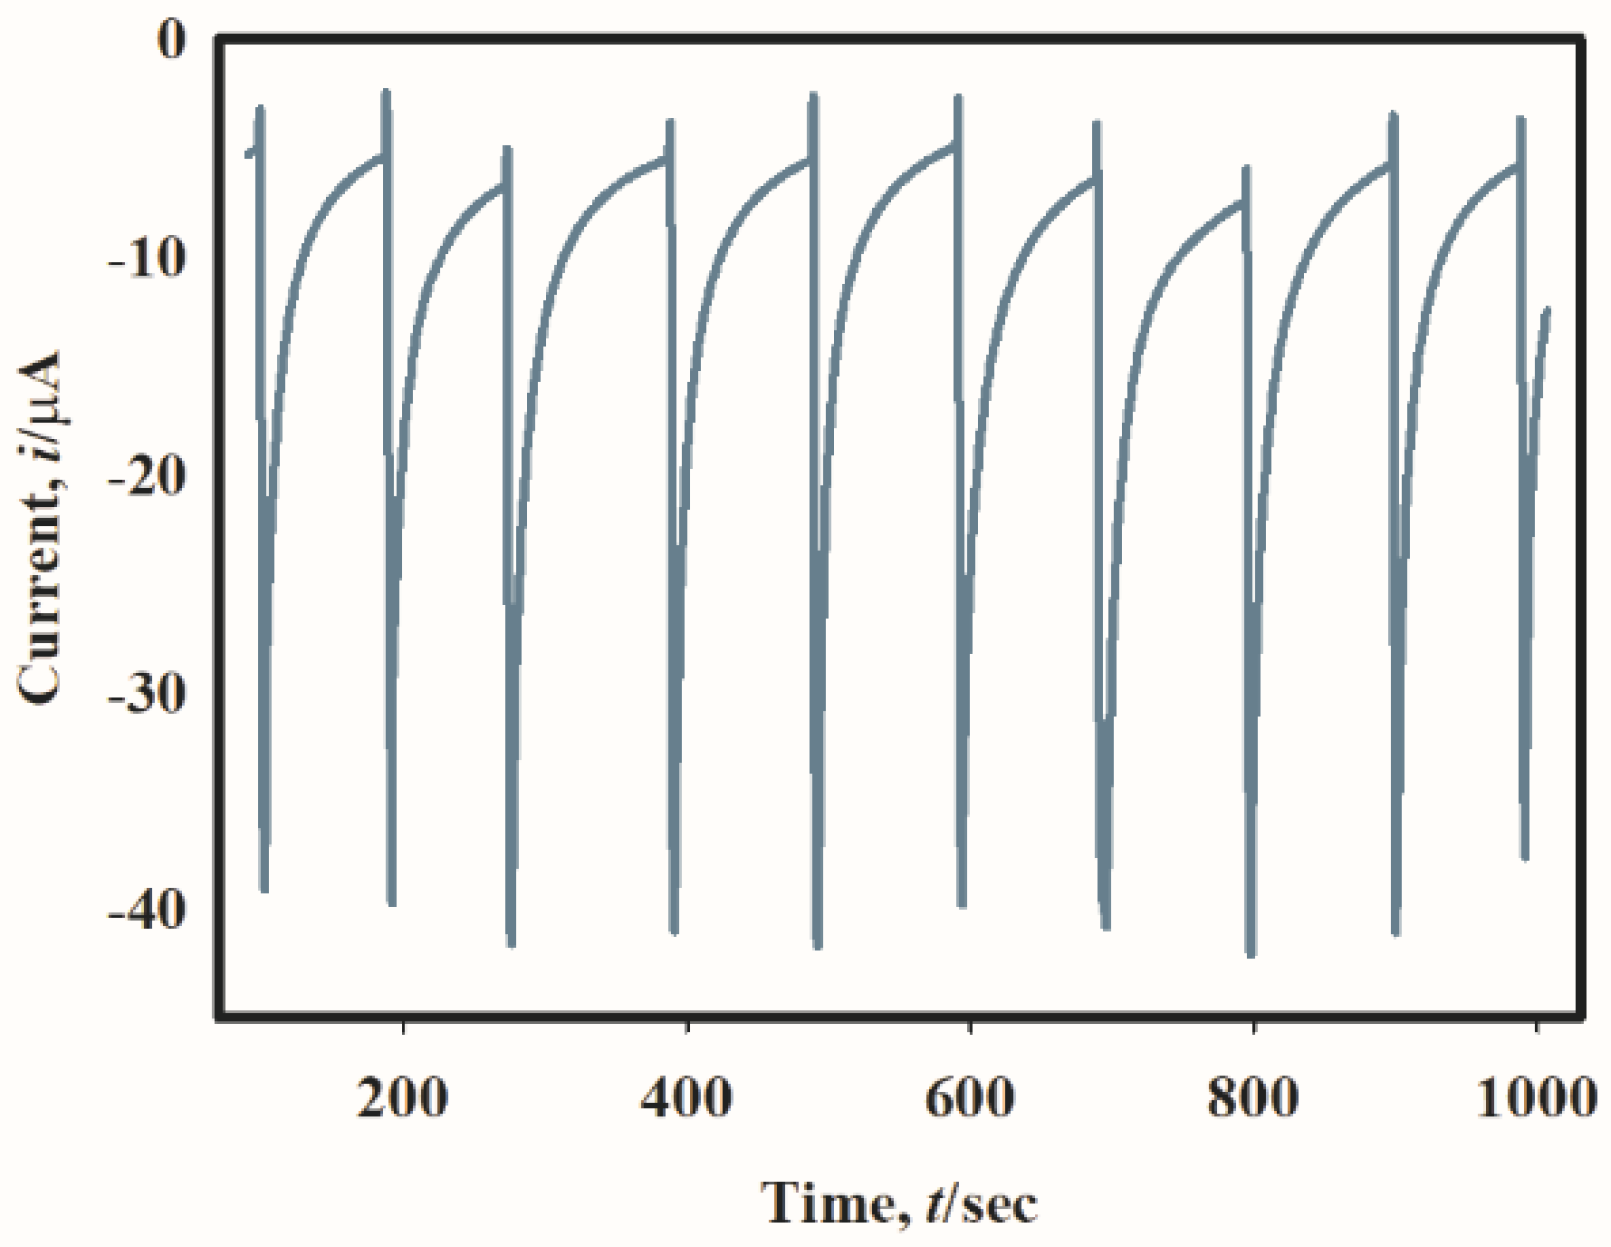
One of the most important factors in an electrocatalytic reaction is electrode stability. The amperometric i-t graph of activated GC in 0.1 M NaOH at −0.4 V for 1000 s is shown in Figure 7. When 30 μL of 14 ppm oxygen solution was injected directly onto the surface of the activated GC, it was noted that an instant spike of considerable current appeared for a short while, where the height of the spikes correlated with the concentration of the analyte. After around a 90 s gap, the same amount of oxygen was infused, and it was discovered that the spikes’ heights remained constant across the board. The experiment was repeated for seven consecutive days, and an almost similar result was observed. The electrode is, therefore, stable in the case of an oxygen reduction reaction.

3. Materials and Methods

3.1. Chemicals

Sodium hydroxide (NaOH), sulphuric acid (H2SO4), and O2 gas were purchased from Sigma Aldrich. In this study, all the chemicals used were of analytical grade and taken without further refining.

3.2. Electrode Activation and Electrochemical Measurements

CHI 660 (CHI Instruments, Bee Cave, TX, USA) and Autolab 128 N (Utrecht, the Netherlands) were used for electrochemical investigations. All the studies were conducted using a standard three-electrode system, with a platinum (Pt) wire serving as the counter electrode and the most prevalent Ag/AgCl (sat. KCl) electrode as the reference electrode. A glassy carbon (GC) disk with a geometric surface area of 0.0706 cm2 was employed as the working electrode. Prior to testing, the electrode (GC) surface was cleaned with Milli-Q water and polished using slurries of alumina powder (down to 0.06 mm). Then, to remove the adsorbed material, the GC surface was cleaned using sonication for 30 min with acetone and ethanol (1:1). The GC electrode surface was then electrochemically cleaned in 0.1 M H2SO4 solution by repeating the scan for 80 segments in the potential range of −1.2 to +0.5 V (scan rate of 0.1 Vs−1), followed by rinsing with Milli-Q water and drying the electrode. Next, the electrochemical activation of the GCE surface was performed by the potential scanning of a cleaned glassy carbon electrode dipped into 0.1 M H2SO4 in the potential range +0.0 V to +1.8 V at 0.1 Vs−1 scan rate for ten consecutive cycles. This action led to the oxidation of carbon atoms on the glassy carbon surface, which was then characterized by X-ray photoelectron spectroscopy (XPS), cyclic voltammetry (CVs), and electrochemical impedance spectroscopy (EIS). Activated GC was finally used as a working electrode to study oxygen reduction reaction in 0.1 M NaOH solution at 25 ± 2 °C.

3.3. Characterization

Elemental characteristics of activated GC electrodes were examined by X-ray photoelectron spectroscopy (XPS). This study was accomplished by a DLD spectrometer (Kratos Axis-Ultra; Kratos Analytical Ltd., Stretford, UK) through an Al Kα radiation source (1486.6 eV).

4. Conclusions

A green way of producing hydrogen peroxide from oxygen was shown using functionalized electrodes. The electrode was made using a simple anodization approach, and measurements of the XPS, CV, RDE, OCP, and EIS were taken for the electrokinetic studies. The XPS study confirmed the anodization-induced oxygen species production on the electrode surface. EIS and OCP studies showed that the activated GC surface was more feasible for reduction than the pristine GC electrode surface. When oxygen is reduced in an active electrode, cyclic voltammograms reveal a low overpotential (−0.25 V against Ag/AgCl) with a clearly defined peak. The anticipated low Tafel slope points to a more effective electrocatalytic reaction. The analysis of hydrodynamic voltammograms further supports the two-electron oxygen reduction mechanism. Hence, this research presents a sustainable method for producing clean energy (hydrogen peroxide).

Supplementary Materials

The following supporting information can be downloaded at https://www.mdpi.com/article/10.3390/catal14030164/s1; Figure S1: XPS spectra (C 1s) of GC electrode to show the growth of C=O, C-O, and C-C bonds after activating GC at 0 V(pristine), 0.5 V, 1.0 V, 1.5 V, and 1.8 V; Figure S2: (A) CVs of ORR by (A) pristine GC, (B) activated GC (activated up to +1.8 V) were recorded in 0.1 M NaOH solution at varying scan rate (0.05, 0.1, 0.15, 0.2, 0.25, 0.3, 0.35, 0.4 and 0.45 Vs−1); Figure S3: ip vs scan rate plot (Data were derived from Figure S2).

Author Contributions

M.S.: experiments and draft writing; N.H.: editing and rewriting; R.H.A., J.Y.A.-H. and M.M.R.: editing and funding; M.A.H.: research planning and editing. All authors have read and agreed to the published version of the manuscript.

Funding

Princess Nourah bint Abdulrahman University Researchers Supporting Project number (PNURSP2024R24), Princess Nourah bint Abdulrahman University, Riyadh, Saudi Arabia. The authors also acknowledge the Ministry of Education (Bangladesh) for a grant PCN No. PS20211727, and Shahjalal University of Science and Technology research center for another grant (No. PS/2023/1/02). Partial support from Prince Sattam bin Abdulaziz University project number (PSAU/2023/R/1444) is also acknowledged.

Data Availability Statement

All data generated or analyzed during this study are included in this published article.

Conflicts of Interest

The authors declare no conflict of interest.

References

  1. Qiang, Z.; Chang, J.H.; Huang, C.P. Electrochemical generation of hydrogen peroxide from dissolved oxygen in acidic solutions. Water Res. 2002, 36, 85–94. [Google Scholar] [CrossRef]
  2. Feng, L.; Yang, L.; Huang, Z.; Luo, J.; Li, M.; Wang, D.; Chen, Y. Enhancing electrocatalytic oxygen reduction on nitrogen-doped graphene by active sites implantation. Sci. Rep. 2013, 3, 3306. [Google Scholar] [CrossRef]
  3. Raj, C.; Retna, C.; Samanta, A.; Hyo Noh, S.; Mondal, S.; Okajima, T.; Ohsaka, T. Emerging new generation electrocatalysts for the oxygen reduction reaction. J. Mater. Chem. A 2016, 29, 11156–11178. [Google Scholar] [CrossRef]
  4. Shao, M.; Chang, Q.; Dodelet, J.P.; Chenitz, R. Recent Advances in Electrocatalysts for Oxygen Reduction Reaction. Chem. Rev. 2016, 116, 3594–3657. [Google Scholar] [CrossRef]
  5. Xu, X.; Wang, W.; Zhou, W.; Shao, Z. Recent Advances in Novel Nanostructuring Methods of Perovskite Electrocatalysts for Energy-Related Applications. Small Methods 2018, 2, 1800071. [Google Scholar] [CrossRef]
  6. Xu, X.; Su, C.; Shao, Z. Fundamental understanding and application of Ba0.5Sr0.5Co0.8Fe0.2O3−δ perovskite in energy storage and conversion: Past, present, and future. Energy Fuels 2021, 35, 13585–13609. [Google Scholar] [CrossRef]
  7. Ge, X.; Sumboja, A.; Wuu, D.; An, T.; Li, B.; Goh, F.T.; Hor, T.A.; Zong, Y.; Liu, Z. Oxygen Reduction in Alkaline Media: From Mechanisms to Recent Advances of Catalysts. ACS Catal. 2015, 5, 4643–4667. [Google Scholar] [CrossRef]
  8. Wang, N.; Ma, S.; Zuo, P.; Duan, J.; Hou, B. Recent Progress of Electrochemical Production of Hydrogen Peroxide by Two-Electron Oxygen Reduction Reaction. Adv.Sci. 2021, 8, 2100076. [Google Scholar] [CrossRef] [PubMed]
  9. Wu, X.; Tang, C.; Cheng, Y.; Min, X.; Jiang, S.P.; Wang, S. Bifunctional Catalysts for Reversible Oxygen Evolution Reaction and Oxygen Reduction Reaction. Chem. Eur. J. 2020, 26, 3906–3929. [Google Scholar] [CrossRef] [PubMed]
  10. Risch, M. Perovskite electrocatalysts for the Oxygen reduction reaction in alkaline media. Catalysts 2017, 7, 154. [Google Scholar] [CrossRef]
  11. Lu, X.F.; Xia, B.Y.; Zang, S.Q.; Lou, X.W. Metal–Organic Frameworks Based Electrocatalysts for the Oxygen Reduction Reaction. Angew. Chem. Int. Ed. 2020, 59, 4634–4650. [Google Scholar] [CrossRef]
  12. Abdullah, N.H.; Shameli, K.; Nia, P.M.; Etesami, M.; Abdullah, E.C.; Abdullah, L.C. Electrocatalytic activity of starch/Fe3O4/zeolite bionanocomposite for oxygen reduction reaction. Arab. J. Chem. 2020, 13, 1297–1308. [Google Scholar] [CrossRef]
  13. Feng, J.; Cai, R.; Magliocca, E.; Luo, H.; Higgins, L.; Romario, G.L.F.; Liang, X.; Pedersen, A.; Xu, Z.; Guo, Z.; et al. Iron, Nitrogen Co-Doped Carbon Spheres as Low Cost, Scalable Electrocatalysts for the Oxygen Reduction Reaction. Adv. Funct. Mater. 2021, 31, 2902974. [Google Scholar] [CrossRef]
  14. Shahid, M.M.; Zhan, Y.; Alizadeh, M.; Sagadevan, S.; Paiman, S.; Oh, W.C. A glassy carbon electrode modified with tailored nanostructures of cobalt oxide for oxygen reduction reaction. Int. J. Hydrogen Energy 2020, 45, 18850–18858. [Google Scholar] [CrossRef]
  15. Islam, N.; Abir, A.Y.; Ahmed, J.; Faisal, M.; Algethami, J.S.; Harraz, F.A.; Hasnat, M.A. Electrocatalytic oxygen reduction reaction at FeS2-CNT/GCE surface in alkaline medium. J. Electroanal. Chem. 2023, 941, 117568. [Google Scholar] [CrossRef]
  16. Nyoni, S.; Nyokong, T. Development of graphene/CdSe quantum dots-co phthalocyanine nanocomposite for oxygen reduction reaction. Electroanalysis 2014, 26, 2261–2272. [Google Scholar] [CrossRef]
  17. Pickrahn, K.L.; Park, S.W.; Gorlin, Y.; Lee, H.B.R.; Jaramillo, T.F.; Bent, S.F. Active MnO x electrocatalysts prepared by atomic layer deposition for oxygen evolution and oxygen reduction reactions. Adv. Energy Mater. 2012, 2, 1269–1277. [Google Scholar] [CrossRef]
  18. Calfumán, K.; Quezada, D.; Isaacs, M.; Bollo, S. Enhanced Hydrogen Peroxide Sensing Based on Tetraruthenated Porphyrins/Nafion/Glassy Carbon-modified Electrodes via Incorporating of Carbon Nanotubes. Electroanalysis 2015, 27, 2778–2784. [Google Scholar] [CrossRef]
  19. Çakar, I.; Özdokur, K.V.; Demir, B.; Yavuz, E.; Demirkol, D.O.; Koçak, S.; Timur, S.; Ertaş, F.N. Molybdenum oxide/platinum modified glassy carbon electrode: A novel electrocatalytic platform for the monitoring of electrochemical reduction of oxygen and its biosensing applications. Sens. Actuators B Chem. 2013, 185, 331–336. [Google Scholar] [CrossRef]
  20. Seinberg, J.M.; Kullapere, M.; Mäeorg, U.; Maschion, F.C.; Maia, G.; Schiffrin, D.J.; Tammeveski, K. Spontaneous modification of glassy carbon surface with anthraquinone from the solutions of its diazonium derivative: An oxygen reduction study. J. Electroanal. Chem. 2008, 624, 151–160. [Google Scholar] [CrossRef]
  21. Krivenko, A.G.; Manzhos, R.A.; Protasova, S.G. Effect of impulse high voltage anodic and cathodic electrochemical treatment of a glassy carbon electrode on the oxygen reduction reaction in alkaline media. Electrochem. Commun. 2018, 96, 57–60. [Google Scholar] [CrossRef]
  22. Sharma, R.K.; Müller, V.; Chatenet, M.; Djurado, E. Oxygen reduction reaction electrocatalysis in alkaline electrolyte on glassy-carbon-supported nanostructured Pr6O11 thin-films. Catalysts 2018, 8, 461. [Google Scholar] [CrossRef]
  23. Machhindra, L.A.; Yen, Y.K. A Highly Sensitive Electrochemical Sensor for Cd2+ Detection Based on Prussian Blue-PEDOT-Loaded Laser-Scribed Graphene-Modified Glassy Carbon Electrode. Chemosensors 2022, 10, 209. [Google Scholar] [CrossRef]
  24. Ntsendwana, B.; Mamba, B.B.; Sampath, S.; Arotiba, O.A. Electrochemical detection of bisphenol a using graphene-modified glassy carbon electrode. Int. J. Electrochem. Sci. 2012, 7, 3501–3512. [Google Scholar] [CrossRef]
  25. Li, Y.; Chen, S.M. The electrochemical properties of acetaminophen on bare glassy carbon electrode. Int. J. Electrochem. Sci. 2012, 7, 2175–2187. [Google Scholar] [CrossRef]
  26. Tsuda, T.; Kurihara, T.; Hoshino, Y.; Kiyama, T.; Okazaki, K.I.; Torimoto, T.; Kuwabata, S. Electrocatalytic activity of platinum nanoparticles synthesized by room-temperature ionic liquid-sputtering method. Electrochemistry 2009, 77, 693–695. [Google Scholar] [CrossRef]
  27. Cogal, S. Electrochemical Determination of Dopamine Using a Poly(3,4-Ethylenedioxythiophene)-Reduced Graphene Oxide-Modified Glassy Carbon Electrode. Anal. Lett. 2018, 51, 1666–1679. [Google Scholar] [CrossRef]
  28. Chetankumar, K.; Kumara, B.E.S. Electrochemically nitric acid pre-treated glassy carbon electrode sensor for catechol and hydroquinone: A voltammetric study. Sens. Int. 2020, 1, 10001. [Google Scholar] [CrossRef]
  29. Kairy, P.; Hossain, M.; Khan, A.; Almahri, A.; Raham, M.M.; Hasnat, M.A. Electrocatalytic oxidation of ascorbic acid in the basic medium over electrochemically functionalized glassy carbon surface. Surf. Interfaces 2022, 33, 102200. [Google Scholar] [CrossRef]
  30. Siddika, M.; Ahmed, J.; Aoki, K.; Faisal, M.; Algethami, J.S.; Harraz, F.A.; Nagao, Y.; Hasnat, M.A. Kinetics of Electrocatalytic Oxidation of Gallic Acid by Activated Glassy Carbon Electrode in Acidic Medium. ChemistrySelect 2023, 8, e202302074. [Google Scholar] [CrossRef]
  31. Hossain, M.I.; Dutta, A.; Ahmed, J.; Aoki, K.; Faisal, M.; Algethami, J.S.; Harraz, F.A.; Nagao, Y.; Hasnat, M.A. Electroless Deposition of Gold on a Glassy Carbon Electrode (GCE) Surface for Selective Detection of Hydrogen Peroxide. ChemistrySelect 2024, 8, e202301638. [Google Scholar] [CrossRef]
  32. Ilangovan, G.; Pillai, K.C. Electrochemical and XPS characterization of glassy carbon electrode surface effects on the preparation of a monomeric molybdate(VI)-modified electrode. Langmuir 1997, 13, 566–575. [Google Scholar] [CrossRef]
  33. Mondal, S.K.; Raman, R.K.; Shukla, A.K.; Munichandraiah, N. Electrooxidation of ascorbic acid on polyaniline and its implications to fuel cells. J. Power Sources 2005, 145, 16–20. [Google Scholar] [CrossRef]
  34. Hur, J.; Lee, B.M.; Lee, T.H.; Park, D.H. Estimation of biological oxygen demand and chemical oxygen demand for combined sewer systems using synchronous fluorescence spectra. Sensors 2010, 10, 2460–2471. [Google Scholar] [CrossRef] [PubMed]
  35. Wu, C.C.; Yasukawa, T.; Shiku, H.; Matsue, T. Fabrication of miniature Clark oxygen sensor integrated with microstructure. Sens. Actuators B Chem. 2005, 110, 342–349. [Google Scholar] [CrossRef]
  36. Wang, Y.; Hosono, T.; Hasebe, Y. Hemin-adsorbed carbon felt for sensitive and rapid flow-amperometric detection of dissolved oxygen. Microchim. Acta. 2013, 180, 1295–1302. [Google Scholar] [CrossRef]
  37. Choi, K.; Kim, S. Theoretical Study of Oxygen Reduction Reaction Mechanism in Metal-Free Carbon Materials: Defects, Structural Flexibility, and Chemical Reaction. ACS Nano 2022, 16, 16394–16401. [Google Scholar] [CrossRef] [PubMed]
  38. Cardoso, E.S.F.; Fortunato, G.V.; Maia, G. Use of Rotating Ring-Disk Electrodes to Investigate Graphene Nanoribbon Loadings for the Oxygen Reduction Reaction in Alkaline Medium. ChemElectroChem 2018, 5, 1691–1701. [Google Scholar] [CrossRef]
  39. Kruusenberg, I.; Matisen, L.; Jiang, H.; Huuppola, M.; Kontturi, K.; Tammeveski, K. Electrochemical reduction of oxygen on double-walled carbon nanotube modified glassy carbon electrodes in acid and alkaline solutions. Electrochem. Commun. 2010, 12, 920–923. [Google Scholar] [CrossRef]
  40. Golubović, J.; Srejić, I.; Štrbac, S. Oxygen Reduction on Glassy Carbon-Supported PdAu Nanoparticles in Perchloric Acid Solution. Int. J. Electrochem. Sci. 2021, 16, 210818. [Google Scholar] [CrossRef]
  41. Seyyedi, B.; Ahmadi, V.B.; Habibi, E. Bio-inspired iron/sulfur/graphene nanocomposite and its use in the catalysis of the oxygen reduction reaction at room temperature in alkaline media on a glassy carbon electrode. J. Chin. Chem. Soc. 2019, 66, 515–521. [Google Scholar] [CrossRef]
  42. Flores-Lasluisa, J.X.; Huerta, F.; Cazorla-Amorós, D.; Morallon, E. Carbon material and cobalt-substitution effects in the electrochemical behavior of LaMnO3 for ORR and OER. Nanomaterials 2020, 10, 2394. [Google Scholar] [CrossRef] [PubMed]
  43. Kasatkin, P.E.; Härk, E.; Jäger, R.; Lust, E. Oxygen reduction reaction in alkaline solution: Influence of catalyst loading and carbon support characteristics. ECS Trans. 2015, 64, 115–123. [Google Scholar] [CrossRef]
  44. Vaik, K.; Schiffrin, D.J.; Tammeveski, K. Electrochemical reduction of oxygen on anodically pre-treated and chemically grafted glassy carbon electrodes in alkaline solutions. Electrochem. Commun. 2004, 6, 1–5. [Google Scholar] [CrossRef]
  45. Kaskiala, T. Determination of oxygen solubility in aqueous sulphuric acid media. Miner. Eng. 2002, 15, 853–857. [Google Scholar] [CrossRef]
  46. Tammeveski, K.; Kontturi, K.; Nichols, R.J.; Potter, R.J.; Schiffrin, D.J. Surface redox catalysis for O2 reduction on quinone-modified glassy carbon electrodes. J. Electroanal. Chem. 2001, 515, 101–112. [Google Scholar] [CrossRef]
  47. Baur, J.E.; Spaine, T.W. Electrochemical deposition of iridium(IV) oxide from alkaline solutions of iridium(III) oxide. J. Electroanal. Chem. 1998, 443, 208–216. [Google Scholar] [CrossRef]
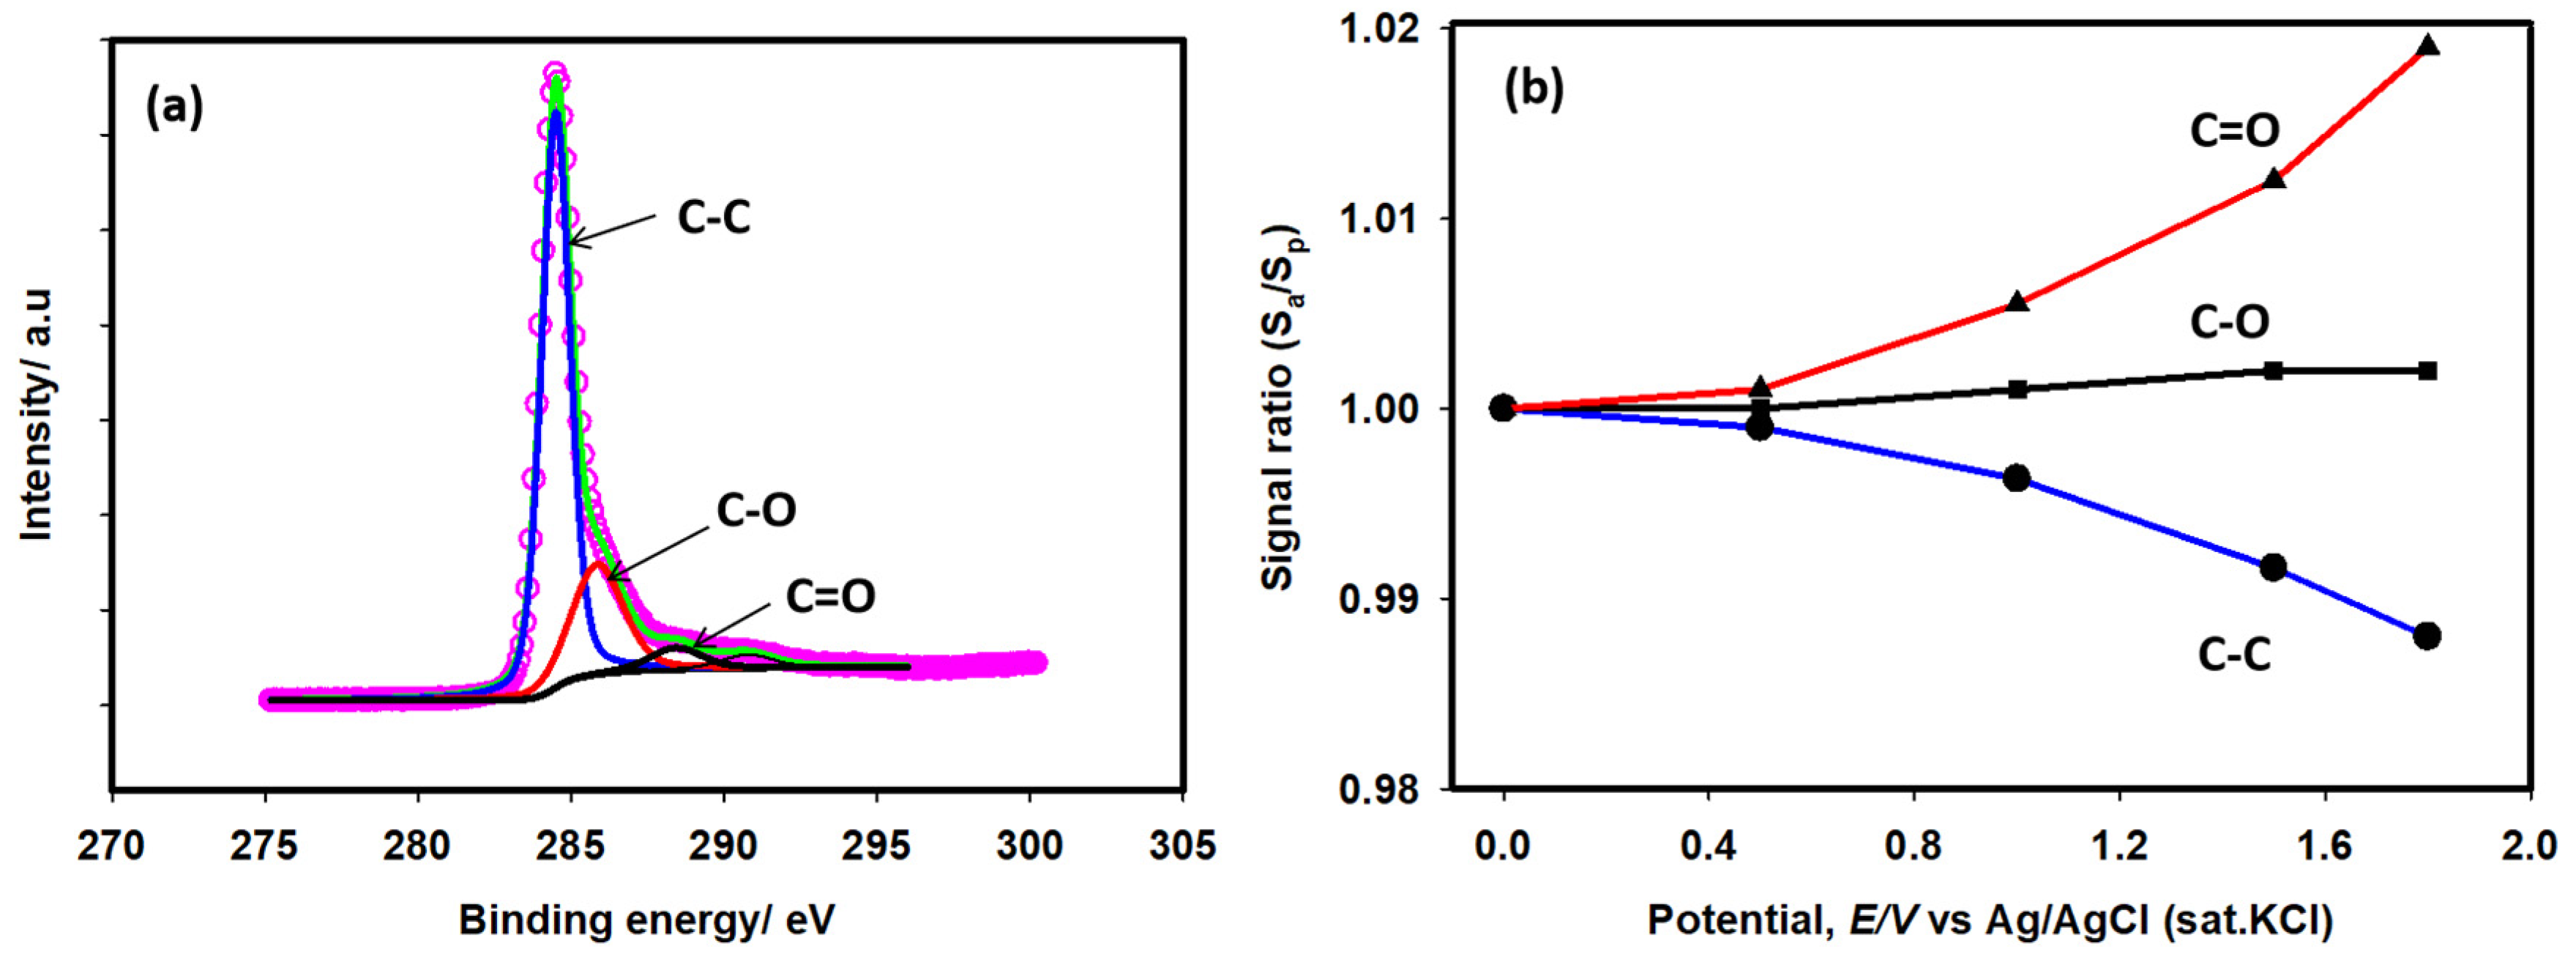
Figure 1. (a) XPS spectra of GC electrode. (b) Growth of C=O, C-O, and C-C bonds after activating GC at 0 V (pristine), 0.5 V, 1.0 V, 1.5 V, and 1.8 V.
Catalysts 14 00164 g001
Figure 2. (A) Linear polarization graphs of pristine (blue) and activated GC (red) were recorded in 0.1 M NaOH solution at a scan rate of 0.1 Vs−1. (B) EIS spectra of pristine GC (blue) and activated GC (red) electrodes in 0.1 M NaOH solution at −0.4 V.
Catalysts 14 00164 g002
Figure 3. (A) CVs of ORR by (i) pristine GC, (ii) activated GC (activated up to +1.5 V), and (iii) activated GC (activated up to +1.8 V) were recorded in 0.1 M NaOH solution at 0.1 Vs−1. (B) CVs recorded on activated GC (up to +1.8 V) electrodes in O2-saturated 0.1 M NaOH at varying scan rates (0.05 to 0.5 Vs−1).
Catalysts 14 00164 g003
Figure 4. Analysis of scan rate variant CVs: (A) log ip vs. log v plot. (B) Ep vs. log v. (C) ΔEp vs. scan rate plot and (D) corresponding plot of transfer coefficient (α). All data were taken from Figure 3B.
Catalysts 14 00164 g004
Figure 5. Tafel plot (E vs. log i) of the ORR process at an activated GC (red) and pristine GC (blue) surface at a scan rate of 0.1 Vs−1. Data are taken from Figure 3A.
Catalysts 14 00164 g005
Figure 6. Hydrodynamic voltammograms of 1 × 10⁻⁶ mol cm−3 O2 were recorded using an activated GC RDE electrode in 0.1 M NaOH solution. These measurements were made at various electrode rotation rates (A) between 200 and 1800 rpm at 0.025 Vs−1. (B) Levich plots for various electron transfers, (C) Koutecky–Levich plots at −0.26 V, −0.42 V, −0.44 V, −0.46 V, and −0.47 V, and (D) Tafel plots for the oxygen reduction reaction process at various rotations, which were derived from Figure 6A.
Catalysts 14 00164 g006
Figure 7. Amperometric i-t graph of activated GC in 0.1 M NaOH at −0.4 V was obtained by repeatedly injecting 30 μL of 14 ppm O2 solution at the electrode surface.
Catalysts 14 00164 g007
Table 1. A comparison of the present work with previous reports in the literature.
ElectrodesMediumPeak Potential/VOnset Potential/VReference
Co3O4/GC0.5 M KOH−0.46−0.36[14]
FeS2-CNT/GC0.1 M NaOH0.490.60[15]
GNR/GC0.1 M KOH−0.30.8[38]
DWCNT/GC0.1 M KOH−0.5−0.4[39]
Pr6O11/GC0.1 M NaOH-0.84[40]
Fe-S-graphene/GC0.1 M KOH0.8 V1.0[41]
LaMn1−xCoxO3/GC0.1 M KOH0.5 V0.7[42]
Pt-C/GC0.1 M KOH−0.30.10[43]
Oxidized GC0.1 M KOH−0.5-[44]
Activated GC0.1 M NaOH−0.34−0.22This work
The reference electrodes for refs. [15,38,41,42] were standard hydrogen electrodes for 43 Hg|HgO, and all other systems were w.r.t Ag/AgCl (sat. KCl).
Disclaimer/Publisher’s Note: The statements, opinions and data contained in all publications are solely those of the individual author(s) and contributor(s) and not of MDPI and/or the editor(s). MDPI and/or the editor(s) disclaim responsibility for any injury to people or property resulting from any ideas, methods, instructions or products referred to in the content.