
Nickel-Based Single-Atom Alloys for Methane Dehydrogenation and the Effect of Subsurface Carbon: First-Principles Investigations


Abstract

1. Introduction
2. Calculation Method
3. Results: Carbon Adsorption on Ni(111)
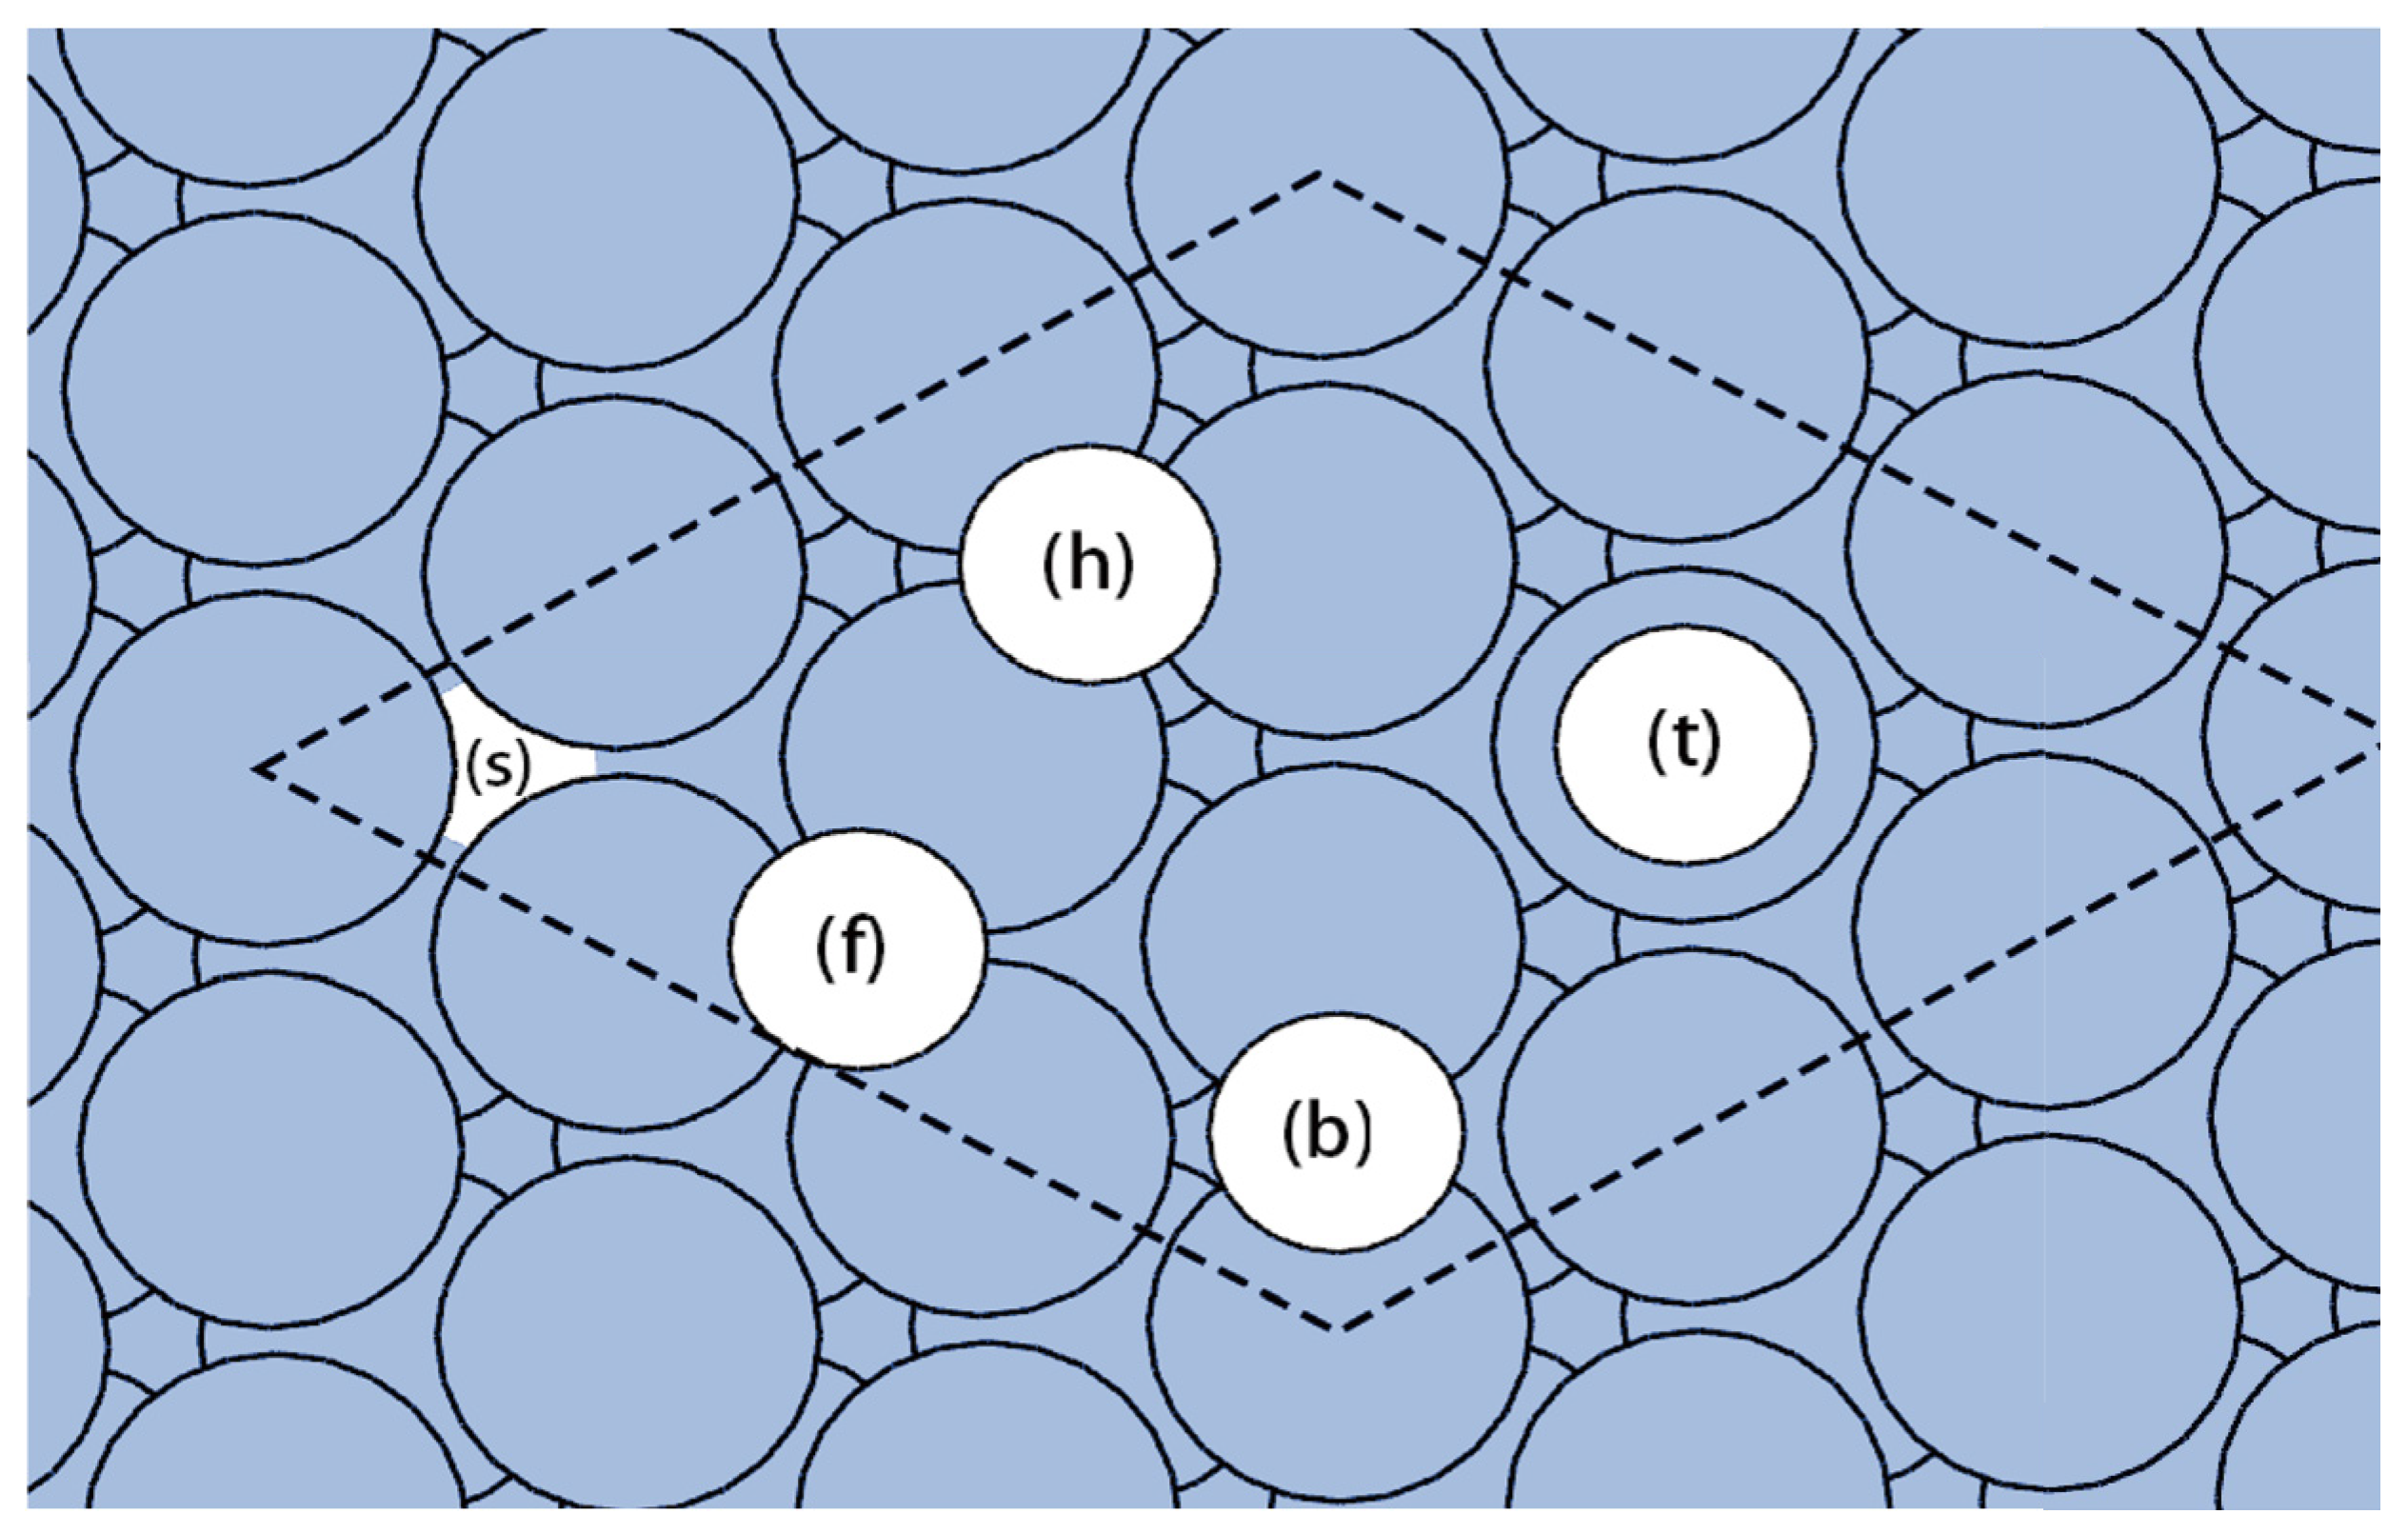
3.1. Adsorption of Carbon on Ni(111): 0.25 and 1 ML
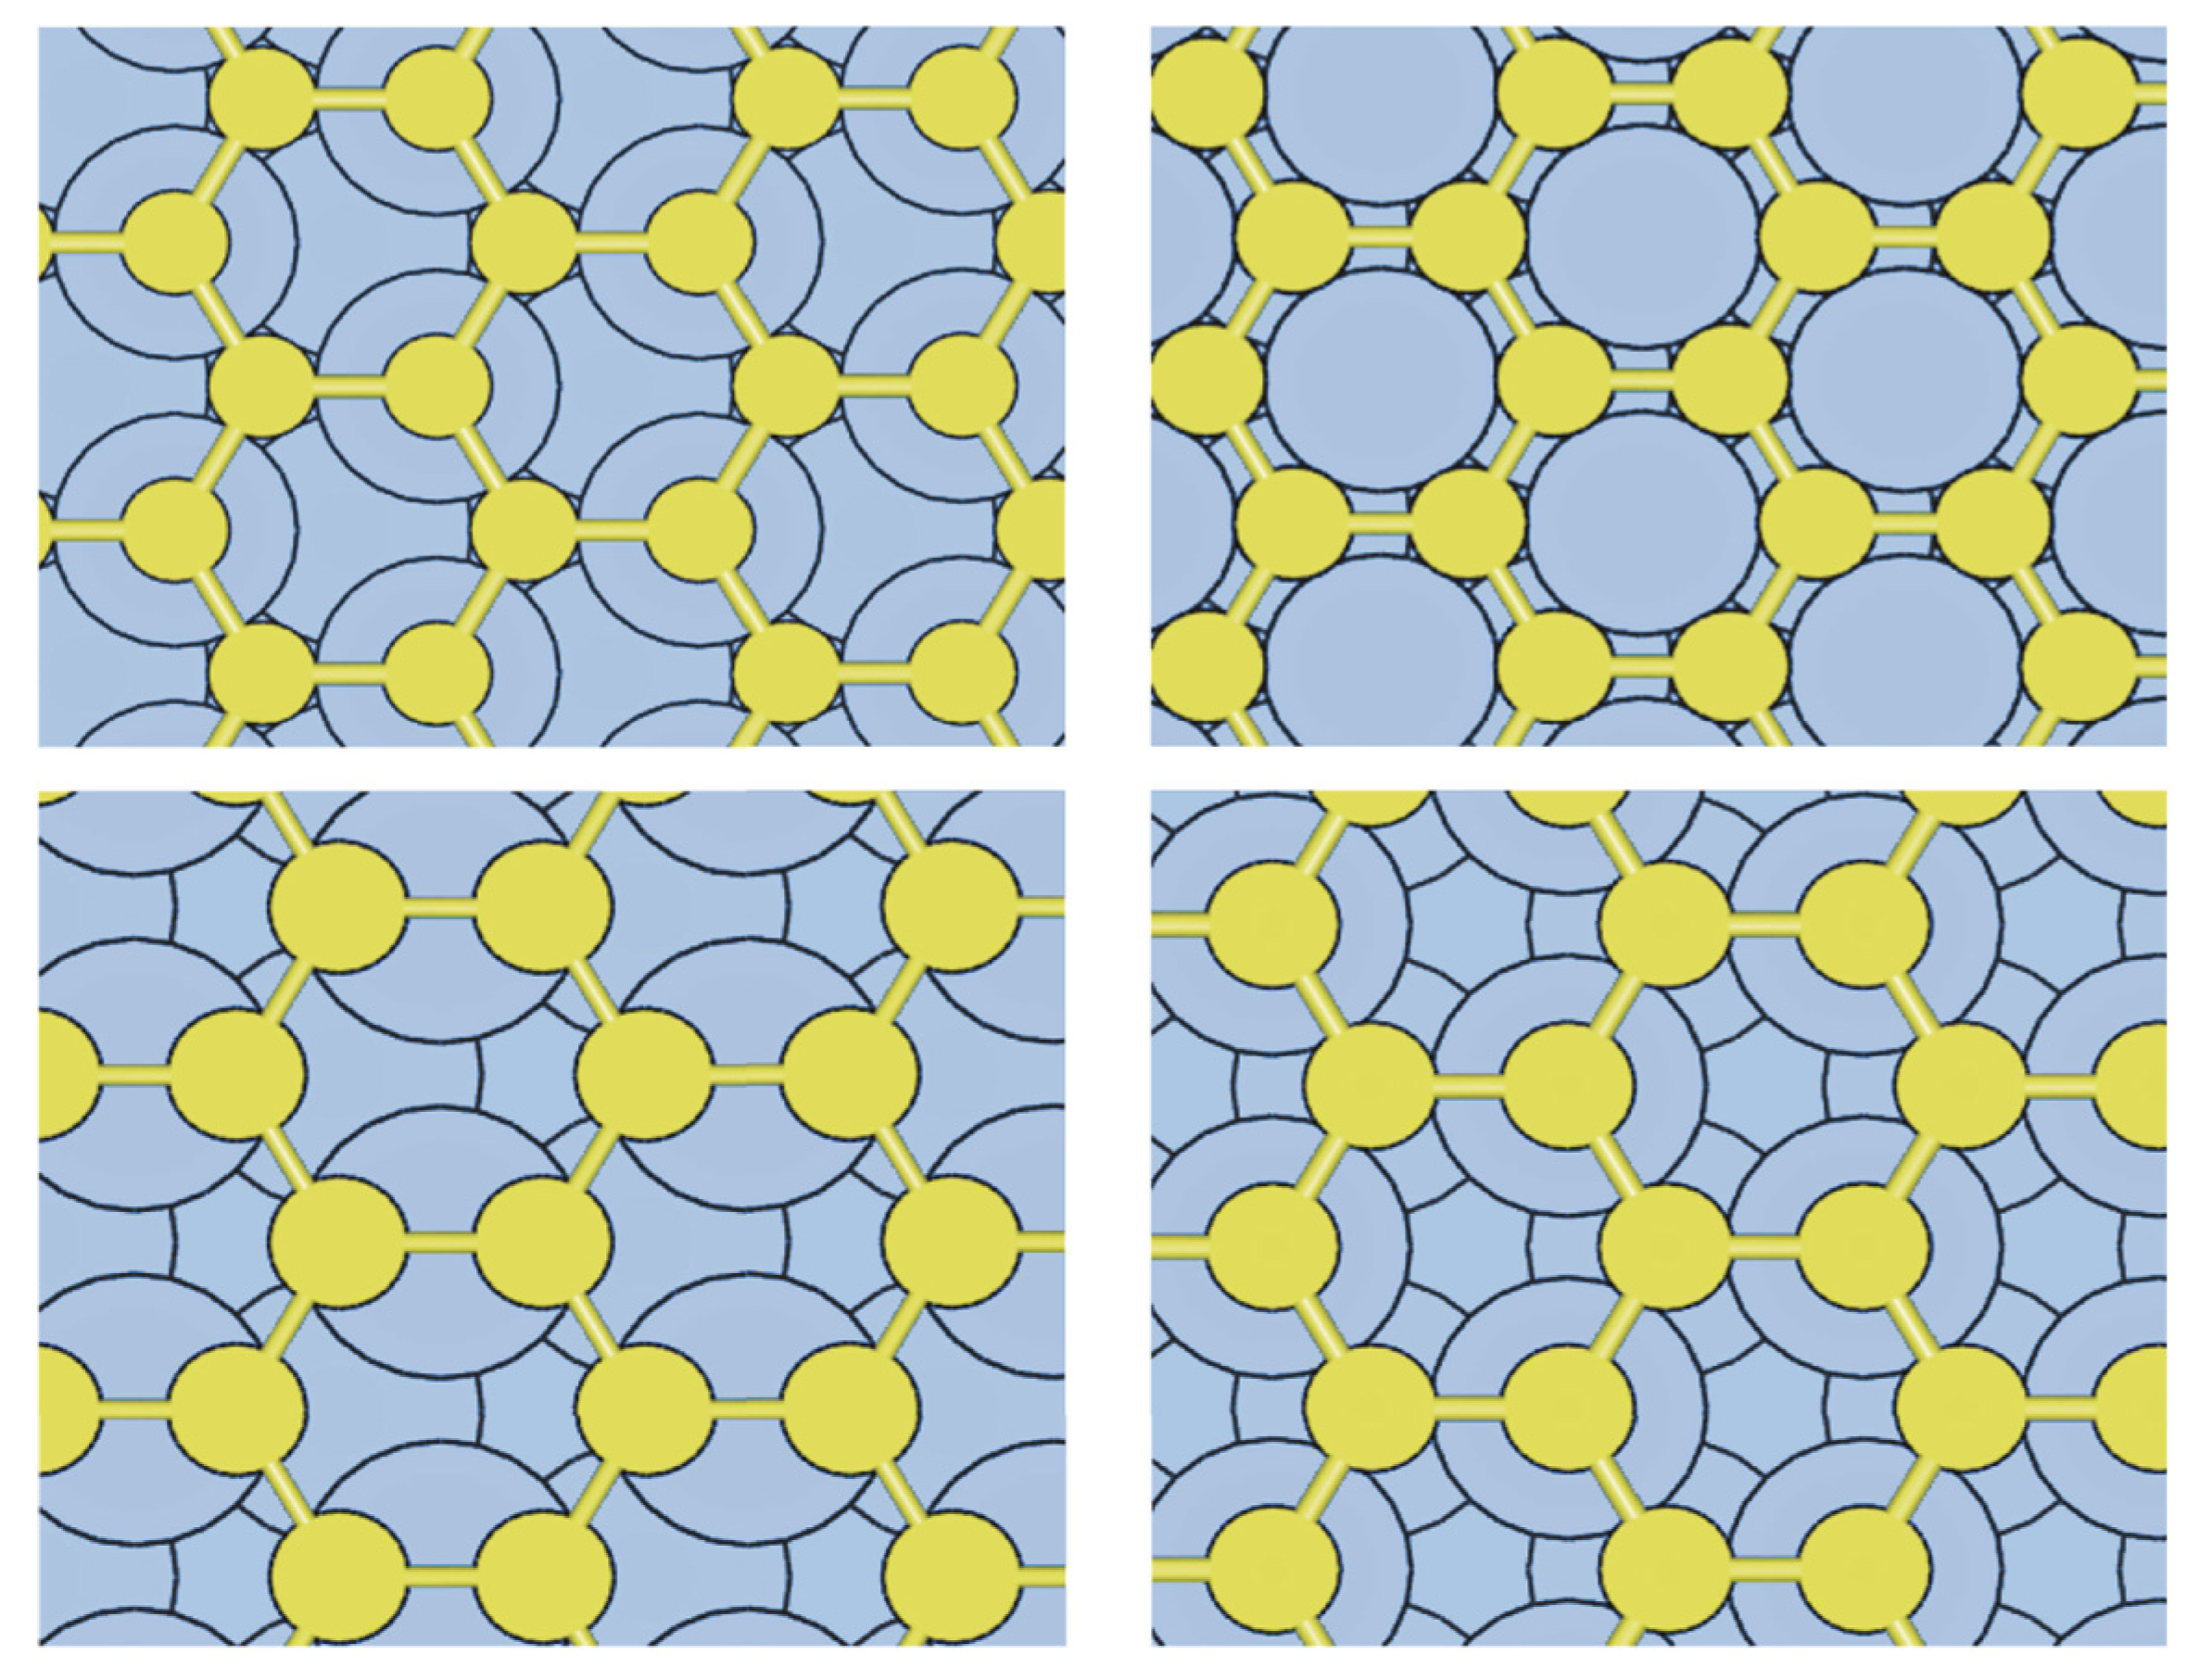
3.2. ML Hexagonal Structures of C on Ni(111) and vdW Corrections
4. Results: Adsorption of Methane and Intermediates
4.1. Adsorption on Ni(111) and Csubsurf /Ni(111)
4.2. Adsorption on the SAA Surfaces
5. Methane Decomposition
5.1. Methane Decomposition: Over Ni(111) and Csubsurf /Ni(111)
5.2. Methane Decomposition over the SAA Surfaces
5.3. d-Band Centre
6. Conclusions
Supplementary Materials
Author Contributions
Funding
Data Availability Statement
Conflicts of Interest
References
- Abbas, H.F.; Daud, W.M.W. Hydrogen production by methane decomposition: A review. Int. J. Hydrogen Energy 2010, 35, 1160–1190. [Google Scholar] [CrossRef]
- Sánchez-Bastardo, N.; Schlogl, R.; Ruland, H. Methane pyrolysis for zeroemission hydrogen production: A potential bridge technology from fossil fuels to a renewable and sustainable hydrogen economy. Ind. Eng. Chem. Res. 2021, 60, 11855–11881. [Google Scholar] [CrossRef]
- Hasnan, N.S.N.; Timmiati, S.N.; Lim, K.L.; Yaakob, Z.; Kamaruddin, N.H.N.; Teh, L.P. Recent developments in methane de- composition over heterogeneous catalysts: An overview. Mater. Renew. Sustain. Energy 2020, 9, 1–18. [Google Scholar] [CrossRef]
- Wang, S.-G.; Cao, D.-B.; Li, Y.-W.; Wang, J.; Jiao, H. Co2 re-forming of ch4 on ni(111): A density functional theory calculation. J. Phys. Chem. B 2006, 110, 9976–9983. [Google Scholar] [CrossRef]
- Minh, D.P.; Siang, T.J.; Vo, D.-V.N.; Phan, T.S.; Ridart, C.; Nzihou, A.; Grouset, D. Hydrogen production from biogas reforming: An overview of steam reforming, dry reforming, dual reforming, and tri-reforming of methane. Hydrogen Supply Chain. 2018, 111–166. [Google Scholar]
- Nair, M.M.; Kaliaguine, S. Structured catalysts for dry reforming of methane. New J. Chem. 2016, 40, 4049–4060. [Google Scholar] [CrossRef]
- Pakhare, D.; Spivey, J. A review of dry (CO2) reforming of methane over noble metal catalysts. Chem. Soc. Rev. 2014, 43, 7813–7837. [Google Scholar] [CrossRef] [PubMed]
- Hannagan, R.T.; Giannakakis, G.; Flytzani-Stephanopoulos, M.; Sykes, E.C.H. Single-atom alloy catalysis. Chem. Rev. 2020, 120, 12044–12088. [Google Scholar] [CrossRef] [PubMed]
- Zhang, T.; Walsh, A.G.; Yu, J.; Zhang, P. Single-atom alloy catalysts: Structural analysis, electronic properties and catalytic activities. Chem. Soc. Rev. 2021, 50, 569–588. [Google Scholar] [CrossRef] [PubMed]
- Greiner, M.T.; Jones, T.E.; Beeg, S.; Zwiener, L.; Scherzer, M.; Girgsdies, F.; Piccinin, S.; Armbru, M.; Knop-Gericke, A.; Schl, R. Free-atom-like d states in single-atom alloy catalysts. Nat. Chem. 2018, 10, 1008–1015. [Google Scholar] [CrossRef] [PubMed]
- Liu, J.; Lucci, F.R.; Yang, M.; Lee, S.; Marcinkowski, M.D.; Therrien, A.J.; Williams, C.T.; Sykes, E.C.H.; Flytzani-Stephanopoulos, M. Tackling co poisoning with single-atom alloy catalysts. J. Am. Chem. Soc. 2016, 138, 6396–6399. [Google Scholar] [CrossRef] [PubMed]
- Kyriakou, G.; Boucher, M.B.; Jewell, A.D.; Lewis, E.A.; Lawton, T.J.; Baber, A.E.; Tierney, H.L.; Flytzani-Stephanopoulos, M.; Sykes, E.C.H. Isolated metal atom geometries as a strategy for selective heterogeneous hydrogenations. Science 2012, 335, 1209–1212. [Google Scholar] [CrossRef] [PubMed]
- Alves, L.; Pereira, V.; Lagarteira, T.; Mendes, A. Catalytic methane decomposition to boost the energy transition: Scientific and technological advancements. Renew. Sustain. Energy Rev. 2021, 137, 110465. [Google Scholar] [CrossRef]
- Ali, S.; Zagho, M.M.; Al-Marri, M.J.; Arafat, Y.I.; Khader, M.M. Development of nickel-based catalysts for methane steam reforming. In Proceedings of the 4th International Gas Processing Symposium, Doha, Qatar, 26–27 October 2014; Elsevier: Amsterdam, The Netherlands, 2015; pp. 111–116. [Google Scholar]
- Hafner, J.; Kresse, G. The vienna ab-initio simulation program vasp: An efficient and versatile tool for studying the structural, dynamic, and electronic properties of materials. Prop. Complex Inorg. Solids 1997, 6982, 69–82. [Google Scholar]
- Perdew, J.P.; Burke, K.; Ernzerhof, M. Generalized gradient approximation made simple. Phys. Rev. Lett. 1996, 77, 38653868. [Google Scholar] [CrossRef] [PubMed]
- Grimme, S.; Antony, J.; Ehrlich, S.; Krieg, H. A consistent and accurate ab initio parametrization of density functional dispersion correction (dft-d) for the 94 elements h-pu. J. Chem. Phys. 2010, 132, 154104. [Google Scholar] [CrossRef] [PubMed]
- Monkhorst, H.J.; Pack, J.D. Special points for brillouin-zone integrations. Phys. Rev. B 1976, 13, 51885192. [Google Scholar] [CrossRef]
- Henkelman, G.; Uberuaga, B.P.; Jnsson, H. A climbing image nudged elastic band method for finding saddle points and minimum energy paths. J. Chem. Phys. 2000, 113, 99019904. [Google Scholar] [CrossRef]
- Henkelman, G.; Jnsson, H. Improved tangent estimate in the nudged elastic band method for finding minimum energy paths and saddle points. J. Chem. Phys. 2000, 113, 99789985. [Google Scholar] [CrossRef]
- Engelmann, Y.; Bogaerts, A.; Neyts, E.C. Thermodynamics at the nanoscale: Phase diagrams of nickel-carbon nanoclusters and equilibrium constants for phase transitions. Nanoscale 2014, 6, 1198111987. [Google Scholar] [CrossRef]
- Caldero, L.A.; Montoya, A.; Soon, A.; Stamp, C. Non-dissociative adsorption of glycerol on the (111) surface of ni and pt-based metallic systems: Hints on re- forming activity from d-band center. Mol. Catal. 2019, 474, 110412. [Google Scholar] [CrossRef]
- Du, P.; Wu, P.; Cai, C. Mechanistic insight into the facet-dependent adsorption of methanol on a pt3ni nanocatalyst. J. Phys. Chem. C 2015, 119, 18352–18363. [Google Scholar] [CrossRef]
- Janthon, P.; Luo, S.; Kozlov, S.M.; Vines, F.; Limtrakul, J.; Truhlar, D.G.; Illas, F. Bulk properties of transition metals: A challenge for the design of universal density functionals. J. Chem. Theory Comput. 2014, 10, 3832–3839. [Google Scholar] [CrossRef]
- Lejaeghere, K.; Van Speybroeck, V.; Van Oost, G.; Cottenier, S. Error estimates for solid-state density-functional theory predictions: An overview by means of the ground-state elemental crystals. Crit. Rev. Solid State Mater. Sci. 2014, 39, 1–24. [Google Scholar] [CrossRef]
- Klinke, D.J., II; Wilke, S.; Broadbelt, L.J. A theoretical study of carbon chemisorption on ni (111) and co (0001) surfaces. J. Catal. 1998, 178, 540–554. [Google Scholar] [CrossRef]
- Zhang, Q.-M.; Wells, J.C.; Gong, X.G.; Zhang, Z. Adsorption of a carbon atom on the ni 38 magic cluster and three low-index nickel surfaces: A comparative first-principles study. Phys. Rev. B 2004, 69, 205413. [Google Scholar] [CrossRef]
- Haynes, W.M. (Ed.) CRC Handbook of Chemistry and Physics; Properties of solids; CRC Press: Boca Raton, FL, USA, 2014; Chapter 12; p. 124. [Google Scholar]
- Michaelson, H.B. The work function of the elements and its periodicity. J. Appl. Phys. 1977, 48, 47294733. [Google Scholar] [CrossRef]
- Shi, H.; Stamp, C. Shape and surface structure of gold nanoparticles under oxidizing conditions. Phys. Rev. B 2008, 77, 094127. [Google Scholar] [CrossRef]
- Soon, A.; Wong, L.; Delley, B.; Stamp, C. Morphology of copper nanoparticles in a nitrogen atmosphere: A first-principles investigation. Phys. Rev. B 2008, 77, 125423. [Google Scholar] [CrossRef]
- Sche, M.; Stamp, C.; Horn, E.K. Handbook of surface science. In Electronic Structure; Elsevier: Amsterdam, The Netherlands, 2000; Volume 2, pp. 286–356. [Google Scholar]
- Klink, C.; Stensgaard, I.; Besenbacher, F.; Lægsgaard, E. An stm study of carbon-induced structures on ni (111): Evidence for a carbidic-phase clock reconstruction. Surf. Sci. 1995, 342, 250–260. [Google Scholar] [CrossRef]
- Gardin, D.E.; Batteas, J.D.; Van Hove, M.A.; Somorjai, G.A. Carbon, nitrogen, and sulfur on ni (111): Formation of complex structures and consequences for molecular decomposition. Surf. Sci. 1993, 296, 25–35. [Google Scholar] [CrossRef]
- Grimme, S.; Ehrlich, S.; Goerigk, L. Effect of the damping function in dispersion corrected density functional theory. J. Comput. Chem. 2011, 32, 14561465. [Google Scholar] [CrossRef]
- Dion, M.; Rydberg, H.; Schr, E.; Langreth, D.C.; Lundqvist, B.I. Van der waals density functional for general geometries. Phys. Rev. Lett. 2004, 92, 246401. [Google Scholar] [CrossRef]
- Niu, J.; Ran, J.; Du, X.; Qi, W.; Zhang, P.; Yang, L. Effect of pt addition on resistance to carbon formation of ni catalysts in methane dehydrogenation over ni-pt bimetallic surfaces: A density functional theory study. Mol. Catal. 2017, 434, 206–218. [Google Scholar] [CrossRef]
- Carey, S.J.; Zhao, W.; Frehner, A.; Campbell, C.T.; Jackson, B. Energetics of adsorbed methyl and methyl iodide on ni (111) by calorimetry: Comparison to pt (111) and implications for catalysis. ACS Catal. 2017, 7, 1286–1294. [Google Scholar] [CrossRef]
- Zhu, Y.-A.; Chen, D.; Zhou, X.-G.; Yuan, W.-K. Dft studies of dry reforming of methane on ni catalyst. Catal. Today 2009, 148, 260–267. [Google Scholar] [CrossRef]
- Wang, X.; Yuan, Q.; Li, J.; Ding, F. The transition metal surface dependent methane decomposition in graphene chemical vapor deposition growth. Nanoscale 2017, 9, 11584–11589. [Google Scholar] [CrossRef] [PubMed]
- Liu, H.; Zhang, R.; Yan, R.; Li, J.; Wang, B.; Xie, K. In- sight into ch4 dissociation on nicu catalyst: A first-principles study. Appl. Surf. Sci. 2012, 258, 81778184. [Google Scholar] [CrossRef]
- Foppa, L.; Silaghi, M.-C.; Larmier, K.; Comas-Vives, A. Intrinsic reactivity of ni, pd and pt surfaces in dry reforming and competitive reactions: Insights from first principles calculations and microkinetic modeling simulations. J. Catal. 2016, 343, 196207. [Google Scholar] [CrossRef]
- Bengaard, H.S.; Nrskov, J.K.; Sehested, J.; Clausen, B.S.; Nielsen, L.P.; Molenbroek, A.M.; Rostrup-Nielsen, J.R. Steam reforming and graphite formation on ni catalysts. J. Catal. 2002, 209, 365384. [Google Scholar] [CrossRef]
- Watwe, R.M.; Bengaard, H.S.; Rostrup-Nielsen, J.R.; Dumesic, J.A.; Norskov, J.K. Theoretical studies of stability and reactivity of chx species on ni(111). J. Catal. 2000, 189, 1630. [Google Scholar] [CrossRef]
- Kratzer, P.; Hammer, B.; Norskov, J.K. A theoretical study of ch4 dissociation on pure and goldalloyed ni(111) surfaces. J. Chem. Phys. 1996, 105, 55955604. [Google Scholar] [CrossRef]
- Arevalo, R.L.; Aspera, S.M.; Escao, M.C.; Nakanishi, H.; Kasai, H. Tuning methane decomposition on stepped ni surface: The role of subsurface atoms in catalyst design. Sci. Rep. 2017, 7, 13963. [Google Scholar] [CrossRef] [PubMed]
- Abild-Pedersen, F.; Greeley, J.; Nørskov, J.K. Understanding the effect of steps, strain, poisons, and alloying: Methane activation on ni surfaces. Catal. Lett. 2005, 105, 9–13. [Google Scholar] [CrossRef]
- The d-Band Center Is Calculated Using the Perl Script Called dosanalyze.pl. Github Site of Raghvender. Available online: https://github.com/rvraghvender/VASP-codes (accessed on 8 February 2024).


| Θ (ML) | SITE | Ead (eV) | R (Å) | Δd12 (%d0) | Φ (eV) | ΔΦ (eV) |
|---|---|---|---|---|---|---|
| 1 | top | −4.46 | 1.17 | 4.56 | 7.06 | 2.02 |
| 1 | bridge | −4.77 | 1.84 | 4.64 | 7.26 | 2.22 |
| 1 | fcc | −5.10 | 1.86 | 6.17 | 6.80 | 1.77 |
| 1 | hcp | −5.08 | 1.87 | 5.64 | 6.92 | 1.88 |
| 1 | subsurface | −6.29 | 1.92, 1.93 | 24.12 | 5.14 | 0.10 |
| 0.25 | op | −4.55 | 1.64 | 2.12 | 6.03 | 0.99 |
| 0.25 | bridge | −6.47 | 1.72 | 6.73 | 5.87 | 0.84 |
| 0.25 | fcc | −6.88 | 1.77 | 3.25 | 6.07 | 1.03 |
| 0.25 | hcp | −6.95 | 1.77 | 1.41 | 5.92 | 0.88 |
| 0.25 | subsurface | −7.38 | 1.84, 1.87 | 7.79 | 5.31 | 0.27 |
| Method | Coverage (ML) | Site | Eads (eV) | Eads (eV) no vdW | ΔE (eV) |
|---|---|---|---|---|---|
| 0.25 | on-top | −4.76 | −4.55 | −0.22 | |
| 0.25 | bridge | −6.64 | −6.47 | −0.17 | |
| 0.25 | fcc | −7.08 | −6.88 | −0.20 | |
| 0.25 | hcp | −7.15 | −6.95 | −0.20 | |
| 1 | on-top | −4.70 | −4.46 | −0.24 | |
| 1 | bridge | −5.03 | −4.77 | −0.26 | |
| optB86b-vdW | 1 | fcc | −5.35 | −5.10 | −0.24 |
| 1 | hcp | −5.34 | −5.08 | −0.26 | |
| 1 | subsurface | −6.05 | −5.86 | −0.19 | |
| 2 | bridge-top | −8.17, −0.26 | −7.91, 0.04 | −0.30 | |
| 2 | fcc-top | −8.07, −0.15 | −7.92, 0.03 | −0.18 | |
| 2 | hcp-top | −8.15, −0.24 | −7.91, 0.04 | −0.28 | |
| 0.25 | on-top | −4.78 | −4.55 | −0.23 | |
| 0.25 | bridge | −6.62 | −6.47 | −0.15 | |
| 0.25 | fcc | −7.06 | −6.88 | −0.18 | |
| 0.25 | hcp | −7.13 | −6.95 | −0.18 | |
| 1 | on-top | −4.73 | −4.46 | −0.27 | |
| 1 | bridge | −5.02 | −4.77 | −0.25 | |
| DFT-D3 | 1 | fcc | −5.35 | −5.10 | −0.25 |
| 1 | hcp | −5.33 | −5.08 | −0.25 | |
| 1 | subsurface | −6.08 | −5.86 | −0.22 | |
| 2 | bridge-top | −7.97, −0.06 | −7.91,0.04 | −0.10 | |
| 2 | fcc-top | −7.98, −0.07 | −7.92,0.03 | −0.10 | |
| 2 | hcp-top | −7.96, −0.05 | −7.91,0.04 | −0.10 |
| Site | (4 × 4) Eads (eV) | Esub (eV) | ΔEsub (eV) | (2 × 2) Eads (eV) | ΔE (eV) |
|---|---|---|---|---|---|
| CH4 on-top | −0.15 | −0.16 | |||
| CH4 bridge | −0.15 | ||||
| CH4 fcc | −0.14 | ||||
| CH4 hcp | −0.14 | ||||
| CH3 fcc | −2.61 | −2.16 | 0.44 | −2.51 | 0.10 |
| CH3 hcp | −2.06 | −2.06 | 0.00 | −2.51 | −0.45 |
| CH3 top | −2.18 | −2.17 | 0.01 | −2.17 | 0.02 |
| CH2 fcc | −4.35 | −3.65 | 0.70 | −4.36 | −0.01 |
| CH2 hcp | −4.30 | −4.11 | 0.20 | −4.33 | −0.02 |
| CH2 top | −3.27 | −3.10 | 0.17 | −4.36 | −1.09 |
| CH fcc | −6.68 | −5.76 | 0.92 | −6.62 | 0.05 |
| CH hcp | −6.67 | −6.34 | 0.31 | −6.65 | 0.02 |
| CH top | −6.64 | −6.20 | 0.44 | −6.62 | 0.01 |
| H fcc | −2.99 | −2.56 | 0.43 | −2.93 | 0.05 |
| H hcp | −2.95 | −2.86 | 0.10 | −2.40 | 0.55 |
| H top | −2.37 | −2.31 | 0.06 | −1.93 | 0.44 |
| C fcc | −7.05 | −6.13 | 0.93 | −7.06 | −0.01 |
| C hcp | −7.14 | −6.80 | 0.34 | −7.13 | 0.01 |
| C top | −4.85 | −4.47 | 0.37 | −4.78 | 0.07 |
| C Subsurface octa | −7.79 | −7.57 | 0.23 | ||
| C Subsurface tetra | −7.14 | −6.15 | 0.99 |
| Adsorbates | Cu | Fe | Pt | Pd | Zn | Al | Ni |
|---|---|---|---|---|---|---|---|
| CH4 | −0.18 | −0.17 | −0.19 | −0.20 | −0.19 | −0.20 | −0.15 |
| CH3 | −2.33 | 2.5 | −2.24 | −2.31 | −2.15 | −2.53 | −2.61 |
| CH2 | −4.02 | −3.95 | −4.22 | −3.98 | −3.86 | −3.97 | −4.35 |
| CH | −6.18 | −6.45 | −6.46 | −6.35 | −6.57 | −6.57 | −6.68 |
| C | −5.63 | −9.75 | −8.31 | −6.98 | −3.74 | −7.14 | −7.14 |
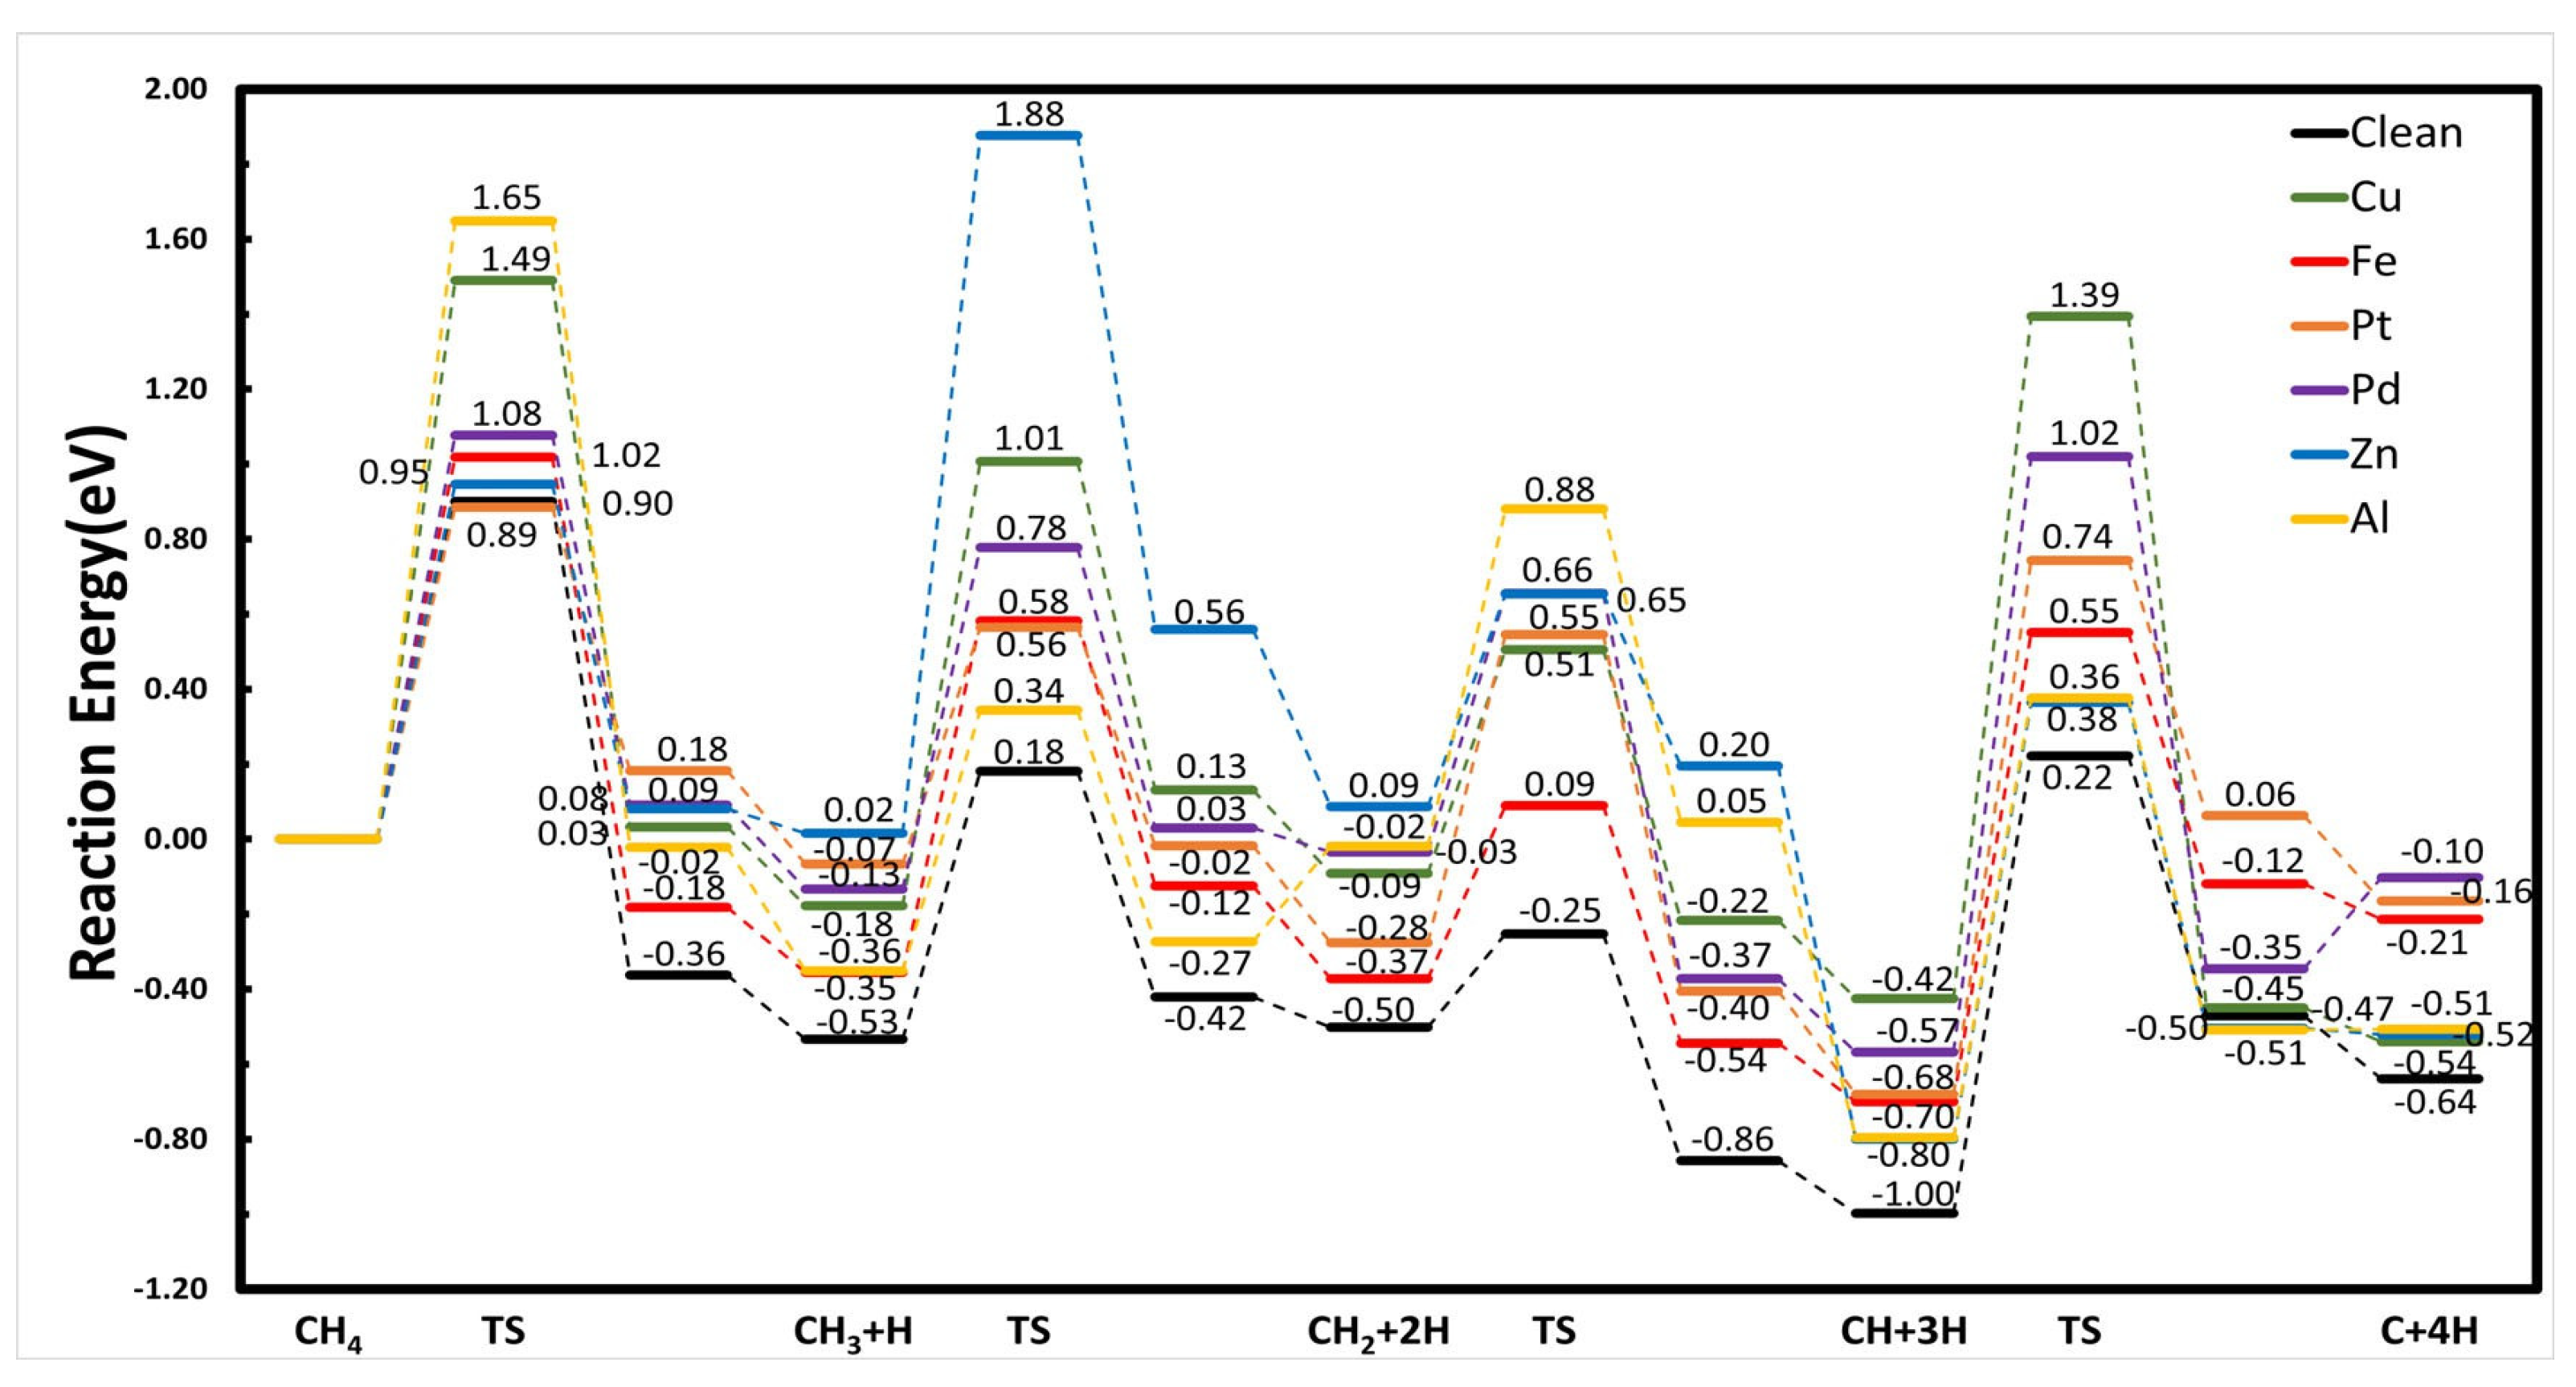
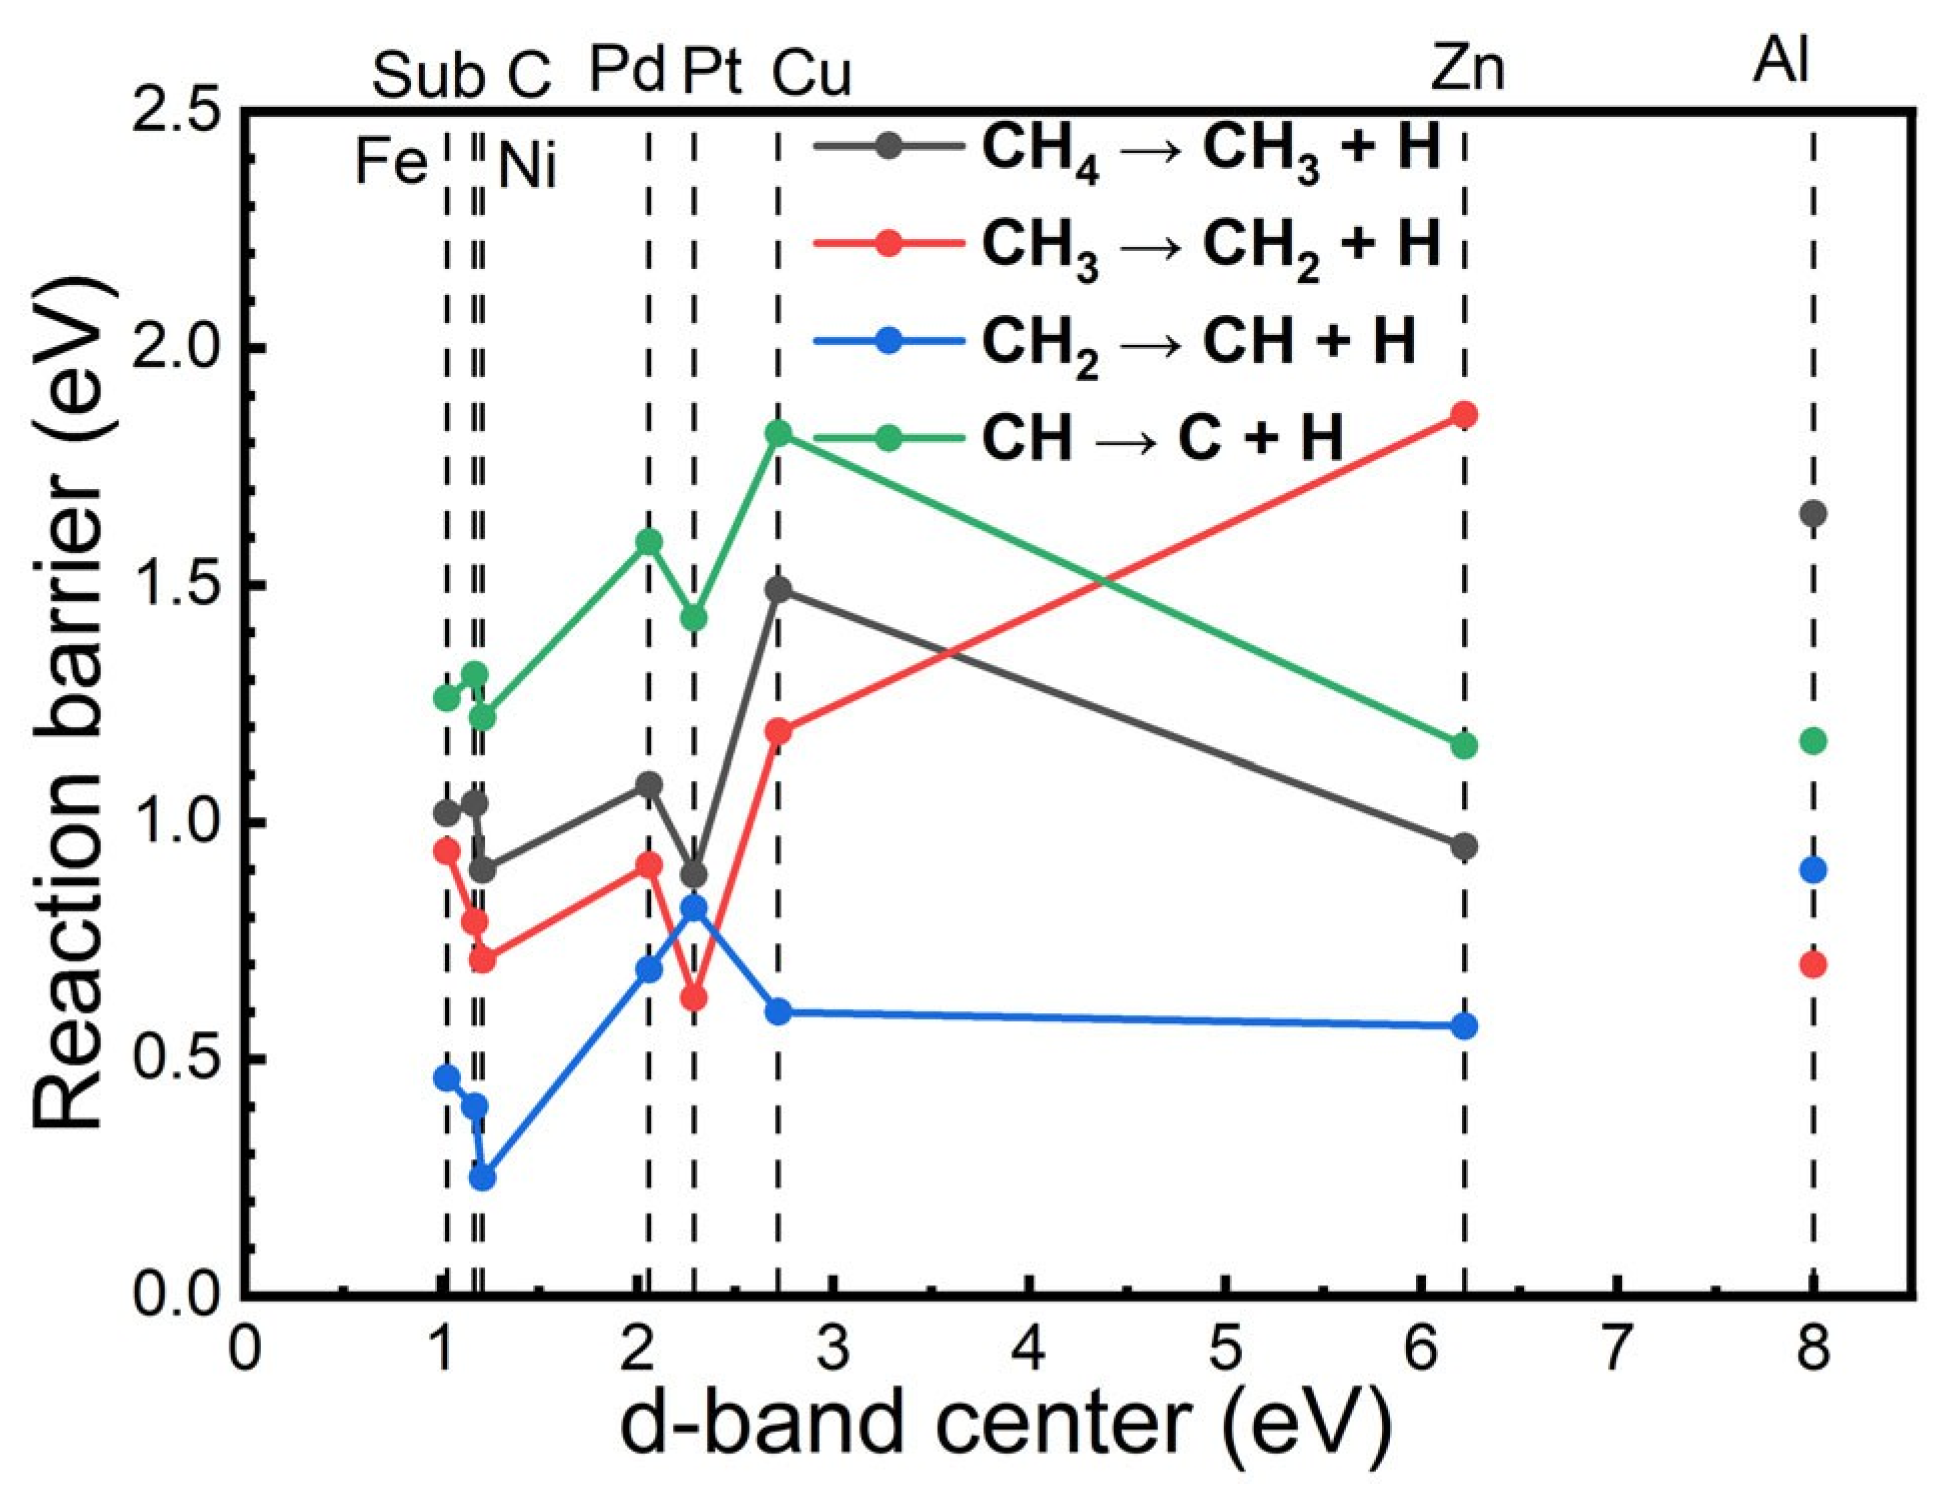
| Reaction Barriers | Cu | Fe | Pt | Pd | Zn | Al | Ni | Csubsurf/Ni |
|---|---|---|---|---|---|---|---|---|
| CH4 → CH3 + H | 1.49 | 1.02 | 0.89 | 1.08 | 0.95 | 1.65 | 0.90 | 1.04 |
| CH3 → CH2 + H | 1.19 | 0.94 | 0.63 | 0.91 | 1.86 | 0.70 | 0.71 | 0.79 |
| CH2 → CH + H | 0.60 | 0.46 | 0.82 | 0.69 | 0.57 | 0.90 | 0.25 | 0.40 |
| CH → C + H | 1.82 | 1.26 | 1.43 | 1.59 | 1.16 | 1.17 | 1.22 | 1.31 |
Disclaimer/Publisher’s Note: The statements, opinions and data contained in all publications are solely those of the individual author(s) and contributor(s) and not of MDPI and/or the editor(s). MDPI and/or the editor(s) disclaim responsibility for any injury to people or property resulting from any ideas, methods, instructions or products referred to in the content. |
© 2024 by the authors. Licensee MDPI, Basel, Switzerland. This article is an open access article distributed under the terms and conditions of the Creative Commons Attribution (CC BY) license (https://creativecommons.org/licenses/by/4.0/).
Share and Cite
Dong, N.; Roman, T.; Stampfl, C. Nickel-Based Single-Atom Alloys for Methane Dehydrogenation and the Effect of Subsurface Carbon: First-Principles Investigations. Catalysts 2024, 14, 145. https://doi.org/10.3390/catal14020145
Dong N, Roman T, Stampfl C. Nickel-Based Single-Atom Alloys for Methane Dehydrogenation and the Effect of Subsurface Carbon: First-Principles Investigations. Catalysts. 2024; 14(2):145. https://doi.org/10.3390/catal14020145
Chicago/Turabian StyleDong, Naiyuan, Tanglaw Roman, and Catherine Stampfl. 2024. "Nickel-Based Single-Atom Alloys for Methane Dehydrogenation and the Effect of Subsurface Carbon: First-Principles Investigations" Catalysts 14, no. 2: 145. https://doi.org/10.3390/catal14020145
APA StyleDong, N., Roman, T., & Stampfl, C. (2024). Nickel-Based Single-Atom Alloys for Methane Dehydrogenation and the Effect of Subsurface Carbon: First-Principles Investigations. Catalysts, 14(2), 145. https://doi.org/10.3390/catal14020145