Article

Role of the Solvent and Ultrasound Irradiation in the Preparation of TiO2 for the Photocatalytic Degradation of Sulfamethoxazole in Water

1
Dipartimento di Fisica e Geologia, Università di Perugia, Via Pascoli, 06123 Perugia, Italy
2
Dipartimento di Chimica, Biologia e Biotecnologie, Università di Perugia, Via Elce di sotto 8, 06123 Perugia, Italy
3
Dipartimento di Scienze Farmaceutiche, Università di Perugia, Via del Liceo 1, 06123 Perugia, Italy
4
Dipartimento di Chimica, Università degli Studi di Milano, Via Golgi 19, 20133 Milano, Italy
*
Author to whom correspondence should be addressed.
Catalysts 2024, 14(12), 910; https://doi.org/10.3390/catal14120910
Submission received: 6 November 2024 / Revised: 6 December 2024 / Accepted: 7 December 2024 / Published: 11 December 2024

Abstract

:
The preparation of titania-based photocatalysts has been largely investigated in the literature. Nevertheless, the study of the influence of different solvents in the synthesis mixture requires further analysis. Addressing this issue, we explored the potential of heterogeneous photocatalysis with nano-sized titanium dioxide (TiO2) synthesized via the sol–gel method with and without ultrasound for the degradation of sulfamethoxazole (SMX) in water. Specifically, we engineered TiO2 nanoparticles within the 20–30 nm range, in order to work in the same particle size range of Evonik P25. The synthesis was conducted in five distinct solvents, n-hexane, decane, isopropanol, ethanol, and 1-octanol, and it was evaluated with the presence and absence of ultrasound. Following synthesis, the powders were thoroughly characterized. When nonpolar solvents were used, the photocatalysts were characterized by the presence of both anatase and brookite phases, while with polar solvents, the only polymorph present was anatase. A different behavior was shown by 1-octanol, where the role of the solvent was so important that US did not affect the final sample features. The samples prepared in ethanol and isopropanol exhibited superior activity compared to those synthesized in other solvents in the SMX photodegradation (about 35% after 6 h), and the effect of US during preparation resulted positive for all solvents (an average increase of SMX photodegradation in the range of 5–10% for the different photocatalysts for each degradation time).

Graphical Abstract

1. Introduction

Environmental contamination by pharmaceuticals is an increasingly prominent issue. Recent studies have highlighted concerns regarding the quality of drinking water, specifically related to the presence of emerging contaminants. These include a variety of pharmaceutical compounds such as antibiotics, anti-convulsants, mood stabilizers, and sex hormones, all of which have been detected in water supplies [1]. Such contaminants pose potential health risks, warranting closer examination. The primary source of this contamination is traced back to consumers. Pharmaceuticals, once administered, are not always fully metabolized by the body. Consequently, a significant portion can be excreted unmetabolized through urine or feces. This is true for both human medications and veterinary drugs, making patients and treated animals the main contributors to pharmaceutical pollution in water systems.
Pharmaceuticals are present at very low concentrations in the aqueous environment, but active ingredients are designed to stimulate a response in humans and animals at low doses with a very specific target, making the implications for human health and the environment a matter of concern. Antibiotics are among the most successful drugs used for human therapy. However, since they can challenge microbial populations, they must be considered important pollutants as well. In addition to being used for human therapy, antibiotics are extensively used for animal farming and for agricultural purposes. Residues from human environments and from farms may contain antibiotics and antibiotic resistance genes that can contaminate natural environments. The clearest consequence of antibiotic release in natural environments is the selection of resistant bacteria. The same resistance genes found in clinical settings are currently disseminated among pristine ecosystems without any record of antibiotic contamination. Nevertheless, the effect of antibiotics on the biosphere is wider than this and can impact the structure and activity of environmental microbiota [2].
Among the most common antibiotics, sulfamethoxazole (SMX) is a very resistant molecule, and it passes fully undegraded through the common purification plants.
So-called Advanced Oxidation Processes (AOPs) seem to give very satisfactory answers for these problems related to water pollution and can be considered emerging technologies in this field [3].
In particular, among them, photocatalysis is a very efficient process, which often allows the complete degradation and mineralization of the pollutant molecules without the addition of new reactants in the process.
The literature dedicated to the study of photocatalytic processes for the purification of water from organic contaminants of various types is very varied and in-depth, and the number of publications has continuously grown in recent years [4]. In this context, a particular aspect of the photocatalyst preparation procedures, not yet sufficiently explored, is the effect of the solvents used in the synthesis mixtures. A systematic study in which different kinds of solvents (polar and nonpolar) are used in the synthesis of the photocatalysts and their effects are compared for the resulting physico-chemical properties and then for the photocatalytic performance can contribute to the state of the art of this AOP technology. Despite their fundamental role in the definition of the final properties of the prepared materials, the influence of the solvents is scarcely investigated in the literature, in particular for the preparation of photocatalysts with particle sizes in the range of 20–30 nm.
In the present paper, the preparation of powdered TiO2, with crystallites always in the range of nanometers (20–30 nm), the same particle size range as the well-known reference standard photocatalyst Evonik P25, was performed by the sol–gel method with the presence or absence of ultrasound (US) during the preparation step. The advantages of ultrasound application during the preparation of materials have been demonstrated in comparison to other conventional stirring methods of the preparation of titania [5,6,7]. The effects of different solvents can be different in the presence of ultrasound, as their propagation in the liquid is strongly affected by the specific properties of the media, such as vapor pressure, viscosity, and surface tension [8].
Sonochemical processes are an alternative to traditional TiO2 synthesis procedures, i.e., the sol–gel method, hydrothermal technique, reverse micelle method, or oxidation of metallic Ti powder, to obtain materials with improved or unusual properties [9]. The ultrasound-assisted synthesis of titanium dioxide is well known in the recent literature [9,10,11,12,13,14]. The chemical effect of US arises from acoustic cavitation, i.e., the formation, growth, and implosive collapse of bubbles in a liquid. Some of the interesting features resulting from the application of sonication treatment are the more uniform size distribution, higher surface area, and more controlled phase composition of the synthesized nanoparticles [15,16].
US can be used, by definition, in liquid media. All the US-based treatments can be consequently delivered only using a solvent in which the catalyst precursors are mixed and/or suspended. In the ultrasound-based preparation of heterogeneous catalysts, the choice of solvent plays a crucial role in influencing the characteristics and performance of the catalyst [17]. The solvent serves as a medium for the dispersion of precursor materials and plays a vital role in controlling the morphology, particle size, and surface properties of the catalyst nanoparticles. The cavitation effect induced by ultrasound in the solvent promotes the efficient mixing and dispersion of reactants, leading to a more uniform and well-defined catalyst structure [18]. Additionally, the solvent can affect the reduction kinetics, crystallinity, and phase composition of the catalyst during ultrasound-assisted synthesis [19]. Therefore, the careful selection of solvent parameters such as polarity, viscosity, and boiling point becomes imperative to tailor the catalyst’s properties for optimal catalytic activity in specific reactions. The influence of the solvent in ultrasound-assisted catalyst preparation underscores its significance in achieving enhanced catalytic performance and structural control [20].
In the present paper, the influence of ultrasound during the preparation of photoactive TiO2 on the optimization of the growth in the crystallite size is investigated: in particular, we observed a modification of the material properties when we modified the solvent used during the preparation. Five different organic solvents were chosen for the present study, both polar and nonpolar; we avoided the use of solvents with heteroatoms (S, N), which could introduce a dopant source into the final oxide, but monitored only the effect of the carbon chain length, and investigated their role in the photocatalytic properties of the final material. The different properties of the photocatalysts obtained using different solvents were investigated, both in terms of characterization results and photocatalytic performance in the degradation of SMX in water.

2. Results and Discussion

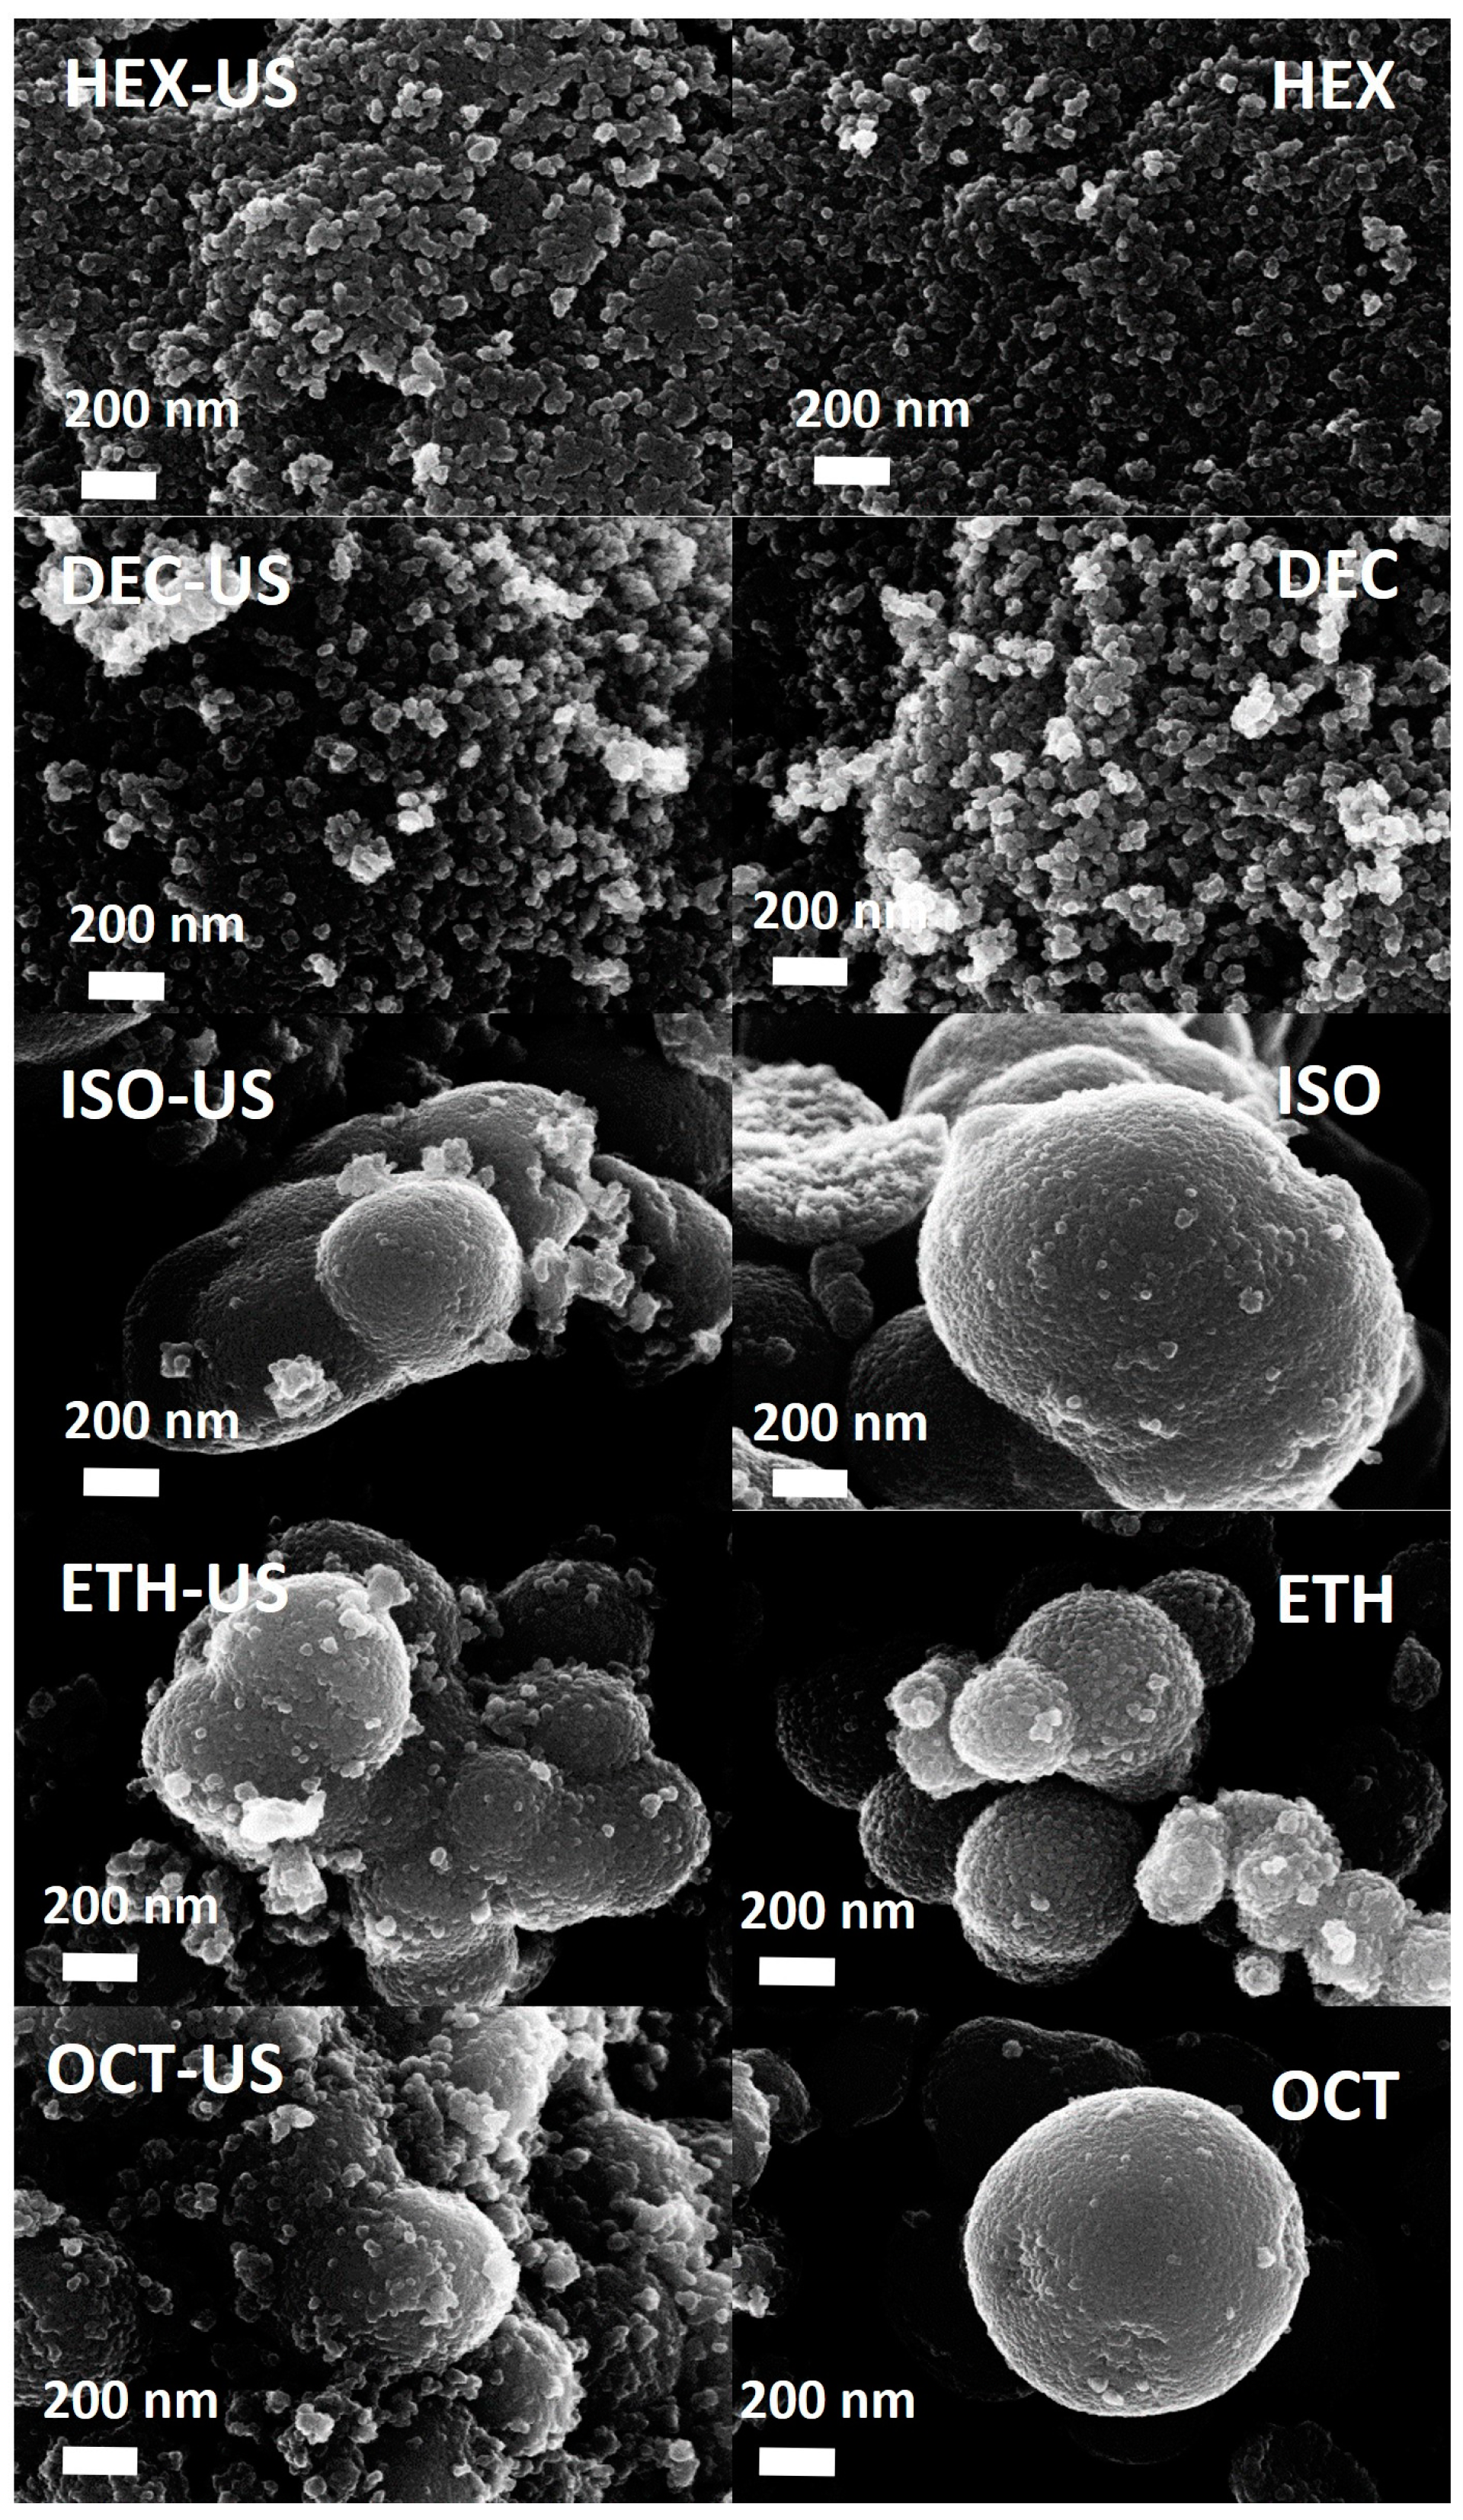
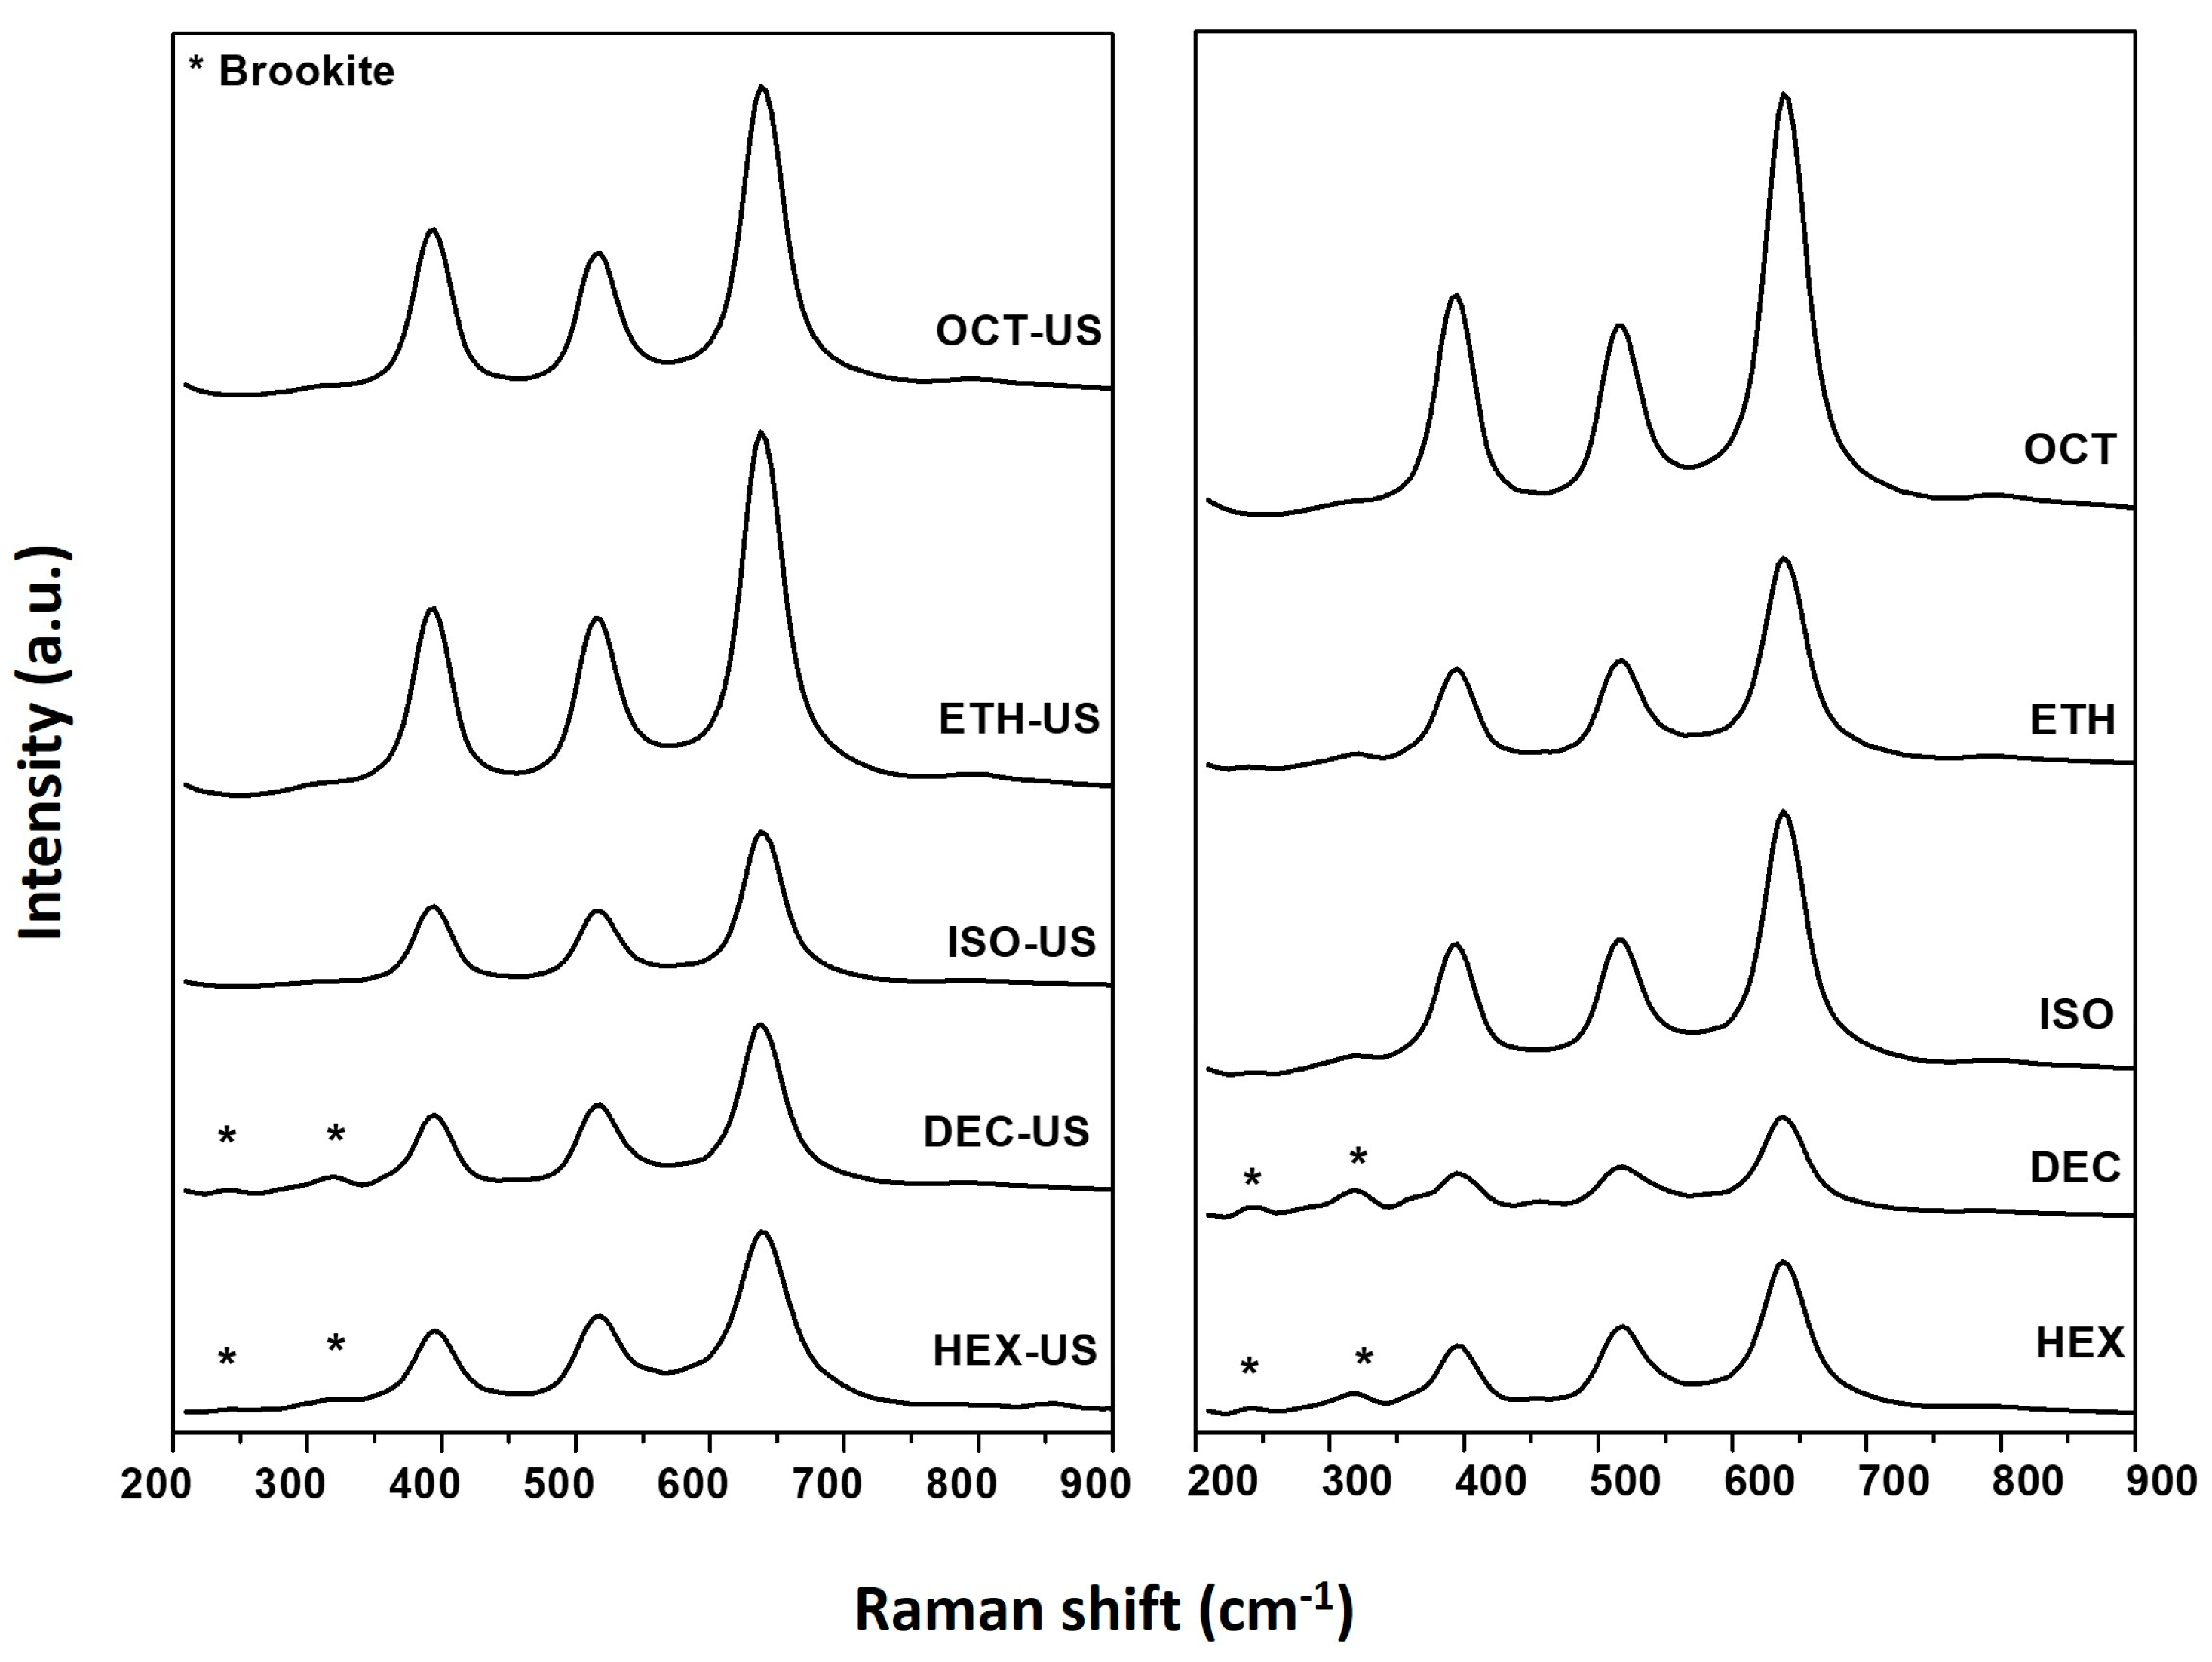
2.1. Characterization Results

Table 1 lists the sample preparation details (kind of solvent, use of US) together with characterization results: surface area, phase composition, and crystallite size (obtained by a Rietveld elaboration of XRD data).
BET surface areas for the samples are in the range of 41–78 m2/g, except for the two samples prepared with 1-octanol, which show very low values. The phase composition and the mean crystallite size were not influenced by the ultrasonic treatment for these samples. On the contrary, in all other cases, the use of ultrasound and the change of solvent led to modifications in the sample features. When nonpolar solvents were used, the photocatalysts were characterized by the presence of both anatase and brookite phases, the second in good amounts, especially when a hydrocarbon with a longer chain was used. US did not modify this effect, but they were brought to a different crystallite size, but in an opposite way: towards an enlargement with decane, but a decrease with hexane, once more underlining the possible effect of the chain length during the hydrolysis step.
With polar solvents, the only polymorph of TiO2 present in the samples was anatase. US treatment led, in all cases, to both a reduction in the surface area and an increase in the mean crystallite size. The use of ultrasound increased the specific surface area of all samples, but their crystallite sizes decreased [21], and this depended on the irradiation effect promoted by US, which may improve the direct interaction between precursors in the liquid phase, and other indirect effects caused by the growth and implosive collapse of bubbles, as already reported in the introduction. A different behavior was shown by 1-octanol, wherein the role of the solvent is so important that US did not affect the final samples’ features.
The real influence of ultrasound-based synthesis of the samples is then clearly demonstrated as compared to the conventional stirring method for the preparation of titania. The nanocrystallinity of the different titania samples was verified by the morphologic analysis (SEM and TEM), as reported in Figure 1 and Figure 2.
In particular, the particles are characterized by a spherical nature and have a uniform size. Particles synthesized in nonpolar solvents exhibit greater agglomeration, while in alcoholic solvents, they exhibit a clear three-dimensional structure. The ultrasound treatment further enhanced this feature.
In the literature, it is well known that during the hydrolysis of titanium alkoxides in an alcoholic medium, a spherical agglomeration of nanoparticles occurs. This is because alcohols promote a spherical spontaneous agglomeration driven by hydrogen bonding or electrostatic and Van der Waals forces to minimize the total surface energy of nanoparticles [22,23].
By μRaman analyses (Figure 3), we can observe that some samples show both anatase and brookite polymorphs. To evaluate the phase composition, XRD spectra (spectra shown in supporting materials) were elaborated by the Rietveld method, and the results are shown in Table 1.
In all the synthesized samples, no rutile phase was observed because during hydrolysis, the ambient was not acid, and the temperatures of calcination were lower than 700 °C.
μRaman spectra (Figure 3) confirm the phase compositions detected by XRD. Peaks corresponding to vibrations of the anatase lattice, 396 cm−1 (B1g), 516 cm−1 (A1g + B1g), and 639 cm−1 (Eg), are present in all cases. The spectra of samples HEX-US, HEX, DEC-US, and DEC also show the presence of brookite crystallites: 246 cm−1 (A1g) and 322 cm−1 (B1g). The presence of brookite phase in some samples is due mainly to the different nature of the solvents and the temperature effect.
The different characteristics of the solvent can play an important role, as the hybrid inorganic/organic precursor formed between the hexane or decane and titanium butoxide may promote the formation of the brookite phase [24]. H. Kominami et al. [25] also reported that surfactants such as sodium laurate could enhance the nucleation of brookite because a mixture of anatase and rutile phases was formed in the absence of sodium laurate. Moreover, about the possible temperature effect, J. C. Yu et al. [26] have shown that during the synthesis, the formation of brookite is believed to be temperature-dependent. When the sonication of titanium isopropoxide in water was carried out without cooling under high-intensity ultrasound irradiation (resulting temperature in the range of 40–60 °C), only anatase was formed. In contrast, a mixture of brookite and anatase was produced with cooling (resulting temperature in the range of 20–30 °C).
The effect of the polarity of solvents is due to the influence they have on the structure of water molecules; in particular, the apolar and hydrophobic nature of the solvent removes the water molecules from titanium butoxide, slowing or hindering the hydrolysis reaction. This leads the formation of distorted TiO6 octahedron brookite, while polar solvents accelerate the hydrolysis reaction and lead to the formation of tetragonal crystals of anatase [27]. This explains how the nature of the solvent influences the formation of crystalline phases of TiO2, and especially how nonpolar solvents lead to the formation of brookite and anatase, while polar solvents lead only to anatase. A different scenario occurs when 1-octanol is used as solvent. This last one, in fact, is a particular solvent because it is characterized by an amphiphilic nature. More in detail, 1-octanol cannot self-organize to produce inverse micelle formations or layers in a mixture with water; nevertheless, the distribution of alcohol clusters is suitable for creating an alternation of regions with polar and hydrophobic characters. The spectroscopic study in reference [28] shows that there is a higher probability of finding a 1-octanol hydroxyl group H-bonded to other 1-octanol hydroxyl groups than to water molecules. These considerations led us to hypothesize that these aggregates do not hinder the water during the hydrolysis of titanium butoxide.

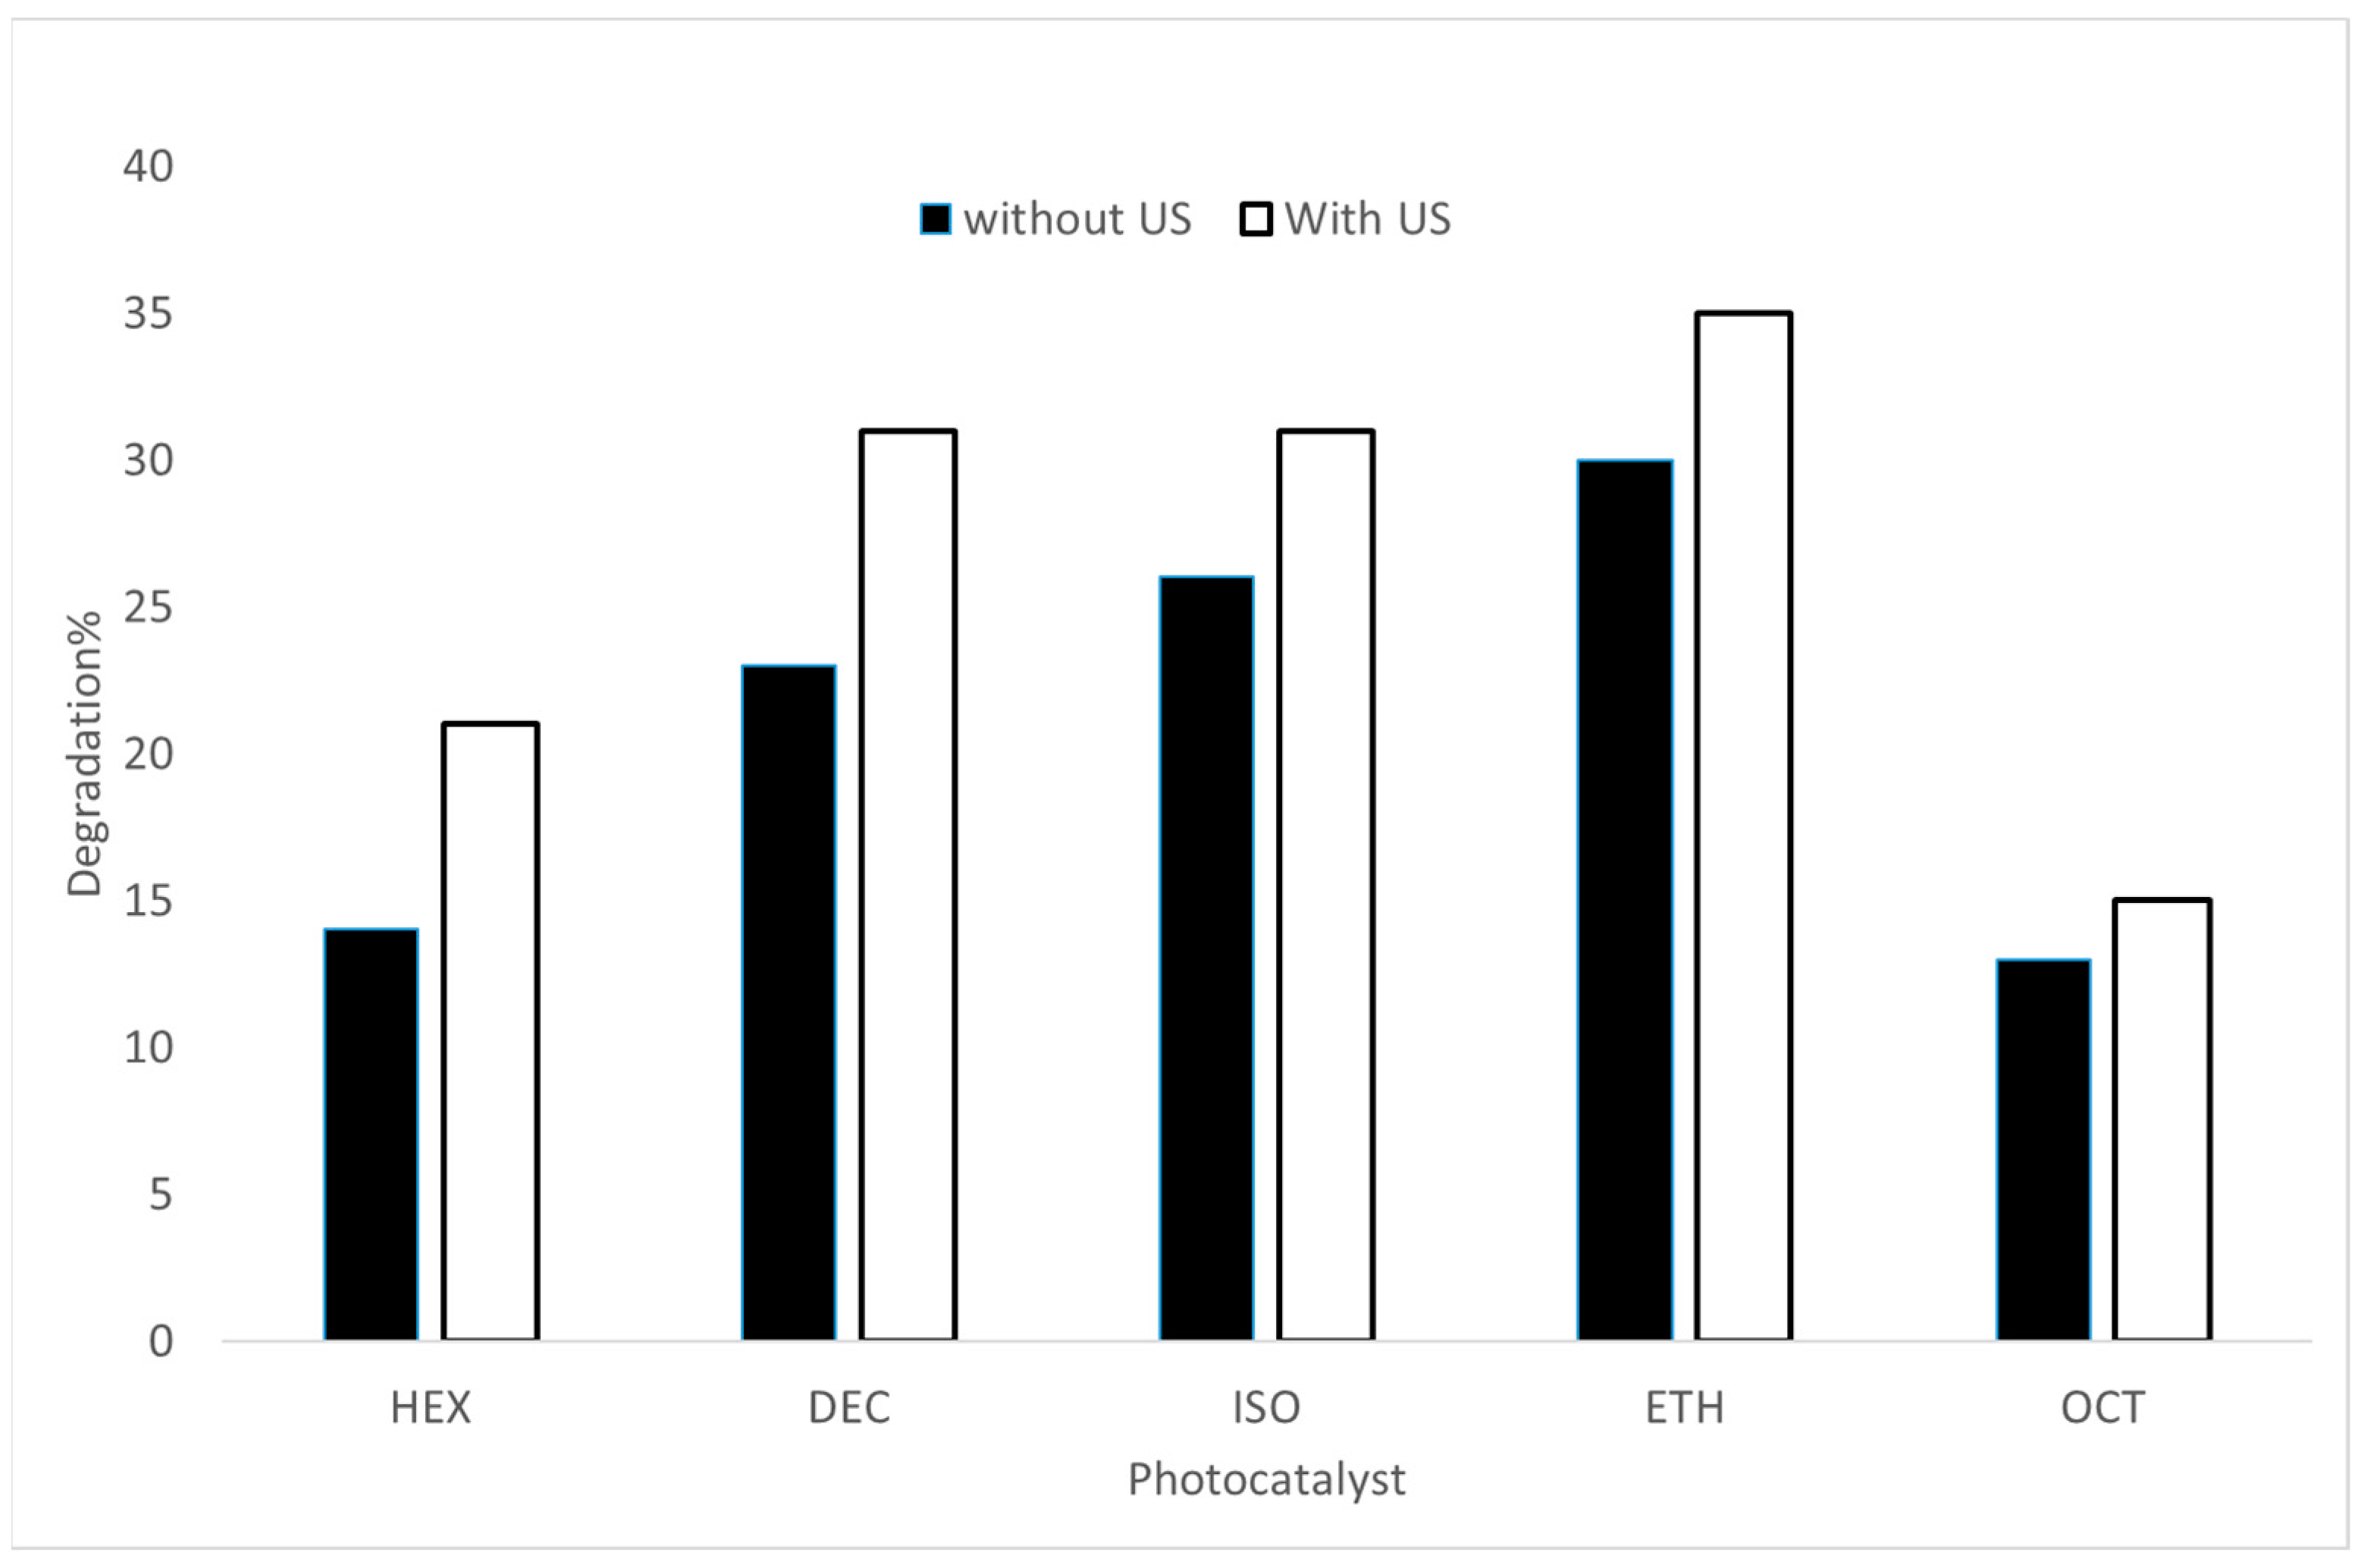
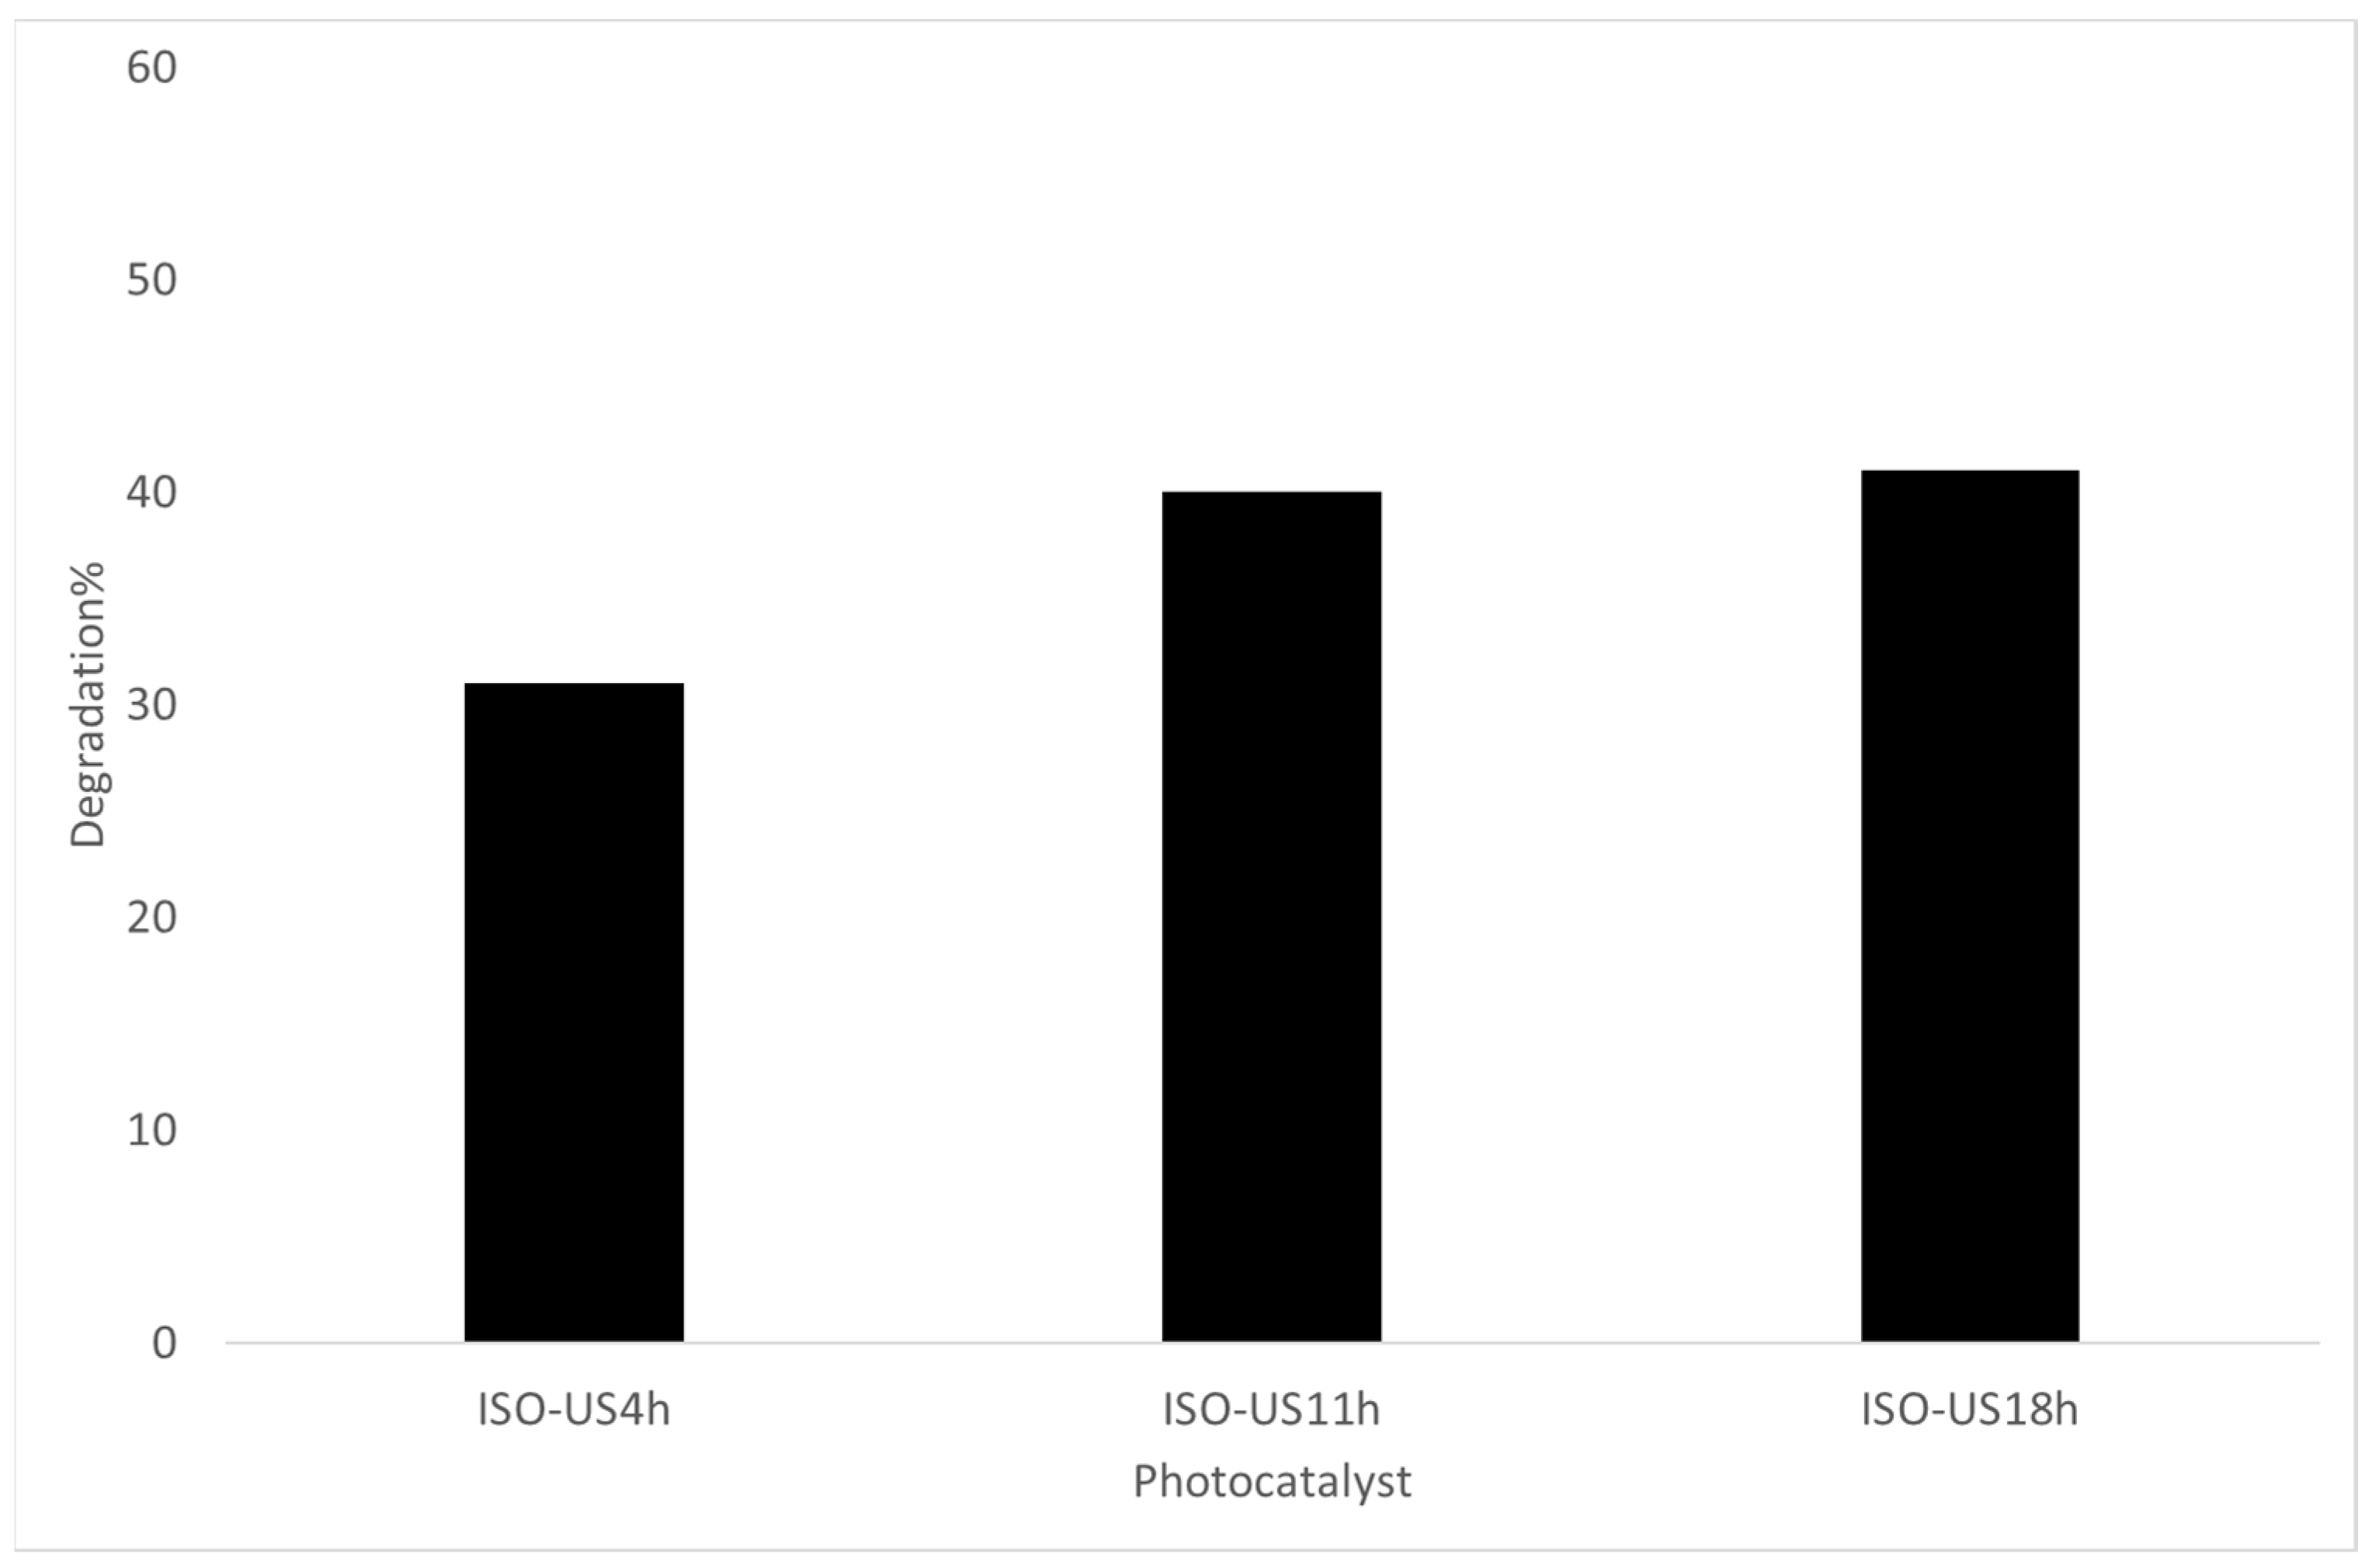
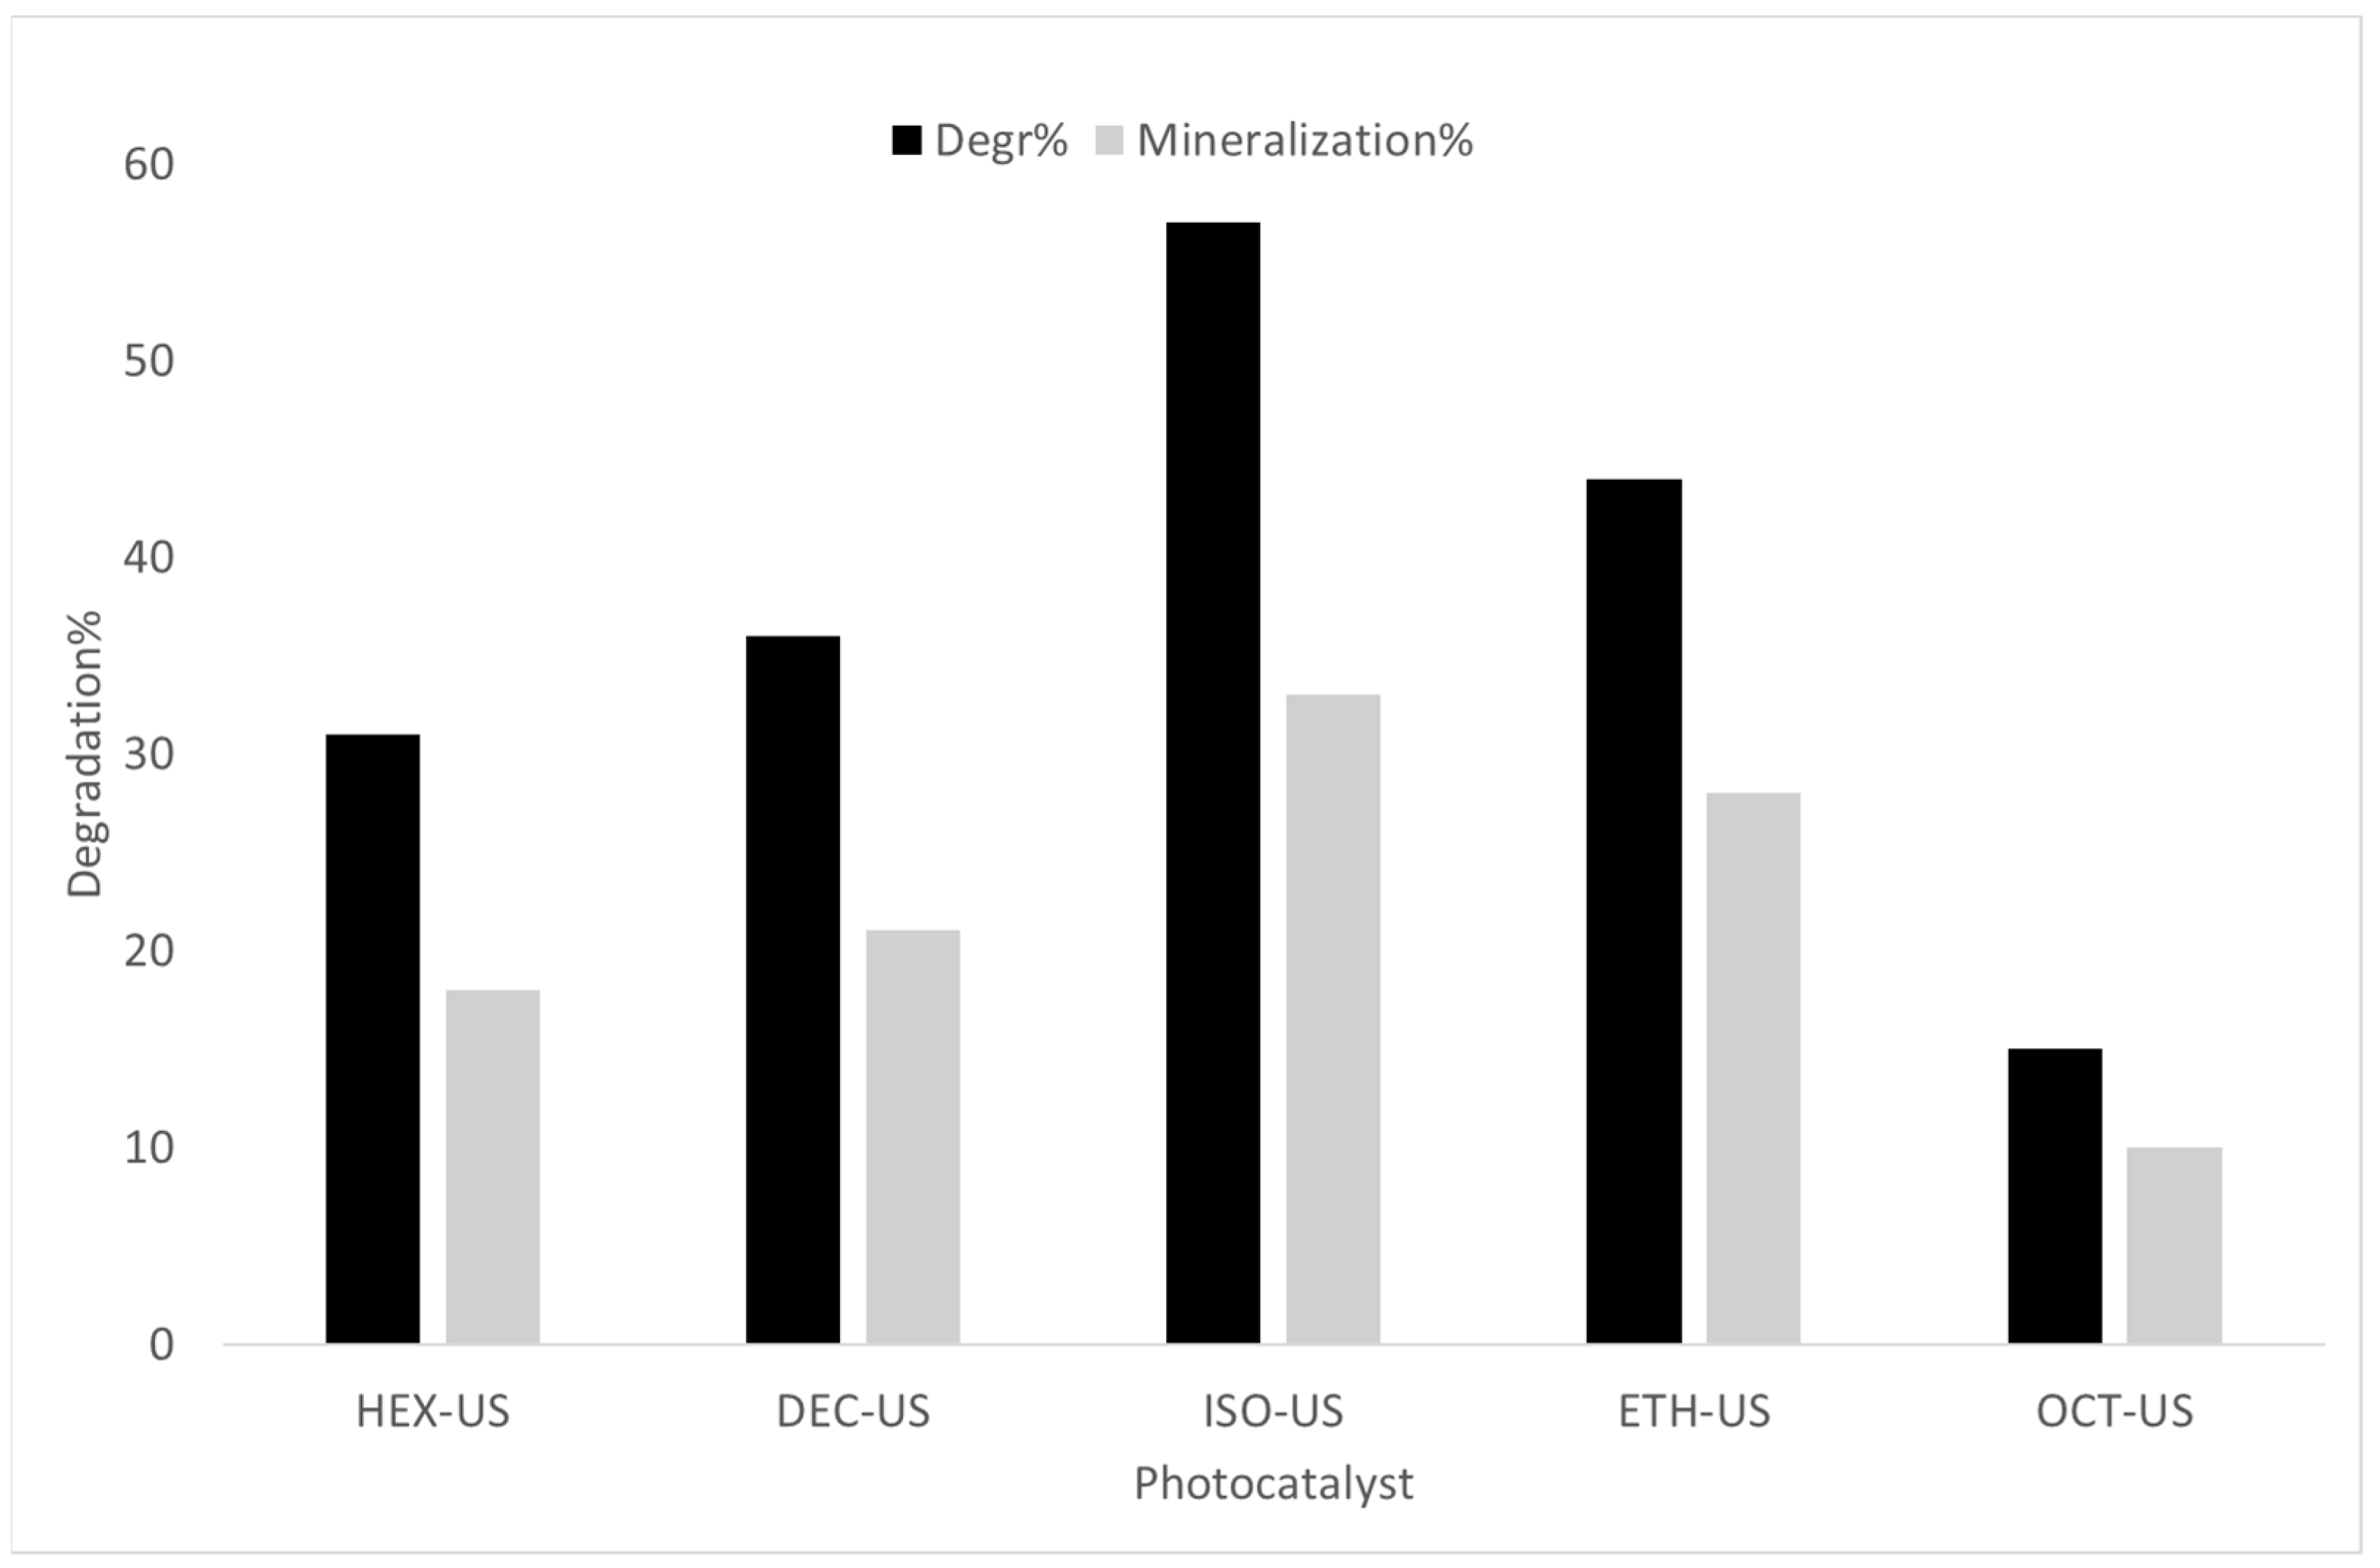
2.2. Experimental Photodegradation Test

All the photocatalysts were tested in the photodegradation of sulfamethoxazole in water, as described in the experimental section.
Test performances were evaluated by calculating the degradation % and the mineralization % using the following equations:
D e g r a d a t i o n   % = 100 100 · C i C 0
where C i is the concentration of sulfamethoxazole in water at the time t and C 0 is the concentration of sulfamethoxazole in water at the time t = 0.
M i n e r a l i z a t i o n   % = 100 100 · p p m i p p m 0
where p p m i is the concentration of organic carbon expressed as ppm in water at the time t and C 0 is the concentration of organic carbon expressed as ppm in water at the time t = 0.
First of all, photolysis experiments (UV irradiation on the reactor without the photocatalyst inside) were performed on the polluted water. The photolytic degradation of SMX resulted very limited, with a degradation % equal to 8% and a mineralization% equal to 0% after 6 h. The trend of the degradation vs. time resulted quite linear, as expected for these very low degradations.
Adsorption phenomena of SMX on the photocatalyst surfaces were evaluated for all the samples by performing a dark test, i.e., leaving the photocatalysts inside the reactor with the different photocatalysts but without light irradiation. No significative degradation% results were obtained (<2% for all the samples after 6 h), and then adsorption contributions were neglected.
Photocatalytic tests were then performed using as standard operating parameters a 0.1 g/L initial concentration of the pollutant, a 0.1 g/L concentration of catalyst, 30 °C as the reactor temperature, 6 or 12 as the test duration, and an irradiation power of 115 W/m2 of the UV-A lamp.
All the photocatalytic samples resulted active in the SMX degradation. The typical degradation trend of the photocatalyzed processes for water depollution was observed with the degradation of SMX increasing during the irradiation time. The rate of the reaction was higher in the first part of the test due to a positive kinetic order. The Langmuir–Hinshelwood adsorption-based mechanism is generally accepted for these kinds of reactions [29]. Degradation results with TiO2 added show a common trend: samples prepared via US are always more active than the corresponding TiO2 prepared under common hydrolysis, confirming the importance of US during the preparation. Moreover, polar solvents led to better photocatalysts, confirming that the presence of both pure anatase and good surface area are usually the best constituents for a photoactive material. The degradation % results obtained after 6 h of irradiation are reported in Figure 4, in which the important effects of US application and the solvent used during the preparation are clearly demonstrated. The percentage of degradation over time of the same runs, where the typical trend of photodegradation experiments was obtained, is reported in Figure 5. These data can be interpreted by assuming a simplified kinetic model as a first-order reaction or by assuming a more complex but realistic mechanism, such as the Langmuir–Hinshelwood. The reference catalyst Evonik P25 was tested too in the same conditions, with the highest SMX degradation obtained (73% after 6 h). The SMX degradation results obtained with self-assembled catalysts prepared with different solvents with and without US are, therefore, significantly lower than those obtained with P25. This result may decrease interest in the new materials described in this article. However, it is important to underline that the aim of the research was not to obtain a better photocatalyst than P25, known for its high performance in this type of application, but to study the effects of different solvents and the application of US in the photocatalyst synthesis procedure. For this reason, the data are presented here with the aim to analyze these synthesis aspects in detail to improve the know-how of these methodologies.
Results are very interesting compared to those of Giménez et al. [30], who performed the degradation of 100 ppm SMX in water using P25, but with a different experimental setup equipped with a 1000 W xenon lamp and a circulating reactor. The lamp was equipped with a suitable filter to cut the wavelength lower than 290 nm. In that case, 40% molecule degradation, together with a mineralization of less than 15%, was observed after 6 h. The degradation of SMX by photocatalysis has been investigated in several works, but it is difficult to compare the different reported results as the operative conditions and the kind of reactors are very heterogeneous. For example, Li et al. [31] used very intensive conditions for the UV irradiation (300 W xenon lamp) and the photocatalyst concentration (1 g/L). In a very recent paper, the same authors [32] used a 300 W mercury lamp and a catalyst concentration of 0.5 g/L. Other publications worked with similar but not identical conditions [33]. The degradation obtained with our catalysts is comparable to the ones reported in the literature, i.e., a good SMX degradation can be obtained after a reaction (irradiation) time from a few tens of minutes to a few hours, depending on the specific operative conditions and, obviously, the characteristics of the photocatalysts used. A direct, clear comparison among all the different photocatalysts reported in the literature is very difficult and, maybe, misleading. Again, as explained by discussing the comparison with the P25 reference sample, the objective of our work is mainly the study of the effects of different solvents, in conditions with and without ultrasound, rather than the search for a catalyst that performs better than others already known.
An important parameter in the preparation procedure is the time at which the final calcination procedure is performed. The standard calcination time applied for the samples tested in SMX degradation was 4 h. One of these catalysts was selected to investigate this parameter. The sample ISO-US was synthesized using three different calcination durations, i.e., 3, 11, and 18 h, and labeled as ISO-US4h, ISO-US11h, and ISO-US18h. The SMX degradation results obtained using these samples are shown in Figure 6.
By subjecting the catalyst to just 4 h of calcination treatment at 500 °C, i.e., under the same conditions as all the other samples tested, the effectiveness of the degradation process stands at around 31%. By increasing the duration of treatment up to 11 and 18 h, the effectiveness reaches approximately 41% in both cases, i.e., an increase of +10% for the 6 h kinetic tests. From this, it can be deduced that there is an optimal treatment duration between 4 and 11 h, beyond which no significant advantages are noted.
It is interesting to compare the surface area values of the samples with their photocatalytic performance in SMX degradation. The synthesis of the catalysts in 1-octanol (OCT) led to a phase composition and surface morphology of the samples very similar to those of the other catalysts synthesized in polar solvents, such as isopropanol (ISO) and ethanol (ETH).
The OCT samples differ in their very limited specific surface area: the values obtained are 7 m2/g with the new synthetic procedure and 6 m2/g with the traditional procedure. The aforementioned surface area values explain the reduced degradation percentages compared to the other catalysts synthesized in ethanol and isopropanol, i.e., ISO and ETH.
In the second part of the degradation test experiments, longer kinetic tests, lasting 12 h, were carried out. The samples that showed the best catalytic activity for each synthetic solvent tested were used, i.e., HEX-US, DEC-US, ISO-US, ETH-US, and OCT-US. The samples synthesized with ultrasound were, in all five cases, the most effective catalysts and, for this reason, were selected for these long-time experiments. At the end of these kinetic tests, in addition to the spectrophotometric analyses, TOC analysis was performed in order to quantify the quantity of total organic carbon present at the end of the degradation process, to evaluate the degree of mineralization obtained with the use of the tested catalysts. The initial value of the organic carbon concentration in the initial sulfamethoxazole solution was 48 ppm. The degradation % of SMX and the resulting mineralization for the selected catalyst for a long time of UV irradiation (12 h) are reported in Figure 7.
The results of these 12 h kinetic tests confirm the considerations of the 6 h tests, i.e., the ISO-US sample with 18 h of calcination is identified as the best catalyst among the self-assembled ones. This is because the catalyst ISO-US has an anatase phase only, better surface area, and a smaller crystal size (Table 1).
Unlike the 6 h tests, the long-term tests show a similarity between the activity of the HEX-US and DEC-US samples. Even more interesting is the comparison between the degradation percentages of the DEC-US sample for 6 and 12 h: in the first case, at the end of the kinetics, a degradation of 31% was obtained, with a resulting sulfamethoxazole concentration of 2.82 × 10⁻⁴ M, while at the end of 12 h, it can be observed that only 36% of the drug is degraded. As already mentioned, this result can be explained by considering the well-known kinetic order of these photocatalytic reactions.
As expected, the mineralization% was lower than the degradation% in all the experiments. This is due to the partial mineralization of SMX at the ends of runs. The reaction time was not sufficient to fully mineralize the initial pollutant in carbon dioxide, mineral salts, and water. This point needs to be further explored and investigated in future work. The aim of the present paper was to demonstrate the important influence of the solvent used in the synthetic procedures on the final characteristics of the photocatalysts and to evaluate the positive influence of ultrasound treatments during the preparation.

3. Experimental Section

All reactants were used as received from Aldrich (purity > 99.9%) (Sigma-Aldrich, St. Louis, MO, USA) without further purification. Distilled water was used in the preparation of solutions and suspensions. The structural formula of the sulfamethoxazole molecule (C10H11N3O3S) is reported in Figure 8.

3.1. Catalyst Preparation and Characterization

TiO2 photocatalysts were prepared by a sol–gel process based upon hydrolysis–condensation reactions of a metal alkoxide, (a) a controlled hydrolysis and (b) an ultrasonic-assisted hydrolysis of titanium (IV) tetrabutoxide (TTBO) [11], in different solvents. The solvents used are hexane, decane, ethanol, isopropanol, and 1-octanol.
In all syntheses, 15 mL of TTBO were dissolved in 130 mL of solvent, and 50 mL of water was dropped. In the hydrolysis reaction without ultrasound, water was added under stirring, while in the sonoassisted hydrolysis, water was added under ultrasound irradiation for 10 h in an argon atmosphere and thermostated at 25 °C. All white powders obtained were filtered, dried at 120° C for 3 h, and calcinated in air at 500 °C for 4 h as the standard time, or 11–18 h for a specific study as described in the following section.
The parameters for post-synthesis treatment were chosen with the aim of avoiding the formation of the rutile phase, since it is known in the literature that anatase is the polymorph that shows superior photochemical performance due to its high electron mobility, electron affinity, and transmittance for visible light [34].
The ultrasound generator is an Ultrasonic Processor, VC750 (Sonics and Materials, Inc., Newton, CT, USA) 20 kHz with a diameter tip of 13 mm, and the syntheses were conducted at 40% amplitude [35,36,37].
The power really emitted in the solution using these conditions was determined by the calorimetric method with water [38], and resulted 110 W.
Ten samples were labeled using the following acronyms: HEX for hexane, DEC for decane, ISO for isopropanol, ETH for ethanol, and –OCT for octanol. Moreover, the samples prepared using US were labeled with “US”. For example, the sample being labeled “HEX-US” means the sample was prepared in hexane with US, while the sample being labeled “HEX” means it was prepared in hexane without US. Finally, sample “P25” refers to the Evonik P25 commercial nanometricTiO2, used as a reference.
X-ray powder diffraction (XRPD) patterns for Rietveld refinements were collected with the CuKα radiation on a PANalytical X’PERT PR (PANalytical, Royston, UK) O diffractometer and a PW3050 goniometer equipped with an X’Celerator detector. The LFF ceramic tube operated at 40 kV, 40 mA. To minimize the preferred orientations, the samples were carefully side-loaded onto a glass sample holder. About 5% in weight of lanthanum hexaboride, LaB6, provided by The Gem Dugout—Deane K. Smith, 1652 Princeton Drive, State College, PA, 16803, was added to one of the samples (HEX-US) as an internal line and peak profile standard, in order to accurately check the eventual goniometer zero scale shift, and unit cell parameters, and allow evaluation of the instrumental contribution to the peak broadening. Patterns were collected in the 10–140° 2θ range, with a 0.017° 2θ angular step and a counting time of 20 s per step adopted.
Rietveld refinements were performed with the GSAS program [39]. Data coming from single crystal structure determination [40,41] were adopted as starting models for anatase and brookite. The procedure involved the refinement of the background (12–16 terms of shifted Chebyschev function), scale factors, sample displacement, and peak profiles. The average crystallite size of the samples was determined by peak profile function analysis [39]. In particular, the dependence of the broadening of the Lorentzian part of the profile as a function of 2θ was evaluated after subtracting the instrumental contribution, which was accurately accounted for by the refinement of a standard profile material such as LaB6 (See Supplementary Materials).
SEM images were obtained using a Field Emission Gun Electron Scanning Microscope, LEO 1525 ZEISS (Jena, Germany), after metallization with chromium. The images were acquired by an Inlens detector.
TEM images were obtained using a Philips 208 Transmission Electron Microscope (FEI, Hillsboro, OR, USA). The samples were prepared by putting one drop of an ethanol dispersion of the TiO2 powder on a copper grid pre-coated with a Formvar film and dried in air.
Micro-Raman sampling was performed using an OLYMPUS microscope (model BX40) connected to an ISA Jobin–Yvon model TRIAX320 single monochromator, with a spectral resolution of 3 cm−1). The source of excitation was a Melles Griot 25LHP925 He–Ne laser that was used in single-line excitation mode at 632.8 nm. The power focused on the samples was always less than 2 mW. The scattered Raman photons were detected by a liquid nitrogen-cooled charge-coupled device (CCD, Jobin–Yvon mod. Spectrum One). (Horiba Jobin Yvon, LablamHR spectrometer, Kyoto, Japan).
The specific surface area (SBET) and porosity distribution were obtained from N2 adsorption/desorption isotherms at 77 K using a Tristar II 3020 (Micromeritics, Norcross, GA, USA) apparatus and the instrumental software (Version 1.03) and with the application of Brunauer–Emmett–Teller (BET) and Barrett–Joyner–Halenda analyses, respectively. Prior to measuring, sample powders were thermally pre-treated (T = 150 °C, 4 h, N2) to remove adsorbed species, e.g., water.

3.2. SMX Degradation Tests

All SMX degradation runs were carried out employing an experimental setup suitable for the use of different advanced oxidation techniques (US, UV irradiation alone to check photolytic activity, or a black condition to check adsorption phenomena), either separately or simultaneously, without any modification in the geometry of the system. All tests were repeated twice, obtaining a reproducibility error of <2%. Adsorption phenomena were evaluated with a dark condition test with all the synthesized photocatalysts, and no significative values were obtained (SMX decrease after 360 min was lower than 2%). It consisted of a cylindrical, tightly closed Pyrex Vessel (maximum volume 500 mL), which was irradiated by an external lamp. At the beginning of the runs, the reactor was completely filled up with the aqueous solution or suspension containing SMX, in order to minimize the headspace of the reactor and, thus, any loss of the volatile substrate. All runs were carried out at 30 ± 1 °C under continuous stirring at ca. 220 rpm. This rate of stirring was selected as it resulted suitable to exclude any diffusional limitation in the system.
An external iron halogenide lamp (Jelosil, model HG 500) emitting in the 340–400 nm wavelength range was employed as an irradiation source. The average irradiation on the liquid surface was 115 W m−2, corresponding to a distance between the lamp and the liquid surface fixed at 21 cm.
The initial SMX concentration was fixed at 4 × 10⁻⁴ M. 0.1 g L−1, while the concentration of the different photocatalysts for all the tests was maintained constant at 0.1 g/L. Samples (3 mL) were withdrawn from the reactor at different reaction times during the runs, through a rubber septum on the reactor cover, and analyzed spectrophotometrically in a TG Instruments T60 apparatus to quantify the SMX conversion. Moreover, the extent of mineralization was determined through total organic carbon (TOC) analysis using a Shimadzu TOC 5000A analyzer. Prior to analysis, TiO2 was separated from the suspensions by centrifugation at 4800 rpm for 10 min. The standard maximum duration of the runs was 6 h.

4. Conclusions

The ultrasound applied during the synthesis of the catalysts positively influenced their activity, whatever the synthesis solvent used. The use of ultrasound led to the formation of imperfections and fractures on the surface of the catalyst, which could explain the greater activity of the samples associated with this technique. SEM and TEM morphological analyses show that with all solvents used, nanoparticles between 20 and 30 nm were obtained, both with US and without. Nanoparticles synthesized in nonpolar solvents show more agglomeration, while those synthesized in alcoholic solvents show a clear three-dimensional structure, and ultrasonic treatment further enhanced this feature. In particular, with 1-octanol, spherical macroaggregates with low surface area were obtained. Raman and XRD spectroscopic analyses show that with nonpolar solvents, two crystalline phases were obtained, anatase and brookite, while with polar solvents, only anatase was, and this difference affected the photocatalytic activity.
The four best-performing catalysts for the 6 h tests are the three catalysts synthesized in isopropanol (ISO-US, ISO-US11h, and ISO-US18h) with the use of ultrasound and different calcination times and the catalyst synthesized in ethanol, also combined with ultrasound: percentages between 30% and 40% were reached. Based on the results obtained, it can be stated that solvents such as hexane and 1-octanol are not functional in the synthesis process.
The surface area values confirm the poor quality of the catalysts synthesized in 1-octanol. The duration of the calcination process was found to be a fundamental parameter for improving the performance of the different catalysts. The optimal duration of calcination is between 4 and 11 h, beyond which no significant effects are noted on the degradation percentages; a clear decrease in the relative surface area of the samples was also caused.
The 12 h kinetic tests confirmed what emerged from the 6 h tests, i.e., the functionality of the ethanol and isopropanol solvents in the synthesis process. With the best-performing self-assembled catalyst, a degradation of 57% was achieved. From long-term tests, it can also be observed that the degree of mineralization obtained following the photocatalytic process is 60% of the quantity of the degraded pollutant.

Supplementary Materials

The supporting information can be downloaded at: https://www.mdpi.com/article/10.3390/catal14120910/s1.

Author Contributions

Conceptualization, A.D.M. and C.P.; methodology, A.D.M. and C.P.; validation, L.P. and A.M; investigation, A.D.M., C.P., R.V. and P.S.; writing—original draft preparation, A.D.M. and C.P.; writing—review and editing, C.P.; visualization, A.D.M.; supervision, A.D.M. and C.P.; project administration, C.P.; funding acquisition, A.D.M., C.P., A.M. and L.P. All authors have read and agreed to the published version of the manuscript.

Funding

This work has been partially funded by the European Union—NextGenerationEU under the Italian Ministry of University and Research (MUR) National Innovation Ecosystem grant ECS00000041—VITALITY. This work has been partially funded by the National Recovery and Resilience Plan (NRRP), Mission 4 Component 2 Investment 1.3—Call for tender No. 341 of 15.03.2022 of the Ministero dell’Università e della Ricerca (MUR); funded by the European Union—NextGenerationEU, award number/project code PE0000021, Concession Decree No. 1561 of 11.10.2022 adopted by the Ministero dell’Università e della Ricerca (MUR), CUP D43C22003090001, project title “Network 4 Energy Sustainable Transition_NEST”.

Data Availability Statement

Data are available upon request from the authors.

Conflicts of Interest

The authors declare no conflicts of interest.

References

  1. Levin, R.; Villanueva, C.M.; Beene, D.; Cradock, A.L.; Donat-Vargas, C.; Lewis, J.; Martinez-Morata, I.; Minovi, D.; Nigra, A.E.; Olson, E.D.; et al. US drinking water quality: Exposure risk profiles for seven legacy and emerging contaminants. J. Expo. Sci. Environ. Epidemiol. 2023, 34, 3–22. [Google Scholar] [CrossRef] [PubMed]
  2. Martinez, J.L. Environmental pollution by antibiotics and by antibiotic resistance déterminants. Environ. Pollut. 2009, 157, 2893–2902. [Google Scholar] [CrossRef] [PubMed]
  3. Miklos, D.B.; Remy, C.; Jekel, M.; Linden, K.G.; Drewes, J.E.; Hübner, U. Evaluation of advanced oxidation processes for water and wastewater treatment—A critical review. Water Res. 2018, 139, 118–131. [Google Scholar] [CrossRef] [PubMed]
  4. Sharma, V.K.; Feng, M. Water depollution using metal-organic frameworks-catalyzed advanced oxidation processes: A review. J. Hazard. Mater. 2019, 372, 3–16. [Google Scholar] [CrossRef]
  5. Li, Z.; Zhuang, T.; Dong, J.; Wang, L.; Xia, J.; Wang, H.; Cui, X.; Wang, Z. Sonochemical fabrication of inorganic nanoparticles for applications in catalysis. Ultrason. Sonochemistry 2021, 71, 105384. [Google Scholar] [CrossRef]
  6. Chatel, G. Sonochemistry in nanocatalysis: The use of ultrasound from the catalyst synthesis to the catalytic reaction. Curr. Opin. Green Sustain. Chem. 2019, 15, 1–6. [Google Scholar] [CrossRef]
  7. Suslick, K.S.; Hyeon, T.; Fang, M.; Cichowlas, A.A. Sonochemical Preparation of Nanostructured Catalysts. In Advanced Catalysts and Nanostructured Materials; Moser, W.R., Ed.; Academic Press: Cambridge, MA, USA, 1996; Chapter 8; pp. 197–212. ISBN 9780125084604. [Google Scholar]
  8. Amaniampong, P.N.; Jérôme, F. Catalysis under ultrasonic irradiation: A sound synergy. Curr. Opin. Green Sustain. Chem. 2020, 22, 7–12. [Google Scholar] [CrossRef]
  9. Teh, C.Y.; Wu, T.Y.; Juan, J.C. An application of ultrasound technology in synthesis of titania-based photocatalyst for degrading pollutant. Chem. Eng. J. 2017, 317, 586–612. [Google Scholar] [CrossRef]
  10. Purkayastha, M.D.; Sil, S.; Singh, N.; Ray, P.P.; Darbha, G.K.; Bhattacharyya, S.; Mallick, A.I.; Majumder, T.P. Sonochemical synthesis of nanospherical TiO2 within graphene oxide nanosheets and its application as a photocatalyst and a Schottky diode. FlatChem 2020, 22, 100180. [Google Scholar] [CrossRef]
  11. Guo, W.; Lin, Z.; Wang, X.; Song, G. Sonochemical synthesis of nanocrystalline TiO2 by hydrolysis of titanium alkoxides. Microelectron. Eng. 2003, 66, 95–101. [Google Scholar] [CrossRef]
  12. Guo, J.; Zhu, S.; Chen, Z.; Li, Y.; Yu, Z.; Liu, Q.; Li, J.; Feng, C.; Zhang, D. Sonochemical synthesis of TiO2 nanoparticles on graphene for use as photocatalyst. Ultrason. Sonochemistry 2011, 18, 1082–1090. [Google Scholar] [CrossRef] [PubMed]
  13. Arami, H.; Mazloumi, M.; Khalifehzadeh, R.; Sadrnezhaad, S.K. Sonochemical preparation of TiO2 nanoparticles. Mater. Lett. 2007, 61, 4559–4561. [Google Scholar] [CrossRef]
  14. Mardiana, L.; Wardoyo, A.Y.P.; Masruroh; Dharmawan, H.A. Synthesis TiO2 using sonochemical method and responses the CO2 gas of the nanoparticle TiO2 layers on the QCM sensor surfaces. J. Phys. Conf. Ser. 2022, 2165, 012014. [Google Scholar] [CrossRef]
  15. Suslick, K.S. Sonochemistry. Science 1990, 247, 1439–1445. [Google Scholar] [CrossRef]
  16. Suslick, K.S.; Price, G.J. Applications of ultrasound to materials chemistry. Annu. Rev. Mater. Sci. 1999, 29, 295–326. [Google Scholar] [CrossRef]
  17. Banerjee, B. Recent developments on ultrasound assisted catalyst-free organic synthesi. Ultrason. Sonochemistry 2017, 35, 1–14. [Google Scholar] [CrossRef]
  18. Cintas, P.; Tagliapietra, S.; Calcio Gaudino, E.; Palmisano, G.; Cravotto, G. Glycerol: A solvent and a building block of choice for microwave and ultrasound irradiation procedures. Green Chem. 2014, 16, 1056–1065. [Google Scholar] [CrossRef]
  19. Xu, H.; Zeigera, B.W.; Suslick, K.S. Sonochemical synthesis of nanomaterials. Chem. Soc. Rev. 2013, 42, 2555–2567. [Google Scholar] [CrossRef]
  20. Lupacchini, M.; Mascitti, A.; Giachi, G.; Tonucci, L.; D’Alessandro, N.; Martinez, J.; Colacino, E. Sonochemistry in non-conventional, green solvents or solvent-free reactions. Tetrahedron 2017, 73, 609–653. [Google Scholar] [CrossRef]
  21. Lu, X.; Li, M.; Hoang, S.; Suib, S.L.; Gao, P.X. Solvent effects on the heterogeneous growth of TiO2 nanostructure arrays by solvothermal synthesis. Catal. Today 2021, 360, 275–283. [Google Scholar] [CrossRef]
  22. Ding, Y.; Yang, I.S.; Li, Z.; Xia, X.; Lee, W.I.; Dai, S.; Bahnemann, D.W.; Pan, J.H. Nanoporous TiO2 spheres with tailored textural properties: Controllable synthesis, formation mechanism, and photochemical applications. Prog. Mater. Sci. 2020, 109, 100620. [Google Scholar] [CrossRef]
  23. Yoldas, B.E. Hydrolysis of titanium alkoxide and effects of hydrolytic polycondensation parameters. J. Mater. Sci. 1986, 21, 1087–1092. [Google Scholar] [CrossRef]
  24. Kamali, M.; Costa, M.E.V.; Otero-Irurueta, G.; Capela, I. Ultrasonic irradiation as a green production route for coupling crystallinity and high specific surface area in iron nanomaterials. J. Clean. Prod. 2019, 211, 185–197. [Google Scholar] [CrossRef]
  25. Kominami, H.; Kohno, M.; Kera, Y. Synthesis of brookite-type titanium oxide nano-crystals in organic media. J. Mater. Chem. 2000, 10, 1151–1156. [Google Scholar] [CrossRef]
  26. Yu, J.C.; Zhang, L.; Yu, J. Direct Sonochemical Preparation and Characterization of Highly Active Mesoporous TiO2 with a Bicrystalline Framework. Chem. Mater. 2002, 14, 4647–4653. [Google Scholar] [CrossRef]
  27. Kumar, S.G.; Koteswara Rao, K.S.R. Polymorphic phase transition among the titania crystal structures using a solution-based approach: From precursor chemistry to nucleation process. Nanoscale 2014, 6, 11574–11632. [Google Scholar] [CrossRef]
  28. Sassi, P.; Paolantoni, M.; Cataliotti, R.S.; Palombo, F.; Morresi, A. Water/Alcohol Mixtures:  A Spectroscopic Study of the Water-Saturated 1-Octanol Solution. J. Phys. Chem. B 2004, 108, 19557–19565. [Google Scholar] [CrossRef]
  29. Khuzwayo, Z.; Chirwa, E.M.N. Modelling and simulation of photocatalytic oxidation mechanism of chlorohalogenated substituted phenols in batch systems: Langmuir–Hinshelwood approach. J. Hazard. Mater. 2015, 300, 459–466. [Google Scholar] [CrossRef]
  30. Abellán, M.N.; Bayarri, B.; Giménez, J.; Costa, J. Photocatalytic degradation of sulfamethoxazole in aqueous suspension of TiO2. Appl. Catal. B 2007, 74, 233–241. [Google Scholar] [CrossRef]
  31. Li, D.; Zhang, N.; Yuan, R.; Chen, H.; Wang, F.; Zhou, B. Effect of wavelengths on photocatalytic oxidation mechanism of sulfadiazine and sulfamethoxazole in the presence of TiO2. J. Environ. Chem. Eng. 2021, 9, 106243. [Google Scholar] [CrossRef]
  32. Li, D.; Yuan, R.; Zhou, B.; Chen, H. Selective photocatalytic removal of sulfonamide antibiotics: The performance differences in molecularly imprinted TiO2 synthesized using four template molecules. J. Clean. Prod. 2023, 383, 135470. [Google Scholar] [CrossRef]
  33. Akter, S.; Islam, M.S.; Kabir, M.H.; Shaikh, M.A.A.; Gafur, M.A. UV/TiO2 photodegradation of metronidazole, ciprofloxacin and sulfamethoxazole in aqueous solution: An optimization and kinetic study. Arab. J. Chem. 2022, 15, 103900. [Google Scholar] [CrossRef]
  34. Park, N.G.; Van de Lagemaat, J.; Frank, A.J. Comparison of dye-sensitized rutile- and anatase-based TiO2 solar cells. J. Phys. Chem. B 2000, 104, 8989–8994. [Google Scholar] [CrossRef]
  35. Grainca, A.; Boccalon, E.; Nocchetti, M.; Vivani, R.; Di Michele, A.; Longhi, M.; Pirola, C. Sonochemical and mechanochemical synthesis of iron-based nano-hydrotalcites promoted with Cu and K as catalysts for CO and CO2 Fischer-Tropsch synthesis. Fuel 2024, 373, 132303. [Google Scholar] [CrossRef]
  36. Di Michele, A.; Dell’Angelo, A.; Tripodi, A.; Bahadori, E.; Sànchez, F.; Motta, D.; Dimitratos, N.; Rossetti, I.; Ramis, G. Steam reforming of ethanol over Ni/MgAl2O4 catalysts. Int. J. Hydrog. Energy 2019, 44, 952–964. [Google Scholar] [CrossRef]
  37. Pirola, C.; Bianchi, C.L.; Di Michele, A.; Diodati, P.; Boffito, D.; Ragaini, V. Ultrasound and microwave assisted synthesis of high loading Fe-supported Fischer-Tropsch catalysts. Ultrason. Sonochemistry 2010, 17, 610–616. [Google Scholar] [CrossRef]
  38. Ragaini, V.; Pirola, C.; Borrelli, S.; Ferrari, C.; Longo, I. Simultaneous ultrasound and microwave new reactor: Detailed description and energetic considerations. Ultrason. Sonochemistry 2012, 19, 872–876. [Google Scholar] [CrossRef]
  39. Larson, A.C.; Von Dreele, R.B. Generalized Structure Analysis System (GSAS) LAUR 86-748; Los Alamos National Laboratory: Los Alamos, NM, USA, 1994. [Google Scholar]
  40. Horn, M.; Schwerdtfeger, C.F.; Meagher, E.P. Refinement of the structure of anatase at several temperatures. Z. Krist. 1972, 136, 273–281. [Google Scholar] [CrossRef]
  41. Meagher, E.P.; Lager, G.A. Polyhedral Thermal Expansion Ln The Tio, Polymofphs: Refinement Of The Crystal Structures Of Rutile And Brookite At High Temperature. Can. Mineral. 1979, 17, 77–85. [Google Scholar]
Figure 1. SEM images for the photocatalysts prepared in different solvents, with and without US.
Catalysts 14 00910 g001
Figure 2. TEM images for the photocatalysts prepared in different solvents, with and without US.
Catalysts 14 00910 g002
Figure 3. Raman spectra for the photocatalysts prepared in different solvents, with and without US. The symbol (*) indicate Brookite phase.
Catalysts 14 00910 g003
Figure 4. Degradation% after 6 h of preparation of photocatalysts using different solvents and with or without US.
Catalysts 14 00910 g004
Figure 5. Kinetic data of the degradation experiments using photocatalysts prepared using different solvents and with or without US.
Catalysts 14 00910 g005
Figure 6. Degradation% after 6 h of preparation of photocatalysts using the sample ISO-US after different calcination times (4, 11, 18 h).
Catalysts 14 00910 g006
Figure 7. Degradation% and mineralization% of SM after 12 h of UV irradiation for the selected samples.
Catalysts 14 00910 g007
Figure 8. Structural formula of sulfamethoxazole (SMX).
Catalysts 14 00910 g008
Table 1. Preparation parameters and characterization data for the different photocatalytic samples.
SampleSolventUSBET Surface Area (m2/g)Phase Composition *
A = Anatase
B = Brookite
R = Rutile
Mean Crystallite Size *
(nm)
P25--68A(75(2)%)/R(25(2)%)25(2)
HEX-USHexaneOn78A(81(1)%)/B(19(1)%)24(2)
HEXHexaneOff75A(83(2)%)/B(17(2)%)28(2)
DEC-USDecaneOn68A(69(1)%)/B(31(1)%)29(3)
DECDecaneOff63A(57(1)%)/B(43(1)%)19(1)
ISO-US IsopropanolOn54A(100%)27(2)
ISOIsopropanolOff45A(100%)22(1)
ETH-USEthanolOn60A(100%)32(2)
ETHEthanolOff41A(100%)19(1)
OCT-US1-OctanolOn7A(100%)27(2)
OCT1-OctanolOff6A(100%)27(2)
* Rietveld method.
Disclaimer/Publisher’s Note: The statements, opinions and data contained in all publications are solely those of the individual author(s) and contributor(s) and not of MDPI and/or the editor(s). MDPI and/or the editor(s) disclaim responsibility for any injury to people or property resulting from any ideas, methods, instructions or products referred to in the content.

