Article

Enhancing RNA-Based Technologies Using Enzyme-Derived Lipoamino Acids

by
Sofia F. Azevedo
1,
Célia M. Faustino
1,2 and
Maria H. L. Ribeiro
1,2,*
1
Faculdade de Farmácia, Universidade Lisboa, Av. Gama Pinto, 1649-003 Lisboa, Portugal
2
Research Institute for Medicines (iMed.ULisboa), Faculdade de Farmácia, Universidade Lisboa, Av. Gama Pinto, 1649-003 Lisboa, Portugal
*
Author to whom correspondence should be addressed.
Catalysts 2024, 14(12), 877; https://doi.org/10.3390/catal14120877
Submission received: 23 September 2024 / Revised: 5 November 2024 / Accepted: 16 November 2024 / Published: 1 December 2024
(This article belongs to the Section Biocatalysis)

Abstract

:
This work aims to contribute to nucleic acid therapy advances by highlighting RNA interactions with novel compounds, namely lipoaminoacids (LAAs), which show great potential as non-viral vectors. LAAs not only retain the advantages associated with current non-viral vectors, namely fewer health risks, but also can form stable lipoplexes with genetic material, positioning them as promising candidates for advanced gene delivery systems. The biosynthesis of LAAs, using the enzymes, porcine pancreatic lipase (PPL), and a mixture of PPL and papain, enhanced the production, making them more environmentally friendly with reduced production costs, increasing their interest. Conductivity, absorbance at 260 nm, viscosity, and ethidium bromide fluorescence displacement assays were performed to study the characteristics of these lipoaminoacids and their interactions with nucleic acids (RNA and DNA) regarding a potential vector gene delivery system. The Gibbs energy of micellization of lipoaminoacid biosynthesized with PPL was −27.7 kJ/mol, showing great efficiency in micelle formation. All the obtained lipoaminoacids showed successful encapsulation of RNA, demonstrating the potential of these compounds for vector gene therapy.

1. Introduction

Nowadays, nucleic acid delivery technologies, based on DNA or RNA strategies, are pivotal in global health efforts (e.g., COVID-19 and cancer). The concept of targeting disease at the genetic level is rapidly advancing, highlighted by recent approvals of nucleic acid-based therapies by the Food and Drug Administration (FDA) and European Medicinal Agency (EMA). Unlike conventional drugs targeting proteins, genetic drugs act on gene expression, allowing highly specific, long-lasting, and potentially curative treatment for both inherited and acquired disorders. However, using nucleic acids as therapeutics is challenging due to their vulnerability. In fact, effective nucleic acid therapies rely on advanced delivery platforms. Selection of the right vector is crucial for successful nucleic acid therapy, as optimal characteristics vary depending on the target cell [1,2,3,4,5]. Viral vectors are most commonly used, representing over 65% of vectors in the specific case of gene therapy trials, due to their high gene delivery efficiency and long-lasting gene expression [6]. However, they raise several concerns [5,6,7,8] due to their infectious nature; they can trigger immune or inflammatory responses in hosts, as seen in both animal and human trials, and can cause cytotoxicity [6]. Additionally, the size of their capsid limits the amount of genetic material being carried.
Non-viral vectors have emerged as a promising alternative, as they are non-pathogenic, cheaper, and easier to produce. While initially less efficient, advances in research and technology have improved their effectiveness, leading to wider adoption. Common non-viral vectors include peptides, polymers, and lipids. Lipids, in particular, have been extensively studied and improved, showing positive results in delivering DNA or RNA to mammalian cells, such as monkey kidney cells, offering hope for their future use [9,10,11]. Another type of non-viral vector tested in this work is lipoaminoacids (LAAs) [12]. LAAs are surfactants formed by a condensation reaction between amino acids and fatty acids [13]. As amphiphilic molecules, they self-assemble into micelles above the critical micelle concentration (CMC), driven by hydrophobic interactions enabling them to bind easily to cell membranes. In the presence of polymers like DNA or RNA, they form complexes above the Critical Association Concentration (CAC) [5].
Currently, LAA surfactants available on the market are considered non-toxic, biocompatible, and having an LD50 value of several grams per kilogram of body weight [14]. Furthermore, the capability of forming self-assembled micelles and the possibility to tailor the surfactant chemical structure for controlled drug delivery imply that LAA surfactants are able to deliver larger fragments of genetic material to bind to cell membranes easily.
LAAs can be cationic, anionic, or non-ionic, depending on their surface charge. Ionic LAAs have an ionic headgroup, which gives the molecule its charge, and one or two hydrophobic alkyl chains or sterol motifs [13]. Their CMC is higher than that of nonionic LAAs because their counterions aggregate when micelles are nearby, consequently lowering the entropy and hindering micelle formation [15]. LAAs establish different types of interactions with DNA depending on their charge: cationic LAAs mainly bind through electrostatic interactions, while anionic and nonionic LAAs bind through hydrophobic interactions [16].
For intracellular delivery, cationic surfactants are more appealing and studied, due to their higher efficiency in nucleic acid complexation [17].
LAAs’ positive headgroup binds to the negative charges present in nucleic acids, forming a lipoplex. This process has two stages: firstly, hydrophobic reactions allow the exchange of the surfactant’s ions with the DNA counterions, maintaining the DNA’s negative charge, and secondly, the DNA’s charge changes due to its binding with the surfactant, without counterions exchange. The resulting lipoplex can then interact with other negatively charged molecules, such as membrane proteins, facilitating the uptake of the genetic material present in them [4].
When two of these surfactant molecules are linked covalently by a spacer group, they are called gemini surfactants [3]. These surfactants have even better properties than regular surfactants because their CMC tends to be lower, reducing possible cytotoxicity and increasing stability even at low concentrations. They have a large surface area and often show antimicrobial activity and improved water-solubility [18,19,20,21].
Cationic gemini surfactants have been the most extensively studied type of gemini surfactant. Their positive charge allows them to form complexes with various negatively charged molecules, such as genetic material. Much like their monomeric counterparts, these surfactants present low cytotoxicity and thus have potential as drug or gene delivery agents by incorporating poorly water soluble drugs into the hydrophobic micellar core or complexation of nucleic acids [22].
Chemical or biological catalysts can be used to improve the synthetic efficiency of LAAs. Enzymes are biocatalysts that have been attracting attention for newer techniques involving biosynthesis, as they present advantages in comparison to chemical catalysts, such as being more environmentally friendly, having lower toxicity, and having high specificity [23]. However, they present some drawbacks, such as instability, sensitivity, and non-reusability, due to the difficulty of separating them from the media in which they have been used [24]. Non-reusability not only presents a problem in terms of environmental concerns but also increases the cost of production, as a new enzyme must be added to each reaction [7].
Therefore, enzyme immobilization has sparked more interest and is now commonly used in various industries. Immobilization allows less contamination of the product by the enzyme, reusability, and a possible increase in enzymatic stability and activity.
There are various techniques for enzyme immobilization, such as adsorption, covalent attachment, and entrapment in a chemically inert polymer [25]. Polymer entrapment allows the best of adsorption and covalent methods, involving simple preparation and less susceptible to the breaking of the enzyme-polymer link [25]. Polymer entrapment also provides additional benefits, such as being prepared at low temperatures, which is essential for the retainment of the function of some enzymes, and its porosity can be altered depending on how the polymer is prepared [25].
A method used for entrapment immobilization is sol-gel, which has been deemed the most successful technique [24,26]. Lipases can be immobilized through this technique, which allows for the maintenance of their initial activity.
Although interest in non-viral vectors is growing, none yet meets the ideal properties, as some aspects still fall short compared to viral vectors. By exploring enzymatic methods and the interactions of LAAs with DNA and RNA, this work targeted to advance nucleic acids delivery systems and to improve gene therapy success.
The goals are to investigate novel compounds, LAAs, to enhance the efficiency of nucleic acids delivery. The main question is how to improve the performance of non-viral vectors, particularly for introducing selected nucleic acids into target cells. The first studies focused on the enzymatic production of LAAs, using lipase and papain, assessing their potential for in vitro DNA and RNA assembly. Thus, this work focuses on RNA’s interactions with LAAs. Few studies have been carried out with this nucleic acid, and since it has been shown that single-stranded DNA interacts with surfactants differently than double-stranded DNA, it is expected that the same applies to RNA [16]. This approach harnesses the advantages of non-viral vectors to improve the overall effectiveness and safety of gene delivery systems.

2. Results and Discussion

2.1. Enzymatic Production of LAAs

The LAAs were prepared through a condensation reaction between natural L-amino acid, cystine (Cys2), and dodecylamine (Dda), using the biocatalysts lipase PPL, papain, and a mixture of both (Mix). They were encapsulated in sol-gel, magnetized, and used in two different reaction media: (i) aqueous buffer and (ii) solvent-free with an eutectic mixture. The final products of (i) were analyzed using eosin and the Bradford methods and the final products of (ii) were analyzed using HPLC-MS/MS.
For the eosin method, the absorbance of the samples was measured at 570 nm. After the bioreaction, the LAAs’ quantity in the sample using PPL, papain, and Mix as biocatalysts were 2.083, 1.803, and 1.584 mg/mL, respectively. All of the products from the 3 bioreactions showed increased LAA quantification, with PPL as a biocatalyst showing the most production. This increase was indicated by great interaction between the LAA and the eosin, leading to a higher absorbance value and, consequently, higher LAA quantification [27,28].
For the HPLC-MS/MS results, the cystine-derived gemini (C12Cys)2 cationic LAA biosynthesized with PPL and Mix (PPL + papain) as biocatalysts, showed an M+ (m/z): 575. As the LAAs were obtained in a solid-state form, with a yield of 85%, they were easily separated from the reaction media through vacuum filtration. The final products were characterized by NMR spectra and were recorded on a Fourier 300 spectrometer (300 MHz) from Bruker (Billerica, MA, USA) using CDCl3 as solvent, based on a previous study [19]. 1H chemical shift is expressed in parts per million, δ (ppm), referenced to the solvent used.
(C12Cys)2. 1H NMR (CDCl3): δ (ppm) = 0.88 (t, 6H, 2×CH3), 1.25 (m, 36H, 2×(CH2)9CH3), 1.53 (m, 4H, 2×CH2CH2NHCO), 2.78 (m, 4H, 2×CH2NHCO), 3.15 (m, 4H, 2×CH2S), and 3.56 (d, 2H, 2×CH).
The performance of the biosynthesized LAA (C12Cys)2 (B) was compared with the same surfactant obtained from chemical synthesis (C12Cys)2 (Q) and with commercial surfactant dodecyltrimethylammonium bromide (DTAB) as an example of a cationic monomeric surfactant of the same alkyl chain length.
The chemical synthesis and characterization of (C12Cys)2 has been described elsewhere [19]. Briefly, the di-tert-butyl carbamate derivative of L-cystine was converted into the diamide by condensation reaction with dodecylamine following prior activation of the carboxyl groups with O-(benzotriazole-1-yl)-N,N,N′,N’-tetramethyluronium tetrafluoroborate (TBTU). Removal of the tert-butoxycarbonyl (Boc) protecting groups by a mixture of hydrochloric acid in dichloromethane gave the desired product as a white precipitate, which was collected through vacuum filtration and purified from methanol/acetone (88% yield). The final product was characterized by 1H NMR, 13C NMR, and FT-IR spectrometry. 1H and 13C NMR spectra in CDCl3 were obtained in a Bruker Avance ARX-400 spectrometer operating at 400 MHz and 100 MHz, respectively, using the chloroform peak of the solvent as reference. 1H NMR (CDCl3): δ (ppm) = 0.87 (t, 6H, 2×CH3), 1.24 (m, 36H, 2×(CH2)9CH3), 1.51 (m, 4H, 2×CH2CH2NHCO), 2.92 (m, 4H, 2×CH2NHCO), 3.22 (m, 4H, 2×CH2S), 4.77 (d, 2H, 2×CHNH3+), and 5.56 (d, 2H, NHC=O). 13C NMR (CDCl3): δ (ppm) = 14.26 (CH3), 22.85, 27.14, 28.54, 29.45, 29.50, 29.64, 29.74, 29.80, 29.84, 32.12 (CH3(CH2)10), 39.82 (CH2S), 47.38 (CH2(C=O)N), 54.95 (CH), and 170.24 (C=O amide). FT-IR (KBr): νmax (cm−1) = 3485 (NH3+), 2920, 2850 (CH2), 1665 (C=O amide), 1550 (NH3+ bending), and 590 (C-S).

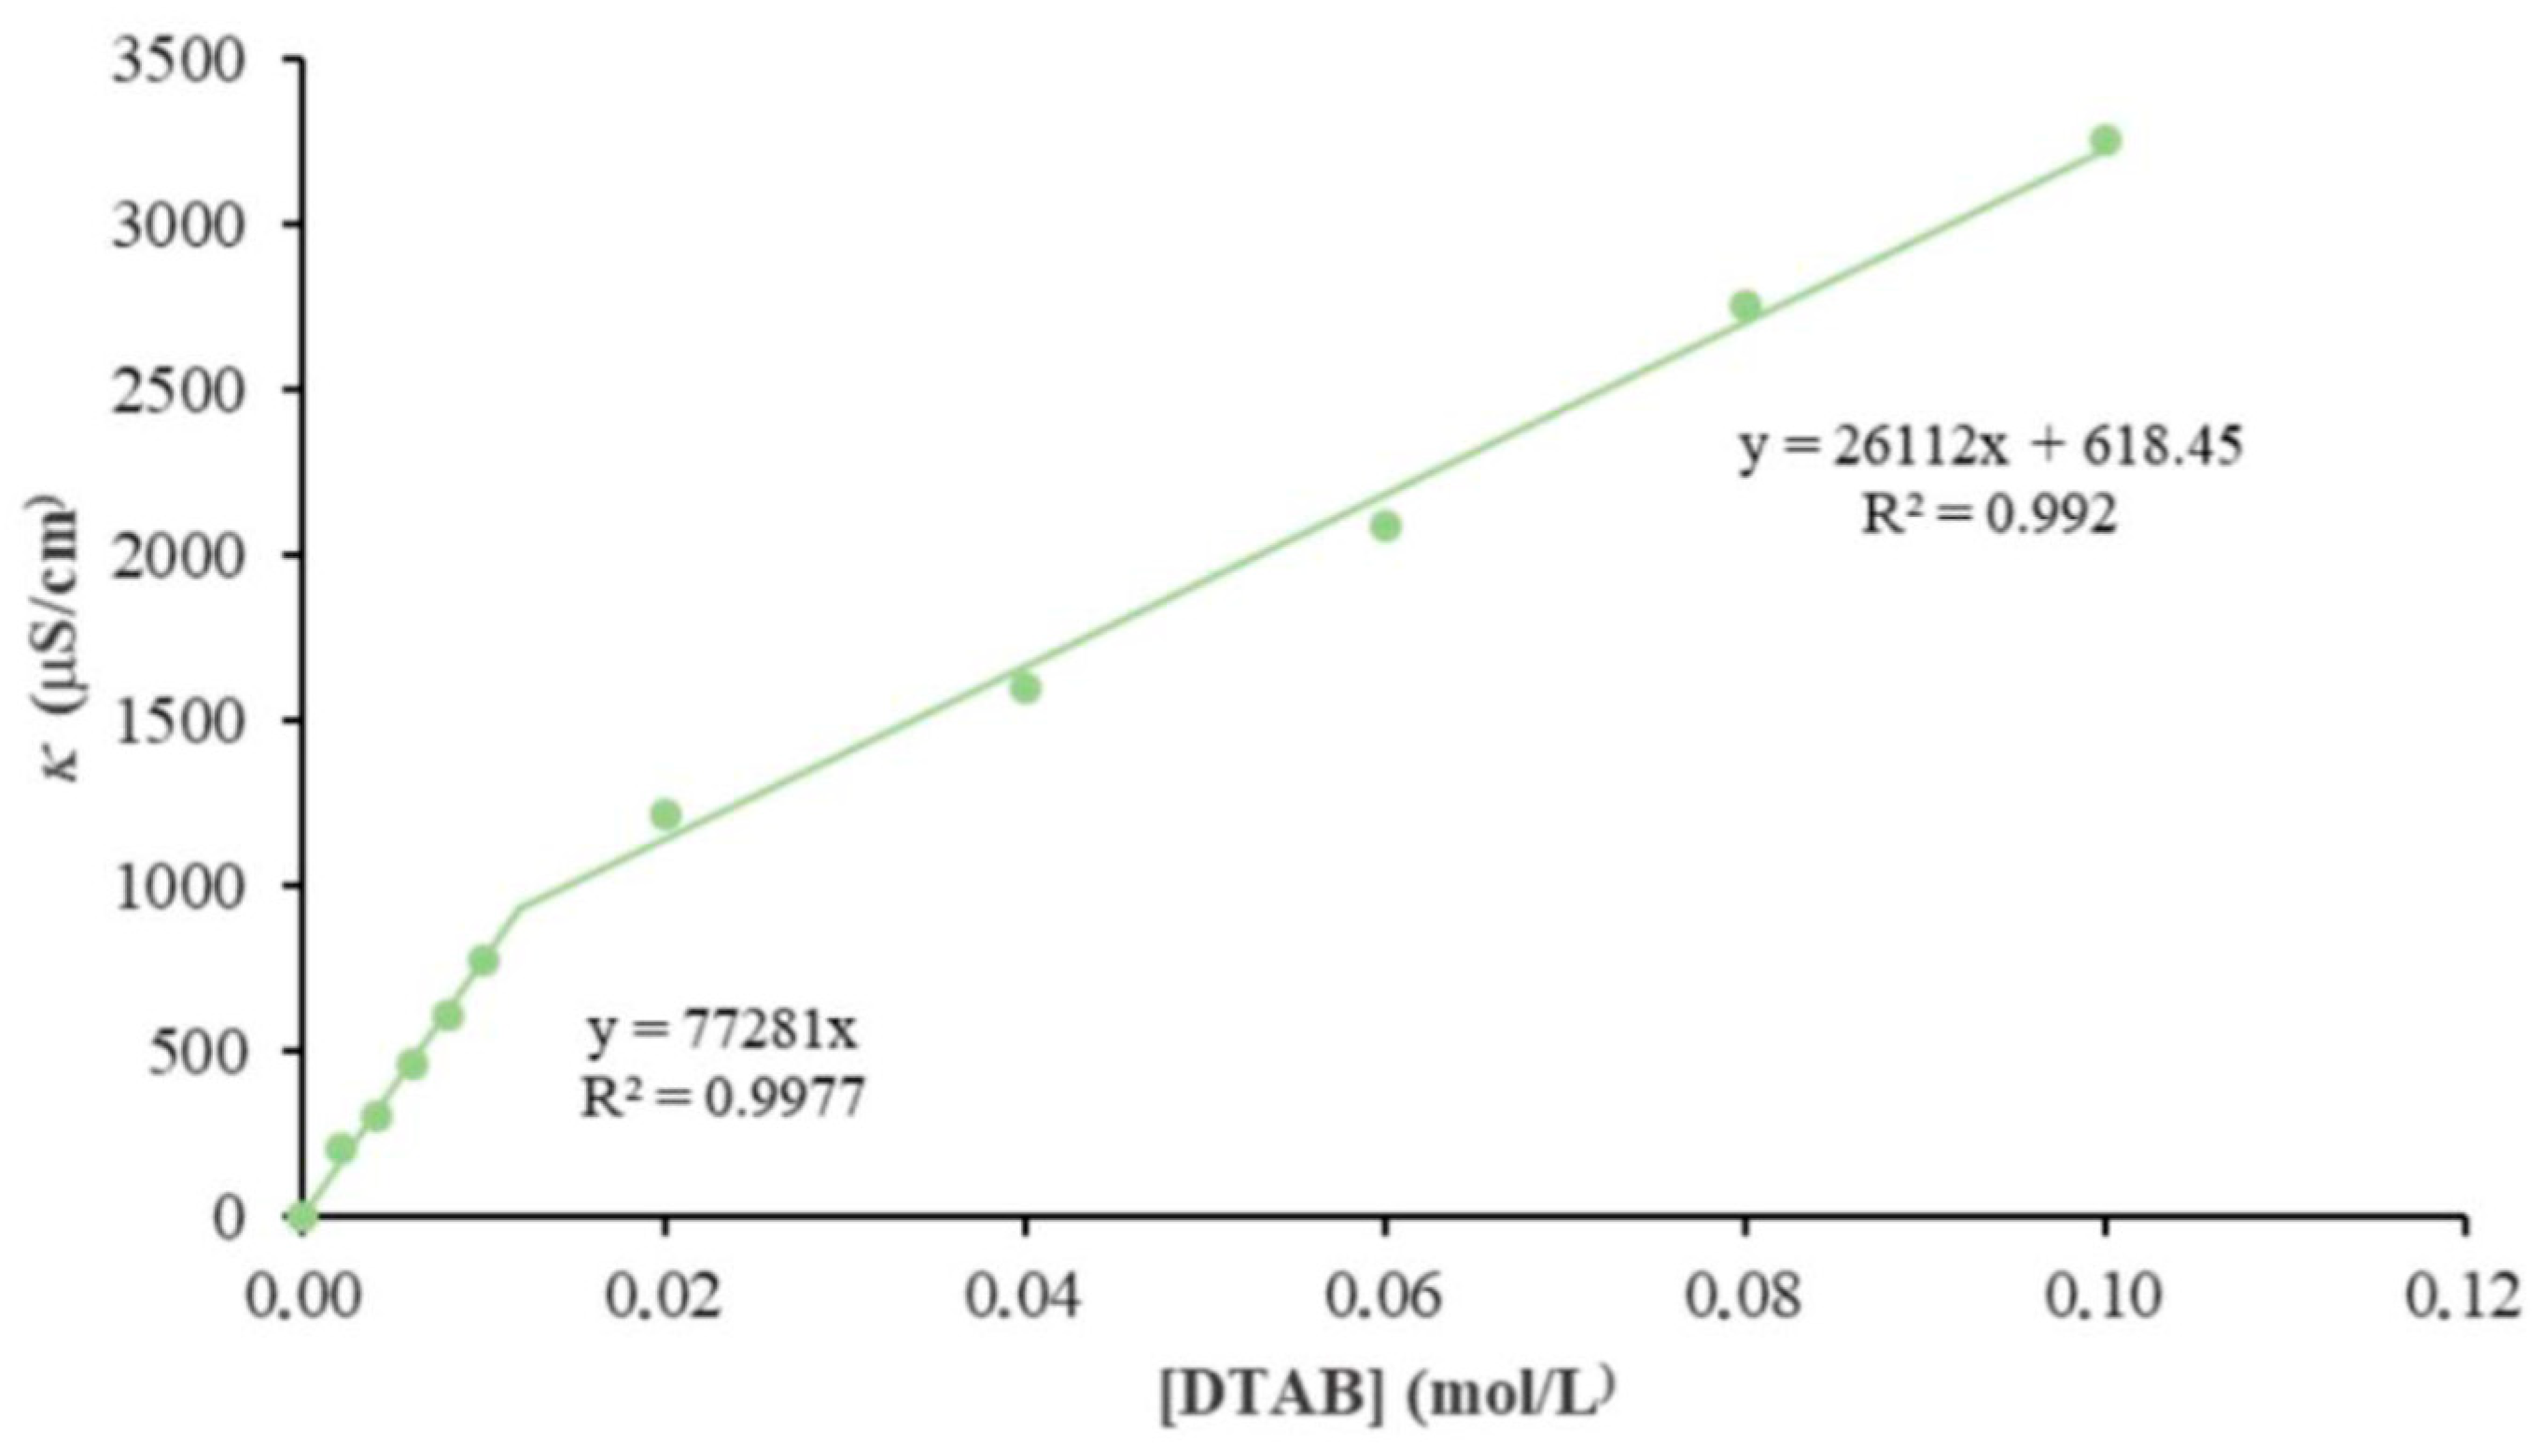
2.2. Self-Assembly Behavior of Surfactants

The self-assembly behavior of the commercial dodecyltrimethylammonium bromide (DTAB) (in the absence of nucleic acids) was studied by conductometry, as shown in Figure 1, allowing for the determination of the CMC. The critical micellar concentration (CMC) can be determined from the break in conductivity versus surfactant concentration plots, which is characteristic of micelle formation [28].
The plot shows two linear regions, where the interception point between both is the CMC value. For DTAB, the expected theoretical CMC value was around 0.016 [29], which correlates with the results of this work.
The slope of the conductivity versus concentration curve is steeper before the critical micelle concentration (CMC) compared to after the CMC. This is because, before reaching the CMC, there is a greater number of free-charged particles and surfactant molecules in their monomeric form, both of which contribute to higher conductivity. After the CMC, micelles begin to form, reducing the number of free surfactant monomers. Although conductivity continues to increase, it does so at a slower rate, as micelles, due to a larger size, exhibit slower mobility compared to free monomers [30,31,32].
The average degree of micellar ionization, α, was determined from the ratio between the slopes after and before the CMC, which in turn allowed the determination of the degree of counterion association, β, which corresponds to β = 1 − α [33].
The Gibbs energy of micellization, Δ G m i c 0 , was calculated based on the following equation, proposed for single-chain surfactants with monovalent counterions:
Δ G m i c 0 = R T 2 α ln C M C
where R is the ideal gas law constant and T is the absolute temperature; for gemini surfactants with monovalent counterions, the equation proposed for the Gibbs energy of micellization is [34]
Δ G m i c 0 = R T ( 3 2 ) α ln C M C R T 2 ln 2
The values of α and β for DTAB and (C12Cys)2 are in Table 1.
For all compounds, Δ G m i c 0 values were negative, which indicates that the micellization process was spontaneous and mostly driven by hydrophobic interactions [35]. The fact that, Δ G m i c 0 is more negative for (C12Cys)2(B) means that surfactant is most likely to form micelles spontaneously, being more attractive for gene delivery vector applications. This is expected because gemini surfactants, like (C12Cys)2(B), have two hydrophobic tails, which increases hydrophobic interactions and decreases electrostatic repulsion of the headgroup, favoring micelle formation, as opposed to monomeric surfactants, like DTAB [36].

2.3. Surfactant–Nucleic Acid Interactions

2.3.1. Surfactant Effect

The absorbance assay allowed the analysis of surfactant behavior at 260 nm. Since the peak absorption for RNA and DNA is 260 nm and these are the primary nucleic acids used, it is important to determine if the surfactant absorbs at this wavelength.
When cationic surfactants form complexes with nucleic acids (DNA or RNA), the absorbance at 260 nm is enhanced, which indicates that cationic surfactants disrupt the helix structure of nucleic acids by weakening the hydrogen bonds responsible for the stabilization of the helix structure, causing extension of the nucleic acid’s chain, where the surfactant will bind through electrostatic attraction and hydrogen bonding, increasing absorbance at 260 nm [37]. The equilibrium for the formation of the surfactant–nucleic acid (NA) complex can be represented by the following equation [37]:
N A + S u r f N A S u r f
Through the Benesi–Hildebrand model, the binding constant (Kb) for each binding site between the nucleic acid and a singular surfactant molecule can be determined:
K a p p = N A S u r f ( N A S u r f )
where Kapp is the apparent binding constant determined from the Benesi–Hildebrand equation,
1 ( A A 0 ) = 1 A A 0 + [ 1 K a p p A A 0 ] ( 1 S u r f )
in which A0, A, and A∞ are the absorbance at 260 nm for pure nucleic acid solution, nucleic acid in the presence of surfactant, and pure surfactant solution, respectively [38].
Thus, it was possible to analyze the binding behavior between the surfactant and RNA/DNA by plotting 1 A 0 A against the inverse of surfactant concentration, 1 [ L A A ] . The ratio of the intercept and the slope corresponds to the binding constant, Kapp [39]. The higher the value of the said ratio, the higher the value of the binding constant—a 1:1 complex formation between each binding site of nucleic acid and surfactant [38].
Figure 2 shows how the variation of the absorbance, at 260 nm, performs with the nucleic acid molar fraction through a Job plot.
Figure 3 displays the binding affinity between RNA and each surfactant since the slope after CMC is positive in every plot. This means that the encapsulation of RNA in surfactant micelles was successful, as expected. (C12Cys)2(B)_iron, pap-LAA, pap_iron-LAA, and Mix-LAA show the highest binding efficiencies.
On the other end, the slopes before CMC present more variations. For DTAB, Figure 2a, the slope before CMC is negative. This result was unexpected, as it is unlikely that the individual RNA and surfactant molecules are more stable and energetically favorable than the complex they form. This could indicate an anomaly in the experimental procedure, causing these unexpected results, and it can also be due to the limitations presented by the Benesi–Hildebrand model.
For every other LAA, besides DTAB, the slope before CMC was constant. This indicates that the binding affinity between the surfactant and RNA, at low concentrations, is independent of LAA concentration, until it reaches CMC [40]. This is because, at low surfactant concentrations, the number of surfactant molecules bound to the RNA molecule is not enough to decrease the counterions in the Stern layer, maintaining the RNA’s effective charge and not altering the affinity [40].
The affinity of these surfactants with RNA was also very similar and uniform, with all showing very close values. Despite this, it is possible to see that, before CMC, the same LAA had more affinity towards RNA when magnetized with iron and also that the LAA with the highest affinity was (C12Cys)2(B)_iron, while the lowest was (C12Cys)2(Q). This shows that the synthesis method used affects the binding efficiency of the surfactant, with biosynthesis leading to a higher efficiency than chemical synthesis.
Table 1 is the same as with RNA. However, the binding efficiency between DTAB and DNA was significantly lower than that between DTAB and RNA, as shown by the different slope values.

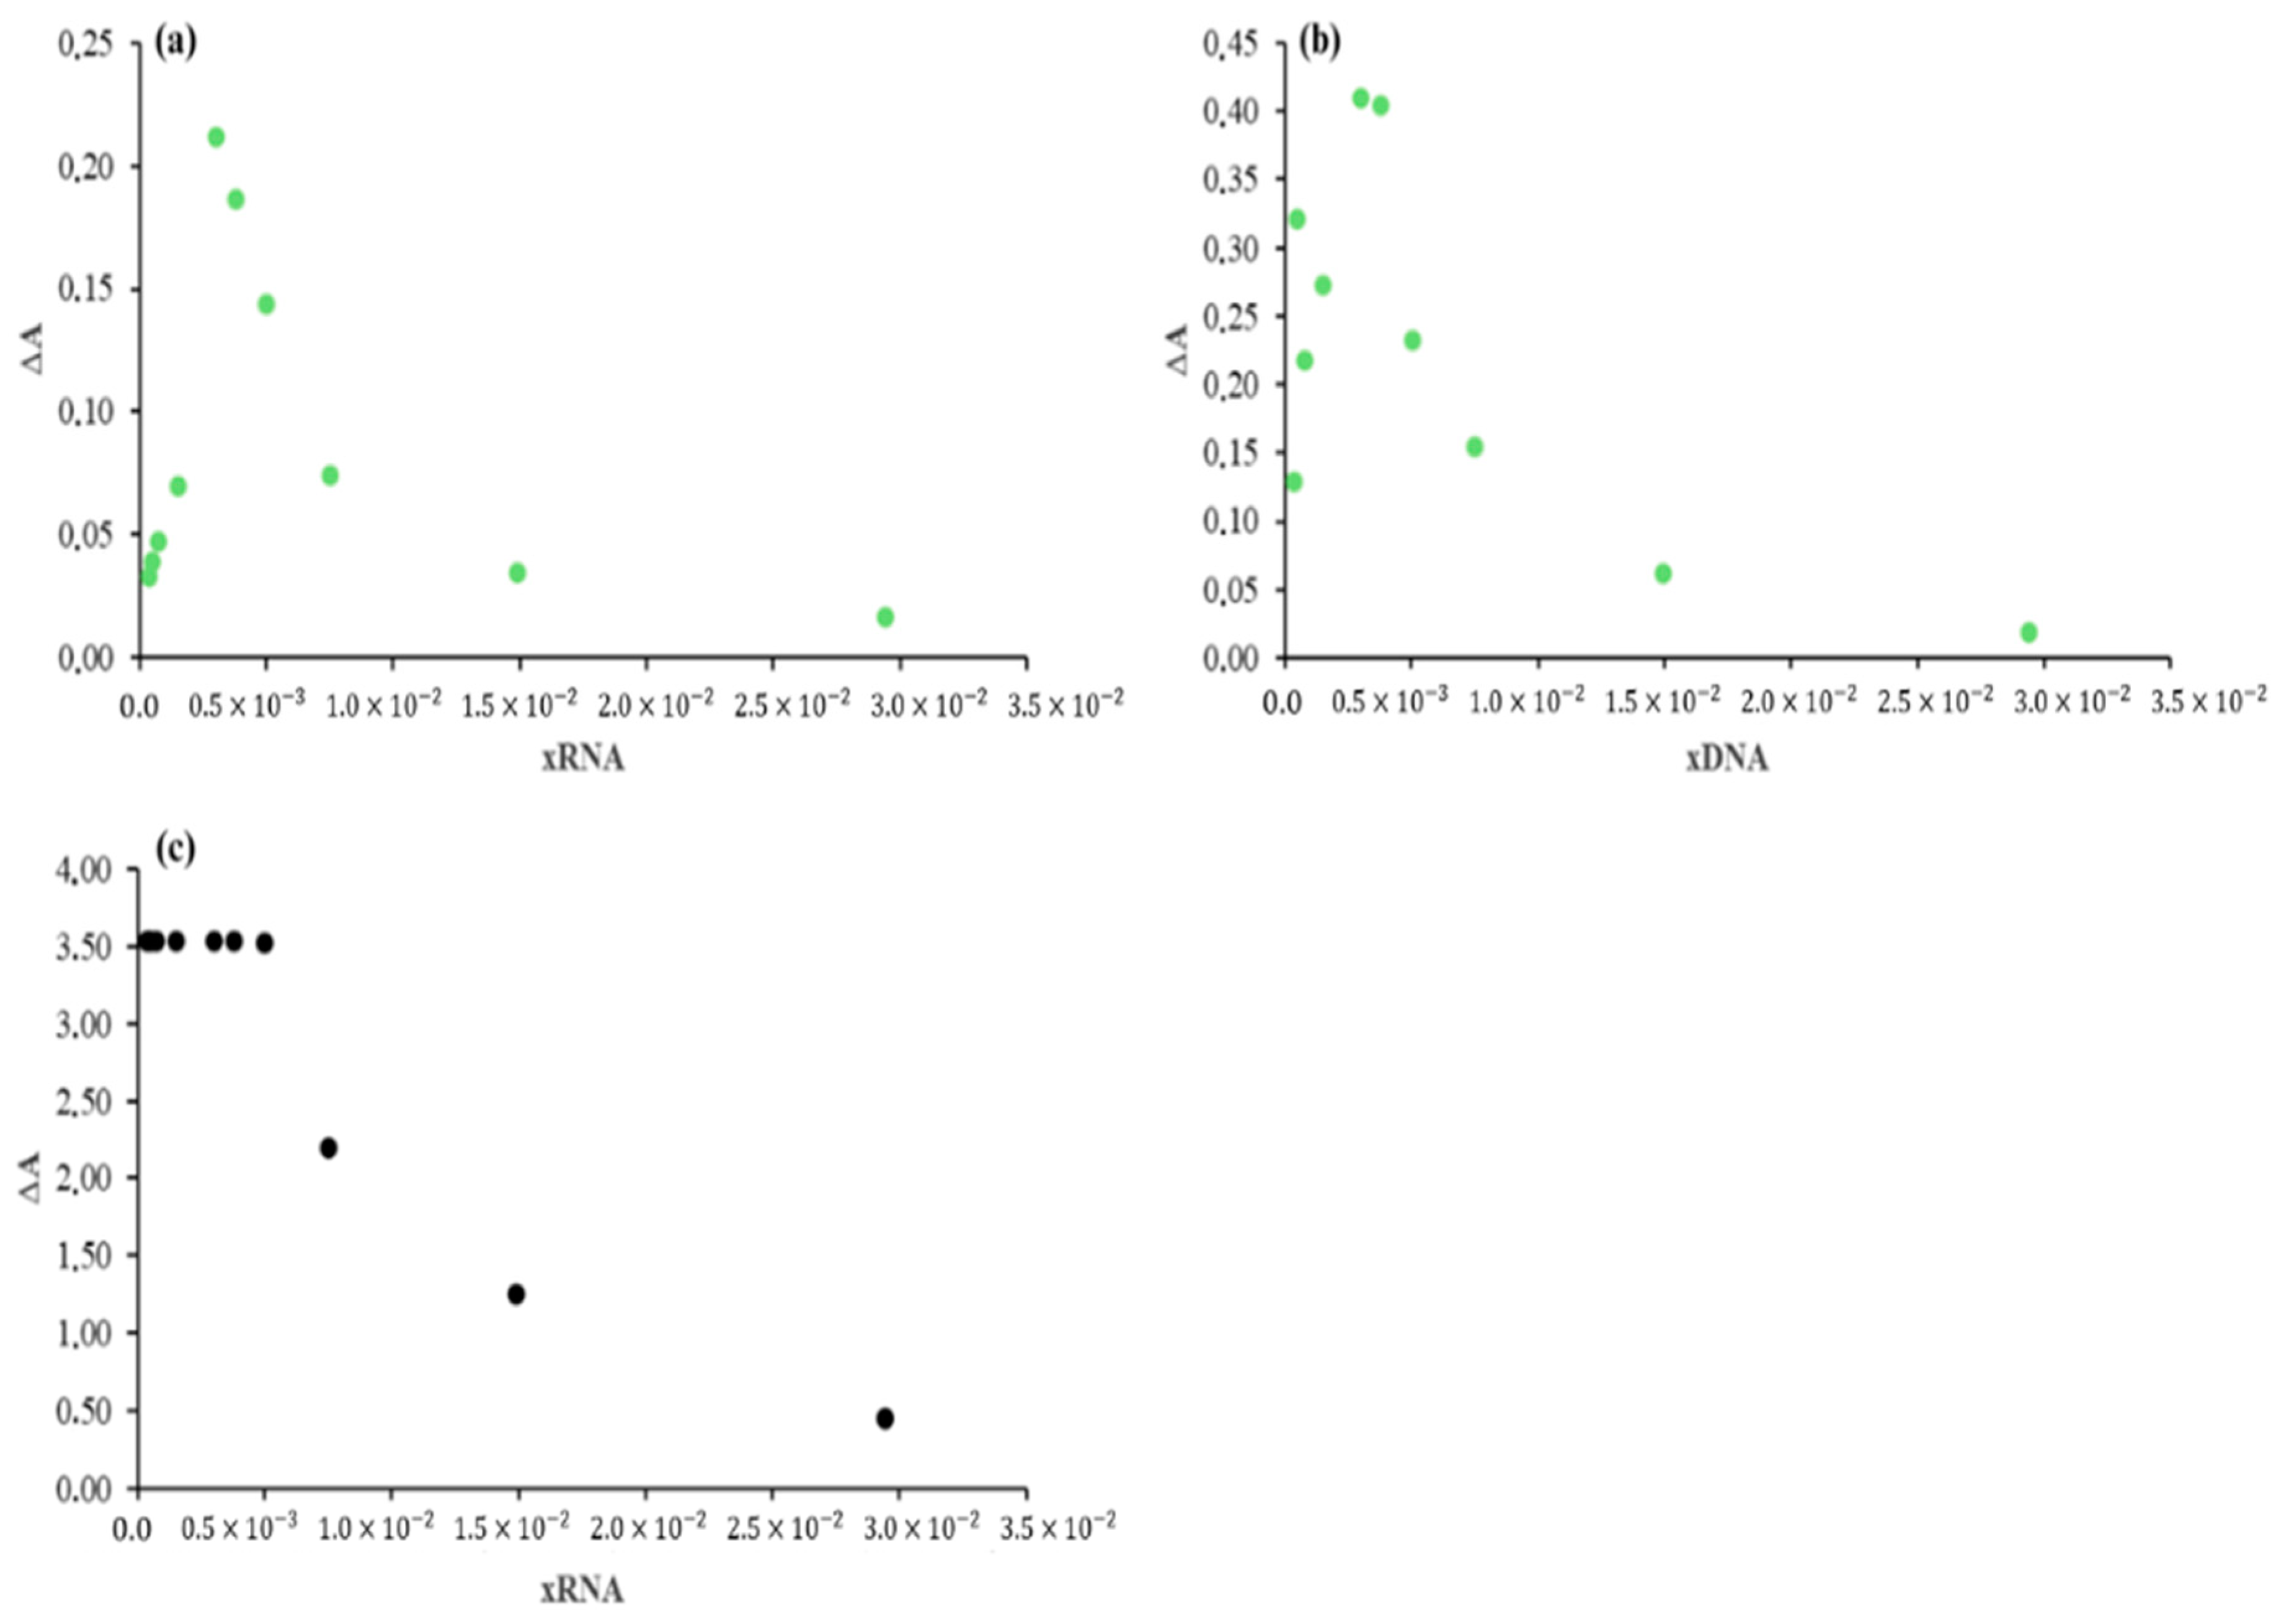
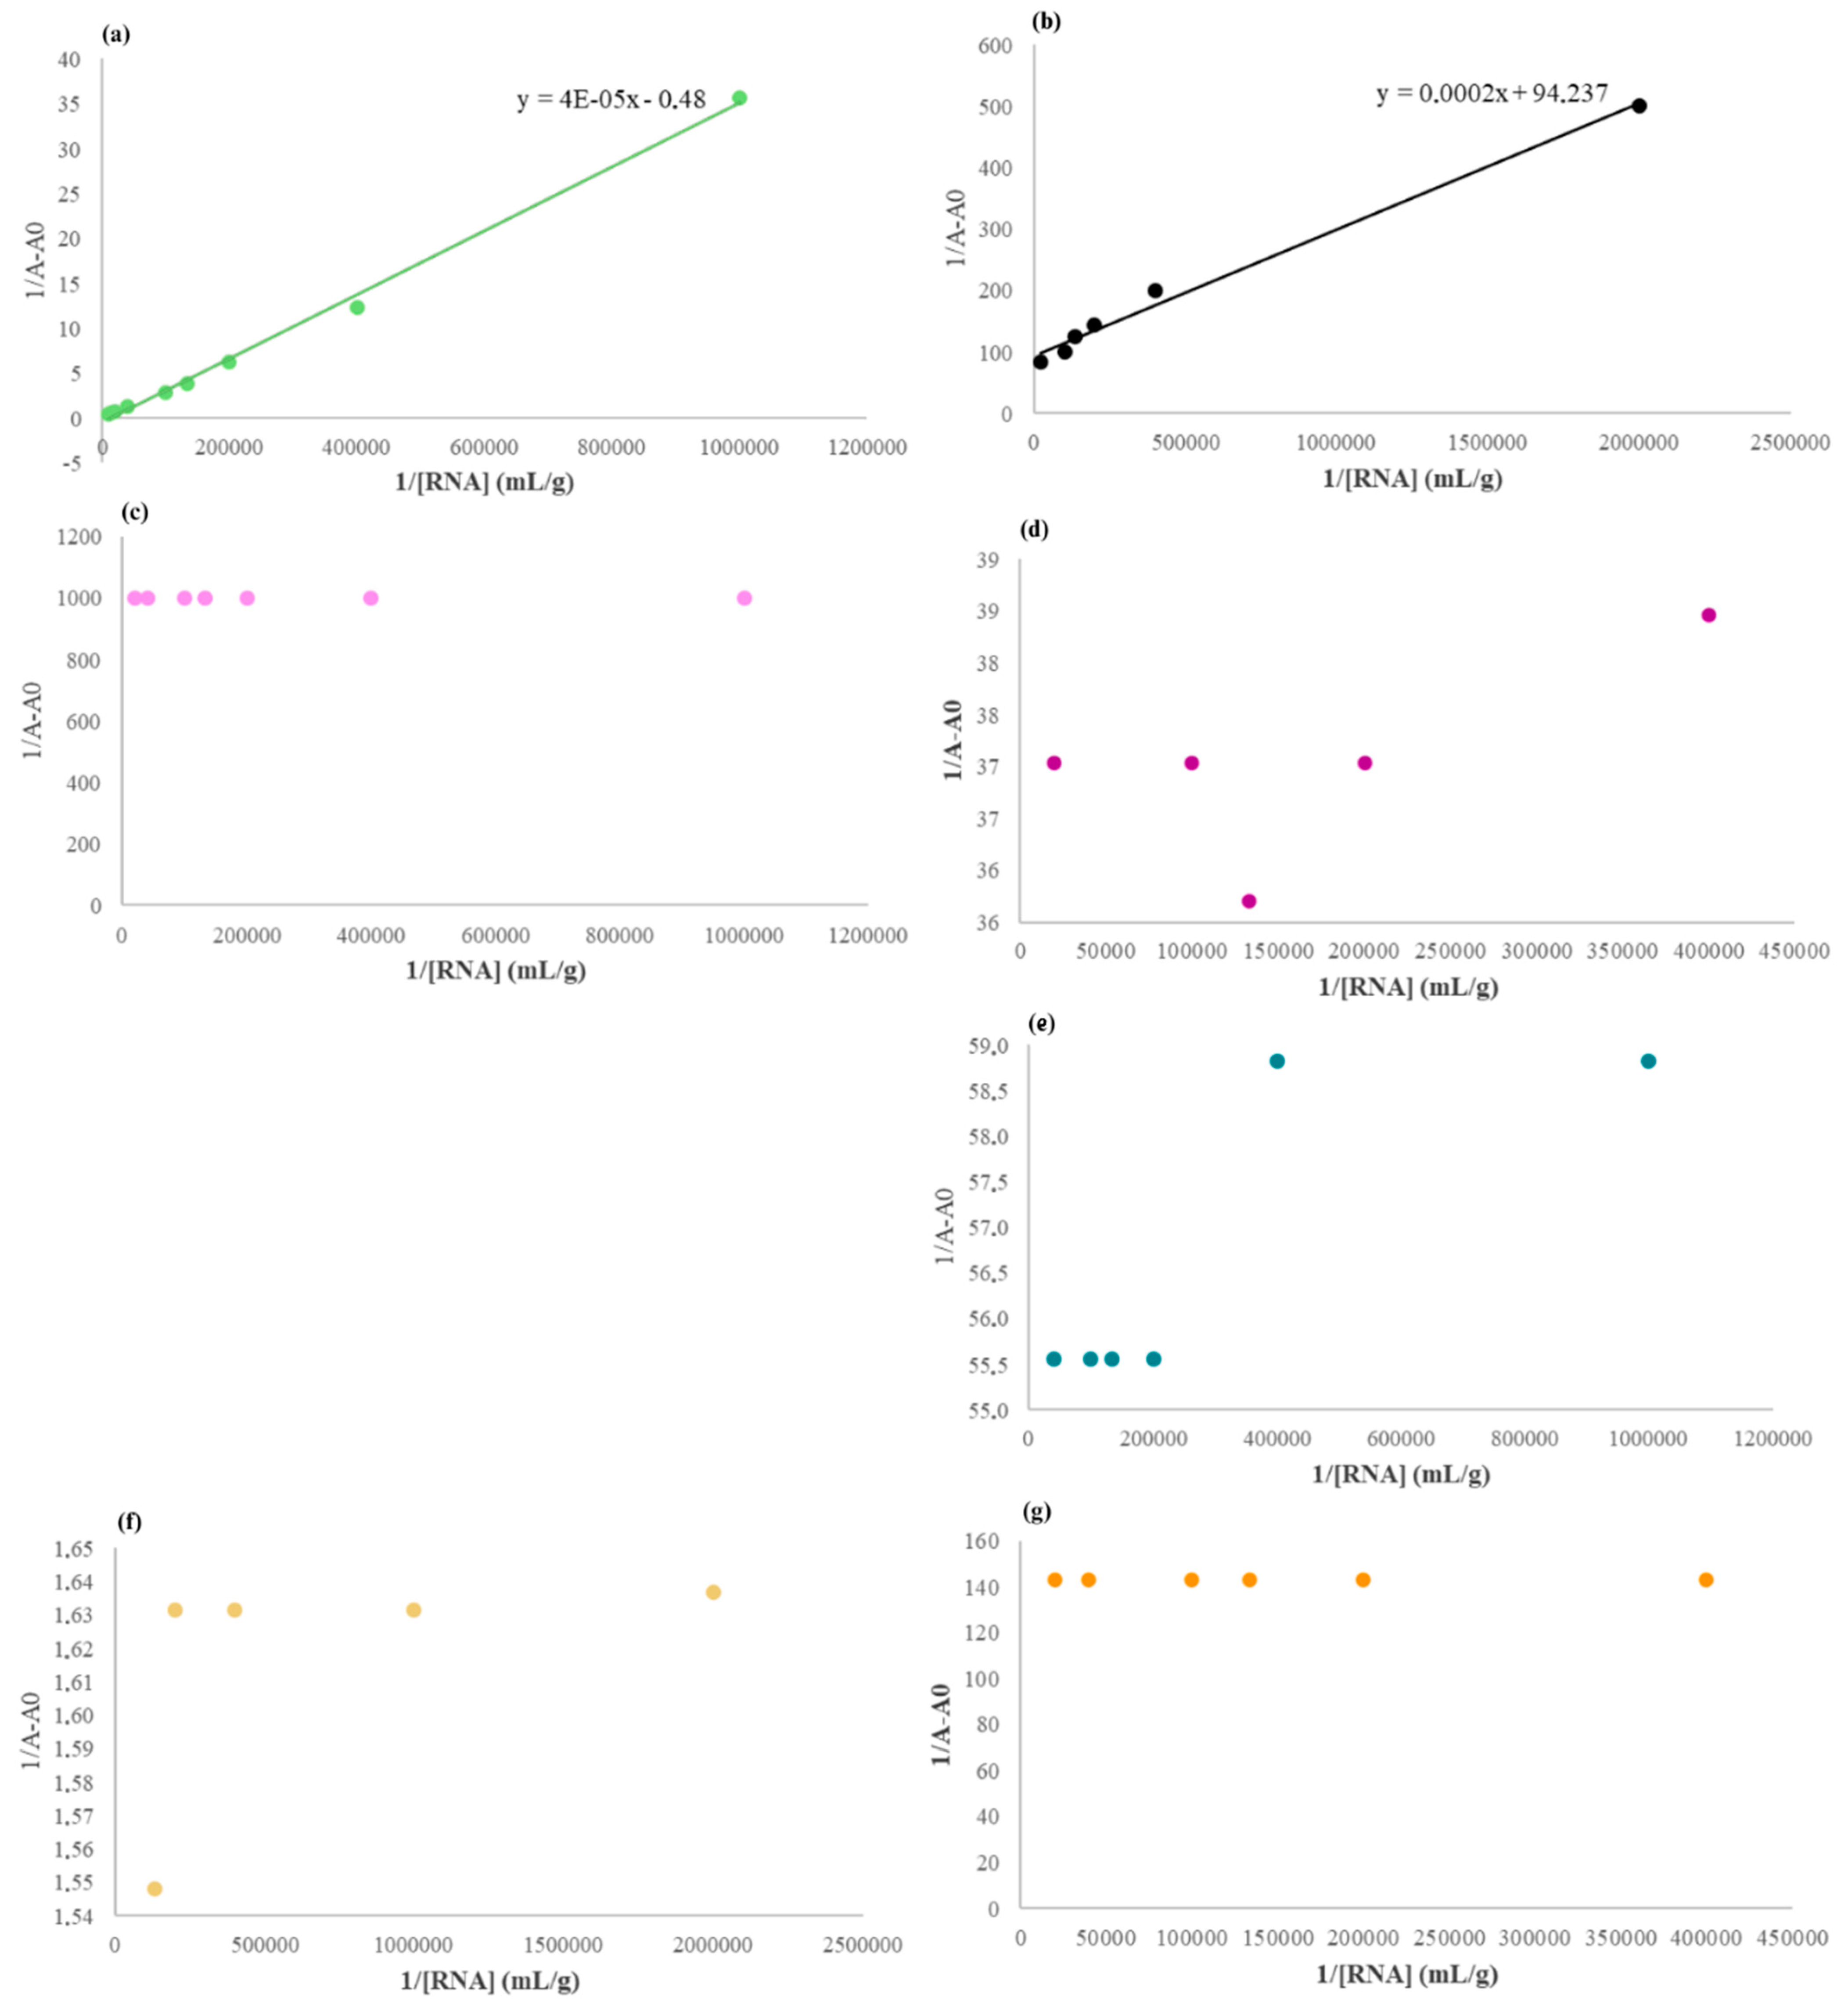
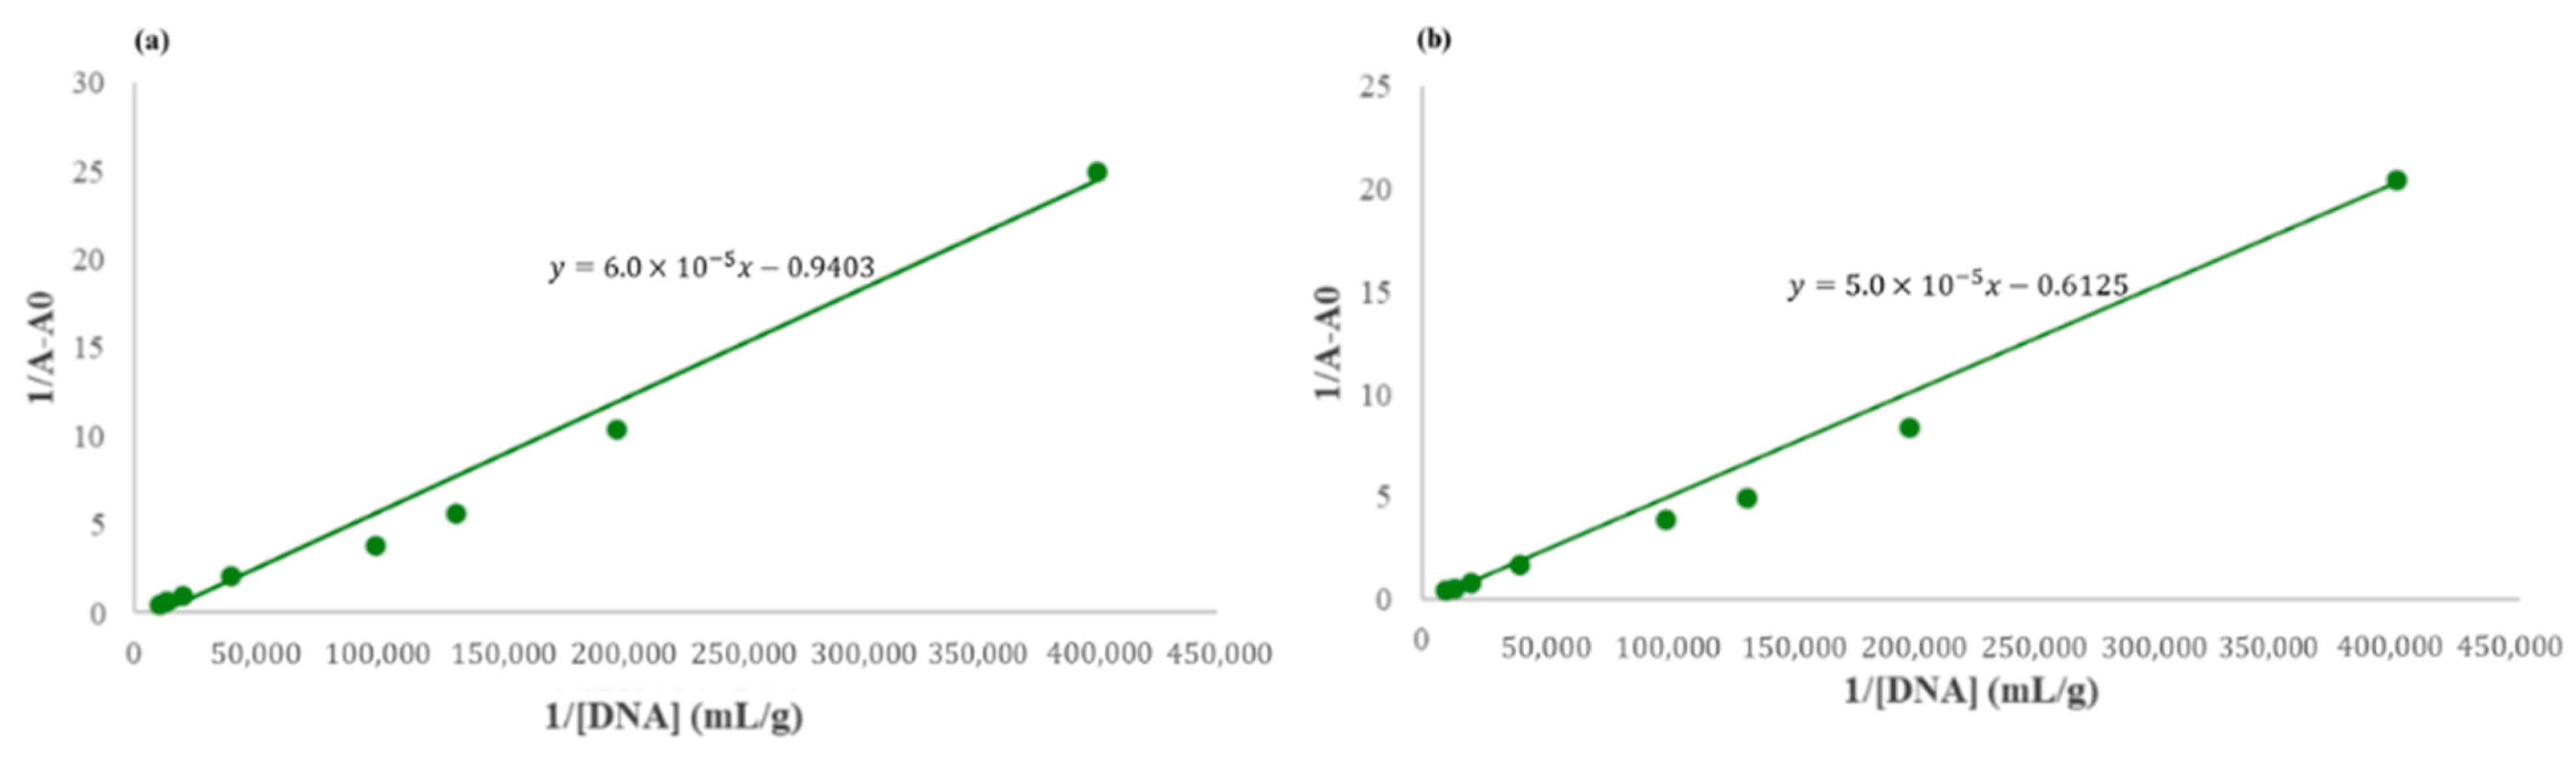
2.3.2. Effect of RNA Concentrations

The same Benesi–Hildebrand mode analysis was used to analyze pre-CMC and post-CMC behaviors (Figure 4). As seen in Figure 5, every surfactant presented a linear slope for the pre-CMC assays.
However, most of them reached a plateau for the post-CMC assays, as shown in Figure 6. Surfactant molecules will interact with nucleic acids through electrostatic interactions until the charge’s saturation is reached. This means that, at high surfactant concentrations, the DNA binding sites may become saturated [41]. So, the plateau observed on the post-CMC assays can be affected by the surfactant concentrations, which causes binding site saturation and therefore inhibits higher affinity values above the said saturation point.
Similarly, in Figure 7, it is evident that DNA and RNA exhibit similar behavior when in solution with DTAB. However, with increasing DNA concentrations, the slope increases both before and after the CMC, indicating that higher nucleic acid concentrations lead to more interactions with the surfactant.

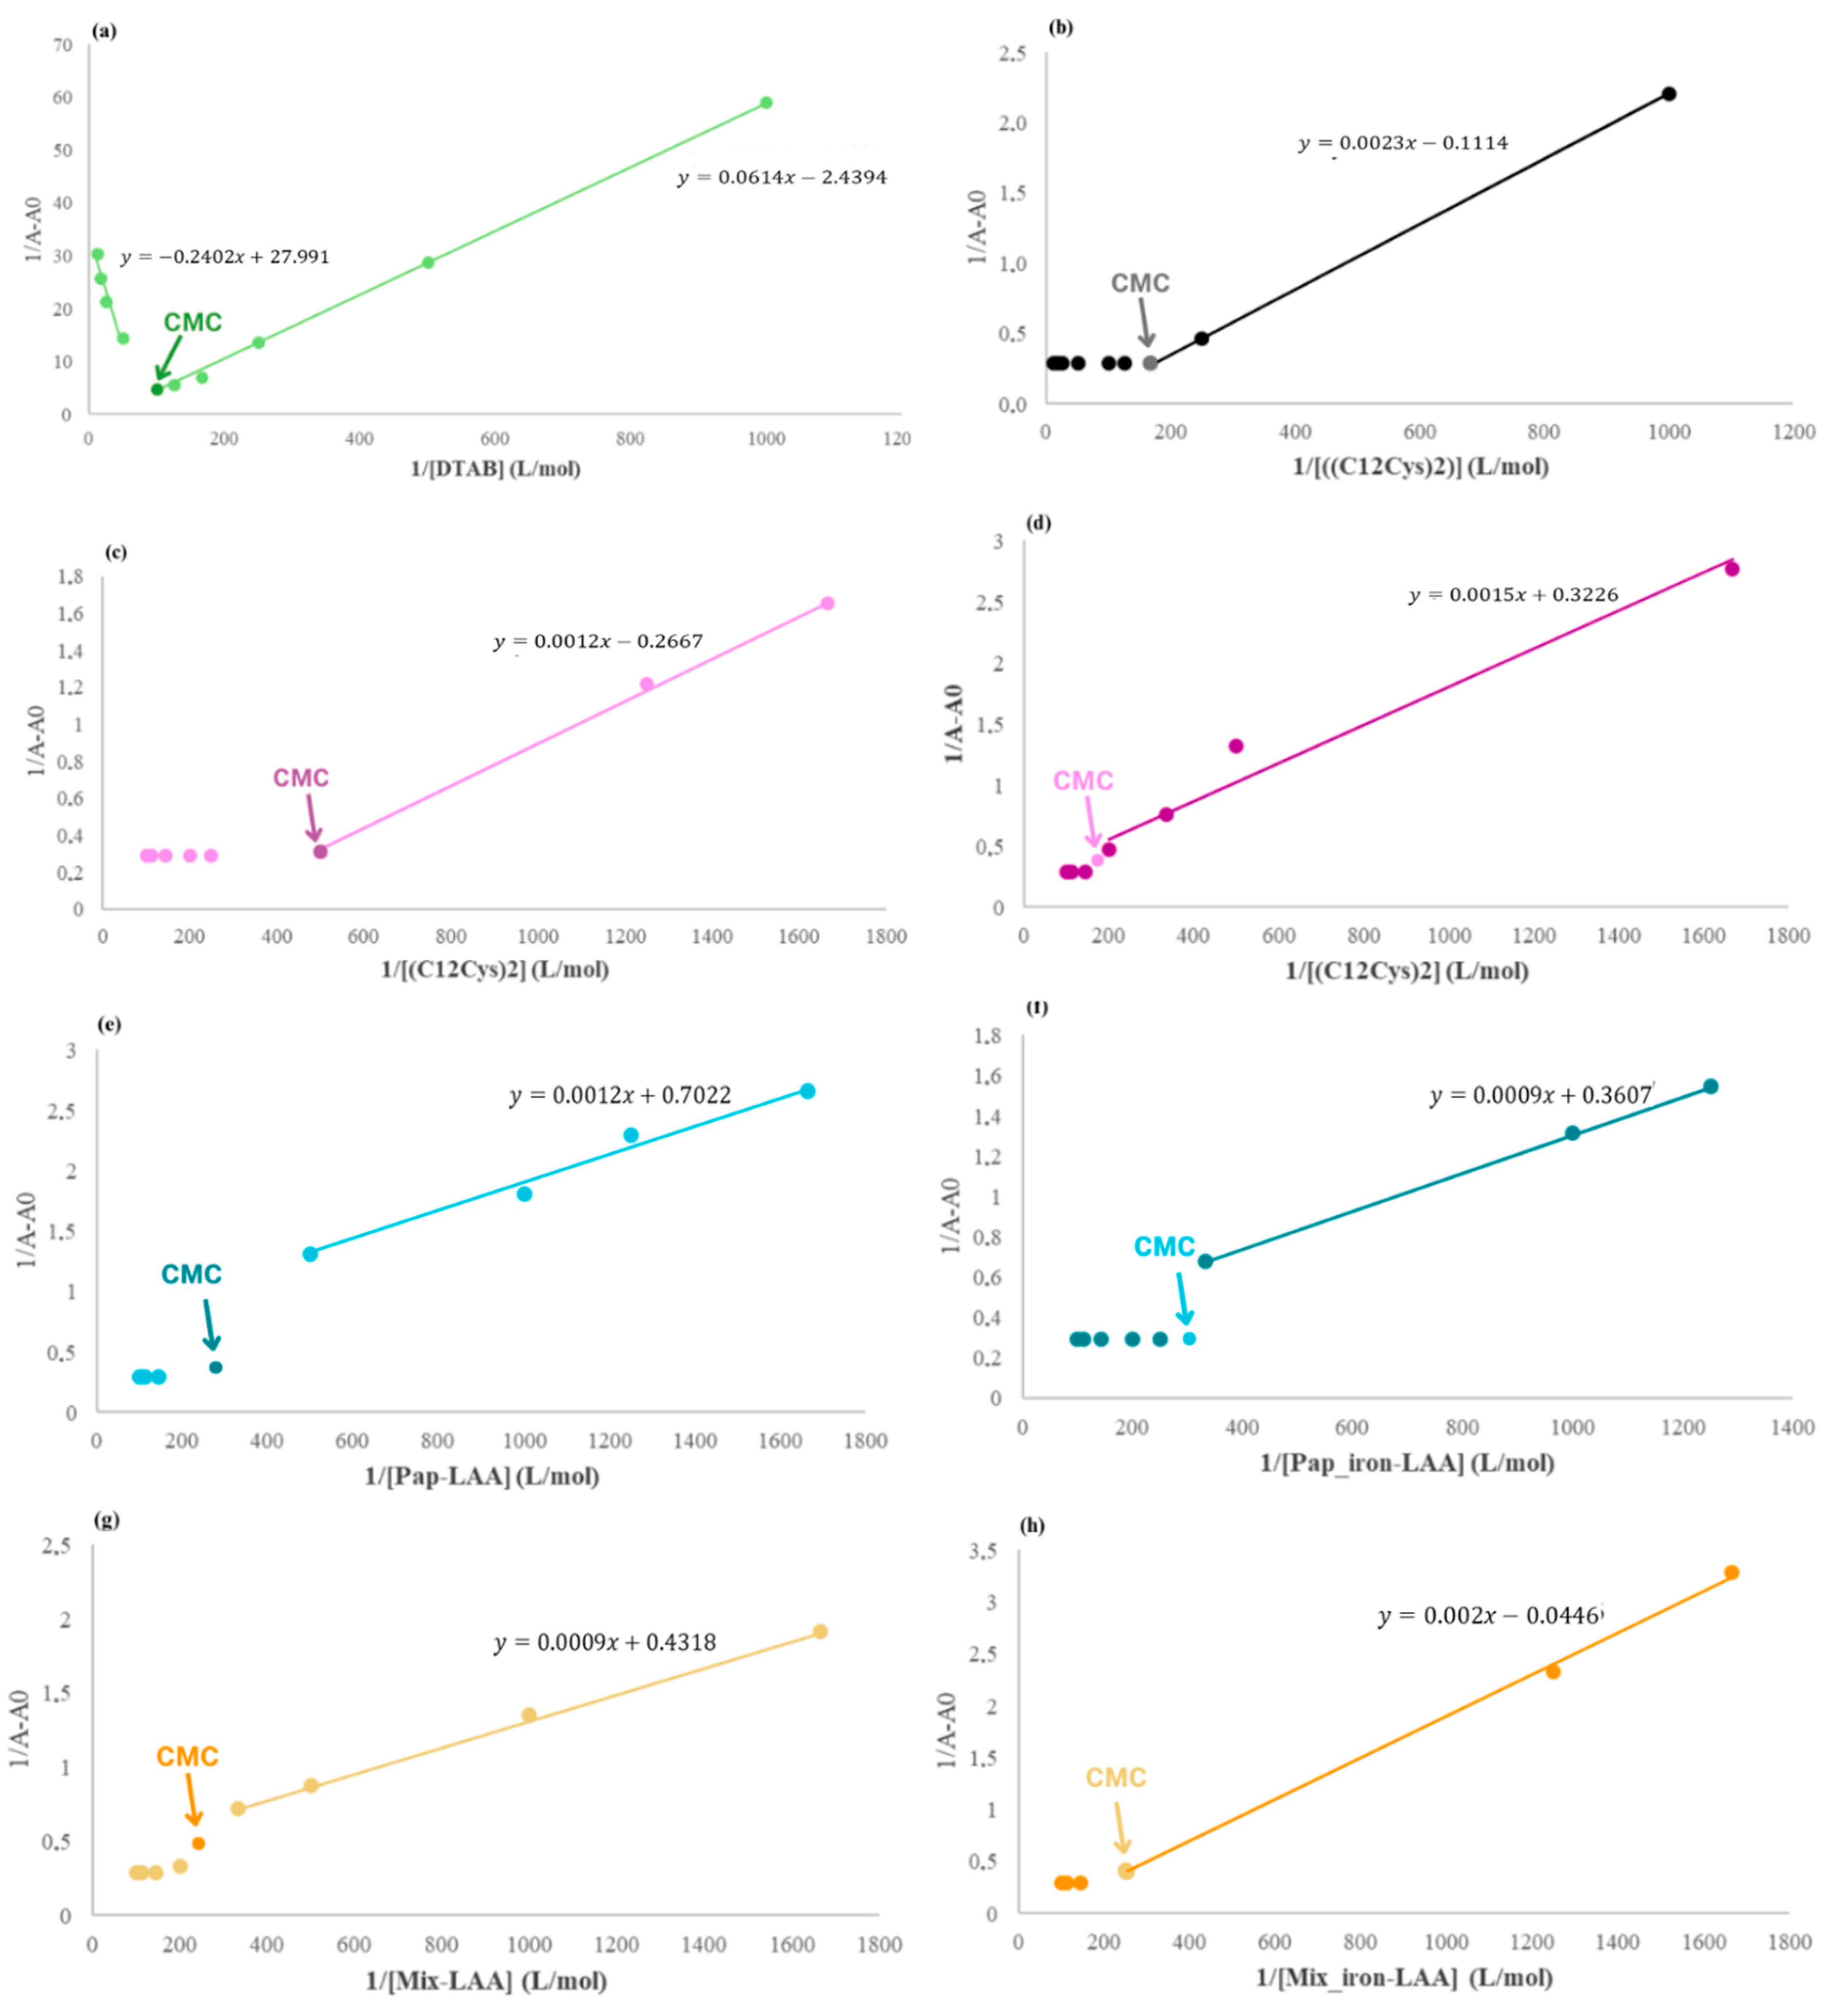
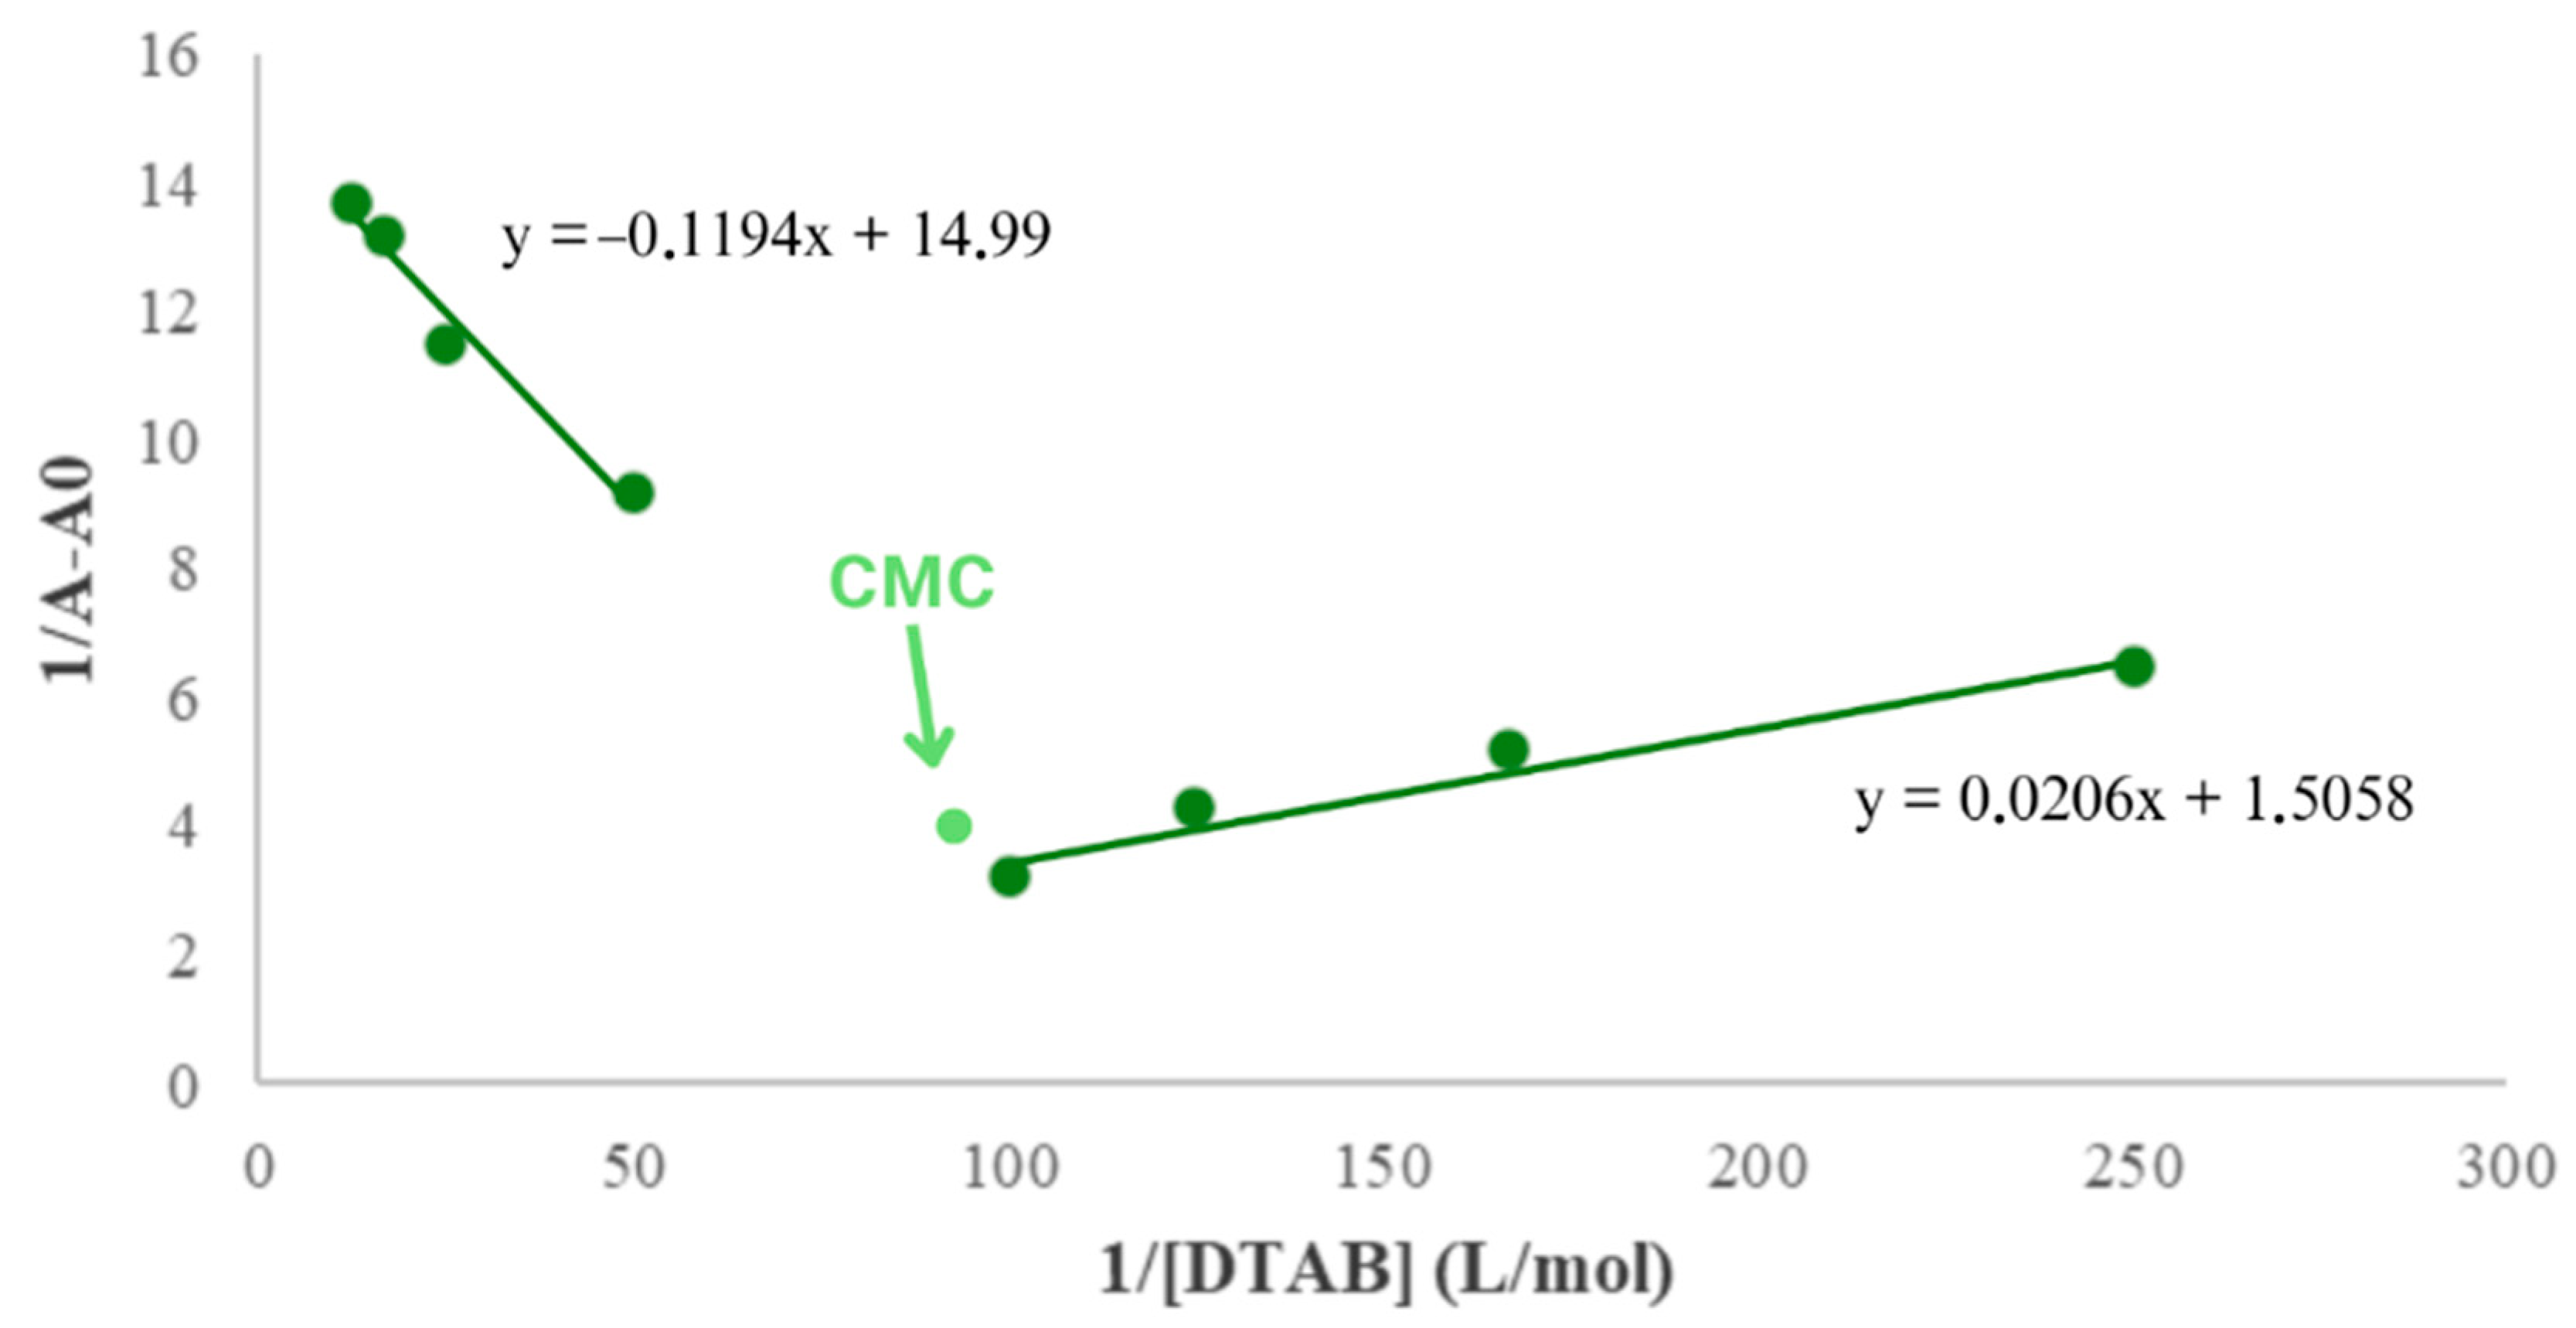
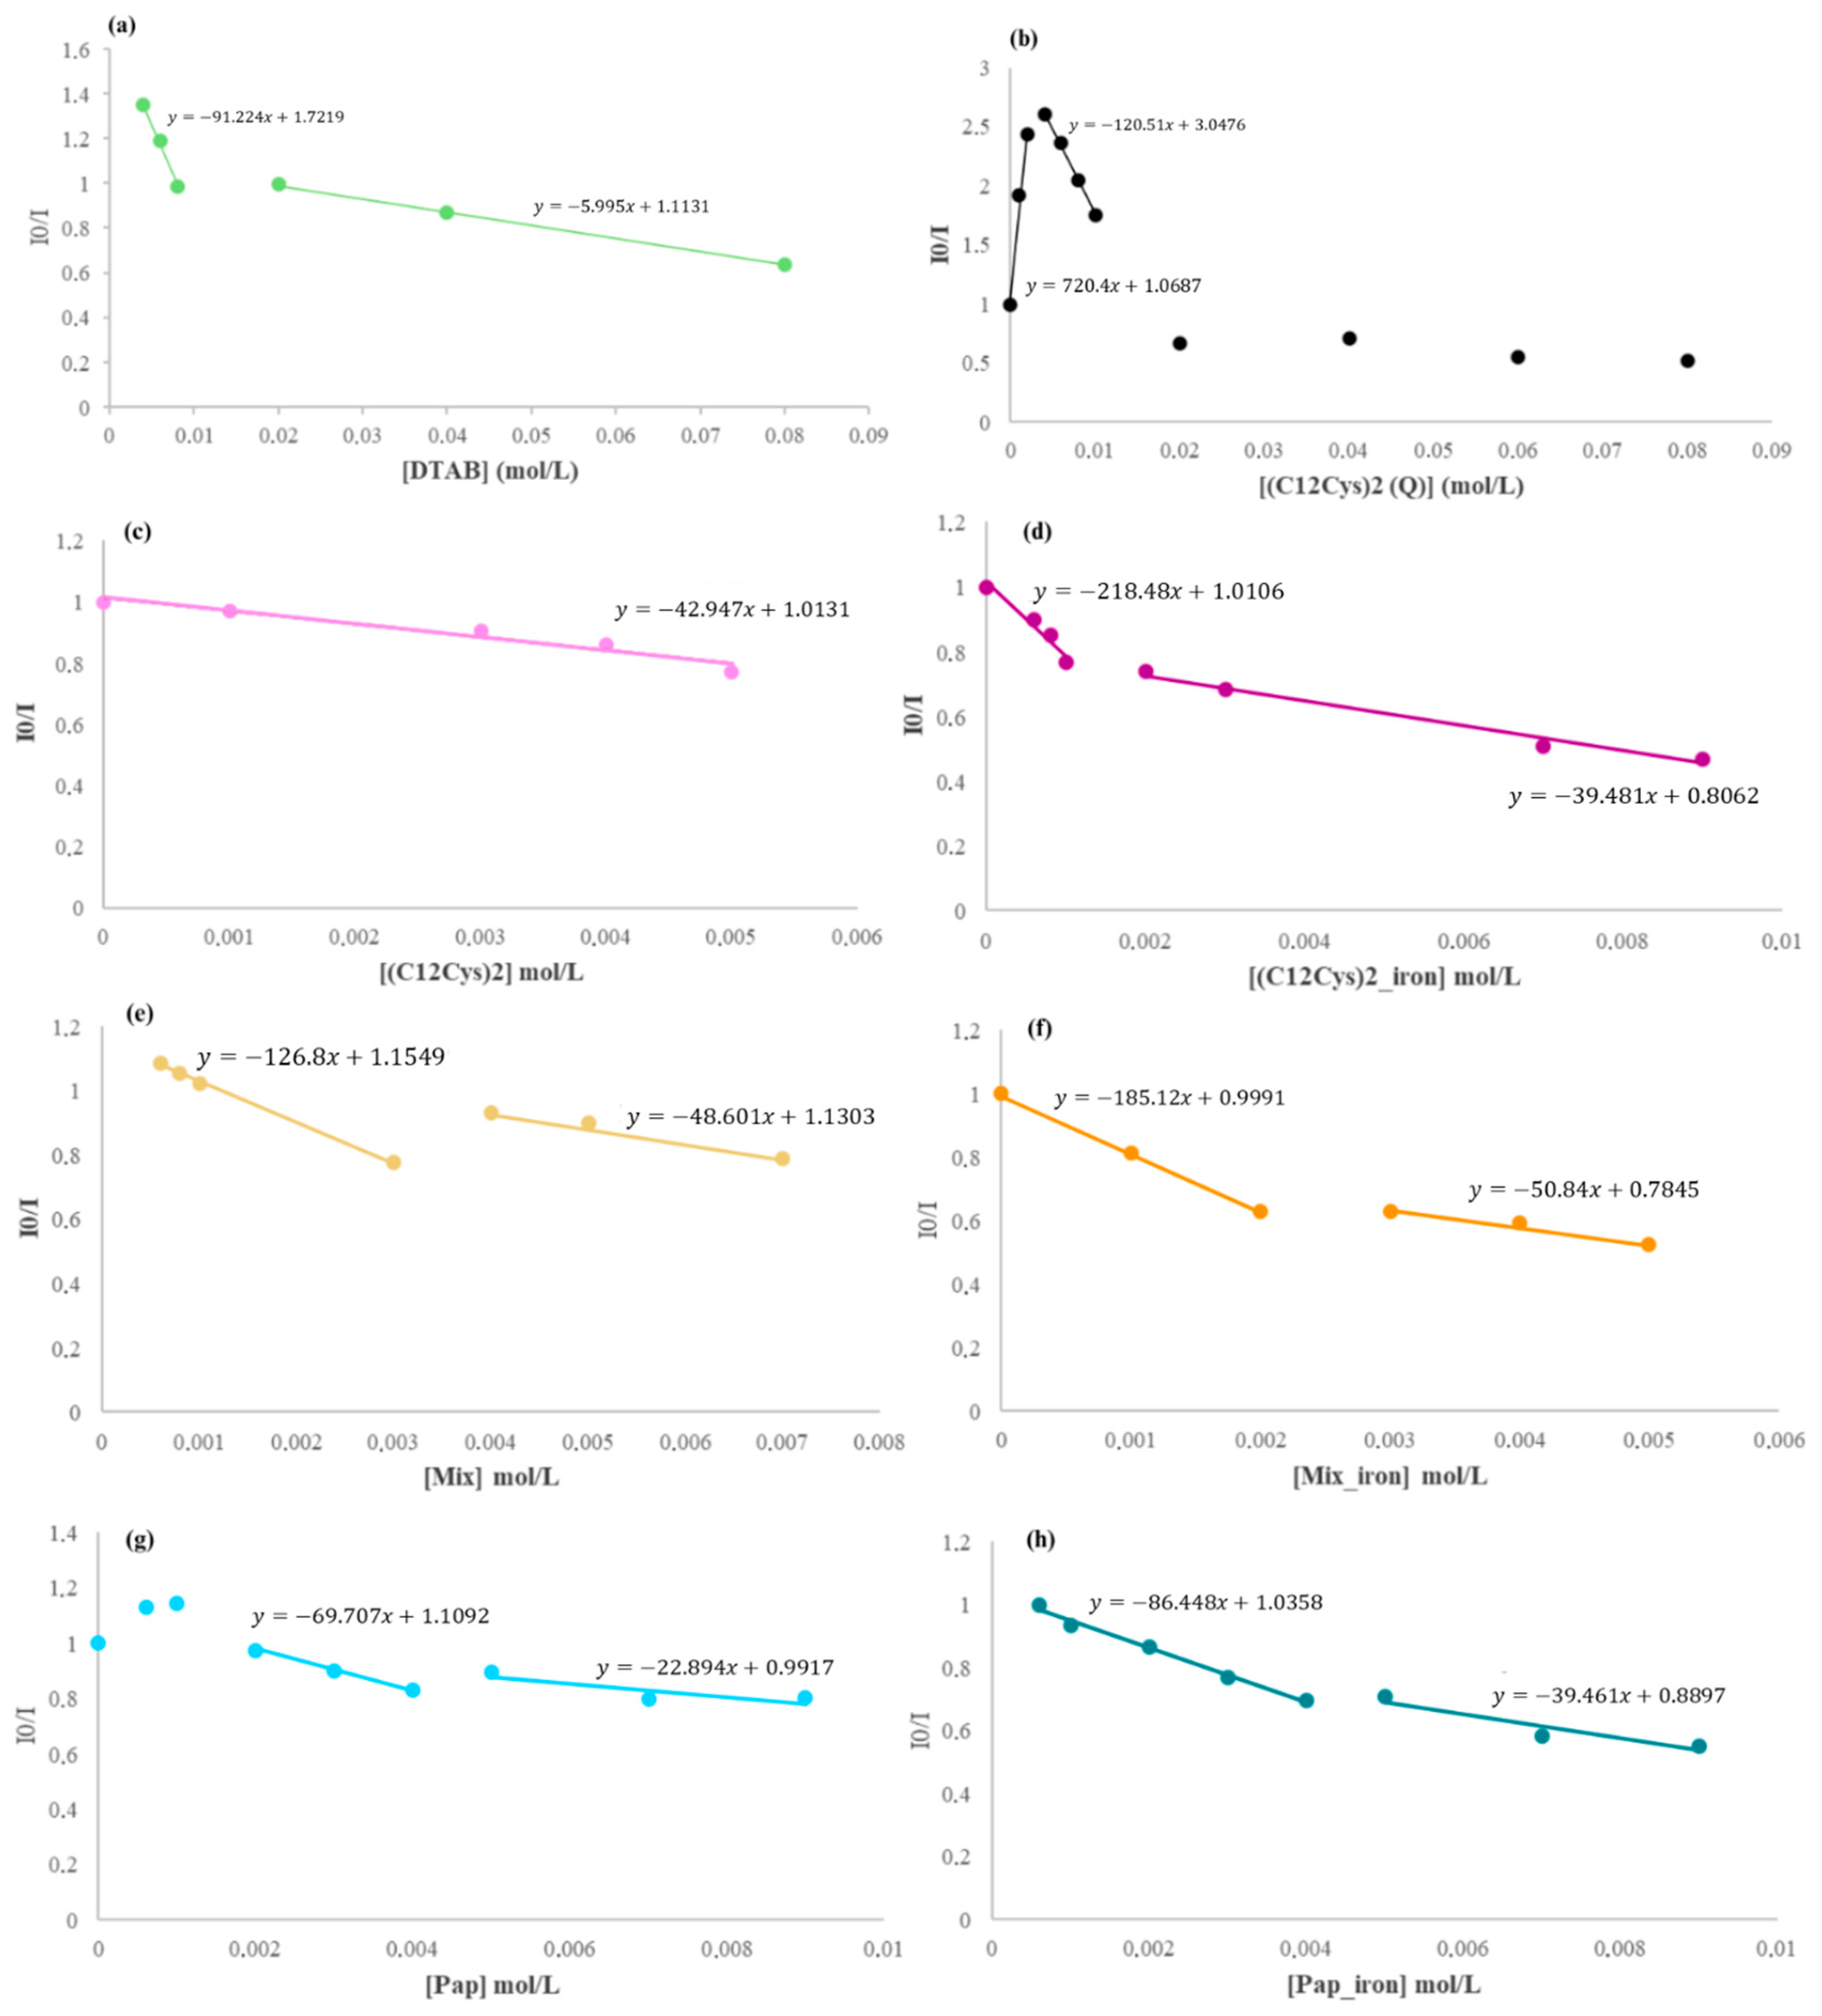
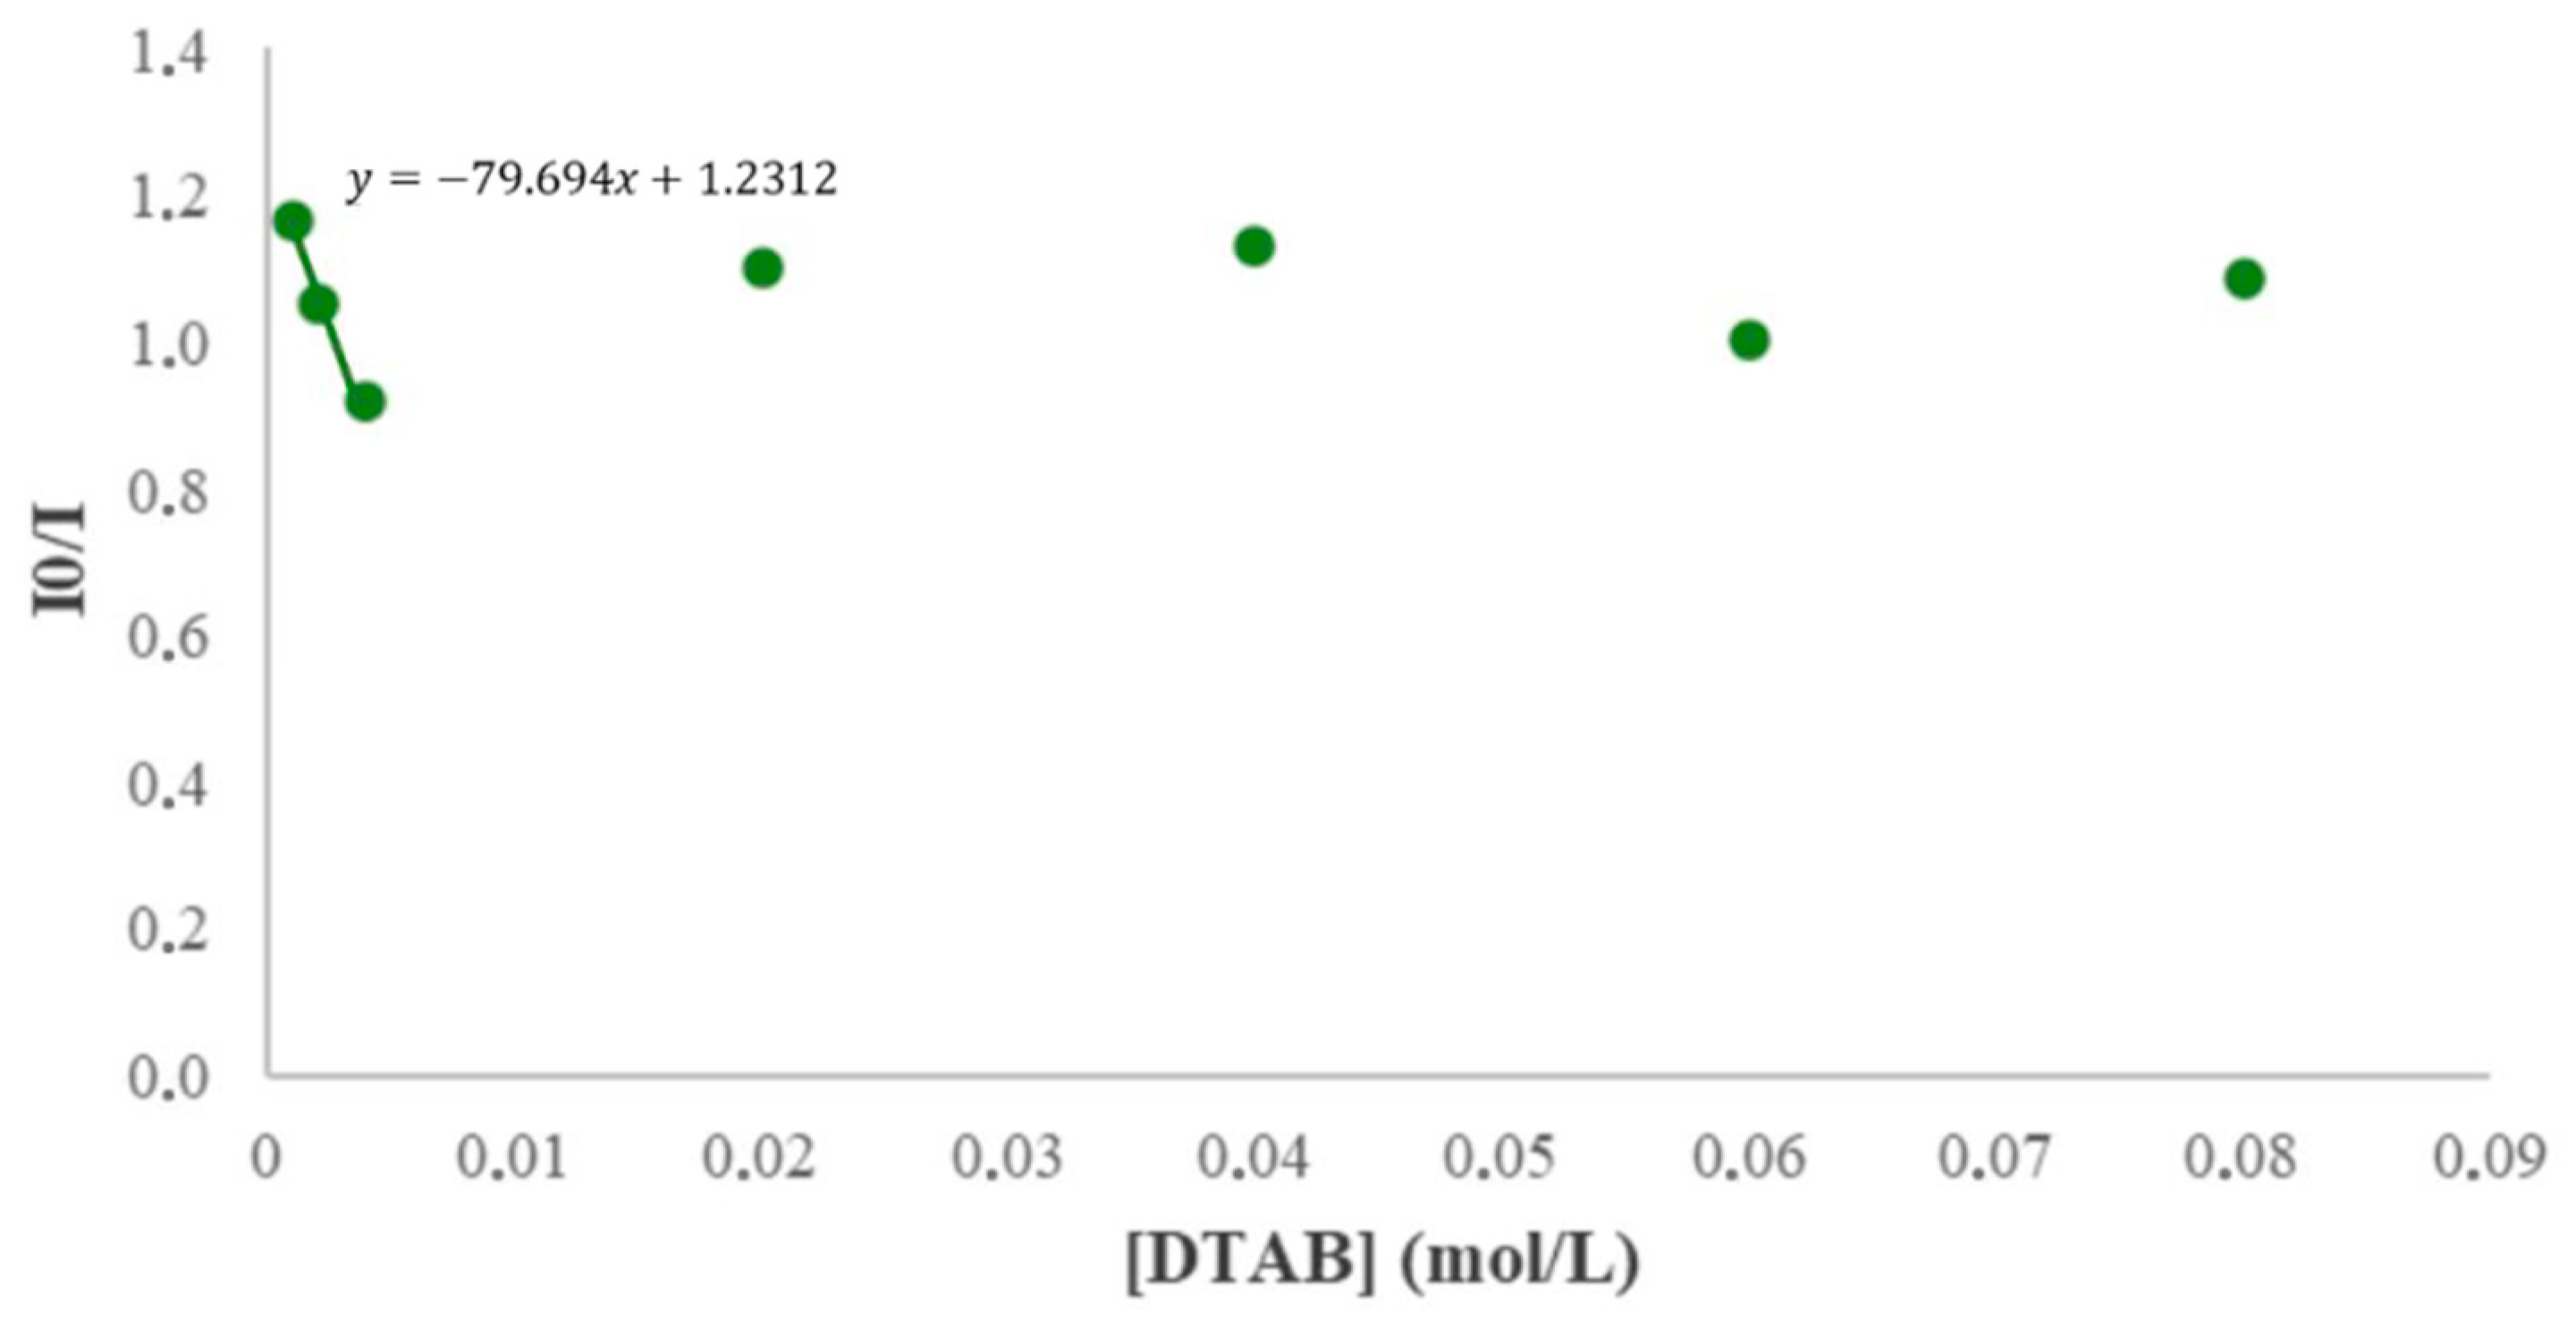
2.3.3. Ethidium Bromide Fluorescence Displacement Assays
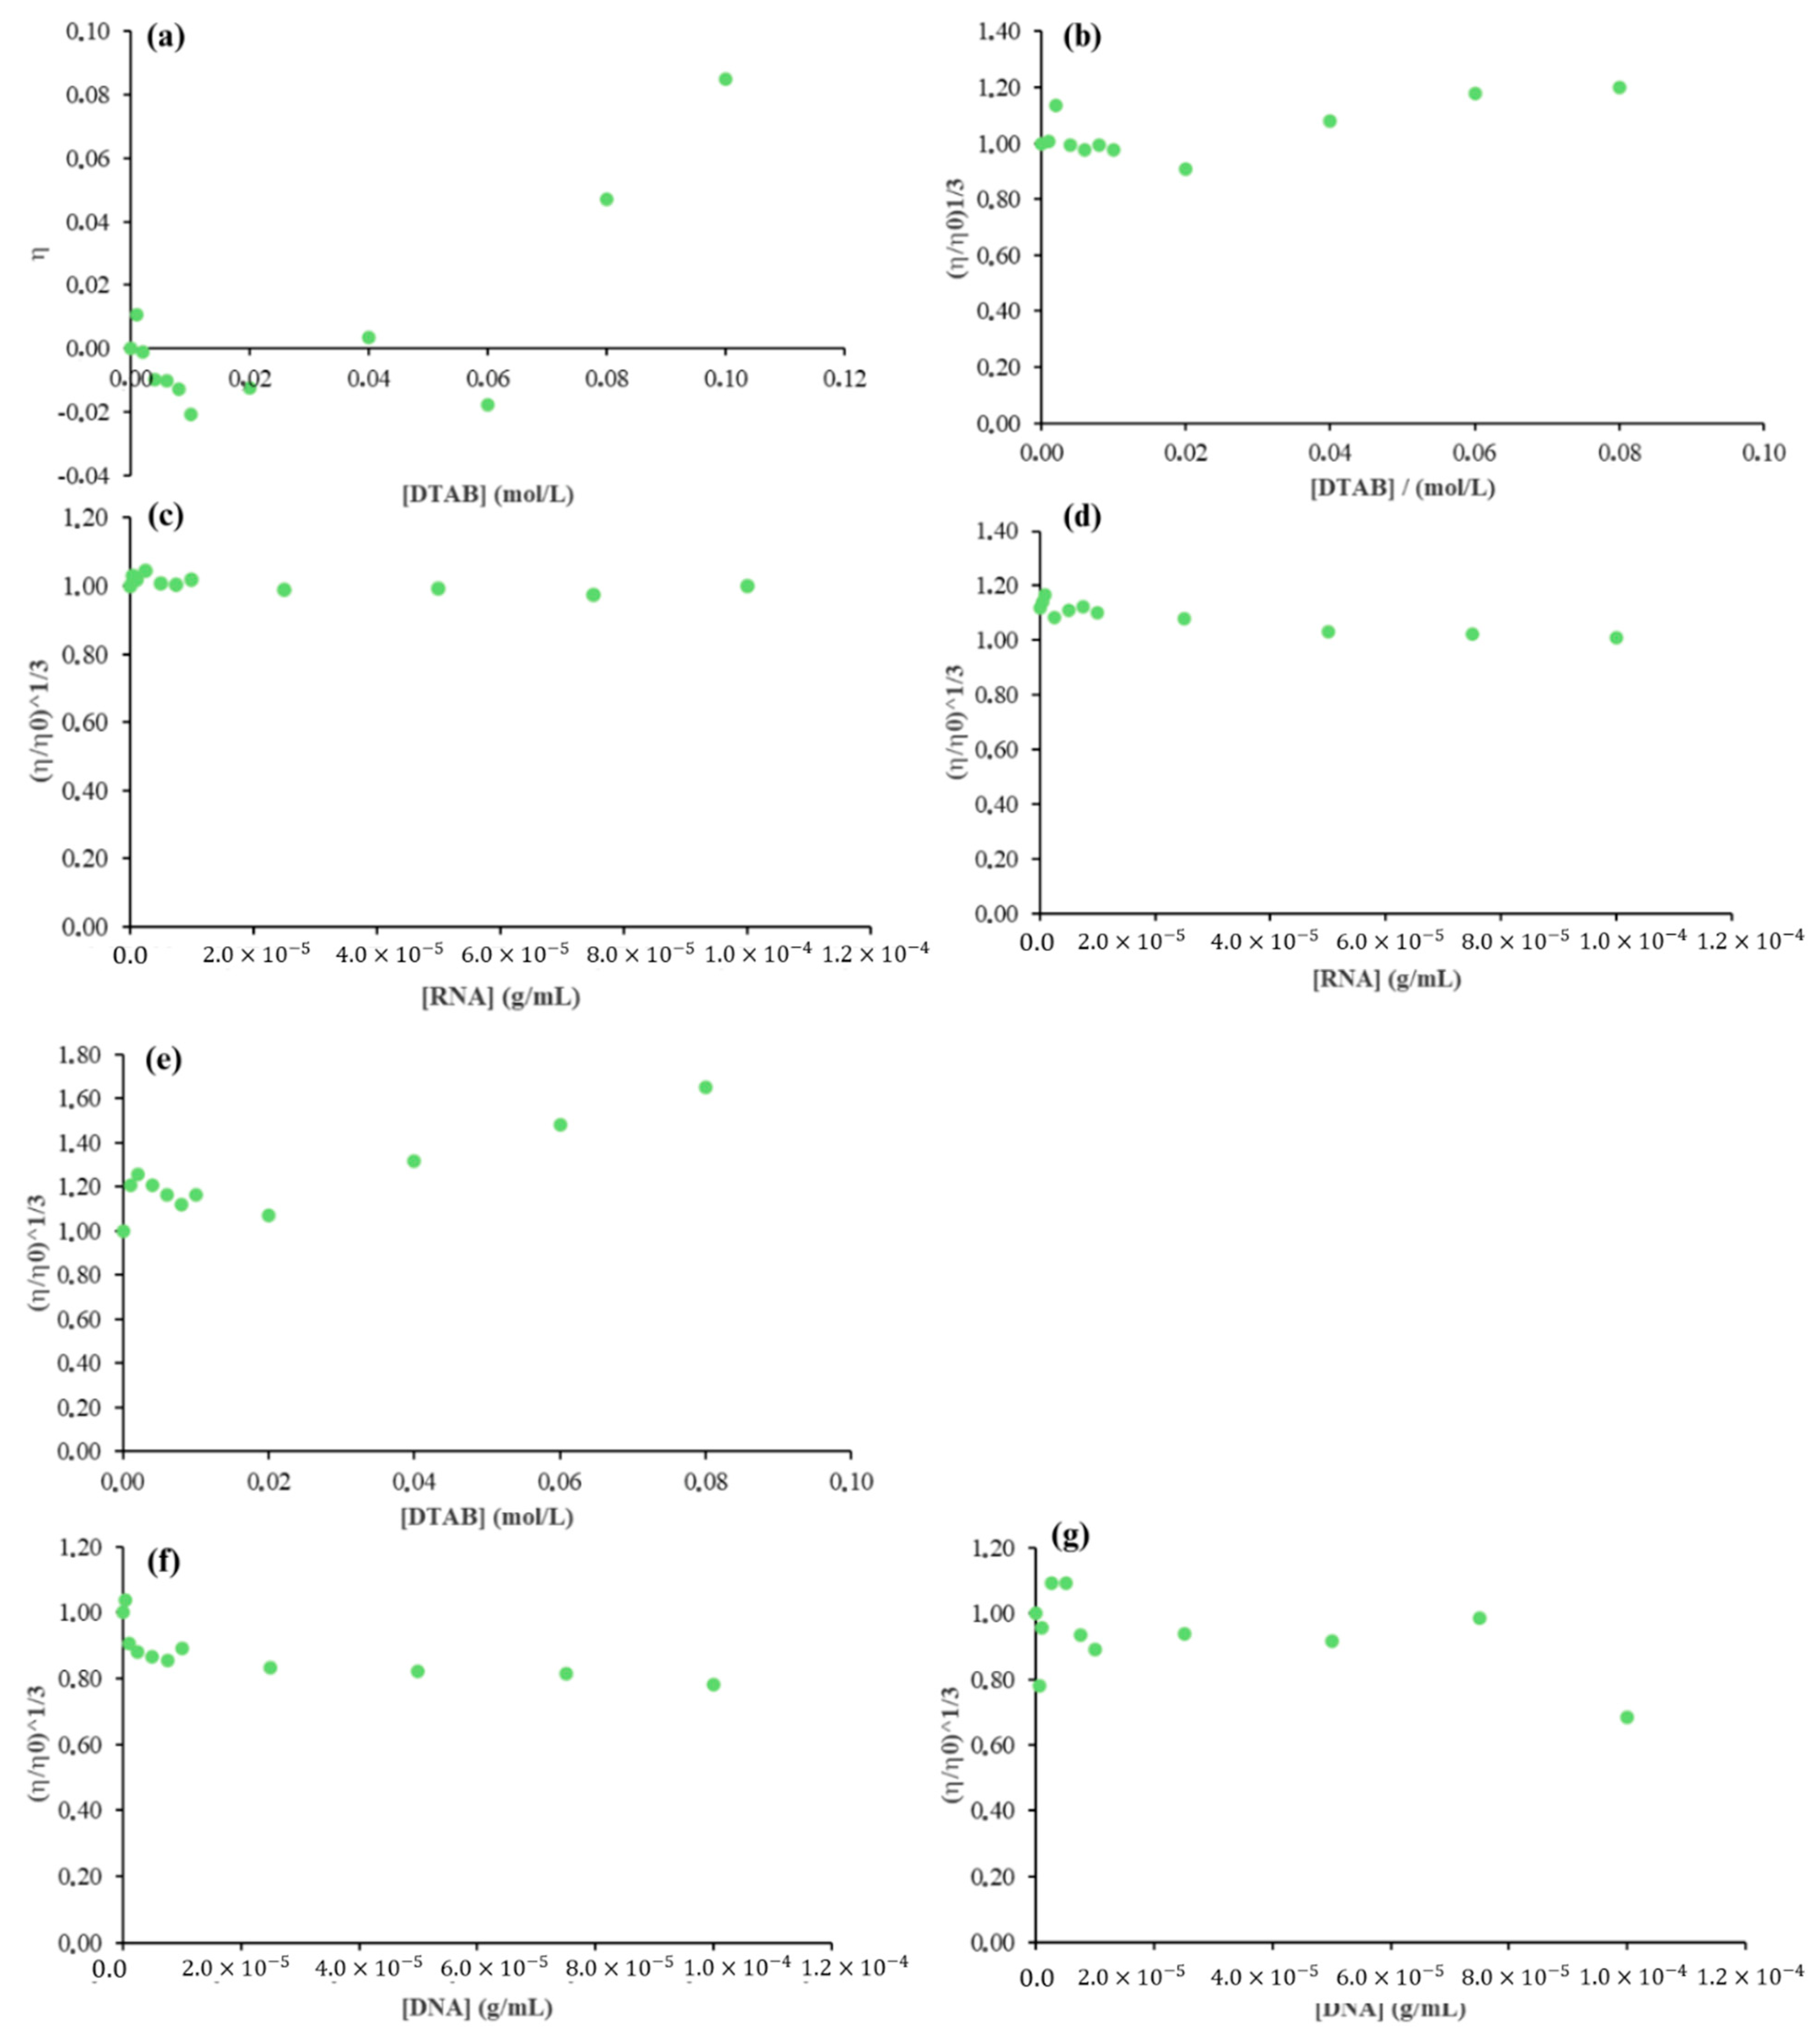
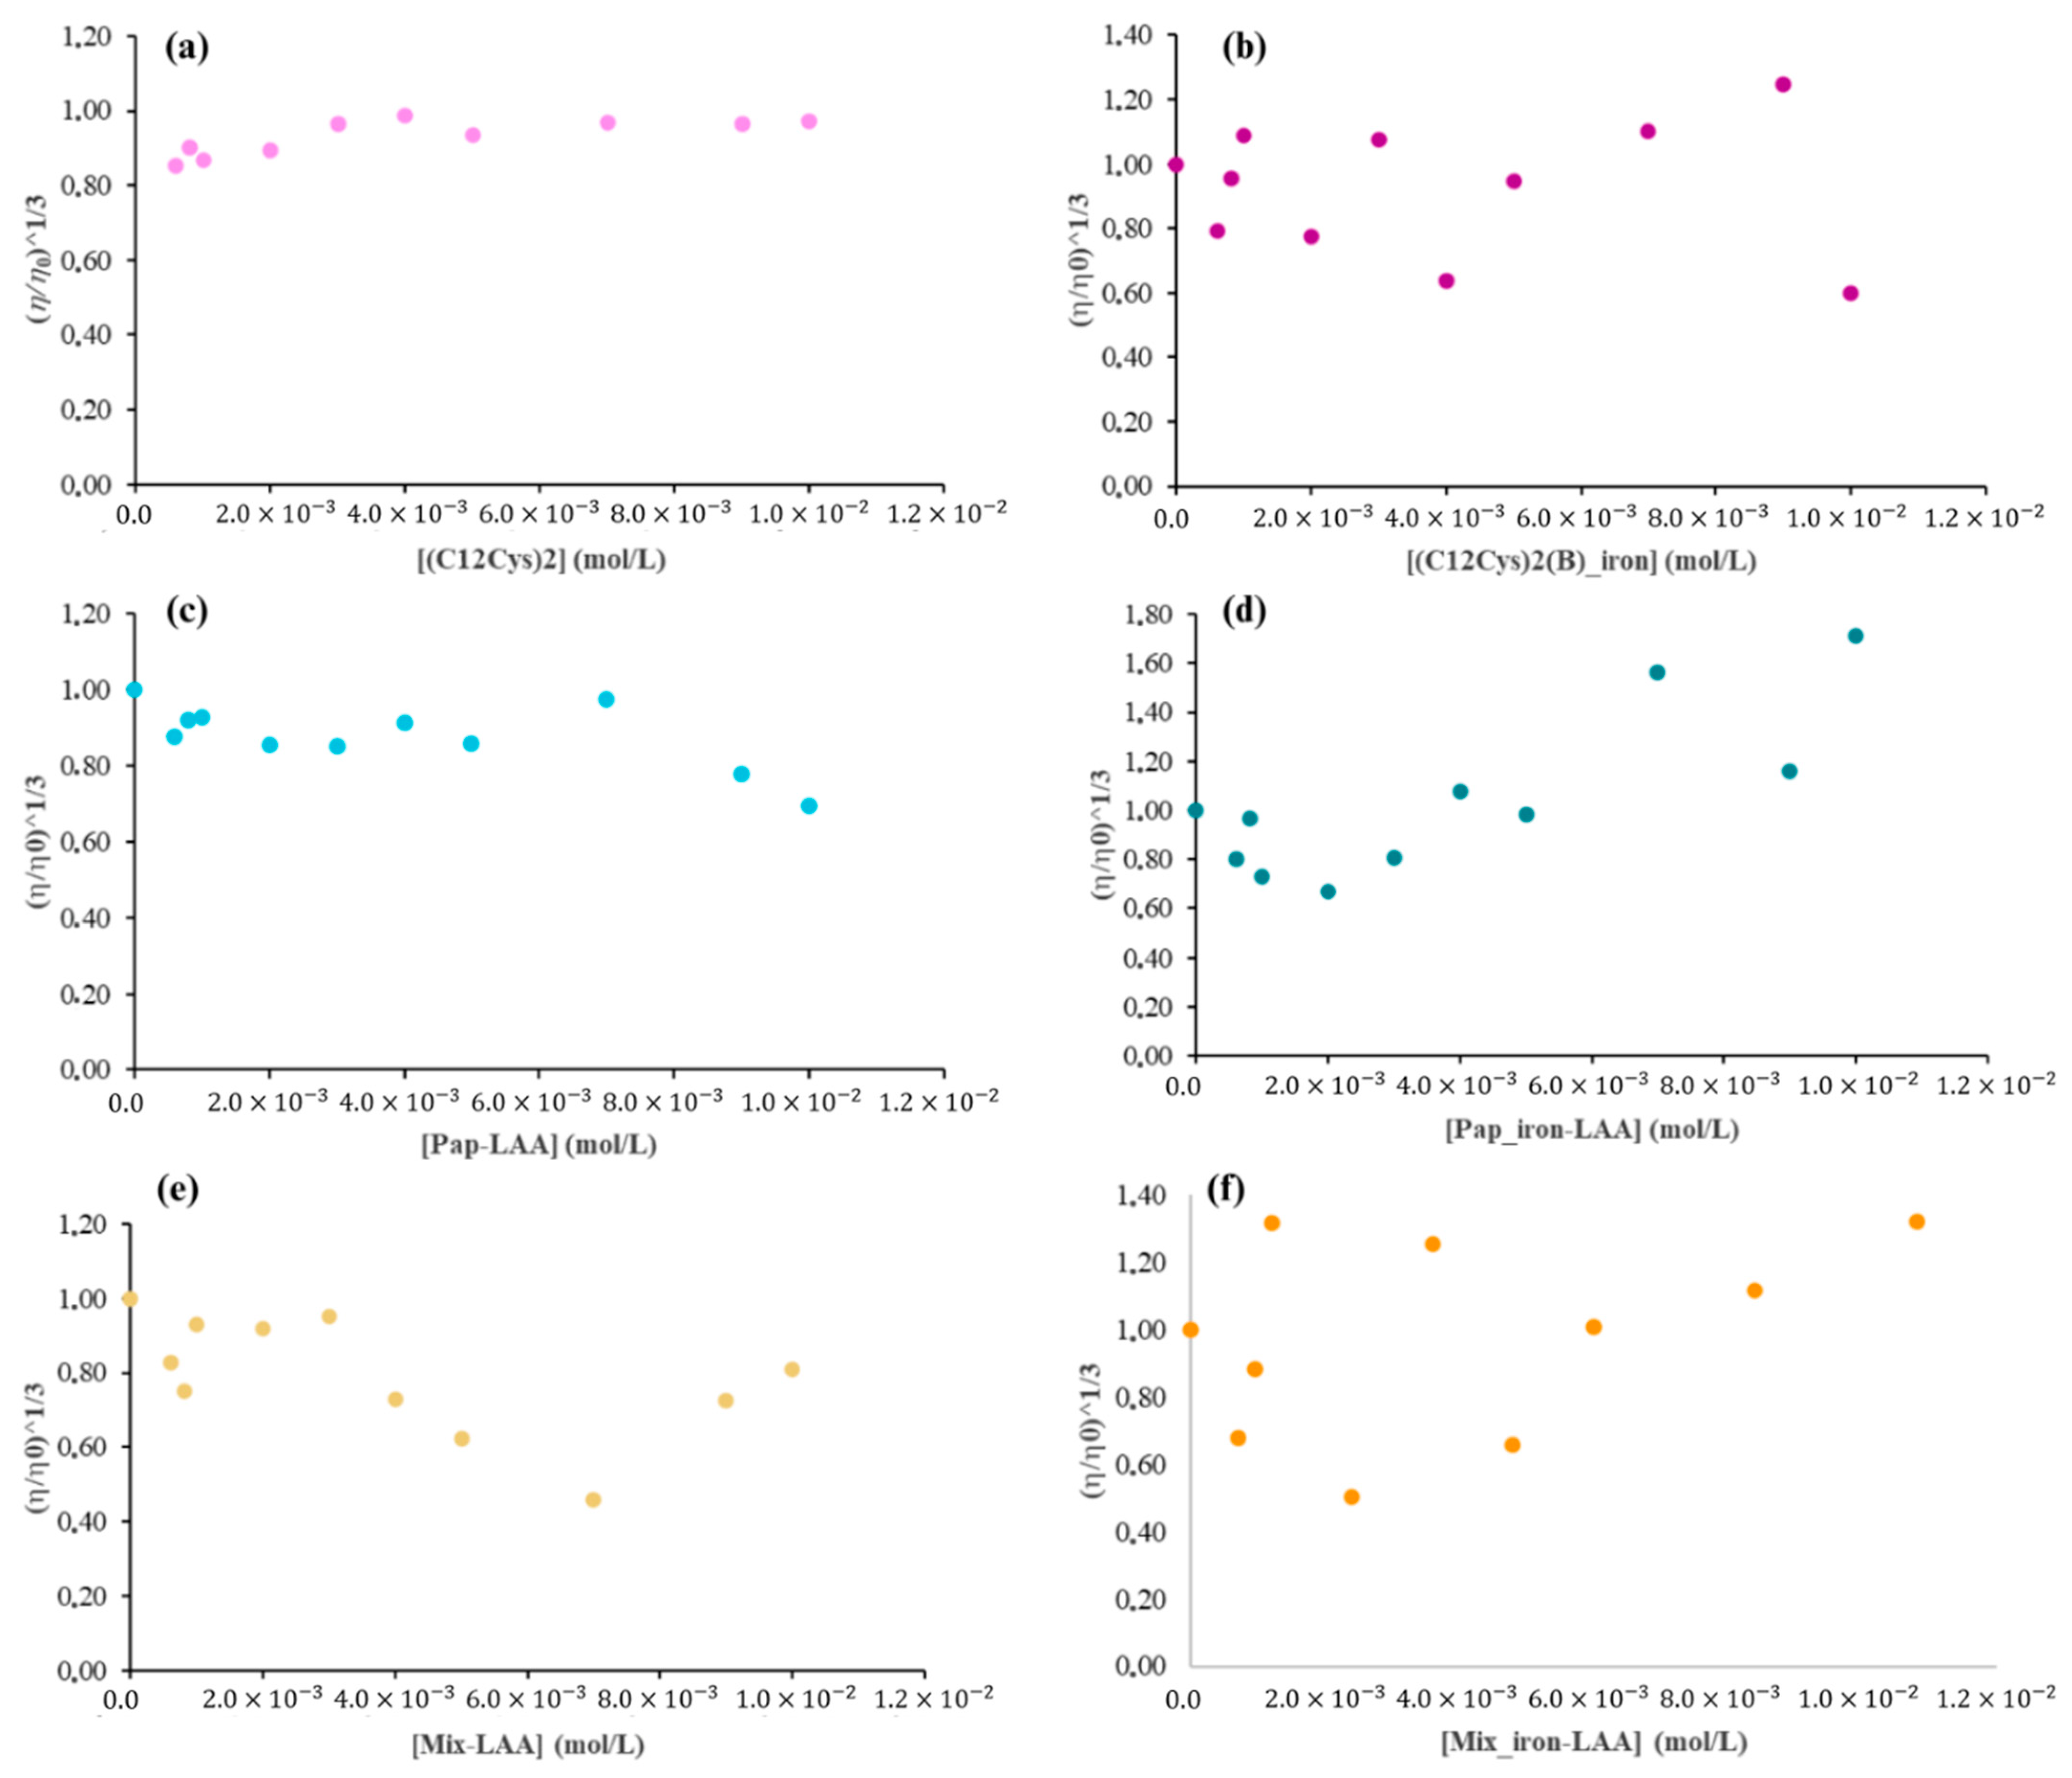
Small molecules, such as surfactants or probes like ethidium bromide (EtBr), can interact with nucleic acids in various ways: through intercalative binding, where a planar molecule inserts itself between adjacent DNA base pairs and binds to the helix axis; through groove binding, where a molecule binds to DNA in either the deep major groove or the shallow minor groove via hydrogen bonding or van der Waals interactions (the latter interaction is not possible for RNA); or through electrostatic binding, where the negatively charged DNA backbone associates with a positively charged molecule along the exterior of the helix. As the fluorescence and UV absorption spectra of cationic surfactant–DNA and cationic surfactant–RNA complexes were similar, this suggests that the interaction between the probe and the nucleic acid did not occur via intercalative binding [37].
The fluorescence of EtBr and other probes can be enhanced or quenched, providing insights into the nucleic acid’s structure and mass [42]. Nucleic acids have been shown to enhance probe fluorescence in the presence of a cationic surfactant. This enhancement likely occurs through charge transfer, hydrogen bonding, and electrostatic attraction, forming a complex between the probe and the surfactant along the extended nucleic acid chain. Additionally, the hydrophobic environment contributes to increased fluorescence [37].
The EtBr fluorescence displacement assay is used to verify the mode of interaction between a surfactant and nucleic acid. EtBr is a phenanthridine fluorescent dye that indicates intercalation. Due to its planar structure, EtBr can intercalate between adjacent base pairs of the nucleic acid helix, emitting fluorescence. The fluorescence intensity of EtBr in Tris-HCl buffer is low due to quenching by the solvent; however, it is significantly enhanced in the presence of DNA. When the surfactant binds to the nucleic acid, competitive binding can occur, reducing the number of available binding sites for EtBr and thus decreasing fluorescence intensity [35]. This decrease indicates that the surfactant can displace EtBr molecules, suggesting that the surfactant may interact with nucleic acids through intercalative binding [35,38].
For the analysis of the fluorescence assays, the Stern–Volmer model was used. This model allows for the analysis of the binding by the Stern–Volmer equation:
I 0 I = 1 + K S V [ Q ]
where I 0 and I are the fluorophore’s fluorescence intensity in the absence and presence of a quencher, respectively, K S V is the Stern–Volmer constant for complex formation, and Q is the surfactant (quencher) concentration. By plotting the quenching ratio, I 0 I , against the quencher concentration, Q, a straight line with a slope equal to the Stern–Volmer constant for complex formation, K S V , is obtained, with a possible upward curvature, as frequently observed in experimental plots [43].
Since the used surfactants were cationic, an increase in fluorescence intensity was expected due to the formation of the charge-transfer complex mentioned previously [37]. As seen in Figure 8, the opposite was observed.
With increasing surfactant concentrations, an increase in the quenching effect was observed for all surfactants. This may be due to the surfactants interacting with EtBr and forming a stable non-fluorescent complex, resulting in static quenching [43]. Another possibility is that both the surfactant and EtBr compete for binding sites on RNA, leading to competitive binding and the formation of surfactant–RNA complexes, which leaves fewer available binding sites for EtBr [35]. This suggests that the surfactant may bind to RNA through intercalative binding [35,38].
A similar trend was observed for the DNA samples, which exhibited a negative slope before the CMC, as shown in Figure 9. However, for DNA, the slope became constant after the CMC, indicating no further quenching. This could be due to the saturation of DNA binding sites; although a charge-transfer complex between the surfactant and EtBr may still form, this complex cannot bind to DNA due to binding site saturation, leading to constant fluorescence intensity [37,44].

2.4. Viscosity

Hydrodynamic measurement is useful for assessing binding in solution, as it is sensitive to changes in viscosity and sedimentation. The intercalation of surfactants into nucleic acid molecules can cause a significant increase in viscosity because intercalation increases the separation between base pairs, thereby extending the length of the nucleic acid [35]. Consequently, a steady increase in viscosity with increasing surfactant concentrations suggests that the interaction between the surfactant and the nucleic acid involves intercalative binding [35].
At lower surfactant concentrations, the surfactant may interact with the nucleic acid through intercalative binding, leading to an increase in viscosity. However, at higher concentrations, stronger repulsive forces between molecules may arise, or partial, non-classical intercalation could occur. In such cases, the ligand may bend the nucleic acid chain, reducing its length and thus diminishing surfactant–nucleic acid interactions, which lowers the viscosity [38,43].
The flow times were measured and are presented as ( η η 0 ) 1 3 versus surfactant concentration, where η and η 0 are the viscosity of the nucleic acid in the presence and in the absence of surfactant, respectively. 33,42 The viscosity values were corrected for the flow time of the solvent alone; t 0 : η = ( t t 0 ) t 0 [35,38].
Experimental results did not show clear trends, as seen in Figure 10, Figure 11 and Figure 12, preventing the drawing of definitive conclusions. However, the minimal change in viscosity with increasing surfactant (or nucleic acid) concentration suggests a non-intercalative binding mode between the surfactant and nucleic acid. Figure 10e and Figure 11a show a slight increase in viscosity with surfactant concentration, which is typical of intercalative binding.

3. Experimental Section

3.1. Enzymes

The lipase, porcine pancreatic lipase, Type II, Crude (PPL) (Sigma-Aldrich (Saint Louis, MO, USA) L3126, E.C. 3.1.1.3) and Papain Carica Papaia, powder, ≥3 units/mg (Sigma-Aldrich 9001-73-4) were used.

3.2. Substrates and Nucleic Acids

L-cystine (Cys2) (Sigma-Aldrich) and dodecylamine (Sigma-Aldrich) were used as substrates to create the polar heads and the hydrophilic tails of the gemini surfactants, respectively. Ribonucleic acid (RNA) from Torula utilis and deoxyribonucleic acid (DNA) from salmon were supplied by Sigma-Aldrich (St. Louis, MO, USA).

3.3. Other Chemicals

Tris buffer (Tris-(hydroxymethiyl)aminomethane) and sodium acetate trihydrate were from Merck, and sodium chloride (NaCl) from Panreac. The eutectic mixture Dowtherm® A was from Sigma-Aldrich, as well as methanol, Iron (II, III) oxide, dodecyltrimethylammonium bromide (≥98%), eosin reagent, and ninhydrin reagent, according to Stahl (17975). Glycerol, C3H8O3, was from Absolve. Tetramethyl orthosilicate (TMOS) was from Fluka Analytical, and the Protein Assay Dye Reagent concentrate from Bio-Rad (San Francisco, CA, USA).

3.4. Analytic Methods

The absorbance measurements at 260 nm (Eppendorf BioPhotometer, Marshall Scientific, #6131, Hamburg, Germany) were used to monitor the evolution of the assays, as this is a general wavelength for peptide species or proteins. Calibration curves were determined for the substrates individually in Tris pH 8 buffer. For product evaluation, controls of substrates were carried out in each reaction and subtracted from the global absorbance.
Protein quantification was carried out according to the Bradford method [26,45,46] adapted to a micromethod [47] for faster multiple sample processing. In this method, 50 µL of dye was added to 100 µL of the sample to be tested in a microplate (Thermo Scientific NuncTM 96 well microplates, Waltham, MA, USA). The reaction was developed for 5 min, and absorbance read at 595 nm in a microplate reader (BMG LABTACH Fluostar Omega, Saitama, Japan).
Calibration curves of the Bradford method with different concentrations of substrates were carried out.
Eosin is a red anionic acid dye [27]. Dyes have been shown to interact with surfactants, such as lipoaminoacids (LAAs), through electrostatic and hydrophobic interactions. Once eosin binds to proteins, it becomes pink [27].
For this method, an eosin 5% solution was diluted into a 0.01% solution, and a 2.5 mg/mL solution of LAA was prepared. Various dilutions of the LAA solution were made with the following concentrations: 0.1, 0.3, 0.4, 0.5, 0.6, 0.7, 0.8, 0.9, 1.0, and 1.2 mg/mL.
500 μL of each dilution were transferred into 10 different Eppendorf’s, and 300 μL of Eosin 0.01% were added to each tube. The absorbance values were then determined at 538 nm on the UV Spectrophotometer with double beams and at 570 nm on the Microplate spectrophotometer. This method allowed the making of a calibration curve, Figure 5, used for LAA quantification.
The HPLC analyses were performed on a Waters Alliance 2695 (Waters®, Drinagh, Ireland) equipped with a quaternary pump, solvent degasser, autosampler, and column oven, coupled to a Photodiode Array Detector Waters 996 PDA (Waters®, Ireland), according to the reference [1].
MicroMass Quatromicro® API (Waters®, Ireland), triple quadrupole type, a tandem mass spectrometer (MS/MS) was used. Compound ionization was performed by an electrospray source in positive mode (ESI+).
For the sample preparation from the solid-state reaction samples, 1 mg of the reaction was weighed, and 1 mL of acetonitrile, for a final concentration of 1 mg/mL, was added.
The separation was performed on a normal-phase column (Luna HILIC 1000 × 3.00 mm) using an injection volume of 10 μL at 35 °C. The mobile phase consisted of Milli-Q water containing 0.5% formic acid (A): Acetonitrile (B): at a flow rate of 0.30 mL/min. The eluting conditions applied were the following: initial time (0 min) A 5.0%, B 95%; (5 min) A 100.0%, B 0%; (7 min) A 100.0%, B 0%; (10 min) A 5.0%, B 95%; and (15 min) A 5.0%, B 95%.
The Photodiode Array Detector Waters 996 PDA (Waters®, Ireland) was used to scan wavelength absorption from 210 to 600 nm.
MS/MS experiments were performed on Micromass® Quattro Micro triple quadrupole (Waters®, Ireland) with an electrospray in positive ion mode (ESI+), with the ion source at 120 °C, a desolvation temperature of 350 °C, capillary voltage of 3.50 kV, and the source voltage of 60 V. The compounds were ionized, and spectra of the column eluate were recorded in the full scan mode m/z 60–2000 and SIR m/z 575, 241, 186. To maximize the signal of the precursor ion ([M-H]+), the analytical conditions were optimized. To determine characteristic fragments to be used in MRM mode, in the MS/MS experiments, different collision energies (eV) were applied.
High-purity nitrogen (N2) was used as a drying and nebulizing gas, while ultrahigh-purity Argon (Ar) was used as a collision gas. The samples were initially analyzed in full scan mode m/z 60–2000 with ESI+, and SIR m/z 575, 241, 186. Two different collision energies (20 eV and 30 eV) were used to promote and determine characteristic fragmentation patterns of the compounds.

3.5. Software

Data processing and graphic construction were conducted in either Microsoft Office™ Excel® 2010 or GraphPad Prism version 5.03 for Windows®, GraphPad Software, San Diego, CA, USA, www.graphpad.com, accessed on 23 April 2024.
For the acquisition and processing of HPLC-MS/MS data, MassLynx® version 4.1 was used.

3.6. Magnetized Sol-Gel Lenses for Enzyme Encapsulation

Sol-gel is a porous matrix, is optically transparent, and can be used successfully for the immobilization of biological compounds, such as enzymes [24,48].
This method was used to immobilize Porcine Pancreas Lipase (PPL), papain, and both (PPL and papain) (Mix). A sol-gel solution was prepared, containing 96 mg of 98% glycerol, 70 μL of distilled water, 15 μL of 80 mM HCl, and 300 μL of tetramethyl orthosilicate (TMOS), all added in this order, and sonicated for 20 min at from 0 °C to 4 °C [47]. We prepared 10 mM Tris buffer at pH 8 using tris-(hydroxymethyl) aminomethane to dilute the PPL and the papain in two individual solutions of 2.5 mg/mL.
Three different types of lenses were made: PPL lenses, papain lenses, and Mix lenses. In the first two, 25 μL of the sol solution and 25 μL of the enzyme solution were added to different wells of a microplate. For the last type of lenses, 25 μL of each enzyme solution and 50 μL of sol solution were added to each well. The sol-gel was left at air temperature to aging.
To obtain magnetized lenses, the same protocol was followed, with the addition of 10 mg of iron to the sol solution for each enzyme, allowing for the preparation of PPL_iron lenses, Pap_iron lenses, and Mix_iron lenses. The main goal of using magnetized lenses was to improve the separation of the biocatalyst from the medium. The lenses were easily separated from the reaction media by an external magnetic field.

3.7. Biosynthesis of LAAs

3.7.1. Synthesis in Tris Buffer 10 mM, pH 9

For the biosynthesis of the LAA, a condensation reaction between Dodecylamine (Dda) and Cystine (Cys2) was carried out, using PPL as a biocatalyst, forming (C12Cys)2(B). For this reaction, 0.45 mg/mL of Cys2 solution and 0.5 mg/mL of Dda solution were prepared in 10 mM Tris buffer at pH 9, which was obtained by adding sodium acetate to the previously prepared 10 mM Tris buffer at pH 8. 2.5 mL of the Cys2 solution and 2.5 mL of the Dda solution were added to a Falcon, along with 0.1344 g of immobilized PPL in sol-gel lenses. The solution was left for 3 days in the Incubating Mini Shaker at 45 °C and 200 rpm. To quantify the LAA and protein present in the final solution, the samples were measured on the Microplate Spectrophotometer before and after the reaction took place, using, respectively, the eosin and the Bradford methods.
Similarly, the same reaction was carried out with papain (Papain-LAA), instead of PPL, and with a mixture of PPL and papain (Mix-LAA).

3.7.2. Solvent-Free Systems

The solvent-free reactions were carried out at 45 °C. At this temperature, the substrate, dodecylamine, is liquid, with a melting point of 27–29 °C. So, 1 g of dodecylamine was weighed into each reaction tube and all were stabilized at 45 °C, to complete melting of the dodecylamine. Then, 300 mg of cystine was added to each tube, along with 1 mL of the eutectic mixture Dowtherm®A and 134.04 mg of PPL sol-lenses. The tubes were left at 45 °C and 200 rpm for 96 h, after which the solid product was left to dry. The same procedure was carried out with papain (Papain-LAA), instead of PPL, a mixture of PPL and papain (Mix-LAA), a mixture of PPL and iron ((C12Cys)2(B)_iron), a mixture of papain and iron (Papain_iron-LAA), and finally, a mixture of PPL, papain, and iron (Mix_iron-LAA).

3.8. Nucleic Acid Assays

The nucleic acid, RNA and DNA, assays were carried out with different surfactants to assess multiple aspects, such as nucleic acid and surfactant interactions at varying nucleic acid concentrations, at varying surfactant concentrations and their effects on absorbance at 260 nm, on the sample’s viscosity, and finally, fluorescent behavior when EtBr intercalates the nucleic acids. The surfactants used were a commercial dodecyltrimethylammonium bromide (DTAB), (C12Cys)2, obtained through chemical synthesis [33], (C12Cys)2(Q), and the 6 biosynthesized LAAs: (C12Cys)2(B), Papain-LAA, Mix-LAA, (C12Cys)2(B)_iron, Papain-iron-LAA, and Mix-iron-LAA. For the DNA assays, only DTAB was used as a surfactant.

3.8.1. Conductivity Measurements

For CMC determination, 100 mL of DTAB stock solution was prepared with a concentration of 0.1 mol/L. From the stock solution, various dilutions were made with the following concentrations: 100, 80, 60, 40, 20, 10, 8, 6, 4, 2, 1, and 0.0 mM. The conductivity of these samples was then measured using the multiparameter tester. The CMC values of (C12Cys)2(Q) and (C12Cys)2(B) were evaluated in the previous work [1].

3.8.2. Absorbance Assays at 260 nm

For the absorbance assays at 260 nm, stock solutions of DNA and RNA were prepared at 0.1 mg/mL; the previously prepared DTAB stock solution was used, and 100 mL of stock solutions for the other surfactants were made: the concentration for (C12Cys)2(Q) was 0.1 M and, for the remaining six synthesized LAAs, a concentration of 0.012 M was used. For DTAB and (C12Cys)2(Q), 11 samples were prepared with a constant RNA concentration of 10 μg/mL and with varying LAA concentrations, which were 80, 60, 40, 20, 10, 8, 6, 4, 2, 1, and 0.0 mM. Eleven extra samples, with the same DTAB concentrations, were also prepared with a constant DNA concentration of 10 μg/mL. For the synthesized LAA, 11 samples were also prepared with a constant RNA concentration of 10 μg/mL and with varying LAA concentrations, which were 10, 9, 7, 5, 4, 3, 2, 1, 0.8, 0.6, and 0 mM. The absorbance of these samples was measured at 260 nm. Distilled water was used as a blank.

3.8.3. Viscosity Assays

The same samples from the absorbance assays at 260 nm were used for the viscosity assays and were measured using an Ostwald viscometer.

Pre-CMC and Post-CMC Assays

For pre-CMC and post-CMC RNA assays, the samples used had constant LAA concentrations, below and above the CMC, respectively, and varying nucleic acid concentrations. The concentration of DTAB and (C12Cys)2(Q) for pre-CMC and post-CMC assays was 10−3 M and 2.5 × 10⁻² M, respectively. For the remaining synthesized LAAs, the pre-CMC and the post-CMC concentrations were 6 × 10⁻⁴ M and 4.5 × 10⁻³ M, respectively. The varying nucleic acid concentrations used were 7.5 × 10⁻², 5 × 10⁻², 2.5 × 10⁻², 10−2, 7.5 × 10⁻³, 5 × 10⁻³, 2.5 × 10⁻³, 2.5 × 10⁻³, 10−3, 5 × 10⁻⁴, and 0.0 mg/mL. Aside from the samples previously mentioned, an RNA and a DNA sample with a concentration of 10−4 M and no LAAs were also prepared. The absorbance of these solutions was measured at 260 nm.

Ethidium Bromide Exclusion Assay

To conclude, for the fluorescence assays, the FLUOstar Omega microplate reader was used with an excitatory wavelength of 485 nm and an emission wavelength of 590 nm. The surfactant and nucleic acid stock samples used were the same as previously described. Along with those, 10 mL of ethidium bromide (EtBr) stock solution with a concentration of 0.0002 mol/L was prepared. Twelve samples, where the surfactant was only added 30 min after the RNA/DNA and EtBr, were prepared according to a constant RNA/DNA concentration of 10 μg/mL, a constant EtBr concentration of 2 × 10⁻⁵ M, and varying LAA concentrations. For DTAB and (C12Cys)2(Q), the concentrations used were 0.08, 0.06, 0.04, 0.02, 0.01, 0.008, 0.006, 0.004, 0.002, 0.001, and 0.0 M. For the remaining synthesized LAAs, the concentrations used were 0.01, 0.009, 0.007, 0.005, 0.004, 0.003, 0.002, 0.001, 0.0008, 0.0006, and 0.0 M. An extra sample with only 10 μg/mL RNA was also prepared. The absorbance of these samples was then measured using a black microplate.

4. Conclusions

The main innovative points of this work are (i) exploration of a novel non-viral vector: This study developed a new type of non-viral vector based on Lipoaminoacids (LAAs), biosynthesized using the biocatalysts, porcine pancreatic lipase (PPL) and papain + PPL. These LAAs can form lipoplexes with genetic material, offering a new potential vector tool for gene therapy. (ii) Environmental friendliness and cost-effectiveness: Compared to traditional chemical synthesis methods, the biosynthesis approach adopted in this study is characterized by low cost and environmental friendliness. In fact, this method not only reduces the environmental impact but also has the potential to lower production costs, making the large-scale production and application of non-viral vectors for gene therapy more feasible. (iii) Enhancement of gene and drug delivery efficiency: Through a systematic experimental study, including measurements of conductivity, absorbance at 260 nm, viscosity tests, and ethidium bromide fluorescence displacement assays, this research confirmed that the biosynthesized LAAs can effectively interact with nucleic acids (RNA and DNA) and form complexes. These results suggest that the new vectors shown a potential high efficiency in gene and drug delivery.

Supplementary Materials

The following supporting information can be downloaded at: https://www.mdpi.com/article/10.3390/catal14120877/s1. MS scans (A) and Daughter scans (B) of the gemini cystine derived lipoaminoacid.

Author Contributions

Conceptualization, S.F.A., C.M.F. and M.H.L.R.; methodology, S.F.A., C.M.F. and M.H.L.R.; software, S.F.A., C.M.F. and M.H.L.R.; validation, S.F.A.; formal analysis, S.F.A., C.M.F. and M.H.L.R.; investigation, S.F.A.; resources, C.M.F. and M.H.L.R.; data curation, S.F.A., C.M.F. and M.H.L.R.; writing—original draft preparation, S.F.A.; writing—review and editing, S.F.A., C.M.F. and M.H.L.R.; visualization, C.M.F. and M.H.L.R.; supervision, C.M.F. and M.H.L.R.; project administration, M.H.L.R.; funding acquisition, M.H.L.R. All authors have read and agreed to the published version of the manuscript.

Funding

The authors are grateful to the FCT—Foundation for Science and Technology, I.P., by national funds, under the project UID/DTP/04138/2021 and to the FCT for funding the project REDE/1518/REM/2005.

Data Availability Statement

Data are contained within the article and Supplementary Materials.

Conflicts of Interest

The authors declare no conflicts of interest.

References

  1. Rodrigues, L.; Banat, I.M.; Teixeira, J.; Oliveira, R. Biosurfactants: Potential applications in medicine. J. Antimicrob. Chemother. 2006, 57, 609–618. [Google Scholar] [CrossRef] [PubMed]
  2. Faustino, C.; Martins, T.; Duarte, N.; Ribeiro, M.H. Self-Assembly of Lipoaminoacids-DNA Based on Thermodynamic and Aggregation Properties. J. Surfactants Deterg. 2020, 23, 581–593. [Google Scholar] [CrossRef]
  3. Yokouchi, Y.; Suzuki, S.; Ohtsuki, N.; Yamamoto, K.; Noguchi, S.; Soejima, Y.; Goto, M.; Ishioka, K.; Nakamura, I.; Suzuki, S.; et al. Rapid repair of human disease-specific single-nucleotide variants by One-SHOT genome editing. Sci. Rep. 2020, 10, 13927. [Google Scholar] [CrossRef]
  4. Scheller, E.L.; Krebsbach, P.H. Gene Therapy. J. Dent. Res. 2009, 88, 585–596. [Google Scholar] [CrossRef]
  5. Ramamoorth, M.; Narvekar, A. Non Viral Vectors in Gene Therapy—An Overview. J. Clin. Diagn. Res. JCDR 2015, 9, GE01–GE06. [Google Scholar] [CrossRef] [PubMed]
  6. Escoffre, J.M.; Teissié, J.; Rols, M.P. Gene Transfer: How Can the Biological Barriers Be Overcome? J. Membr. Biol. 2010, 236, 61–74. [Google Scholar] [CrossRef] [PubMed]
  7. Wettig, S.D.; Verrall, R.E.; Foldvari, M. Gemini surfactants: A new family of building blocks for non-viral gene delivery systems. Curr. Gene Ther. 2008, 8, 9–23. [Google Scholar] [CrossRef]
  8. Friedmann, T. Overcoming the Obstacles to Gene Therapy. Sci. Am. 1997, 276, 96–101. [Google Scholar] [CrossRef]
  9. Anson, D.S. The use of retroviral vectors for gene therapy-what are the risks? A review of retroviral pathogenesis and its relevance to retroviral vector-mediated gene delivery. Genet. Vaccines Ther. 2004, 2, 9. [Google Scholar] [CrossRef]
  10. Yin, H.; Kanasty, R.; Eltoukhy, A.; Vegas, A.J.; Dorkin, J.R.; Anderson, D.G. Non-viral vectors for gene-based therapy. Nat. Rev. Genet. 2014, 15, 541–555. [Google Scholar] [CrossRef]
  11. Niidome, T.; Huang, L. Gene Therapy Progress and Prospects: Nonviral vectors. Gene Ther. 2002, 9, 1647–1652. [Google Scholar] [CrossRef] [PubMed]
  12. Ribeiro, M.; Carvalho, P.; Martins, T.; Faustino, C. Lipoaminoacids Enzyme-Based Production and Application as Gene Delivery Vectors. Catalysts 2019, 9, 977. [Google Scholar] [CrossRef]
  13. Wu, P.; Chen, H.; Jin, R.; Weng, T.; Ho, J.K.; You, C.; Zhang, L.; Wang, X.; Han, C. Non-viral gene delivery systems for tissue repair and regeneration. J. Transl. Med. 2018, 16, 29. [Google Scholar] [CrossRef] [PubMed]
  14. Morán, M.C.; Pinazo, A.; Pérez, L.; Clapés, P.; Angelet, M.; García, M.T.; Vinardell, M.P.; Infante, M.R. “Green” amino acid-based surfactants. Green Chem. 2004, 6, 233–240. [Google Scholar] [CrossRef]
  15. Gonçalves, R.A.; Holmberg, K.; Lindman, B. Cationic surfactants: A review. J. Mol. Liq. 2023, 375, 121335. [Google Scholar] [CrossRef]
  16. Dias, R.S.; Magno, L.M.; Valente, A.J.M.; Das, D.; Das, P.K.; Maiti, S.; Miguel, M.G.; Lindman, B. Interaction between DNA and Cationic Surfactants: Effect of DNA Conformation and Surfactant Headgroup. J. Phys. Chem. B 2008, 112, 14446–14452. [Google Scholar] [CrossRef]
  17. Liu, Q.; Li, J.; Tao, W.; Zhu, Y.; Yao, S. Comparative study on the interaction of DNA with three different kinds of surfactants and the formation of multilayer films. Bioelectrochemistry 2007, 70, 301–307. [Google Scholar] [CrossRef]
  18. Peetla, C.; Labhasetwar, V. Effect of Molecular Structure of Cationic Surfactants on Biophysical Interactions of Surfactant-Modified Nanoparticles with a Model Membrane and Cellular Uptake. Langmuir 2009, 25, 2369–2377. [Google Scholar] [CrossRef]
  19. Rajput, S.M.; Kumar, S.; Aswal, V.K.; El Seoud, O.A.; Malek, N.I.; Kailasa, S.K. Drug-Induced Micelle-to-Vesicle Transition of a Cationic Gemini Surfactant: Potential Applications in Drug Delivery. ChemPhysChem 2018, 19, 865–872. [Google Scholar] [CrossRef]
  20. Branco, M.A.; Pinheiro, L.; Faustino, C. Amino acid-based cationic gemini surfactant-protein interactions. Colloids Surf. A Physicochem. Eng. Asp. 2015, 480, 105–112. [Google Scholar] [CrossRef]
  21. Elsabahy, M.; Badea, I.; Verrall, R.; Donkuru, M.; Foldvari, M. Dicationic gemini nanoparticle design for gene therapy. In Organic Nanomaterials; Torres, T., Bottari, G., Eds.; Wiley Online Library: Hoboken, NJ, USA, 2013; Chapter 23. [Google Scholar]
  22. Yousefpour Marzbali, M.; Yari Khosroushahi, A. Polymeric micelles as mighty nanocarriers for cancer gene therapy: A review. Cancer Chemother. Pharmacol. 2017, 79, 637–649. [Google Scholar] [CrossRef] [PubMed]
  23. Sharma, R.; Kamal, A.; Abdinejad, M.; Mahajan, R.K.; Kraatz, H.-B. Advances in the synthesis, molecular architectures and potential applications of gemini surfactants. Adv. Colloid Interface Sci. 2017, 248, 35–68. [Google Scholar] [CrossRef] [PubMed]
  24. Mulinari, J.; Oliveira, J.V.; Hotza, D. Lipase immobilization on ceramic supports: An overview on techniques and materials. Biotechnol. Adv. 2020, 42, 107581. [Google Scholar] [CrossRef] [PubMed]
  25. Nickpour, M. Synthesis and Characteristics of Mesoporous Sol-gels for Lipase Immobilization. Int. J. Eng. 2014, 27, 1495–1502. [Google Scholar]
  26. Kandimalla, V.B.; Tripathi, V.S.; Ju, H. Immobilization of Biomolecules in Sol–Gels: Biological and Analytical Applications. Crit. Rev. Anal. Chem. 2006, 36, 73–106. [Google Scholar] [CrossRef]
  27. Copeland, R.A. Methods for Protein Quantitation. In Methods for Protein Analysis; Springer: Boston, MA, USA, 1994; pp. 39–58. [Google Scholar]
  28. Chan, J.K.C. The Wonderful Colors of the Hematoxylin–Eosin Stain in Diagnostic Surgical Pathology. Int. J. Surg. Pathol. 2014, 22, 12–32. [Google Scholar] [CrossRef]
  29. Nagaraj, K.; Senthil Murugan, K.; Thangamuniyandi, P.; Sakthinathan, S. Synthesis, Micellization Behaviour, DNA/RNA Binding and Biological Studies of a Surfactant Cobalt(III) Complex With Dipyrido[3,2-a:2′,4′-c](6,7,8,9-tetrahydro)phenazine. J. Fluoresc. 2014, 24, 1701–1714. [Google Scholar] [CrossRef]
  30. Ali, A.; Uzair, S.; Malik, N.A.; Ali, M. Study of interaction between cationic surfactants and cresol red dye by electrical conductivity and spectroscopy methods. J. Mol. Liq. 2014, 196, 395–403. [Google Scholar] [CrossRef]
  31. Nusselder, J.J.H.; Engberts, J.B.F.N. Toward a better understanding of the driving force for micelle formation and micellar growth. J. Colloid Interface Sci. 1992, 148, 353–361. [Google Scholar] [CrossRef]
  32. Bhadani, A.; Singh, S. Novel gemini pyridinium surfactants: Synthesis and study of their surface activity, DNA binding, and cytotoxicity. Langmuir 2009, 25, 11703–11712. [Google Scholar] [CrossRef]
  33. Durand-Vidal, S.; Bernard, O.; Medoš, Ž.; Bešter-Rogač, M. Theoretical interpretation of conductivity data below and above the CMC: The case of alkaline ion decanoate solutions. J. Mol. Liq. 2020, 309, 112968. [Google Scholar] [CrossRef]
  34. Faustino, C.M.C.; Calado, A.R.T.; Garcia-Rio, L. Gemini surfactant-protein interactions: Effect of pH, temperature, and surfactant stereochemistry. Biomacromolecules 2009, 10, 2508–2514. [Google Scholar] [CrossRef] [PubMed]
  35. Vila-Real, H.; Alfaia, A.J.; Rosa, M.E.; Calado, A.R.; Ribeiro, M.H.L. An innovative sol–gel naringinase bioencapsulation process for glycosides hydrolysis. Process Biochem. 2010, 45, 841–850. [Google Scholar] [CrossRef]
  36. Zana, R. Critical Micellization Concentration of Surfactants in Aqueous Solution and Free Energy of Micellization. Langmuir 1996, 12, 1208–1211. [Google Scholar] [CrossRef]
  37. Wang, Y.; Han, Y.; Huang, X.; Cao, M.; Wang, Y. Aggregation behaviors of a series of anionic sulfonate gemini surfactants and their corresponding monomeric surfactant. J. Colloid Interface Sci. 2008, 319, 534–541. [Google Scholar] [CrossRef]
  38. Wang, F.; Huang, W.; Wang, Y.; Tang, B. Determination of nucleic acid by its enhancement effect on the fluorescence of Ellagic acid–Cationic surfactant system. J. Mol. Struct. 2010, 967, 183–188. [Google Scholar] [CrossRef]
  39. Veeralakshmi, S.; Sabapathi, G.; Nehru, S.; Venuvanalingam, P.; Arunachalam, S. Surfactant–cobalt(III) complexes: The impact of hydrophobicity on interaction with HSA and DNA–insights from experimental and theoretical approach. Colloids Surf. B Biointerfaces 2017, 153, 85–94. [Google Scholar] [CrossRef]
  40. Vashishat, R.; Chabba, S.; Kumar Mahajan, R. Surface active ionic liquid induced conformational transition in aqueous medium of hemoglobin. RSC Adv. 2017, 7, 13041–13052. [Google Scholar] [CrossRef]
  41. Hayakawa, K.; Santerre, J.P.; Kwak, J.C.T. The binding of cationic surfactants by DNA. Biophys. Chem. 1983, 17, 175–181. [Google Scholar] [CrossRef]
  42. Wang, M.; Yang, J.; Wu, X.; Huang, F. Study of the interaction of nucleic acids with acridine red and CTMAB by a resonance light scattering technique and determination of nucleic acids at nanogram levels. Anal. Chim. Acta 2000, 422, 151–158. [Google Scholar] [CrossRef]
  43. Ciotta, E.; Prosposito, P.; Pizzoferrato, R. Positive curvature in Stern-Volmer plot described by a generalized model for static quenching. J. Lumin. 2019, 206, 518–522. [Google Scholar] [CrossRef]
  44. Nilsson, S.; Thuresson, K.; Hansson, P.; Lindman, B. Mixed Solutions of Surfactant and Hydrophobically Modified Polymer. Controlling Viscosity with Micellar Size. J. Phys. Chem. B 1998, 102, 7099–7105. [Google Scholar] [CrossRef]
  45. Kruger, N.J. The Bradford Method For Protein Quantitation. In The Protein Protocols Handbook. Springer Protocols Handbooks; Walker, J.M., Ed.; Humana Press: Totowa, NJ, USA, 2009. [Google Scholar]
  46. Georgiou, C.D.; Grintzalis, K.; Zervoudakis, G.; Papapostolou, I. Mechanism of Coomassie brilliant blue G-250 binding to proteins: A hydrophobic assay for nanogram quantities of proteins. Anal. Bioanal. Chem. 2008, 391, 391–403. [Google Scholar] [CrossRef] [PubMed]
  47. Gupta, R.; Chaudhury, N.K. Entrapment of biomolecules in sol–gel matrix for applications in biosensors: Problems and future prospects. Biosens. Bioelectron. 2007, 22, 2387–2399. [Google Scholar] [CrossRef] [PubMed]
  48. Erdinc, N.; Göktürk, S. Spectrophotometric and Conductometric Studies on the Interaction of Anionic Dye Eosin-Y with Cationic Micelles. Anal. Chem. Lett. 2014, 146–157. [Google Scholar] [CrossRef]
Figure 1. Conductivity (κ) profile of DTAB, in water, at 293 K.
Catalysts 14 00877 g001
Figure 2. Job plot showing absorbance (at 260 nm) variation with: the RNA molar fraction, for DTAB (a), the DNA molar fraction, for DTAB (b), and the RNA molar fraction, for (C12Cys)2(Q) (c).
Catalysts 14 00877 g002
Figure 3. Benesi–Hildebrand model applied to varying concentrations of LAA, in the presence of RNA; DTAB, ( C 12 C y s ) 2 ( Q ) , ( C 12 C y s ) 2 ( B ) , ( C 12 C y s ) 2 ( B ) _ i r o n , Pap-LAA, Pap_iron-LAA, Mix-LAA, and Mix_iron-LAA correspond to (a), (b), (c), (d), (e), (f), (g), and (h), respectively.
Catalysts 14 00877 g003
Figure 4. Benesi–Hildebrand model applied to varying concentrations of DTAB in the presence of DNA.
Catalysts 14 00877 g004
Figure 5. Benesi–Hildebrand model applied to varying concentrations of RNA and pre-CMC LAA concentration: DTAB, ( C 12 C y s ) 2 ( Q ) , ( C 12 C y s ) 2 ( B ) , ( C 12 C y s ) 2 ( B ) _ i r o n , Pap-LAA, Pap_iron-LAA, Mix-LAA, and Mix_iron-LAA correspond to (a), (b), (c), (d), (e), (f), (g), and (h), respectively.
Catalysts 14 00877 g005
Figure 6. Benesi–Hildebrand model applied to varying concentrations of RNA and post-CMC LAA concentration: DTAB, ( C 12 C y s ) 2 ( Q ) , ( C 12 C y s ) 2 ( B ) , ( C 12 C y s ) 2 ( B ) _ i r o n , Pap_iron-LAA, Mix-LAA, and Mix_iron-LAA correspond to (a), (b), (c), (d), (e), (f) and (g), respectively.
Catalysts 14 00877 g006
Figure 7. Benesi–Hildebrand model was applied to varying DNA concentrations and pre-CMC (a), and post-CMC (b), and DTAB.
Catalysts 14 00877 g007
Figure 8. Stern–Volmer model applied to samples with varying concentrations of LAAs and constant RNA and EtBr concentrations: DTAB, ( C 12 C y s ) 2 ( Q ) , ( C 12 C y s ) 2 ( B ) , ( C 12 C y s ) 2 ( B ) _ i r o n , Pap-LAA, Pap_iron-LAA, Mix-LAA, and Mix_iron-LAA correspond to (a), (b), (c), (d), (e), (f), (g), and (h), respectively.
Catalysts 14 00877 g008
Figure 9. Stern–Volmer model applied to samples with varying concentrations of DTAB and constant DNA and EtBr concentrations.
Catalysts 14 00877 g009
Figure 10. Viscosity assay in the presence of DNA, RNA and DTAB: pure DTAB (a), RNA with varying DTAB concentrations (b), varying RNA concentrations with a DTAB concentration pre- and post-CMC (c) and (d), respectively, DNA with varying DTAB concentrations (e), and varying DNA concentrations with a DTAB concentration pre- and post-CMC (f) and (g), respectively.
Catalysts 14 00877 g010
Figure 11. Viscosity assay in the presence of RNA and ( C 12 C y s ) 2 ( Q ) : RNA with varying ( C 12 C y s ) 2 ( Q ) concentrations (a) and varying RNA concentrations with a DTAB concentration pre- and post-CMC (b) and (c), respectively.
Catalysts 14 00877 g011
Figure 12. Viscosity assay in the presence of RNA and various synthetized LAA: RNA with varying ( C 12 C y s ) 2 ( B ) concentrations (a), RNA with varying ( C 12 C y s ) 2 ( B ) _ i r o n (b), RNA with varying Pap-LAA concentrations (c), RNA with varying Pap_iron-LAA concentrations (d), RNA with varying Mix-LAA concentrations (e), and RNA with varying Mix_iron-LAA concentrations (f).
Catalysts 14 00877 g012
Table 1. CMC, α, β, and Δ G m i c 0 for the studied surfactants, in water, at 293 K for DTAB and (C12Cys)2(B) and at 298K for (C12Cys)2(Q) [1].
Surfactant CMC (mol/L) α β Δ G m i c 0 (kJ/mol)
DTAB0.016000.350.65−16.6
( C 12 C y s ) 2 ( B ) 0.00250.630.37−27.7
( C 12 C y s ) 2 ( Q ) 0.008200.50.5−25.6
Disclaimer/Publisher’s Note: The statements, opinions and data contained in all publications are solely those of the individual author(s) and contributor(s) and not of MDPI and/or the editor(s). MDPI and/or the editor(s) disclaim responsibility for any injury to people or property resulting from any ideas, methods, instructions or products referred to in the content.

