Article

Mechanistic and Kinetic Analysis of Complete Methane Oxidation on a Practical PtPd/Al2O3 Catalyst

1
Oak Ridge National Laboratory, 2360 Cherahala Blvd., Knoxville, TN 37932, USA
2
Johnson Matthey Inc., 435 Devon Park Drive, Wayne, PA 19087, USA
3
CONSOL Energy Inc., 275 Technology Drive, Canonsburg, PA 15317, USA
*
Author to whom correspondence should be addressed.
Catalysts 2024, 14(12), 847; https://doi.org/10.3390/catal14120847
Submission received: 29 October 2024 / Revised: 20 November 2024 / Accepted: 21 November 2024 / Published: 23 November 2024

Abstract

:
A PtPd/Al2O3 catalyst developed for the complete oxidation of methane from the ventilation air of underground coal mines is compared against a model PdO/Al2O3 catalyst. Although the PtPd/Al2O3 catalyst is substantially more active and stable than the model catalyst, the nature of active sites between the two catalysts is deemed to be fundamentally the same based on their response to different feed gas compositions and the evolution of surface CO adsorption complexes during time-resolved CO adsorption DRIFTS experiment. For both catalysts, coordinatively unsaturated Pd sites are considered the active centers for methane activation and the subsequent oxidation reaction. H2O competes with CH4 for the same active sites, resulting in severe inhibition. Additionally, the CH4 oxidation reaction also causes self-inhibition. Taking both inhibition effects into consideration, a relatively simple kinetic model is developed. The model provides a good fit of the 72 sets of kinetic data collected on the PtPd/Al2O3 catalyst under practically relevant reaction conditions with CH4 concentration in the range of 0.05–0.4%, H2O concentration of 1.0–5.0%, and reaction temperatures of 450–700 °C. Kinetic parameters based on the model suggest that the CH4 activation energy on the PtPd/Al2O3 catalyst is 96.7 kJ/mol, and the H2O adsorption energy is −31.0 kJ/mol. Both values are consistent with the parameters reported in the literature. The model can be used to develop catalyst sizing guidelines and be incorporated into the control algorithm of the catalytic system.

Graphical Abstract

1. Introduction

Methane (CH4) is a significant greenhouse gas (GHG) that contributes 16% of global emissions, second only to CO2 [1]. About 60% of today’s CH4 emissions are directly caused by human activities, including agriculture, oil/gas industry, coal mining, and the decomposition of landfill waste [2]. Because the global warming potential of CH4 is 84 times greater than that of CO2 on a 20-year basis and 28 times on a 100-year basis, complete oxidation of CH4 to CO2 before it is emitted into the atmosphere can be an effective approach to achieve rapid and measurable effects in combating global warming [3]. Catalytic oxidation of CH4 offers many advantages compared with thermal oxidation [4,5,6,7,8]. With the relatively low operating temperature, typically below 600 °C, catalytic solutions do not generate secondary air pollutant emissions, such as nitrogen oxides [9]. More importantly, catalytic oxidation is effective over a much wider range of CH4 concentrations. It is uniquely suited for applications with CH4 concentrations below 0.4% since the energy generated from CH4 combustion is insufficient to maintain the high-temperature operation (above 900 °C) necessary for thermal oxidation [7,8]. Coincidently, the concentration for the majority of ventilation air methane (VAM) sources from underground coal mines is at this level or below [10]. Because of the large airflow, CH4 emissions from underground coal mines were estimated to be at 25 million tons globally in 2022 [11]. Preventing this amount of CH4 from entering the atmosphere can have a measurable impact on decreasing global warming constituents.
Activating and subsequently oxidizing CH4 into CO2, even with the assistance of catalysts, however, has been found to be challenging [5,6,7,12,13,14,15]. This is largely due to the strong C–H bonds (435 kJ/mol bond dissociation energy) and the symmetric configuration of the molecule. PdO/Al2O3-based catalysts are one of the most studied groups of catalysts for complete CH4 oxidation under lean conditions (i.e., in the presence of an excessive amount of O2 in the feed gas) [15,16,17]. The catalysts can initiate CH4 oxidation at about 300 °C. To achieve and maintain high CH4 conversion efficiency, however, the reaction temperature must remain above 550 °C [12]. This is partially to minimize H2O inhibition effects as H2O is inevitable in the process, either as a byproduct or as a constituent in the feed gas. Yet, gradual and irreversible catalyst deactivation is still noticeable for Pd-only catalysts even at this high temperature [5,18,19,20]. The addition of Pt into PdO/Al2O3 has been reported to enhance the on-stream stability of the catalyst [12].
In a project that is funded by the US Department of Energy, Advanced Research Projects Agency-Energy, a PtPd/Al2O3 catalyst was developed for underground coal mine VAM abatement [21]. Under simulated laboratory conditions, it achieved and maintained above 99.5% CH4 conversion efficiency for 1000 h, as shown in Figure 1. To support field evaluation of this catalyst for catalyst sizing and developing a control algorithm, a detailed kinetic study was performed on this catalyst.
Many kinetic models with mechanistic analysis have been reported for CH4 oxidation on Pd-based catalysts. In an early study, using an empirical power rate law approach, Ribeiro et al. reported the CH4 oxidation rate to follow [22]:
r = k CH 4 1 O 2 0 H 2 O 1
The first order to [CH4] suggests that CH4 activation is a rate-limiting step; the zero order to [O2] indicates that the PdO surfaces are in oxidized form; and the −1 order to [H2O] implies a strong H2O inhibition effect from strong H2O adsorption on the catalyst surface. Consistent with the kinetic expression, Fujimoto et al. proposed that the reaction followed a Mars-van Krevelen (MVK) reaction mechanism and that the rate-determining step was the dissociative chemisorption of CH4 on a pair of Pd sites that consist of a Pd with a surface oxygen vacancy site and an adjacent surface (Pd=O) site. They suggested that once a CH4 molecule was activated, the following oxidation steps would be fast and result in two surface -OH groups on the Pd sites. At low temperatures, such surface -OH groups could become dominant and severely inhibit CH4 oxidation [23].
By considering H2O as a competitive adsorbent for the same active sites where CH4 activation occurred, many research groups found that their CH4 oxidation kinetic data could be described by kinetic expressions based on MVK mechanisms. Further considering the adsorbed H2O as the most abundant surface intermediate, a simplified kinetic equation was proposed [24,25,26,27,28,29]:
r = k r C H 4 1 + k H 2 O H 2 O
where k r is a rate constant, and k H 2 O is the adsorption equilibrium constant for H2O, capturing its inhibition effect. At low temperatures when kH2O*[H2O] >> 1, this rate expression could be further simplified to Equation (1). On the other hand, at high temperature when kH2O*[H2O] << 1, the expression could be written as
r = k r * [ CH 4 ]
which would be zero order to [H2O]. Such a temperature dependence of the reaction kinetic expression to H2O is in agreement with what was reported by Zhu et al. [24], who discovered that the reaction order to [H2O] could vary from −1 to 0 when the reaction temperature was increased from 325 to 700 °C.
Several more general kinetic expressions based on MVK mechanisms have been reported [30,31,32,33]. Depending on the assumption of which elementary reaction step the adsorbed H2O affects the most, the rate expression can be further expanded into more specific forms [31,32,33]. Hurtado et al. evaluated a variety of kinetic models, including ones derived from Langmuir–Hinshelwood or Eley–Rideal reaction mechanisms, and they found the following simplified MVK-based rate expression fitted their experimental data the best [33]:
r = k a C H 4 O 2 k b O 2 + k c H 2 O O 2 + k d C H 4 + k e C H 4 O 2
where ka to ke are compounded constants that can be derived from the associated elementary reaction steps.
With advances in computational power, an increasing number of microkinetic models derived from first-principles density functional theory (DFT) calculations have also emerged for CH4 oxidation [34,35,36]. These approaches even allow for the specification of reactivity based on a given facet of PdO single-crystal catalysts; however, such an approach is not practical for supported PdO catalysts. Instead, Keller et al. found a global kinetic rate equation is more effective in describing the experiment data of supported PdO catalysts [37]. They suggested a rate equation that takes into account the H2O inhibition effects and their dependence on temperature, as well as the temperature dependence of the CH4 oxidation rate:
r = A a e E a R T C H 4 I
I = 1 + A b e E b R T H 2 O β
where Ea is the activation energy for CH4 oxidation; Eb is attributed to H2O adsorption enthalpy on the catalyst, and Aa and Ab are the corresponding pre-exponential factors. β’ is a variable parameter that is needed to fit their experimental data to the equations for different supports, although the physical meaning is not clear. It is worth noting that when β’ = 1, Equations (5) and (6) can be consolidated into Equation (2).
Accurate kinetic analysis and modeling require the investigated catalysts to be in a steady state. However, several groups noted gradual catalyst deactivation during the kinetic data measurement [29,30,31]. In a recent study, Chen et al. developed a series of protocols to systematically study CH4 oxidation on model PdO/Al2O3 catalysts [19]. They demonstrated that, in addition to H2O inhibition, methane oxidation also resulted in catalyst deactivation. They theorized that under CH4 oxidation reaction conditions, PdO nanoparticles could undergo surface reconstruction such that coordinatively unsaturated surface Pd sites (PdCUS) became fully oxidized. Consistent with what has been proposed by several other research groups, Chen et al. considered PdCUS sites to be the active centers where CH4 activation took place and directly linked the catalyst deactivation to the loss of surface PdCUS sites [20]. They viewed the CH4 oxidation reaction-induced PdO surface reconstruction as the formation of a passivation layer and found that such a passivation layer was not completely inert; a portion of the deactivated sites could regain their reactivity under reaction conditions.
In this contribution, we will first compare the newly developed PtPd/Al2O3 catalyst to a model PdO/Al2O3 to gain insights into why the PtPd catalyst exhibits much-improved stability for CH4 oxidation. We will then use the mechanistic understanding to guide the development of a kinetic model that accurately describes the experimental kinetic data collected on the PtPd catalyst under realistic reaction conditions with a temperature range of 450–700 °C, CH4 concentrations varying from 0.05 to 0.4%, and inlet H2O concentrations varying from 0 to 5%.

2. Results and Discussion

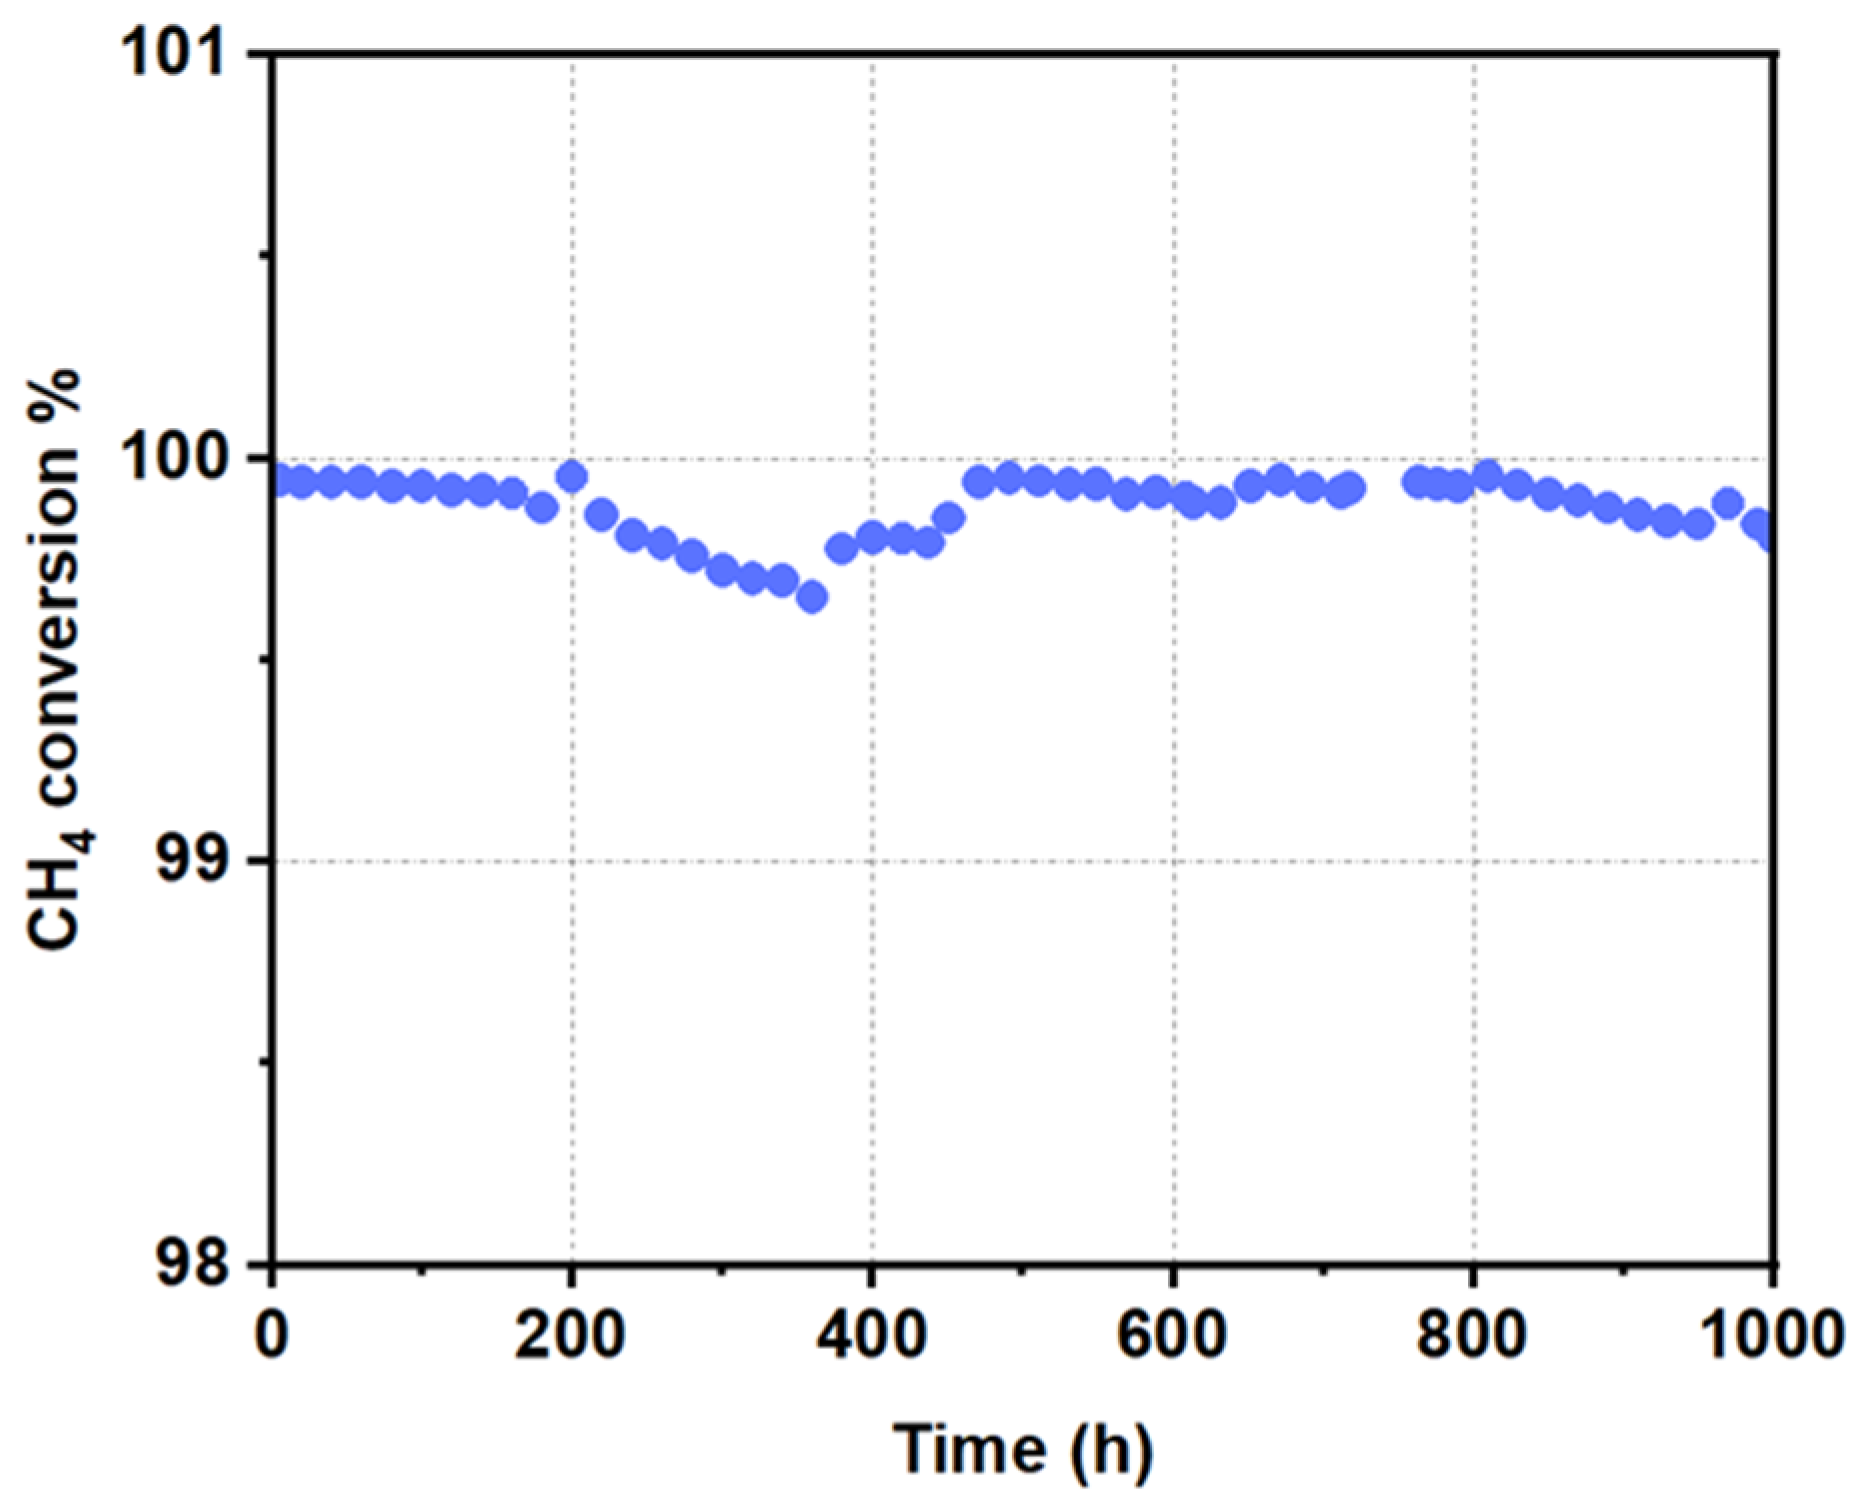
2.1. Assessment of Catalyst Stability Under CH4 Oxidation Conditions

The newly developed PtPd/Al2O3 catalyst maintained >99.5% CH4 conversion for more than 1000 h, as demonstrated in Figure 1. At such a high conversion efficiency, it is difficult to truly assess the stability of the catalyst. Also, the high reaction temperature (with an outlet temperature at 600 °C) may disguise the deactivation trend as Pd-based CH4 oxidation catalysts tend to exhibit more stable performance at temperatures above 550 °C. To fully assess the stability, the on-stream stability for CH4 oxidation at 450 °C of the PtPd/Al2O3 catalyst is compared with that of a model Pd/Al2O3 catalyst (see Figure 2).
For reference purposes, CH4 oxidation on the bare Al2O3 support is also evaluated and is shown in the figure. As expected, the Al2O3 support is totally inert for CH4 oxidation. This eliminates potential concerns about the use of the bare support as a diluent for the PtPd/Al2O3 catalyst in the kinetic data measurements. The initial activity of the PtPd/Al2O3 catalyst is noticeably higher than that of the model catalyst, reaching near 100% CH4 conversion even at 450 °C. In contrast, the Pd/Al2O3 catalyst only achieves 89%. A more dramatic difference between the two catalysts is their on-stream stability. The model’s Pd/Al2O3 catalyst quickly loses its activity in the first 200 min and then gradually deteriorates during the rest of the test. Although a gradual degradation is observable on the PtPd/Al2O3 catalyst during the evaluation, the deactivation trend is much slower. At the end of the test, the PtPd/Al2O3 catalyst still achieves nearly 80% CH4 conversion compared with less than 15% on the Pd/Al2O3 catalyst.

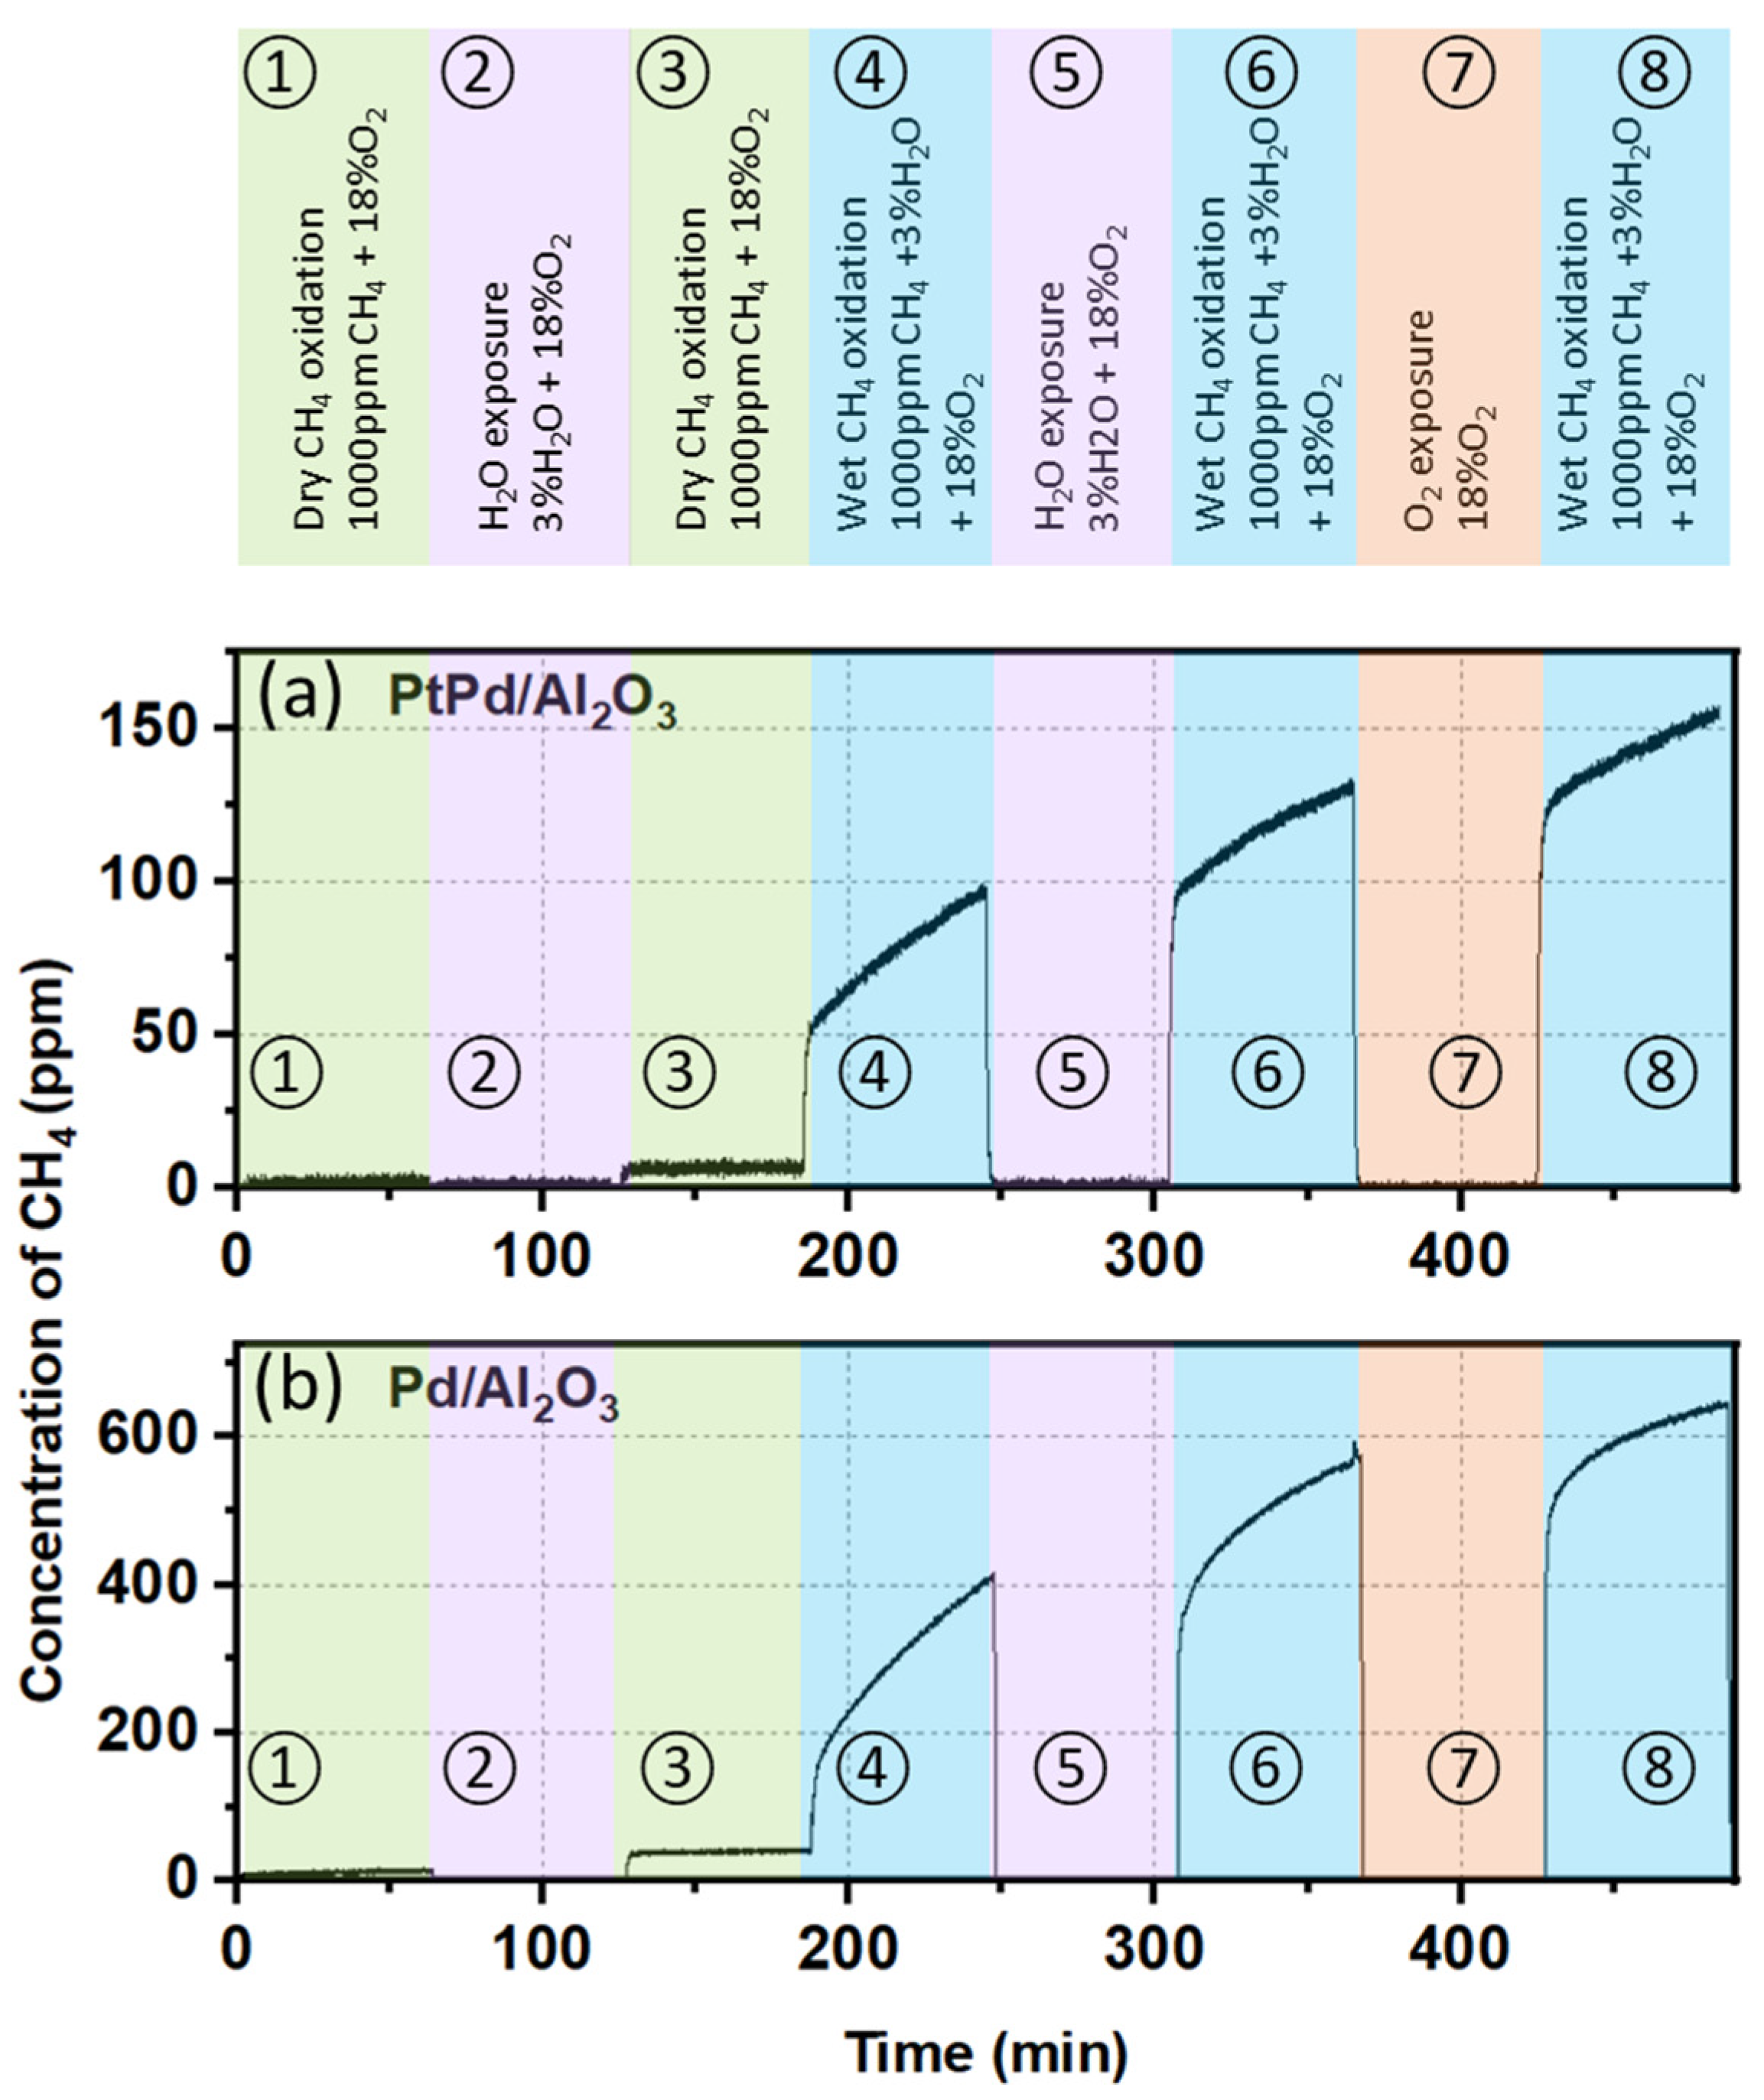
2.2. Mechanistic Analysis of the Reactivity and Stability of the PtPd/Al2O3 Catalyst

Such a drastic improvement in CH4 oxidation activity and on-stream stability of the PtPd/Al2O3 catalyst leads to a question of whether the active sites on the PtPd/Al2O3 catalyst are fundamentally different from those of the model Pd/Al2O3 catalyst. The same testing protocols developed by Chen et al. were adopted here to compare the reactivity and the deactivation modes of the two catalysts [19]. Figure 3a plots the outlet CH4 concentration profile for the PtPd/Al2O3 catalyst, and Figure 3b replots the data for the Pd/Al2O3 that has been reported by Chen et al. [19].
The testing protocol first assesses the stability of the catalyst under dry CH4 oxidation conditions (Step 1 in Figure 3). With a dry feed, both catalysts show very high activity, although the PtPd/Al2O3 is noticeably more active (note the scales are different from Figure 3a,b). The CH4 breakthrough level at the end of this period (time = 60 min) is about 4 ppm on the PtPd/Al2O3 catalyst compared to 14 ppm on the Pd/Al2O3 sample. It is not obvious because of the high conversion efficiency, but both catalysts show a gradual deactivation trend under dry CH4 oxidation conditions, which can be attributed to CH4 oxidation reaction-induced surface reconstruction [20].
The test protocol subsequently exposes the catalyst to 3% H2O for 60 min to build up hydroxy groups on the catalysts (Step 2 in Figure 3); then, the activity for dry CH4 oxidation is re-evaluated (Step 3 in Figure 3). Both catalysts show a step increase in CH4 breakthrough level, confirming that surface hydroxy groups on both catalysts inhibit the CH4 oxidation activity. The CH4 breakthrough level after 5 min into the second dry CH4 oxidation (Step 3 at ~132 min) increases to 6 ppm on the PtPd/Al2O3 catalysts, but it reaches 38 ppm on the Pd/Al2O3 catalyst.
Subsequently, 3% H2O is added to the feed to probe the activity of the catalysts under wet CH4 oxidation conditions (Step 4 in Figure 3). A sharp increase in CH4 breakthrough level immediately occurs after H2O addition, providing strong evidence that H2O competes with CH4 for the same active sites, and severely inhibits the oxidation activity. These measurements continue to show that the PtPd/Al2O3 catalyst is substantially more active than the Pd/Al2O3 catalyst; the CH4 breakthrough level is about 50 ppm over the PtPd/Al2O3 catalyst after 5 min into wet CH4 oxidation (at ~192 min) but reaches 185 ppm over the Pd/Al2O3 catalyst; however, the general trends are qualitatively consistent. For both catalysts, the presence of 3% H2O leads to steady performance degradation in the next 60 min test, and it is more pronounced compared to the dry feed. The CH4 breakthrough level increases to 96 ppm at the end of this period (~244 min) for the PtPd/Al2O3 catalyst but rises to 412 ppm for the Pd/Al2O3 catalyst.
Steps 5–8 of the protocol evaluate if the performance degradation is reversible by removing CH4 from the feed or by purging the catalyst with 18% O2 (with or without 3% H2O). Although the PtPd/Al2O3 catalyst consistently shows higher CH4 oxidation activity than the Pd/Al2O3 catalyst, neither catalyst shows appreciable recovery after either treatment. Additionally, both catalysts show continuous deactivation in the subsequent wet CH4 oxidation tests. These results strongly indicate that the nature of the active sites of the two catalysts is fundamentally similar, although the population of active sites is higher and perhaps more stable for the PtPd/Al2O3 catalyst.
In their most recent study, Chen et al. reported that for PdO/Al2O3 catalysts, samples with higher CH4 oxidation activity also exhibited higher CO reactivity during CO adsorption at 80 °C, as characterized by in situ DRIFTS [20]. Following the same approach, a time-resolved CO adsorption DRIFTS study was carried out to compare the nature of active sites and the associated activity between the PtPd/Al2O3 and the Pd/Al2O3 catalysts. Figure 4 compares the DRIFTS spectra in the region of 2200–1800 cm−1. The distinguishable IR bands and the corresponding assignment are summarized in Table 1.
Very similar features are observed on both catalysts (note that the scales are identical for both catalysts). IR bands centered around 2135 and 2100 cm−1 (with a shoulder at 2076 cm−1) appear immediately after 2 min of CO exposure. These two well-defined bands can be attributed to linear CO adsorption on PdCUS and isolated Pd0 sites on flat planes of PdO nanoparticles, respectively (see Table 1). The shoulder peak at 2076 cm−1 can be assigned to linear CO adsorption on Pd0 sites at the corners or edges of PdO nanoparticles (see Table 1). With the increase in CO exposure time, the intensity of the bands at 2135 and 2100 cm−1 gradually decreases, and correspondingly, another set of IR bands with a peak at 1976 cm−1 and a shoulder at 1934 cm−1 steadily become more intense. The two new IR bands are characteristics of CO adsorption on Pd0 sites on flat planes as double-bonded and triple-bonded complexes (see Table 1). On the PtPd/Al2O3 sample, an additional shoulder band centered around 2060 cm−1 becomes distinguishable and steadily rises in intensity with the increase in CO exposure time. This is likely due to CO adsorption on highly dispersed Pt0, either as single atoms or fine clusters (see Table 1).
Overall, the evolution of the IR bands on the two catalysts is similar. During CO adsorption, surfaces of PdO nanoparticles are gradually reduced to the metallic state, which leads to the formation of double- and triple-bounded CO adsorption complexes. The incorporation of Pt in the PtPd/Al2O3 catalyst does not change the fundamental properties of the PdO nanoparticles, as the IR bands associated with the various Pd sites appear at the same wave numbers and show similar dynamics. The relative intensities and the growth rates of the two IR bands at 1976 and 1934 cm−1 are noticeably greater for the PtPd/Al2O3 sample compared with the Pd/Al2O3 catalyst, suggesting a higher population of active sites on the PtPd/Al2O3 catalyst.

2.3. Kinetic Data Analysis

To collect the kinetic data under practically relevant reaction temperatures (450–700 °C) instead of extrapolating data from much lower-reaction temperatures, the PtPd/Al2O3 catalyst was diluted with the bare Al2O3 support at a weight ratio of 1:199. This kept the CH4 conversion efficiency below 20% for nearly all the data points, except those at 700 °C (reached~33%), during the kinetic data measurements. The significance of external and internal mass transfer is evaluated by estimating the Damkohler number (Da) [52,53] and the Weisz–Prater Criterion [54], respectively (see Supplementary Materials, Section S1). Both are determined to be negligible.

2.3.1. Kinetic Data Analysis by Power Law Expressions

The 96 sets of data generated according to the test matrix listed in the table in Section 3.4 are first fitted to global power law rate expressions:
r = k CH 4 α O 2 0 H 2 O β
As it has been widely accepted that the CH4 oxidation rate is zero order with respect to O2 concentration in O2-rich feeds and that the O2 level is kept at 18% in this study, we simply adopt the zero-order conclusion.
Figure S1 of Supplementary Materials Section S2 plots the reaction rates as a function of CH4 inlet concentrations both in natural logarithmic scales at given inlet H2O concentrations. The results reveal that the reaction order to [CH4] is about 0.82 ± 0.13, which is slightly below 1 as what is predicted by most kinetic models reported in the literature [18,22,23,24]. Figure S2 plots the reaction rates as a function of H2O concentrations in natural logarithmic scales at given inlet CH4 concentrations. On average, the reaction order to [H2O] is about −0.25 ± 0.05, which substantially deviates from −1 as most kinetic models predict [18,22,23,24]. A less negative reaction order to [H2O] indicates that the PtPd/Al2O3 is less susceptible to H2O inhibition. Also, higher reaction temperatures at which the kinetic data were collected may also lessen the H2O inhibition effects. In fact, there is a weak trend that the β value becomes less negative with the increase in temperature (see Table S2).

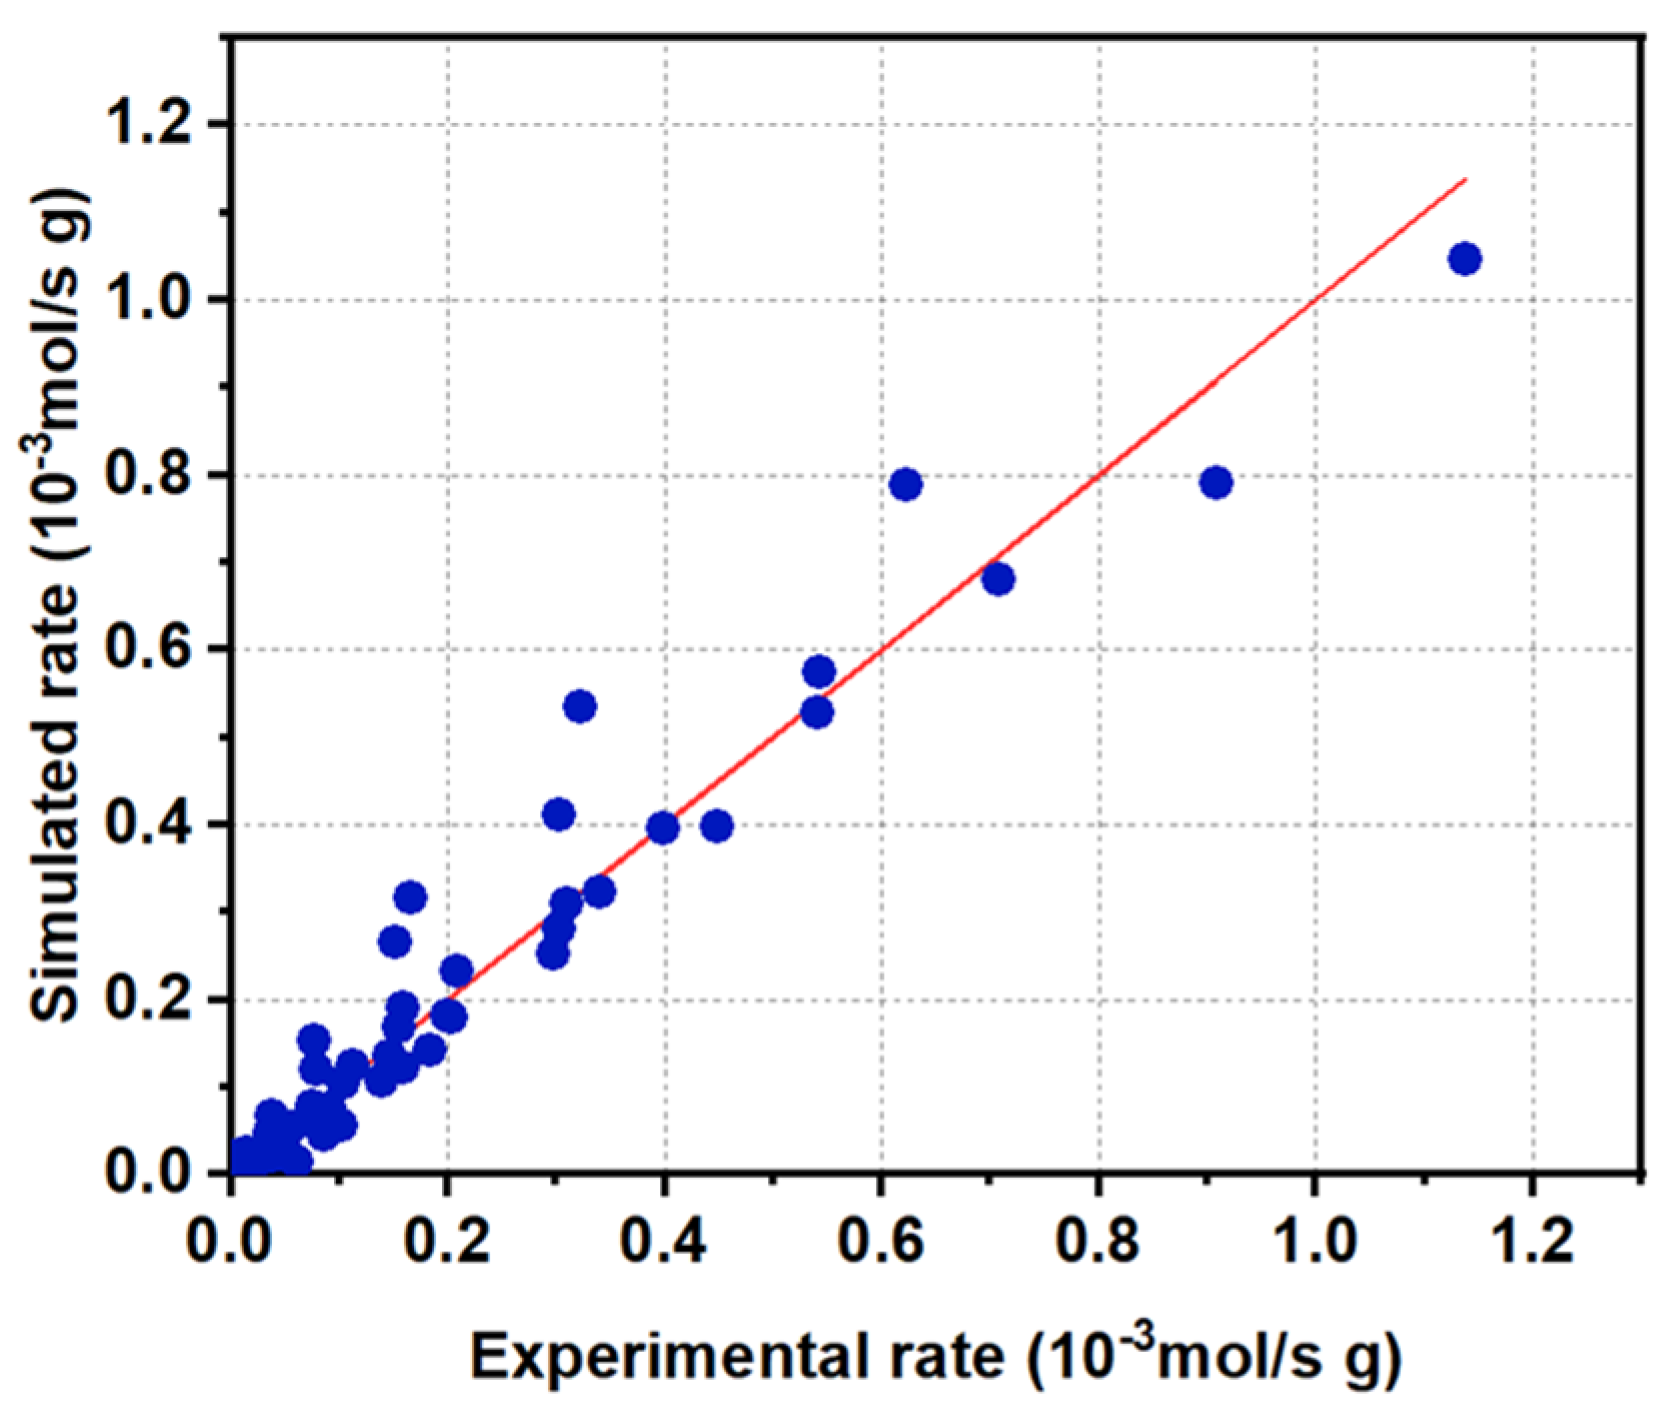
2.3.2. Kinetic Model Development

By combining the results in Figures S1 and S2, the following global kinetic rate expression is obtained for the PtPd/Al2O3 catalyst:
r = k T C H 4 0.82 H 2 O 0.25
where k(T) is a temperature-dependent rate constant. While the empirical equation is simple, it does not provide much mechanistic insight and leaves several questions. For example, why does the reaction order deviate from the first order to [CH4] when evidence suggests that CH4 activation on PdCUS sites is a rate-limiting step? Also, what is the significance of the partial order with respect to [H2O]? Additionally, with k(T) being a compound rate constant that captures many factors, such as CH4 activation and H2O adsorption, its physical meaning and its dependence on temperature become complicated. To address these issues, a bottom–up approach to develop a kinetic model based on a mechanistic understanding of the catalyst is pursued.
As discussed in Section 2.2, the nature of active sites for CH4 oxidation of the PtPd/Al2O3 catalyst appears to be the same as that of a model Pd/Al2O3 catalyst, on which CH4 activation on PdCUS sites has been proposed to be the rate-determining step. Based on this reaction mechanism, the CH4 oxidation reaction rate can be expressed by the following equation:
r = A e E 0 R T CH 4 P d c u s
where [PdCUS’] is the number of coordinatively unsaturated Pd sites on the catalyst surface that are available for CH4 activation; E0 is CH4 activation energy on the available PdCUS sites, and A is a pre-exponential factor.
Since H2O also competes for the PdCUS sites, the number of the PdCUS sites that are covered by H2O will be
[ P d c u s , b y H 2 O ] = A 1 e E 1 R T H 2 O P d c u s
where E1 is H2O adsorption energy, which is largely based on H2O adsorption enthalpy on the PdCUS site, and A1 is a pre-exponential factor.
Based on the mechanistic analysis above, we will also consider that a portion of the PdCUS sites is self-inhibited by the CH4 oxidation reaction itself and that the population can be estimated according to
[ P d c u s , b y C H 4 ] = A 2 e E 2 R T CH 4 P d c u s
where E2 is the energy needed for an active PdCUS site to become fully coordinated and lose its activity.
The sum of [PdCUS’], [PdCUS, by H2O], and [PdCUS, by CH4] should be equivalent to the total number of PdCUS sites:
[ P d c u s ] = P d c u s + P d c u s , b y H 2 O + [ P d c u s , b y C H 4 ]
Substituting Equations (10) and (11) to Equation (12) and then applying it to Equation (9), we have the following rate expression:
r = A 0 e E 0 R T [ CH 4 ] 1 + A 1 e E 1 R T H 2 O + A 2 e E 2 R T [ CH 4 ]
where A0 is a pre-exponential factor that is also proportional to the number of PdCUS sites:
A 0 = A [ P d c u s ]
There are six parameters in Equation (13) that need to be defined in order to derive a specific kinetic model for the PtPd/Al2O3 catalyst. The 72 sets of the experimental kinetic data collected according to the matrix in Table 2 with the inlet H2O concentrations from 1.0–5.0% were used to determine the parameters. The remaining 24 sets of data with the inlet H2O concentration at 0% are not used because of the difficulties in determining the actual H2O content in the feed and reactor bed (see discussion in Section S2 of Supplementary Materials). For practical applications, there will always be some level of moisture in the feed gas; therefore, using the data with inlet H2O concentration in the range of 1.0–5.0% improves the accuracy of the model.
Powell algorithm, a nonlinear regression method, is used to fit the data until the mean residual sum of squares achieves the lowest minimum value (1.9 × 10⁻⁷) [33]. The calculated values for the six parameters are listed in Table 3. Correlations between the experimental data (values in the X-axis) and the simulated reaction rates from the model (values in the Y-axis) are plotted in Figure 5. The correlation co-efficiency of the data points is R2 = 0.95, suggesting that the kinetic model of Equation (13) can accurately predict the reaction rates in a wide range of CH4 inlet concentrations (0.05–0.40%) and H2O inlet concentrations (1.0–5.0%) at realistic temperatures (450–700 °C).
The kinetic model described by Equation (13) can be reconciled with the empirical rate expression Equation (8). With the consideration of a self-inhibition factor (Equation (11)) from CH4 oxidation, the overall reaction order with respect to [CH4] becomes less than 1, as predicated by Equation (13). On the effects of H2O, although it can occupy a significant portion of the active sites, the population decreases rapidly with the increase in reaction temperature because E1 is largely dictated by H2O adsorption enthalpy, which is a negative number (−31.0 kJ/mol). In the temperature region where the experimental kinetic data were collected (450–700 °C), the contribution from H2O inhibition becomes less significant compared with the contribution from CH4 oxidation-induced surface reconstruction in the denominator of Equation (13). As a net result, it yields a partial order to [H2O] in the empirical power law expression (Equation (8)). At low temperatures (300–400 °C), when the contribution from the H2O inhibition becomes dominant, Equation (13) will lead to a −1 order to [H2O]. Indeed, all the kinetic data that suggested a −1 order to [H2O] in the literature were collected in relatively low reaction temperatures [18,22,23,24].
Compared with the kinetic model that is proposed by Keller et al. (Equations (5) and (6)), Equation (13) captures the H2O inhibition effect but eliminates the need for an arbitrary factor β’, making the model mechanistically simpler [37]. Compared with the model developed by Hurtado et al. (Equation (4)), Equation (13) is much simpler, with a clearer physical meaning for each parameter [33].
The kinetic parameters derived from the experimental data are consistent with what is reported in the literature. The activation energy for the CH4 oxidation reaction (E0) is calculated to be 96.7 kJ/mol, which is in the range of 75–150 kJ/mol that has been reported by [16,22,33,37]. The energy for H2O adsorption, E1 = −31.0 kJ/mol, which is mainly from H2O adsorption enthalpy, is in line with what Keller et al. reported by [37]. The activation energy E2 is related to the activation energy for a PdCUS site to become fully coordinated with oxygen during the CH4 oxidation process. Its exact physical meaning requires additional studies. Because the H2O inhibition factor and the CH4 oxidation-induced self-inhibition factor show opposite trends in temperature dependence, Equation (13) suggests that 450 °C is roughly the tipping point. At temperatures above this point, the H2O inhibition effect becomes less pronounced.

3. Materials and Methods

3.1. Catalyst Samples

The PdO/Al2O3 model catalyst with a Pd loading of 3 wt. % was from our previous study [20]. It was prepared by an incipient wetness impregnation method using palladium nitrate as the precursor. The PtPd/Al2O3 catalyst was provided by Johnson Matthey Inc., Wayne, PA, USA. It was developed from a US DOE ARPA-E-funded project and exhibited >1000 h on-stream stability under CH4 oxidation reaction conditions, as shown in Figure 1. The total metal loading of (Pt + Pd) is also 3 wt. %. Both catalysts were aged in a flow of 10% H2O in the air at 700 °C for 16 h to stabilize the metal dispersion and their oxidation state. A sample of the Al2O3 support for the PtPd/Al2O3 catalyst was also treated under the same condition. For the time-resolved CO chemisorption DRIFTS experiments (see below), the aged catalysts were used in their powder form. For the studies to investigate the stability of the catalysts, the aged powder samples were pelletized into 250–500 µm particles. For the kinetic data measurements, the PtPd/Al2O3 catalyst was further diluted with the aged Al2O3, as specified in Section 3.4.

3.2. Catalyst Stability Evaluation

The stability of the PtPd/Al2O3 catalyst was compared with that of the model PdO/Al2O3 catalyst using the same testing protocols reported by Chen et al. [19]. A total of 0.183 g of samples (250–500 µm) was loaded between two quartz wool plugs in a micro plug-flow reactor (i.d. = 6 mm). Two thermocouples were inserted into the reactor—one positioned at the gas inlet side above the catalyst bed and the other in the middle of the catalyst bed to monitor the temperatures at the catalyst inlet and within the bed, respectively. Additionally, a third thermocouple was affixed outside the reactor, attaching to the middle section of the catalyst bed to serve the purpose of controlling the reactor temperature. Feed gases (all UHP grade from Airgas) to the reactor were controlled by mass flow controllers according to the testing protocols outlined in Figure 2 and Figure 3. The reaction was carried out at atmospheric pressure with a total gas flow rate of 1250 mL/min. Inlet and outlet gas compositions were analyzed by a gas phase Fourier Transform Infrared (FTIR) spectrometer (Model 2030, MKS Instruments, Andover, MA, USA).

3.3. Catalyst Characterization

Time-resolved CO chemisorption DRIFTS measurements were performed on a Cary 600 Series FTIR spectrometer (Agilent Technologies Inc., Santa Clara, USA) equipped with a Harrick Scientific Praying Mantis® diffuse reflection accessory and high-temperature reaction chamber (Harrick Scientific Products Inc., Pleasantville, NY, USA) in the beam line. The cell was connected to a gas manifold that allowed for switching for different gas compositions. Powder catalyst samples were pressed on brushed aluminum plates as a thin layer and were mounted in the sample holder of the cell. The samples were first treated with 18% O2/Ar at 415 °C for 1 h, then cooled to and held at 80 °C. After purging with Ar for 30 min, 1000 ppm CO in Ar at a flow rate of 200 mL/min was introduced to the chamber. Time-resolved CO adsorption DRIFTS were recorded at a resolution of 4 cm−1.

3.4. Kinetic Data Measurements

As demonstrated in Figure 1, the newly developed PtPd/Al2O3 catalyst is very active in catalyzing CH4 oxidation, achieving >99.5% CH4 conversion under a realistic gas hour space velocity of 50,000 1/h. To keep the CH4 conversion below 20% for the kinetic data measurements from 450 to 650 °C (reached 33% at 700 °C), powder samples of the aged PtPd/Al2O3 were first diluted with the aged bare Al2O3 support at a weight ratio of 1:199. The powders were then mixed with mortar and pestle for 30 min to achieve a uniform mixture. The mixture was subsequently pelletized, crushed, and sieved. Particles in the 250–500 µm range were selected for the kinetic data measurements, which were performed on the same microplug flow reactor mentioned above.
As the typical CH4 concentration in VAM from main shafts of underground coal mines is usually below 0.4%, kinetic data measurements were performed under the conditions listed in Table 2 to closely mimic practical conditions. This matrix led to 96 tests with different reaction conditions.
Before kinetic data measurement, the pristine catalyst was stabilized under CH4 oxidation reaction conditions at 650 °C with a feed of 0.1% CH4, 3% H2O, and 18% O2 for more than 60 h to reach a steady state. Kinetic data were collected as sets, with each set being recorded at a given feed gas mixture but varying the reaction temperature from 650 to 700, 600, 550, 500, and 450 °C stepwise. The dwell time at each temperature was 1 h. The average CH4 conversion at the last 10 min of each temperature set point was used for kinetic analysis and model development. After each set of kinetic measurements, the catalyst was brought back to and held at 650 °C for at least 2 h in the same feed gas to restabilize the catalyst before transitioning to the next set of data measurements.

4. Conclusions

Mechanistic and kinetic analysis of an industrial PtPd/Al2O3 catalyst for the complete oxidation of CH4 under practically relevant conditions is presented. Compared with a model Pd/Al2O3 catalyst, the nature of the active sites of the two catalysts is fundamentally the same. Coordinatively, unsaturated PdO sites are considered the active centers that activate CH4 and initiate the oxidation reaction. H2O competes for the active sites, resulting in severe inhibition. In addition, the CH4 oxidation reaction also causes self-inhibition. By considering both inhibition factors, a relatively simple kinetic model has been developed:
r = A 0 e E 0 R T [ CH 4 ] 1 + A 1 e E 1 R T H 2 O + A 2 e E 2 R T [ CH 4 ]
This model nicely fits the experimental kinetic data generated in a wide range of reaction conditions with CH4 concentration ranging from 0.05 to 0.40%, H2O from 1.0 to 4.0%, and reaction temperatures from 450 to 700 °C. The kinetic parameters derived from the kinetic model, including CH4 activation energy (96.7 kJ/mol) and H2O adsorption energy (−31.0 kJ/mol), are consistent with what was reported in the literature.

Supplementary Materials

The following supporting information can be downloaded at https://www.mdpi.com/article/10.3390/catal14120847/s1, Analysis of external and internal diffusion mass transfer; Figure S1: Dependence of CH4 oxidation reaction rates on the partial pressure of CH4 ([CH4]) at 550, 600, 650, 700 °C at given inlet H2O concentrations of (a) 0%, (b) 1.0%, (c) 3.0%, (d) 5.0%; Figure S2. Dependence of CH4 oxidation reaction rates on the partial pressure of H2O ([H2O]) at 550, 600, 650, 700 °C at given inlet CH4 concentrations of (a) 0.05%, (b) 0.1%, (c) 0.2%, (d) 0.4%. Table S1. Dependence of CH4 oxidation reaction rates (r) on the partial pressure of CH4 ([CH4]) at 550, 600, 650, 700 °C at given inlet H2O concentrations of 0–5.0%. Table S2. Dependence of CH4 oxidation reaction rates on the partial pressure of H2O ([H2O]) at 550, 600, 650, 700 °C at given inlet CH4 concentrations of 0.05–0.40%.

Author Contributions

Conceptualization, M.W., H.-Y.C., Y.L.-J. and J.M.F.; methodology, M.W., H.-Y.C., Y.L.-J. and T.J.T.; investigation, M.W., H.-Y.C. and Y.L.-J.; resources, H.-Y.C., T.J.T. and J.M.F.; data curation, M.W. and Y.L.-J.; writing—original draft preparation, M.W.; writing—review and editing, H.-Y.C., J.M.F. and T.J.T.; visualization, M.W.; supervision, H.-Y.C.; project administration, Y.L.-J.; funding acquisition, H.-Y.C., J.M.F. and J.F. All authors have read and agreed to the published version of this manuscript.

Funding

This research was funded by the Advanced Research Projects Agency-Energy (ARPA-E) of the US Department of Energy (DE-AR0001532).

Data Availability Statement

Data will be made available upon request.

Acknowledgments

This manuscript has been authored by UT-Battelle, LLC under Contract No. DE-AC05-00OR22725 with the U.S. Department of Energy.

Conflicts of Interest

This research was funded by the Advanced Research Project Agency-Energy (ARPA-E) of the US Department of Energy (DE-AR0001532). The founding sponsor had no role in the design of this study, in the collection, analysis, or interpretation of data, in the writing of the manuscript, and in the decision to publish the results.

Disclaimer

This manuscript has been authored by UT-Battelle, LLC, under contract DE-AC05-00OR22725 with the US Department of Energy (DOE). The publisher, by accepting the article for publication, acknowledges that the US government retains a nonexclusive, paid-up, irrevocable, worldwide license to publish or reproduce the published form of this manuscript or allow others to do so for US government purposes. DOE will provide public access to these results of federally sponsored research in accordance with the DOE Public Access Plan (https://www.energy.gov/doe-public-access-plan).

References

  1. EPA, U.S. Importance of Methane. Available online: https://www.epa.gov/gmi/importance-methane (accessed on 31 July 2024).
  2. EPA, U.S. Overview of Greenhouse Gases. Available online: https://www.epa.gov/ghgemissions/overview-greenhouse-gases#methane (accessed on 31 July 2024).
  3. EPA, U.S. Understanding Global Warming Potentials. Available online: https://www.epa.gov/ghgemissions/understanding-global-warming-potentials (accessed on 31 July 2024).
  4. Setiawan, A.; Kennedy, E.M.; Stockenhuber, M. Development of Combustion Technology for Methane Emitted from Coal-Mine Ventilation Air Systems. Energy Technol. 2017, 5, 521–538. [Google Scholar] [CrossRef]
  5. Setiawan, A.; Friggieri, J.; Kennedy, E.M.; Dlugogorski, B.Z.; Stockenhuber, M. Catalytic combustion of ventilation air methane (VAM)—long term catalyst stability in the presence of water vapour and mine dust. Catal. Sci. Technol. 2014, 4, 1793–1802. [Google Scholar] [CrossRef]
  6. Feng, X.; Jiang, L.; Li, D.; Tian, S.; Zhu, X.; Wang, H.; He, C.; Li, K. Progress and key challenges in catalytic combustion of lean methane. J. Energy Chem. 2022, 75, 173–215. [Google Scholar] [CrossRef]
  7. Hinde, P.; Mitchell, I.; Riddell, M. COMET—A new Ventilation Air Methane (VAM) abatement technology. Johns. Matthey Technol. Rev. 2016, 60, 211–221. [Google Scholar] [CrossRef]
  8. Yin, J.; Su, S.; Yu, X.; Bae, J.-S.; Jin, Y.; Villella, A.; Jara, M.; Ashby, M.; Cunnington, M.; Loney, M. Site Trials and Demonstration of a Novel Pilot Ventilation Air Methane Mitigator. Energy Fuels 2020, 34, 9885–9893. [Google Scholar] [CrossRef]
  9. Karakurt, I.; Aydin, G.; Aydiner, K. Mine ventilation air methane as a sustainable energy source. Renew. Sustain. Energy Rev. 2011, 15, 1042–1049. [Google Scholar] [CrossRef]
  10. Wang, W.; Ren, J.; Li, X.; Li, H.; Li, D.; Li, H.; Song, Y. Enrichment experiment of ventilation air methane (0.5%) by the mechanical tower. Sci. Rep. 2020, 10, 7276. [Google Scholar] [CrossRef]
  11. IEA. Global Methane Tracker 2023. Available online: https://www.iea.org/reports/global-methane-tracker-2023 (accessed on 31 July 2024).
  12. Raj, A. Methane emission control: A review of mobile and stationary source emissions abatement technologies for natural gas engines. Johns. Matthey Technol. Rev. 2016, 60, 228–235. [Google Scholar] [CrossRef]
  13. Monai, M.; Montini, T.; Gorte, R.J.; Fornasiero, P. Catalytic Oxidation of Methane: Pd and Beyond. Eur. J. Inorg. Chem. 2018, 2018, 2884–2893. [Google Scholar] [CrossRef]
  14. He, L.; Fan, Y.; Bellettre, J.; Yue, J.; Luo, L. A review on catalytic methane combustion at low temperatures: Catalysts, mechanisms, reaction conditions and reactor designs. Renew. Sustain. Energy Rev. 2020, 119, 109589. [Google Scholar] [CrossRef]
  15. Gélin, P.; Primet, M. Complete oxidation of methane at low temperature over noble metal based catalysts: A review. Appl. Catal. B Environ. 2002, 39, 1–37. [Google Scholar] [CrossRef]
  16. Ciuparu, D.; Lyubovsky, M.R.; Altman, E.; Pfefferle, L.D.; Datye, A. Catalytic Combustion of Methane over Palladium-based Catalysts. Catal. Rev. 2002, 44, 593–649. [Google Scholar] [CrossRef]
  17. Oh, J.; Boucly, A.; van Bokhoven, J.A.; Artiglia, L.; Cargnello, M. Palladium Catalysts for Methane Oxidation: Old Materials, New Challenges. Acc. Chem. Res. 2024, 57, 23–36. [Google Scholar] [CrossRef] [PubMed]
  18. Coney, C.; Stere, C.; Millington, P.; Raj, A.; Wilkinson, S.; Caracotsios, M.; McCullough, G.; Hardacre, C.; Morgan, K.; Thompsett, D.; et al. Spatially-resolved investigation of the water inhibition of methane oxidation over palladium. Catal. Sci. Technol. 2020, 10, 1858–1874. [Google Scholar] [CrossRef]
  19. Chen, H.-Y.; Lugo-Jose, Y.; Fedeyko, J.; Toops, T.; Fidler, J. Deactivation Mechansims of Pd/Pd/γ-Al2O3 Catalysts for Lean Methane Oxidation. In Proceedings of the 28th North American Catalysis Society Meeting, Providence, RI, USA, 18–23 June 2023. [Google Scholar]
  20. Chen, H.-Y.; Lugo-Jose, Y.; Fedeyko, J.M.; Toops, T.J.; Fidler, J. Irreversible Catalyst Deactivation Mechanisms of PdO/γ-Al2O3 Catalysts for Lean Methane Oxidation. ACS Catal. 2024, 14, 15751–15763. [Google Scholar] [CrossRef]
  21. DOE, U.S. Catalytic Oxidation of Ventilation Air Methane. Available online: https://arpa-e.energy.gov/technologies/projects/catalytic-oxidation-ventilation-air-methane (accessed on 31 July 2024).
  22. Ribeiro, F.H.; Chow, M.; Dallabetta, R.A. Kinetics of the Complete Oxidation of Methane over Supported Palladium Catalysts. J. Catal. 1994, 146, 537–544. [Google Scholar] [CrossRef]
  23. Fujimoto, K.-i.; Ribeiro, F.H.; Avalos-Borja, M.; Iglesia, E. Structure and Reactivity of PdOx/ZrO2Catalysts for Methane Oxidation at Low Temperatures. J. Catal. 1998, 179, 431–442. [Google Scholar] [CrossRef]
  24. Zhu, G.; Han, J.; Zemlyanov, D.Y.; Ribeiro, F.H. Temperature Dependence of the Kinetics for the Complete Oxidation of Methane on Palladium and Palladium Oxide. J. Phys. Chem. B 2005, 109, 2331–2337. [Google Scholar] [CrossRef]
  25. Au-Yeung, J.; Chen, K.; Bell, A.T.; Iglesia, E. Isotopic Studies of Methane Oxidation Pathways on PdO Catalysts. J. Catal. 1999, 188, 132–139. [Google Scholar] [CrossRef]
  26. Groppi, G.; Ibashi, W.; Tronconi, E.; Forzatti, P. Structured reactors for kinetic measurements in catalytic combustion. Chem. Eng. J. 2001, 82, 57–71. [Google Scholar] [CrossRef]
  27. Abbasi, R.; Wu, L.; Wanke, S.E.; Hayes, R.E. Kinetics of methane combustion over Pt and Pt–Pd catalysts. Chem. Eng. Res. Des. 2012, 90, 1930–1942. [Google Scholar] [CrossRef]
  28. Habibi, A.H.; Semagina, N.; Hayes, R.E. Kinetics of Low-Temperature Methane Oxidation over SiO2-Encapsulated Bimetallic Pd–Pt Nanoparticles. Ind. Eng. Chem. Res. 2018, 57, 8160–8171. [Google Scholar] [CrossRef]
  29. Mihai, O.; Smedler, G.; Nylén, U.; Olofsson, M.; Olsson, L. The effect of water on methane oxidation over Pd/Al2O3 under lean, stoichiometric and rich conditions. Catal. Sci. Technol. 2017, 7, 3084–3096. [Google Scholar] [CrossRef]
  30. Kikuchi, R.; Maeda, S.; Sasaki, K.; Wennerström, S.; Eguchi, K. Low-temperature methane oxidation over oxide-supported Pd catalysts: Inhibitory effect of water vapor. Appl. Catal. A Gen. 2002, 232, 23–28. [Google Scholar] [CrossRef]
  31. Alyani, M.; Smith, K.J. Kinetic Analysis of the Inhibition of CH4 Oxidation by H2O on PdO/Al2O3 and CeO2/PdO/Al2O3 Catalysts. Ind. Eng. Chem. Res. 2016, 55, 8309–8318. [Google Scholar] [CrossRef]
  32. Todorova, S.; Naydenov, A.; Kolev, H.; Ivanov, G.; Ganguly, A.; Mondal, S.; Saha, S.; Ganguli, A.K. Reaction kinetics and mechanism of complete methane oxidation on Pd/Mn2O3 catalyst. React. Kinet. Mech. Catal. 2018, 123, 585–605. [Google Scholar] [CrossRef]
  33. Hurtado, P.; Ordóñez, S.; Sastre, H.; Díez, F.V. Development of a kinetic model for the oxidation of methane over Pd/Al2O3 at dry and wet conditions. Appl. Catal. B Environ. 2004, 51, 229–238. [Google Scholar] [CrossRef]
  34. Stotz, H.; Maier, L.; Boubnov, A.; Gremminger, A.T.; Grunwaldt, J.D.; Deutschmann, O. Surface reaction kinetics of methane oxidation over PdO. J. Catal. 2019, 370, 152–175. [Google Scholar] [CrossRef]
  35. Keller, K.; Lott, P.; Stotz, H.; Maier, L.; Deutschmann, O. Microkinetic Modeling of the Oxidation of Methane Over PdO Catalysts—Towards a Better Understanding of the Water Inhibition Effect. Catalysts 2020, 10, 922. [Google Scholar] [CrossRef]
  36. Jørgensen, M.; Grönbeck, H. First-Principles Microkinetic Modeling of Methane Oxidation over Pd(100) and Pd(111). ACS Catal. 2016, 6, 6730–6738. [Google Scholar] [CrossRef]
  37. Keller, K.; Lott, P.; Tischer, S.; Casapu, M.; Grunwaldt, J.-D.; Deutschmann, O. Methane Oxidation over PdO: Towards a Better Understanding of the Influence of the Support Material. ChemCatChem 2023, 15, e202300366. [Google Scholar] [CrossRef]
  38. Weaver, J.F.; Zhang, F.; Pan, L.; Li, T.; Asthagiri, A. Vacancy-Mediated Processes in the Oxidation of CO on PdO(101). Acc. Chem. Res. 2015, 48, 1515–1523. [Google Scholar] [CrossRef] [PubMed]
  39. Zhang, F.; Pan, L.; Li, T.; Diulus, J.T.; Asthagiri, A.; Weaver, J.F. CO Oxidation on PdO(101) during Temperature-Programmed Reaction Spectroscopy: Role of Oxygen Vacancies. J. Phys. Chem. C 2014, 118, 28647–28661. [Google Scholar] [CrossRef]
  40. Martin, N.M.; Van den Bossche, M.; Grönbeck, H.; Hakanoglu, C.; Zhang, F.; Li, T.; Gustafson, J.; Weaver, J.F.; Lundgren, E. CO Adsorption on Clean and Oxidized Pd(111). J. Phys. Chem. C 2014, 118, 1118–1128. [Google Scholar] [CrossRef]
  41. Velin, P.; Ek, M.; Skoglundh, M.; Schaefer, A.; Raj, A.; Thompsett, D.; Smedler, G.; Carlsson, P.-A. Water Inhibition in Methane Oxidation over Alumina Supported Palladium Catalysts. J. Phys. Chem. C 2019, 123, 25724–25737. [Google Scholar] [CrossRef]
  42. Tessier, D.; Rakai, A.; Bozon-Verduraz, F. Spectroscopic study of the interaction of carbon monoxide with cationic and metallic palladium in palladium–alumina catalysts. J. Chem. Soc. Faraday Trans. 1992, 88, 741–749. [Google Scholar] [CrossRef]
  43. Lear, T.; Marshall, R.; Antonio Lopez-Sanchez, J.; Jackson, S.D.; Klapötke, T.M.; Bäumer, M.; Rupprechter, G.; Freund, H.-J.; Lennon, D. The application of infrared spectroscopy to probe the surface morphology of alumina-supported palladium catalysts. J. Chem. Phys. 2005, 123, 174706. [Google Scholar] [CrossRef]
  44. Gelin, P.; Siedle, A.R.; Yates, J.T., Jr. Stoichiometric adsorbate species interconversion processes in the chemisorbed layer. An infrared study of the carbon monoxide/palladium system. J. Phys. Chem. 1984, 88, 2978–2985. [Google Scholar] [CrossRef]
  45. Jang, E.J.; Lee, J.; Oh, D.G.; Kwak, J.H. CH4 Oxidation Activity in Pd and Pt–Pd Bimetallic Catalysts: Correlation with Surface PdOx Quantified from the DRIFTS Study. ACS Catal. 2021, 11, 5894–5905. [Google Scholar] [CrossRef]
  46. Xu, J.; Ouyang, L.; Mao, W.; Yang, X.-J.; Xu, X.-C.; Su, J.-J.; Zhuang, T.-Z.; Li, H.; Han, Y.-F. Operando and Kinetic Study of Low-Temperature, Lean-Burn Methane Combustion over a Pd/γ-Al2O3 Catalyst. ACS Catal. 2012, 2, 261–269. [Google Scholar] [CrossRef]
  47. Oh, D.G.; Aleksandrov, H.A.; Kim, H.; Koleva, I.Z.; Khivantsev, K.; Vayssilov, G.N.; Kwak, J.H. Understanding of Active Sites and Interconversion of Pd and PdO during CH4 Oxidation. Molecules 2023, 28, 1957. [Google Scholar] [CrossRef] [PubMed]
  48. Di Gregorio, F.; Bisson, L.; Armaroli, T.; Verdon, C.; Lemaitre, L.; Thomazeau, C. Characterization of well faceted palladium nanoparticles supported on alumina by transmission electron microscopy and FT-IR spectroscopy of CO adsorption. Appl. Catal. A: Gen. 2009, 352, 50–60. [Google Scholar] [CrossRef]
  49. Lentz, C.; Jand, S.P.; Melke, J.; Roth, C.; Kaghazchi, P. DRIFTS study of CO adsorption on Pt nanoparticles supported by DFT calculations. J. Mol. Catal. A Chem. 2017, 426, 1–9. [Google Scholar] [CrossRef]
  50. Tankov, I.; Cassinelli, W.H.; Bueno, J.M.C.; Arishtirova, K.; Damyanova, S. DRIFTS study of CO adsorption on praseodymium modified Pt/Al2O3. Appl. Surf. Sci. 2012, 259, 831–839. [Google Scholar] [CrossRef]
  51. Raskó, J. CO-induced surface structural changes of Pt on oxide-supported Pt catalysts studied by DRIFTS. J. Catal. 2003, 217, 478–486. [Google Scholar] [CrossRef]
  52. Anderson, J.R.; Boudart, M. Catalysis Science and Technology, Vol 8; Spinger: New York, NY, USA, 1987. [Google Scholar]
  53. Tang, M.; Shiraiwa, M.; Pöschl, U.; Cox, R.; Kalberer, M. Compilation and evaluation of gas phase diffusion coefficients of reactive trace gases in the atmosphere: Volume 2. Diffusivities of organic compounds, pressure-normalised mean free paths, and average Knudsen numbers for gas uptake calculations. Atmos. Chem. Phys. 2015, 15, 5585–5598. [Google Scholar] [CrossRef]
  54. Vannice, M.A. Kinetic of Catalytic Reactions; Springer: Berlin/Heidelberg, Germany, 2005. [Google Scholar]
Figure 1. A 1000-h durability evaluation of a newly developed PtPd/Al2O3 catalyst for complete CH4 oxidation. Reaction conditions: 0.6–0.7% CH4, 3% H2O, and 18% O2 in N2 at a GHSV of 50,000 h−1, with a catalyst inlet temperature at 480 °C and outlet temperature at 600 °C.
Catalysts 14 00847 g001
Figure 2. On-stream stability for CH4 oxidation at 450 °C over PtPd/Al2O3, Pd/Al2O3, and Al2O3. Feed gas: 1000 ppm CH4, 3% H2O, 18% O2, at a total flow rate of 1250 mL/min or a WHSV = 410 L/h per gram of catalyst).
Catalysts 14 00847 g002
Figure 3. Evaluation of CH4 oxidation activity under various reaction conditions as indicated in the top portion of the plot on (a) PtPd/Al2O3 and (b) Pd/Al2O3 catalysts. The feed gas was kept at 1250 mL/min with Ar as a balance. The reaction temperature was kept at 450 °C.
Catalysts 14 00847 g003
Figure 4. Time-resolved CO adsorption DRIFTS spectra on (a) PtPd/Al2O3 and (b) Pd/Al2O3 catalysts upon exposure to 1000 ppm CO + Ar at 80 °C.
Catalysts 14 00847 g004
Figure 5. Correlation between the experimental rate and the calculated rate from the rate Equation (13) and the parameter listed in Table 2 for the PtPd/Al2O3 catalyst.
Catalysts 14 00847 g005
Table 1. Distinguishable IR bands in the 2200–1800 cm−1 region and the corresponding assignment.
WavenumberAssignmentReferences
2135 cm−1CO atop bonded on PdCUS sites[20,38,39,40]
2100 cm−1CO atop bonded on isolated Pd0 on flat planes[41,42,43,44,45,46,47,48]
2076 cm−1CO atop bonded Pd0 at the corners or edges[41,42,43,44,45,46,47,48]
2060 cm−1CO atop bonded on Pt0 sites[49,50,51]
1976 cm−1CO bridge bonded on Pd0 sites[41,42,43,44,45,46,47,48]
1934 cm−1CO hollow bonded on Pd0 sites[41,42,43,44,45,46,47,48]
Table 2. Testing condition matrix for kinetic data measurements on the PtPd/Al2O3 catalyst.
Feed Gases or Reaction TemperatureMatrix# of Variables
CH4 (%) *0.05, 0.1, 0.2, 0.44
H2O (%) *0, 1, 3, 54
O2 (%) *,**181
Temperature (℃)450, 500, 550, 600, 650, 7006
Total gas flow rate (mL/min, STP)12501
*: All concentrations were in volume ratio. Argon was used as the balance gas due to the existing reactor setup. **: The oxygen level was below the typical atmospheric concentration of 21% due to a technical constraint for the need for a specific amount of balance gas (Ar) to carry the desirable amount of H2O vapor (H2O) into the reactor system.
Table 3. Kinetic parameters for rate Equation (13) for the PtPd/Al2O3 catalyst.
A0 (s−1 ∙ g−1 catal.)E0 (kJ/mol)A1 (s−1 ∙ g−1 catal.)E1 (kJ/mol)A2 (s−1 ∙ g−1 catal.)E2 (kJ/mol)
2.2 × 10596.72.15−31.01.85 × 10424.6
Disclaimer/Publisher’s Note: The statements, opinions and data contained in all publications are solely those of the individual author(s) and contributor(s) and not of MDPI and/or the editor(s). MDPI and/or the editor(s) disclaim responsibility for any injury to people or property resulting from any ideas, methods, instructions or products referred to in the content.

