
Dyes Degradation Using Cooper-Nickel Ferrite and Its Tunable Structural and Photocatalytic Properties


Abstract
1. Introduction
2. Results and Discussions
3. Materials and Methods
3.1. Reagents and Synthesis Procedure
3.2. Characterizations
3.3. Photocatalytic Experiments
4. Conclusions
Author Contributions
Funding
Data Availability Statement
Acknowledgments
Conflicts of Interest
References
- Hussain, S.; Khan, N.; Gul, S.; Khan, S.; Khan, H. Contamination of Water Resources by Food Dyes and Its Removal Technologies. In Water Chemistry; IntechOpen: London, UK, 2020; pp. 1–14. [Google Scholar]
- Berradi, M.; Hsissou, R.; Khudhair, M.; Assouag, M.; Cherkaoui, O.; El Bachiri, A.; El Harfi, A. Textile Finishing Dyes and Their Impact on Aquatic Environs. Heliyon 2019, 5, e02711. [Google Scholar] [CrossRef]
- Gičević, A.; Hindija, L.; Karačić, A. Toxicity of Azo Dyes in Pharmaceutical Industry. In CMBEBIH 2019, Proceedings of the International Conference on Medical and Biological Engineering, Banja Luka, Bosnia and Herzegovina, 16–18 May 2019; Springer: Cham, Switzerland, 2020; pp. 581–587. [Google Scholar]
- Singh, A.K.; Chandra, R. Pollutants Released from the Pulp Paper Industry: Aquatic Toxicity and Their Health Hazards. Aquat. Toxicol. 2019, 211, 202–216. [Google Scholar] [CrossRef] [PubMed]
- Lima, J.; Aguiar, A. Presença de Metais Pesados e Processos Convencionais Para o Tratamento de Efluentes de Indústrias Têxteis Brasileiras. In Engenharia Química: Inovação e Tradição em Tempos de Pandemia; Even3 Publicações: Recife, Brazil, 2021; pp. 806–819. ISBN 9786559412624. [Google Scholar]
- Ramos, M.D.N.; Lima, J.P.P.; de Aquino, S.F.; Aguiar, A. A Critical Analysis of the Alternative Treatments Applied to Effluents from Brazilian Textile Industries. J. Water Process Eng. 2021, 43, 102273. [Google Scholar] [CrossRef]
- Tkaczyk, A.; Mitrowska, K.; Posyniak, A. Synthetic Organic Dyes as Contaminants of the Aquatic Environment and Their Implications for Ecosystems: A Review. Sci. Total Environ. 2020, 717, 137222. [Google Scholar] [CrossRef]
- Garrido-Cardenas, J.A.; Esteban-García, B.; Agüera, A.; Sánchez-Pérez, J.A.; Manzano-Agugliaro, F. Wastewater Treatment by Advanced Oxidation Process and Their Worldwide Research Trends. Int. J. Environ. Res. Public Health 2020, 17, 170. [Google Scholar] [CrossRef]
- Kowalska, K.; Maniakova, G.; Carotenuto, M.; Sacco, O.; Vaiano, V.; Lofrano, G.; Rizzo, L. Removal of Carbamazepine, Diclofenac and Trimethoprim by Solar Driven Advanced Oxidation Processes in a Compound Triangular Collector Based Reactor: A Comparison between Homogeneous and Heterogeneous Processes. Chemosphere 2020, 238, 124665. [Google Scholar] [CrossRef]
- Akerdi, A.G.; Bahrami, S.H. Application of Heterogeneous Nano-Semiconductors for Photocatalytic Advanced Oxidation of Organic Compounds: A Review. J. Environ. Chem. Eng. 2019, 7, 103283. [Google Scholar] [CrossRef]
- Xie, X.; Wang, B.; Wang, Y.; Ni, C.; Sun, X.; Du, W. Spinel Structured MFe2O4 (M = Fe, Co, Ni, Mn, Zn) and Their Composites for Microwave Absorption: A Review. Chem. Eng. J. 2022, 428, 131160. [Google Scholar] [CrossRef]
- Sundararajan, M.; Sailaja, V.; John Kennedy, L.; Judith Vijaya, J. Photocatalytic Degradation of Rhodamine B under Visible Light Using Nanostructured Zinc Doped Cobalt Ferrite: Kinetics and Mechanism. Ceram. Int. 2017, 43, 540–548. [Google Scholar] [CrossRef]
- Rashad, M.M.; Mohamed, R.M.; Ibrahim, M.A.; Ismail, L.F.M.; Abdel-Aal, E.A. Magnetic and Catalytic Properties of Cubic Copper Ferrite Nanopowders Synthesized from Secondary Resources. Adv. Powder Technol. 2012, 23, 315–323. [Google Scholar] [CrossRef]
- Sivakumar, P.; Ramesh, R.; Ramanand, A.; Ponnusamy, S.; Muthamizhchelvan, C. Synthesis and Characterization of Nickel Ferrite Magnetic Nanoparticles. Mater. Res. Bull. 2011, 46, 2208–2211. [Google Scholar] [CrossRef]
- Priya, R.; Stanly, S.; Anuradha, R.; Sagadevan, S. Evaluation of Photocatalytic Activity of Copper Ferrite Nanoparticles. Mater. Res. Express 2019, 6, 095014. [Google Scholar] [CrossRef]
- Karcıoğlu Karakaş, Z. A Comprehensive Study on the Production and Photocatalytic Activity of Copper Ferrite Nanoparticles Synthesized by Microwave-Assisted Combustion Method as an Effective Photocatalyst. J. Phys. Chem. Solids 2022, 170, 110927. [Google Scholar] [CrossRef]
- Vosoughifar, M. Preparation and Application of Copper Ferrite Nanoparticles for Degradation of Methyl Orange. J. Mater. Sci. Mater. Electron. 2016, 27, 10449–10453. [Google Scholar] [CrossRef]
- Oliveira, T.P.; Rodrigues, S.F.; Marques, G.N.; Viana Costa, R.C.; Garçone Lopes, C.G.; Aranas, C.; Rojas, A.; Gomes Rangel, J.H.; Oliveira, M.M. Synthesis, Characterization, and Photocatalytic Investigation of CuFe2O4 for the Degradation of Dyes under Visible Light. Catalysts 2022, 12, 623. [Google Scholar] [CrossRef]
- Ismael, M. Ferrites as Solar Photocatalytic Materials and Their Activities in Solar Energy Conversion and Environmental Protection: A Review. Sol. Energy Mater. Sol. Cells 2021, 219, 110786. [Google Scholar] [CrossRef]
- Behera, A.; Kandi, D.; Majhi, S.M.; Martha, S.; Parida, K. Facile Synthesis of ZnFe2O4 Photocatalysts for Decolourization of Organic Dyes under Solar Irradiation. Beilstein J. Nanotechnol. 2018, 9, 436–446. [Google Scholar] [CrossRef]
- Jarusheh, H.S.; Yusuf, A.; Banat, F.; Haija, M.A.; Palmisano, G. Integrated Photocatalytic Technologies in Water Treatment Using Ferrites Nanoparticles. J. Environ. Chem. Eng. 2022, 10, 108204. [Google Scholar] [CrossRef]
- Dhiwahar, A.T.; Maruthamuthu, S.; Marnadu, R.; Sundararajan, M.; Manthrammel, M.A.; Shkir, M.; Sakthivel, P.; Minnam Reddy, V.R. Improved Photocatalytic Degradation of Rhodamine B under Visible Light and Magnetic Properties Using Microwave Combustion Grown Ni Doped Copper Ferrite Spinel Nanoparticles. Solid State Sci. 2021, 113, 106542. [Google Scholar] [CrossRef]
- Silva, M.M.S.; Raimundo, R.A.; Silva, T.R.; Araújo, A.J.M.; Macedo, D.A.; Morales, M.A.; Souza, C.P.; Santos, A.G.; Lopes-Moriyama, A.L. Morphology-Controlled NiFe2O4 Nanostructures: Influence of Calcination Temperature on Structural, Magnetic and Catalytic Properties towards OER. J. Electroanal. Chem. 2023, 933, 117277. [Google Scholar] [CrossRef]
- Nihore, A.; Aziz, F.; Oswal, N.; Jain, P.; Subohi, O.; Gupta, N. Synthesis and Characterization of Copper Doped Nickel Ferrite Prepared by Sol-Gel Method. Mater. Today Proc. 2019, 18, 3651–3656. [Google Scholar] [CrossRef]
- Anjana, V.; John, S.; Prakash, P.; Nair, A.M.; Nair, A.R.; Sambhudevan, S.; Shankar, B. Magnetic Properties of Copper Doped Nickel Ferrite Nanoparticles Synthesized by Co Precipitation Method. IOP Conf. Ser. Mater. Sci. Eng. 2018, 310, 012024. [Google Scholar] [CrossRef]
- Gayathri Manju, B.; Raji, P. Biological Synthesis, Characterization, and Antibacterial Activity of Nickel-Doped Copper Ferrite Nanoparticles. Appl. Phys. A 2019, 125, 313. [Google Scholar] [CrossRef]
- Greenwood, N.N. Mössbauer Spectroscopy; Springer Science & Business Media: Berlin/Heidelberg, Germany, 2012; ISBN 94-009-5697-5. [Google Scholar]
- Silva, M.M.S.; Raimundo, R.A.; Ferreira, L.S.; Macedo, D.A.; Morales, M.A.; Souza, C.P.; Santos, A.G.; Lopes-Moriyama, A.L. Effects of Morphology on the Electrochemical Performance of NiFe2O4 Nanoparticles with Battery-Type Behavior. Int. J. Appl. Ceram. Technol. 2022, 19, 2016–2028. [Google Scholar] [CrossRef]
- Thanh, N.K.; Loan, T.T.; Anh, L.N.; Duong, N.P.; Soontaranon, S.; Thammajak, N.; Hien, T.D. Cation Distribution in CuFe2O4 Nanoparticles: Effects of Ni Doping on Magnetic Properties. J. Appl. Phys. 2016, 120, 142115. [Google Scholar] [CrossRef]
- Zaki, H.M. Structure, Analysis and Some Magnetic Properties for Low Temperature Fired Ni–Cu Ferrite. Phys. B Condens. Matter 2012, 407, 2025–2031. [Google Scholar] [CrossRef]
- Rodrigues, M.V. Síntese e Caracterização de Ferritas Mistas de Níquel e Cobre Pelo Método de Complexação Combinado EDTA/Citrato. Master Thesis, Engenharia Química, Natal, Brasil, 2020. [Google Scholar]
- Yousaf, M.; Noor, A.; Xu, S.; Akhtar, M.N.; Wang, B. Magnetic Characteristics and Optical Band Alignments of Rare Earth (Sm+3, Nd+3) Doped Garnet Ferrite Nanoparticles (NPs). Ceram. Int. 2020, 46, 16524–16532. [Google Scholar] [CrossRef]
- Zhou, Y.; Wang, Y.; Wen, T.; Zhang, S.; Chang, B.; Guo, Y.; Yang, B. Mesoporous Cd1−xZnxS Microspheres with Tunable Bandgap and High Specific Surface Areas for Enhanced Visible-Light-Driven Hydrogen Generation. J. Colloid Interface Sci. 2016, 467, 97–104. [Google Scholar] [CrossRef]
- De Azevedo, I.G.D.D.; Rodrigues, M.V.; Gomes, Y.F.; de Araújo, C.P.B.; de Souza, C.P.; Moriyama, A.L.L. Photocatalytic Degradation of the Rhodamine B Dye Under Visible Light Using NixCu(1−x)Fe2O4 Synthesized by EDTA-Citrate Complexation Method. Mater. Res. 2023, 26 (Suppl. 1), e20230061. [Google Scholar] [CrossRef]
- Fathy, M.A.; Kamel, A.H.; Hassan, S.S.M. Novel magnetic nickel ferrite nanoparticles modified with poly(aniline-co-o-toluidine) for the removal of hazardous 2,4-dichlorophenol pollutant from aqueous solutions. RSC Adv. 2022, 12, 7433. [Google Scholar] [CrossRef]
- Vergis, B.R.; Krishna, R.H.; Kottam, N.; Nagabhushana, B.M.; Sharath, R.; Darukaprasad, B. Removal of malachite green from aqueous solution by magnetic CuFe2O4 nano-adsorbent synthesized by one pot solution combustion method. J. Nanostructure Chem. 2018, 8, 1–12. [Google Scholar] [CrossRef]
- Alam, U.; Khan, A.; Ali, D.; Bahnemann, D.; Muneer, M. Comparative Photocatalytic Activity of Sol–Gel Derived Rare Earth Metal (La, Nd, Sm and Dy)-Doped ZnO Photocatalysts for Degradation of Dyes. RSC Adv. 2018, 8, 17582–17594. [Google Scholar] [CrossRef] [PubMed]
- Soltani, T.; Entezari, M.H. Photolysis and Photocatalysis of Methylene Blue by Ferrite Bismuth Nanoparticles under Sunlight Irradiation. J. Mol. Catal. A Chem. 2013, 377, 197–203. [Google Scholar] [CrossRef]
- Makofane, A.; Motaung, D.E.; Hintsho-Mbita, N.C. Photocatalytic Degradation of Methylene Blue and Sulfisoxazole from Water Using Biosynthesized Zinc Ferrite Nanoparticles. Ceram. Int. 2021, 47, 22615–22626. [Google Scholar] [CrossRef]
- Casbeer, E.; Sharma, V.K.; Li, X.-Z. Synthesis and Photocatalytic Activity of Ferrites under Visible Light: A Review. Sep. Purif. Technol. 2012, 87, 1–14. [Google Scholar] [CrossRef]
- Li, Y.; Shen, J.; Hu, Y.; Qiu, S.; Min, G.; Song, Z.; Sun, Z.; Li, C. General Flame Approach to Chainlike MFe2O4 Spinel (M= Cu, Ni, Co, Zn) Nanoaggregates for Reduction of Nitroaromatic Compounds. Ind. Eng. Chem. Res. 2015, 54, 9750–9757. [Google Scholar] [CrossRef]
- Goyal, A.; Bansal, S.; Singhal, S. Facile Reduction of Nitrophenols: Comparative Catalytic Efficiency of MFe2O4 (M= Ni, Cu, Zn) Nano Ferrites. Int. J. Hydrogen Energy 2014, 39, 4895–4908. [Google Scholar] [CrossRef]
- Sharma, R.; Bansal, S.; Singhal, S. Tailoring the Photo-Fenton Activity of Spinel Ferrites (MFe2O4) by Incorporating Different Cations (M = Cu, Zn, Ni and Co) in the Structure. RSC Adv. 2015, 5, 6006–6018. [Google Scholar] [CrossRef]
- Harraz, F.A.; Mohamed, R.M.; Rashad, M.M.; Wang, Y.C.; Sigmund, W. Magnetic Nanocomposite Based on Titania–Silica/Cobalt Ferrite for Photocatalytic Degradation of Methylene Blue Dye. Ceram. Int. 2014, 40, 375–384. [Google Scholar] [CrossRef]
- Mancipe, S.; Martínez, J.J.; Pinzon, C.; Rojas, H.; Solis, D.; Gomez, R. Effective photocatalytic degradation of Rhodamine B using tin semiconductors over hydrotalcite-type materials under sunlight driven. Catal. Today 2021, 372, 191–197. [Google Scholar] [CrossRef]
- Nath, D.; Singh, F.; Das, R. X-ray diffraction analysis by Williamson-Hall, Halder-Wagner and size-strain plot methods of CdSe nanoparticles- a comparative study. Mater. Chem. Phys. 2020, 239, 122021. [Google Scholar] [CrossRef]
- Brasileiro, I.L.O. Desenvolvimento de Heterojunções Constituídas de ZnO/g-C3N4 e ZnFe2O4/g-C3N4 Para Fotodegradação de Contaminantes Orgânicos Emergentes. Ph.D. Thesis, Engenharia Química, Natal, Brasil, 2022. [Google Scholar]

| Sample | Scherrer | SSP | UDM-WH | HWL | Crystallite Size (nm) * | Strain (-) * |
|---|---|---|---|---|---|---|
| X0 | 0.0024 | 0.8542 | 0.0443 | 0.8924 | 35.1 | 0.033 |
| X20 | 0.05 | 0.9263 | 0.0072 | 0.8573 | 26.7 | 0.1431 |
| X40 | 0.01625 | 0.8516 | 0.1177 | 0.944 | 107.2 | 0.009 |
| X60 | 0.5087 | 0.989 | 0.4294 | 0.6811 | 130 | 0.064 |
| X80 | 0.0963 | 0.8727 | 0.2522 | 0.9636 | 199.7 | 0.009 |
| X100 | 0.5918 | 0.2504 | 0.8287 | 0.998 | 138 | 0.012 |
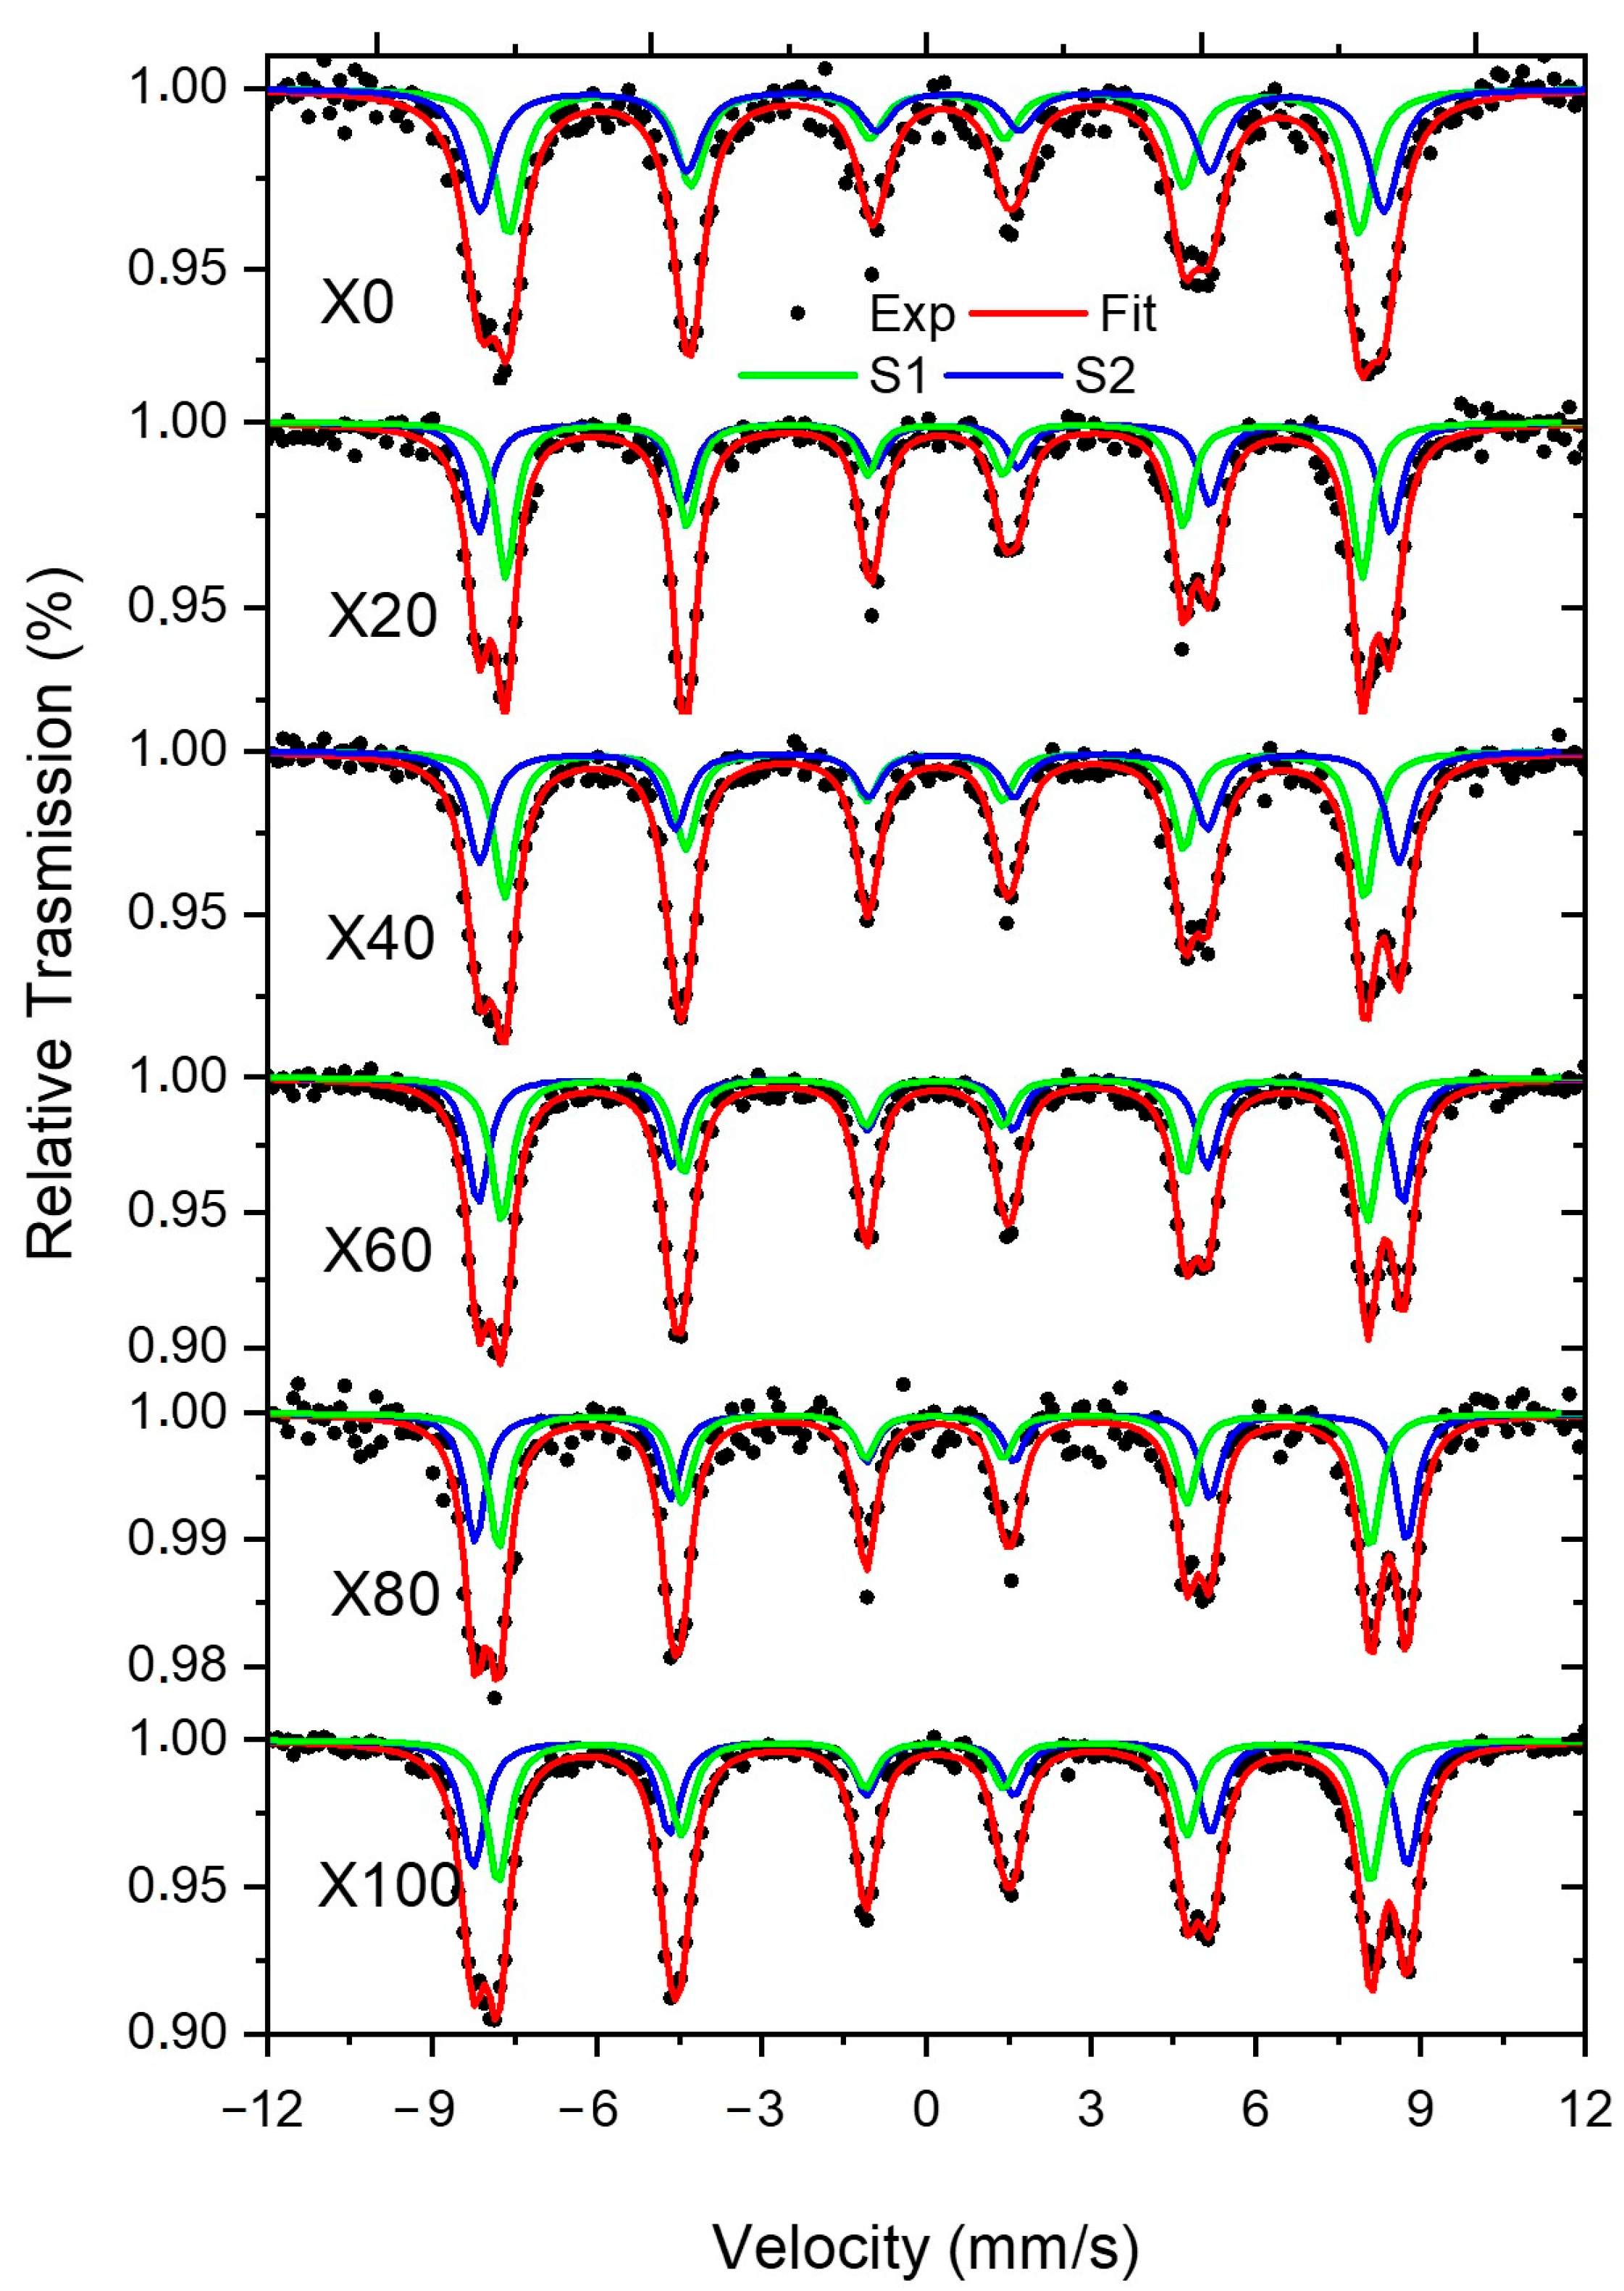
| Sextet | Fit Parameters | X0 | X20 | X40 | X60 | X80 | X100 |
|---|---|---|---|---|---|---|---|
| S1 | IS (mm/s) | 0.275 | 0.259 | 0.264 | 0.58 | 0.59 | 0.54 |
| QS (mm/s) | −0.063 | −0.023 | 0.001 | 0.004 | 0.003 | −0.001 | |
| Bhf (T) | 48.0 | 48.4 | 48.6 | 48.9 | 49.2 | 49.3 | |
| AREA (%) | 49.9 | 50.1 | 49.3 | 50.6 | 49.4 | 48.7 | |
| Wid (mm/s) | 0.621 | 0.440 | 0.491 | 0.471 | 0.452 | 0.510 | |
| S2 | IS (mm/s) | 0.357 | 0.361 | 0.362 | 0.359 | 0.367 | 0.361 |
| QS (mm/s) | −0.296 | −0.213 | −0.039 | 0.009 | 0.011 | 0.003 | |
| Bhf (T) | 51.1 | 51.5 | 51.9 | 52.2 | 52.6 | 52.8 | |
| AREA (%) | 50.1 | 49.9 | 50.7 | 49.4 | 50.6 | 51.3 | |
| Wid (mm/s) | 0.674 | 0.503 | 0.556 | 0.481 | 0.461 | 0.522 |
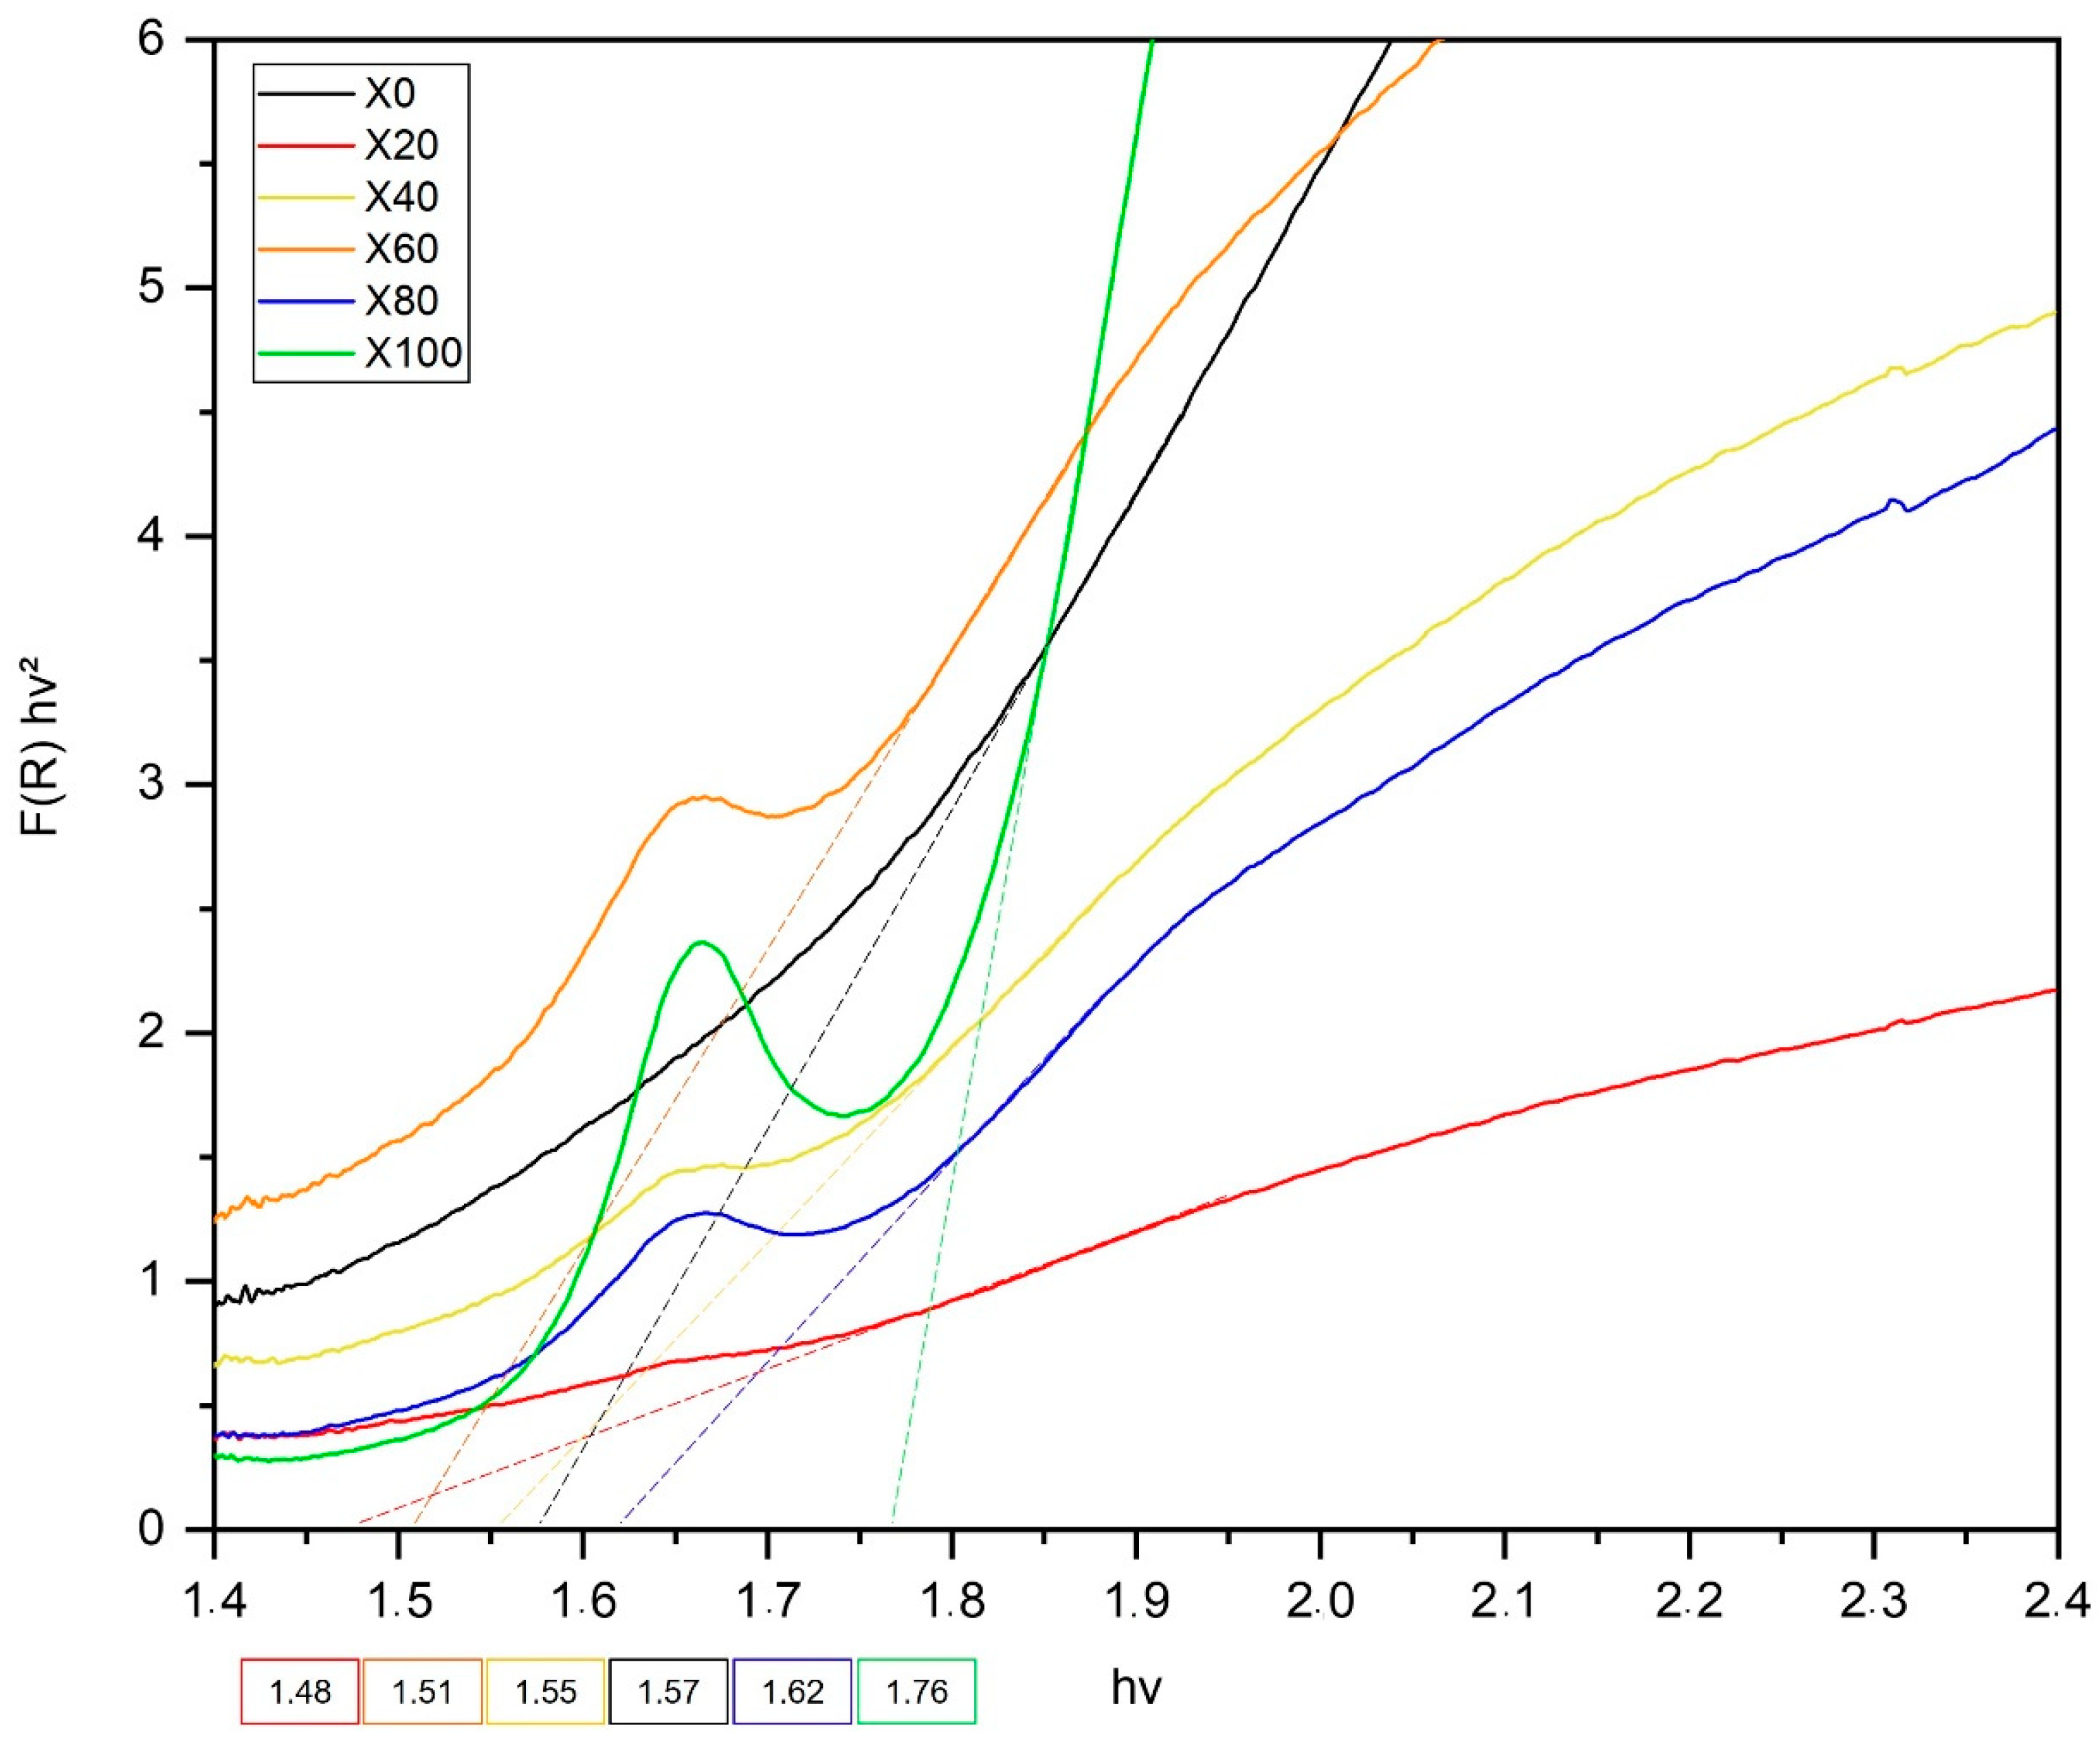
| Samples | χ | ECB (eV) | EVB (eV) |
|---|---|---|---|
| X0 | 5.852 | 0.567 | 2.137 |
| X20 | 5.849 | 0.609 | 2.089 |
| X40 | 5.846 | 0.571 | 2.15 |
| X60 | 5.843 | 0.588 | 2.121 |
| X80 | 5.84 | 0.535 | 2.145 |
| X100 | 5.837 | 0.457 | 2.217 |
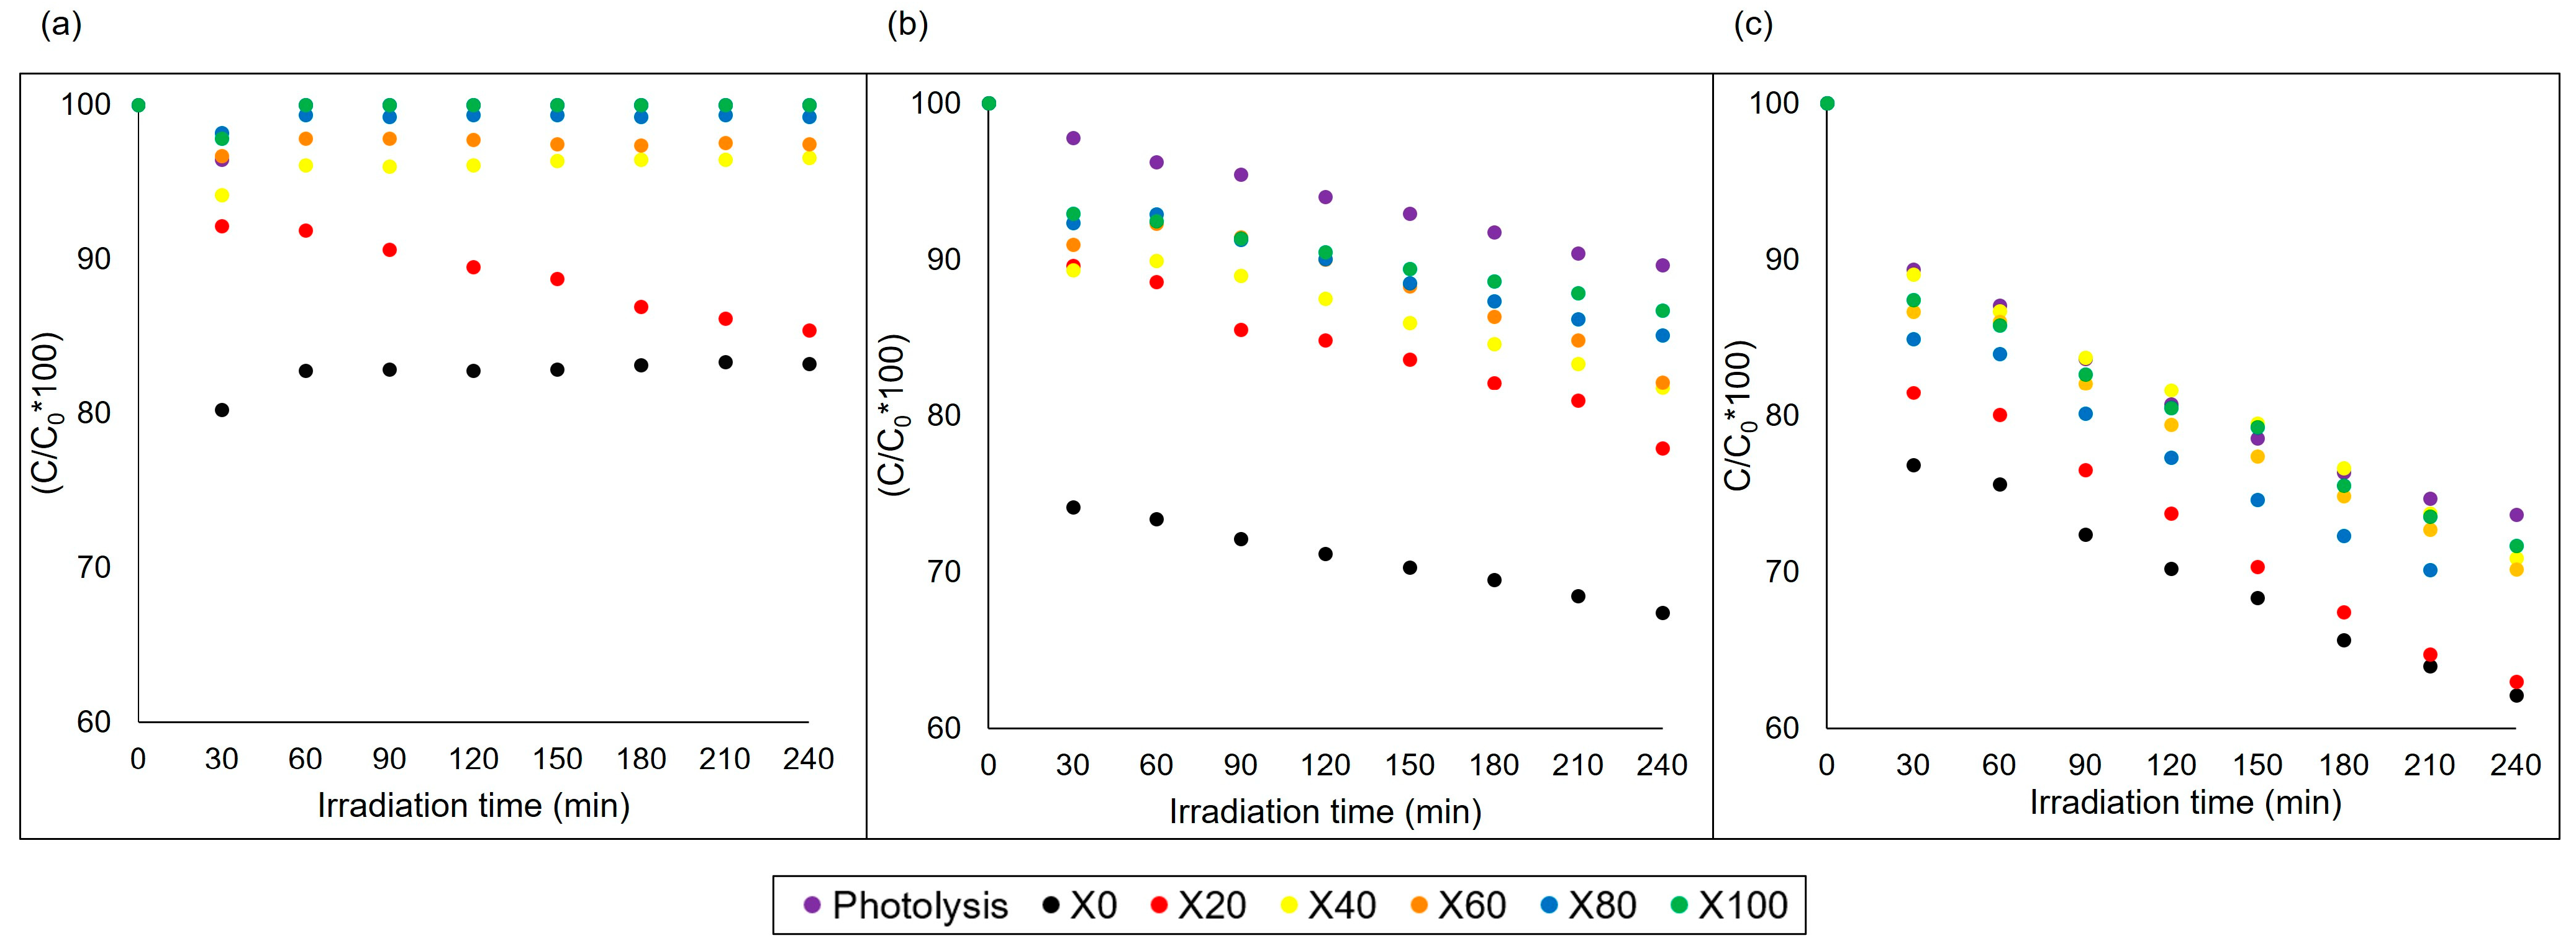
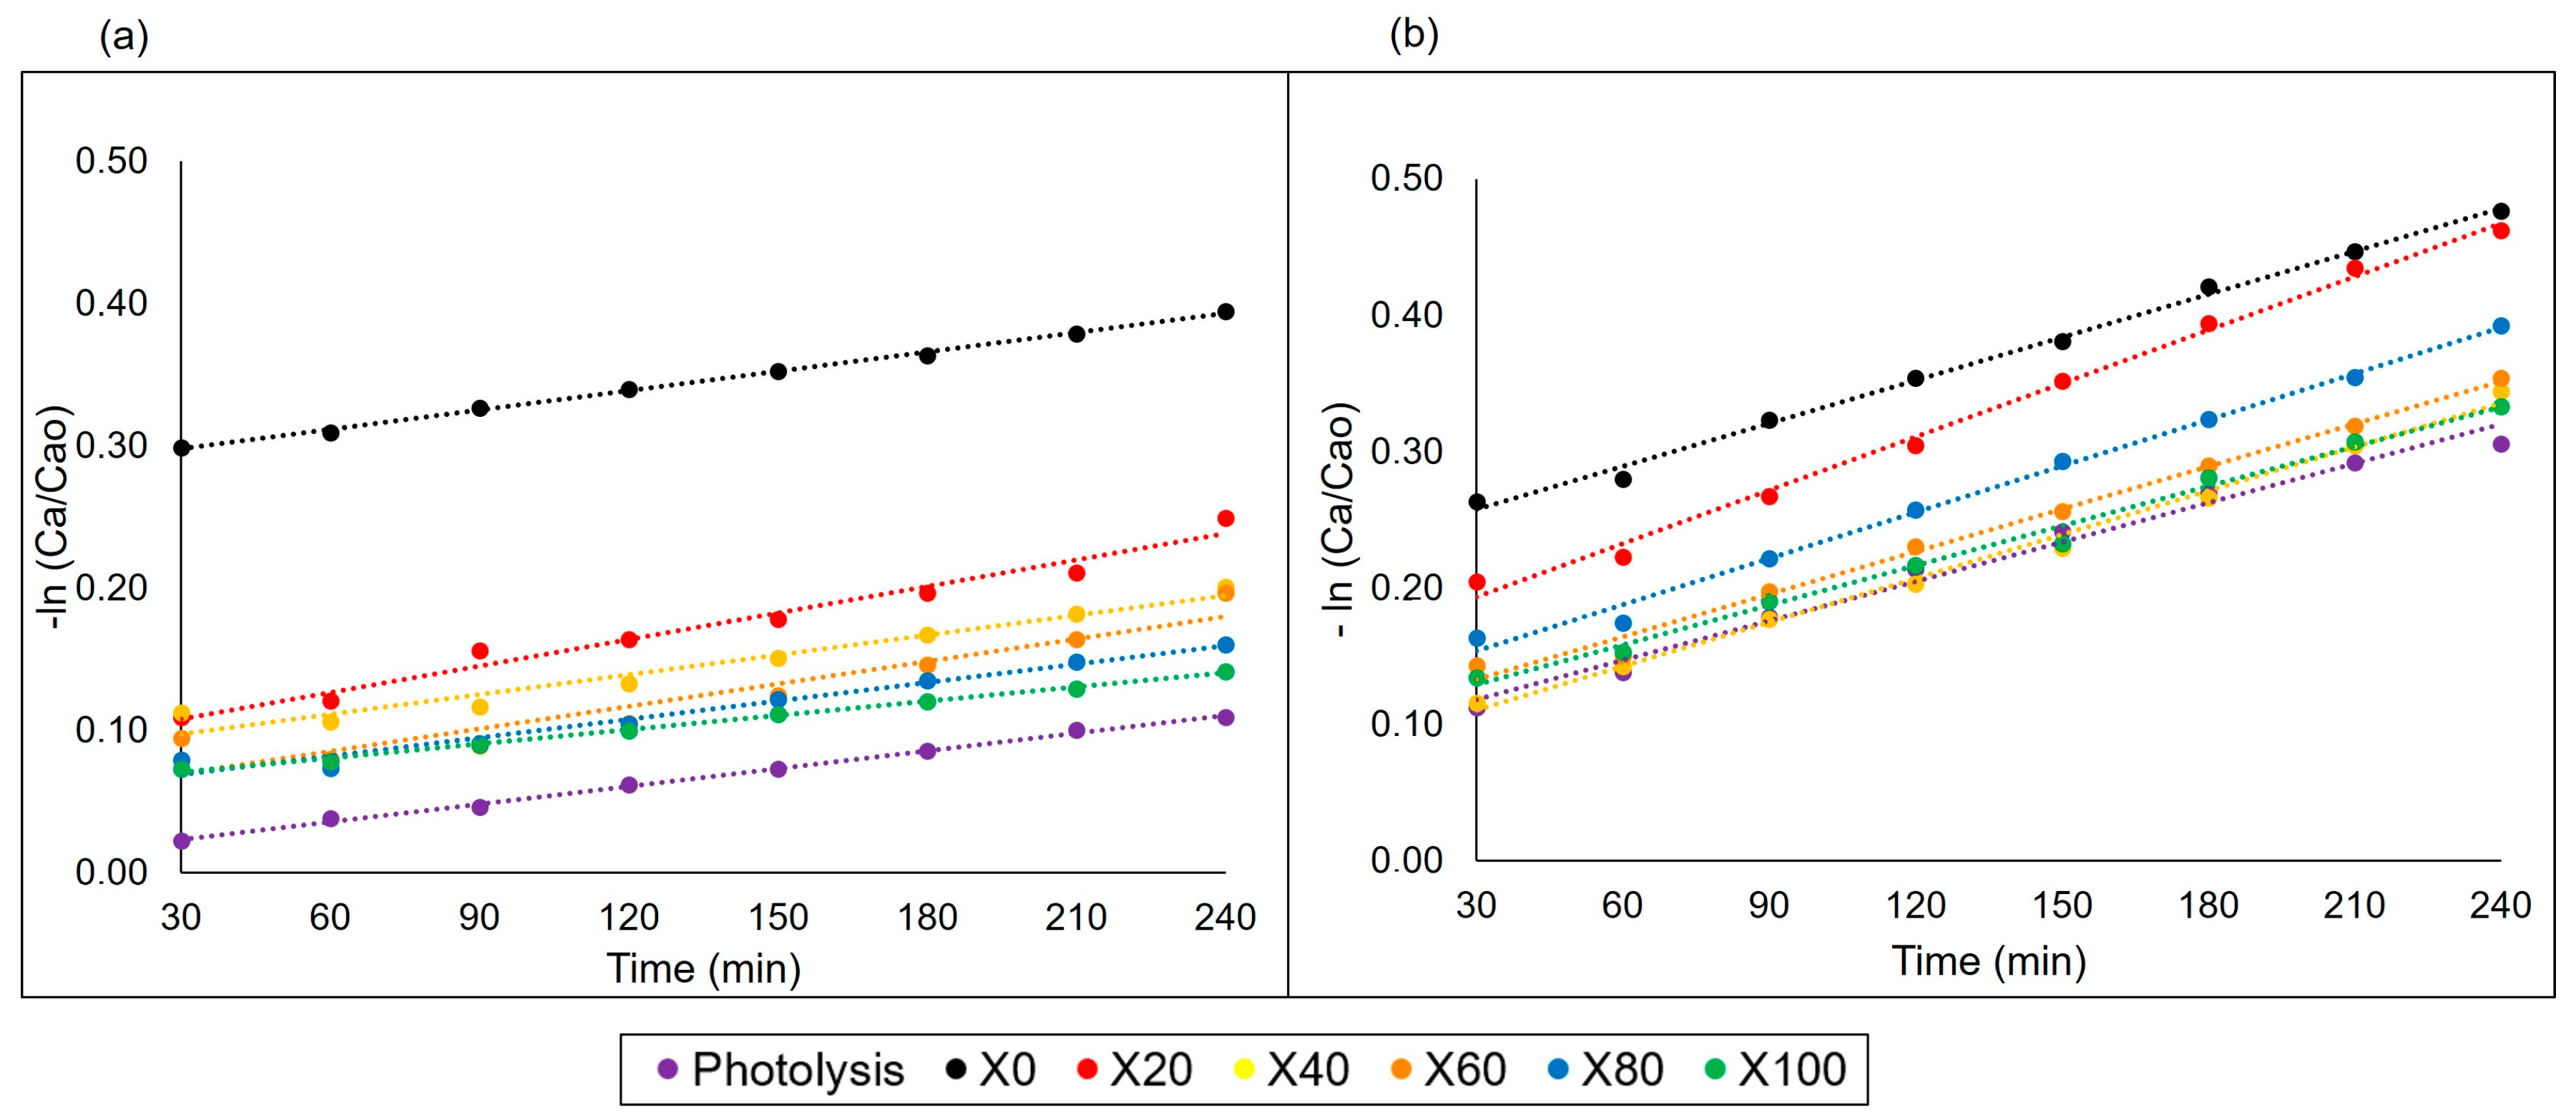
| Photolysis | X0 | X20 | X40 | X60 | X80 | X100 | |
|---|---|---|---|---|---|---|---|
| k (min−1) pH = 6 | 0.00041 | 0.00045 | 0.00062 | 0.00046 | 0.00052 | 0.00043 | 0.00033 |
| k (min−1) pH = 10 | 0.00096 | 0.00105 | 0.00131 | 0.00107 | 0.00104 | 0.00113 | 0.00097 |
Disclaimer/Publisher’s Note: The statements, opinions and data contained in all publications are solely those of the individual author(s) and contributor(s) and not of MDPI and/or the editor(s). MDPI and/or the editor(s) disclaim responsibility for any injury to people or property resulting from any ideas, methods, instructions or products referred to in the content. |
© 2024 by the authors. Licensee MDPI, Basel, Switzerland. This article is an open access article distributed under the terms and conditions of the Creative Commons Attribution (CC BY) license (https://creativecommons.org/licenses/by/4.0/).
Share and Cite
Diniz Dias de Azevedo, I.G.; Morales Torres, M.A.; Pereira de Souza, C.; Lopes Moriyama, A.L. Dyes Degradation Using Cooper-Nickel Ferrite and Its Tunable Structural and Photocatalytic Properties. Catalysts 2024, 14, 73. https://doi.org/10.3390/catal14010073
Diniz Dias de Azevedo IG, Morales Torres MA, Pereira de Souza C, Lopes Moriyama AL. Dyes Degradation Using Cooper-Nickel Ferrite and Its Tunable Structural and Photocatalytic Properties. Catalysts. 2024; 14(1):73. https://doi.org/10.3390/catal14010073
Chicago/Turabian StyleDiniz Dias de Azevedo, Ila Gabriele, Marco Antonio Morales Torres, Carlson Pereira de Souza, and André Luis Lopes Moriyama. 2024. "Dyes Degradation Using Cooper-Nickel Ferrite and Its Tunable Structural and Photocatalytic Properties" Catalysts 14, no. 1: 73. https://doi.org/10.3390/catal14010073
APA StyleDiniz Dias de Azevedo, I. G., Morales Torres, M. A., Pereira de Souza, C., & Lopes Moriyama, A. L. (2024). Dyes Degradation Using Cooper-Nickel Ferrite and Its Tunable Structural and Photocatalytic Properties. Catalysts, 14(1), 73. https://doi.org/10.3390/catal14010073