
Interaction of O2 with Reduced Ceria Nanoparticles at 100–400 K: Fast Oxidation of Ce3+ Ions and Dissolved H2


Abstract
1. Introduction
2. Results
2.1. Initial Characterization of the Samples
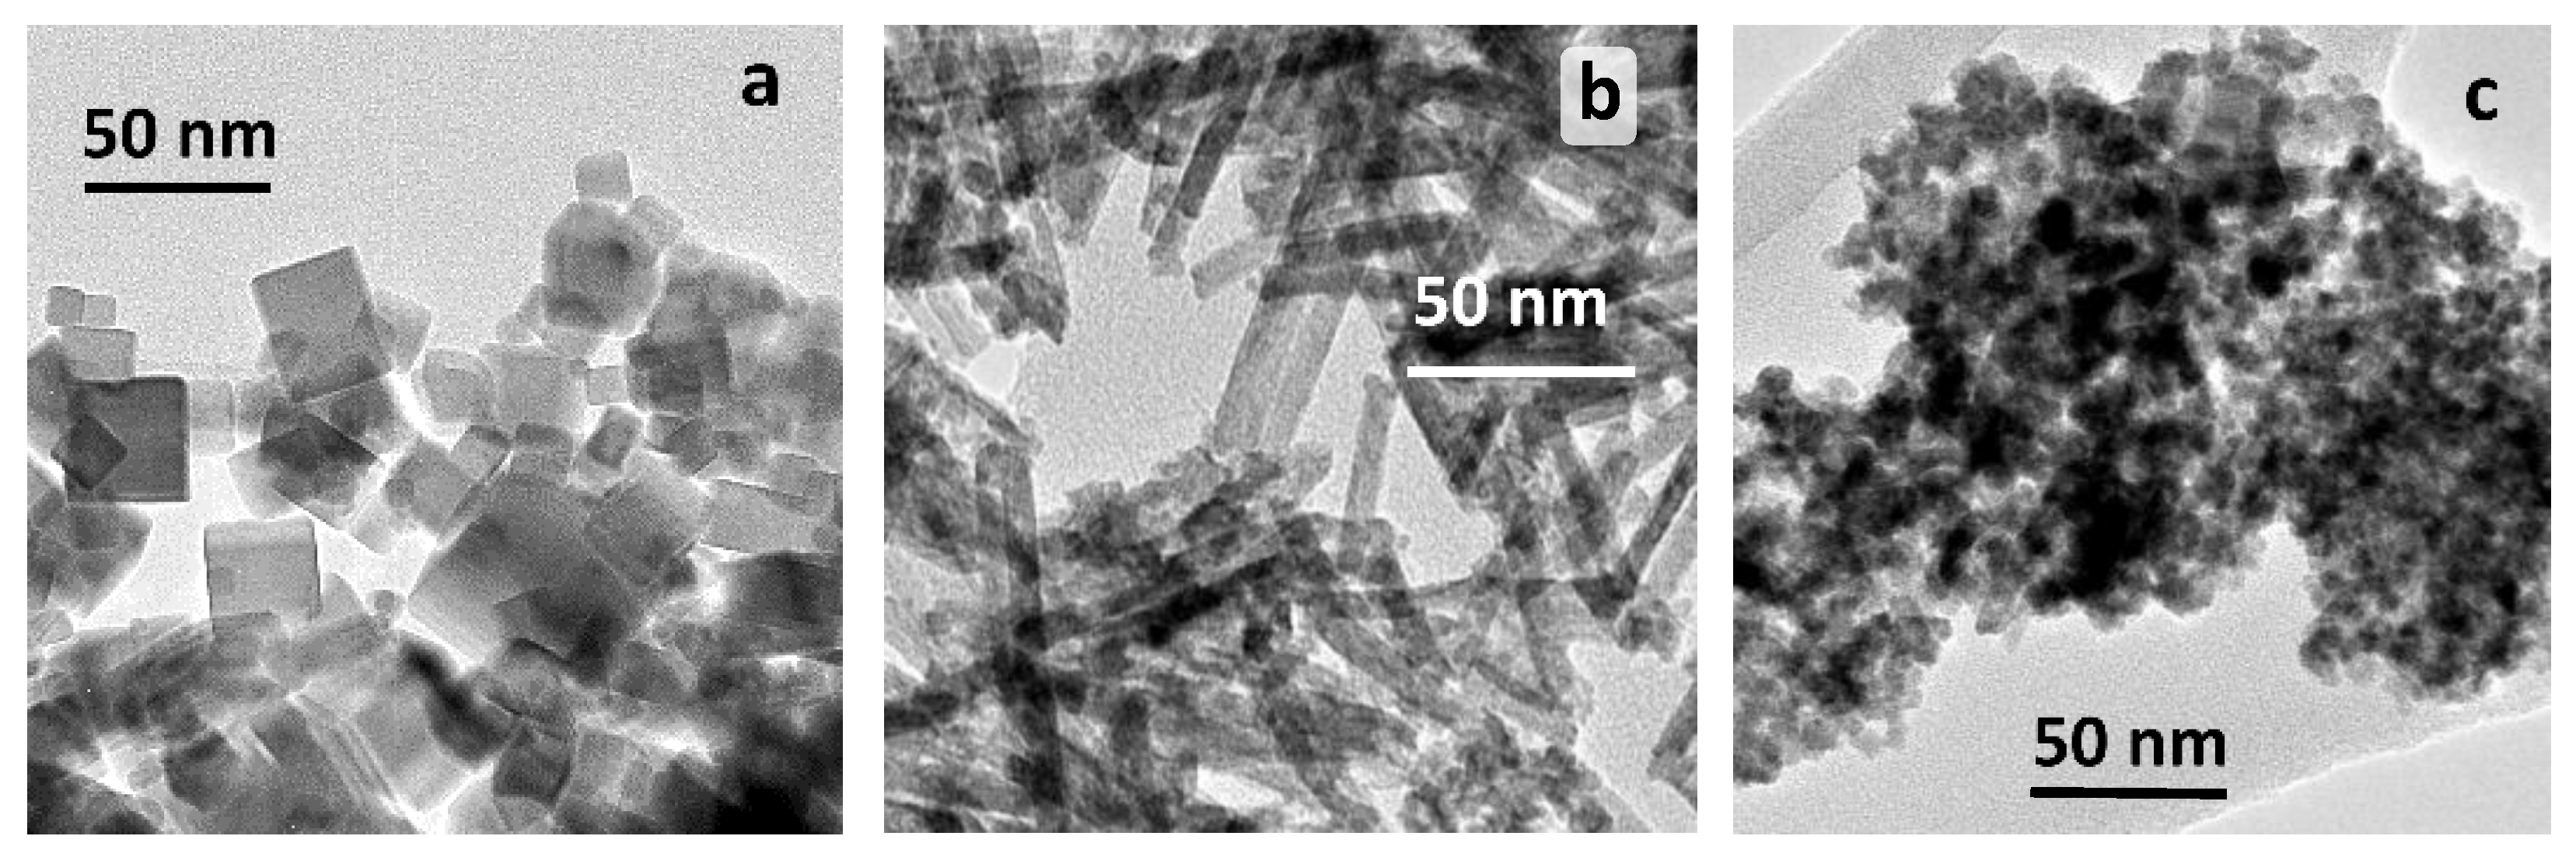
2.1.1. TEM Studies
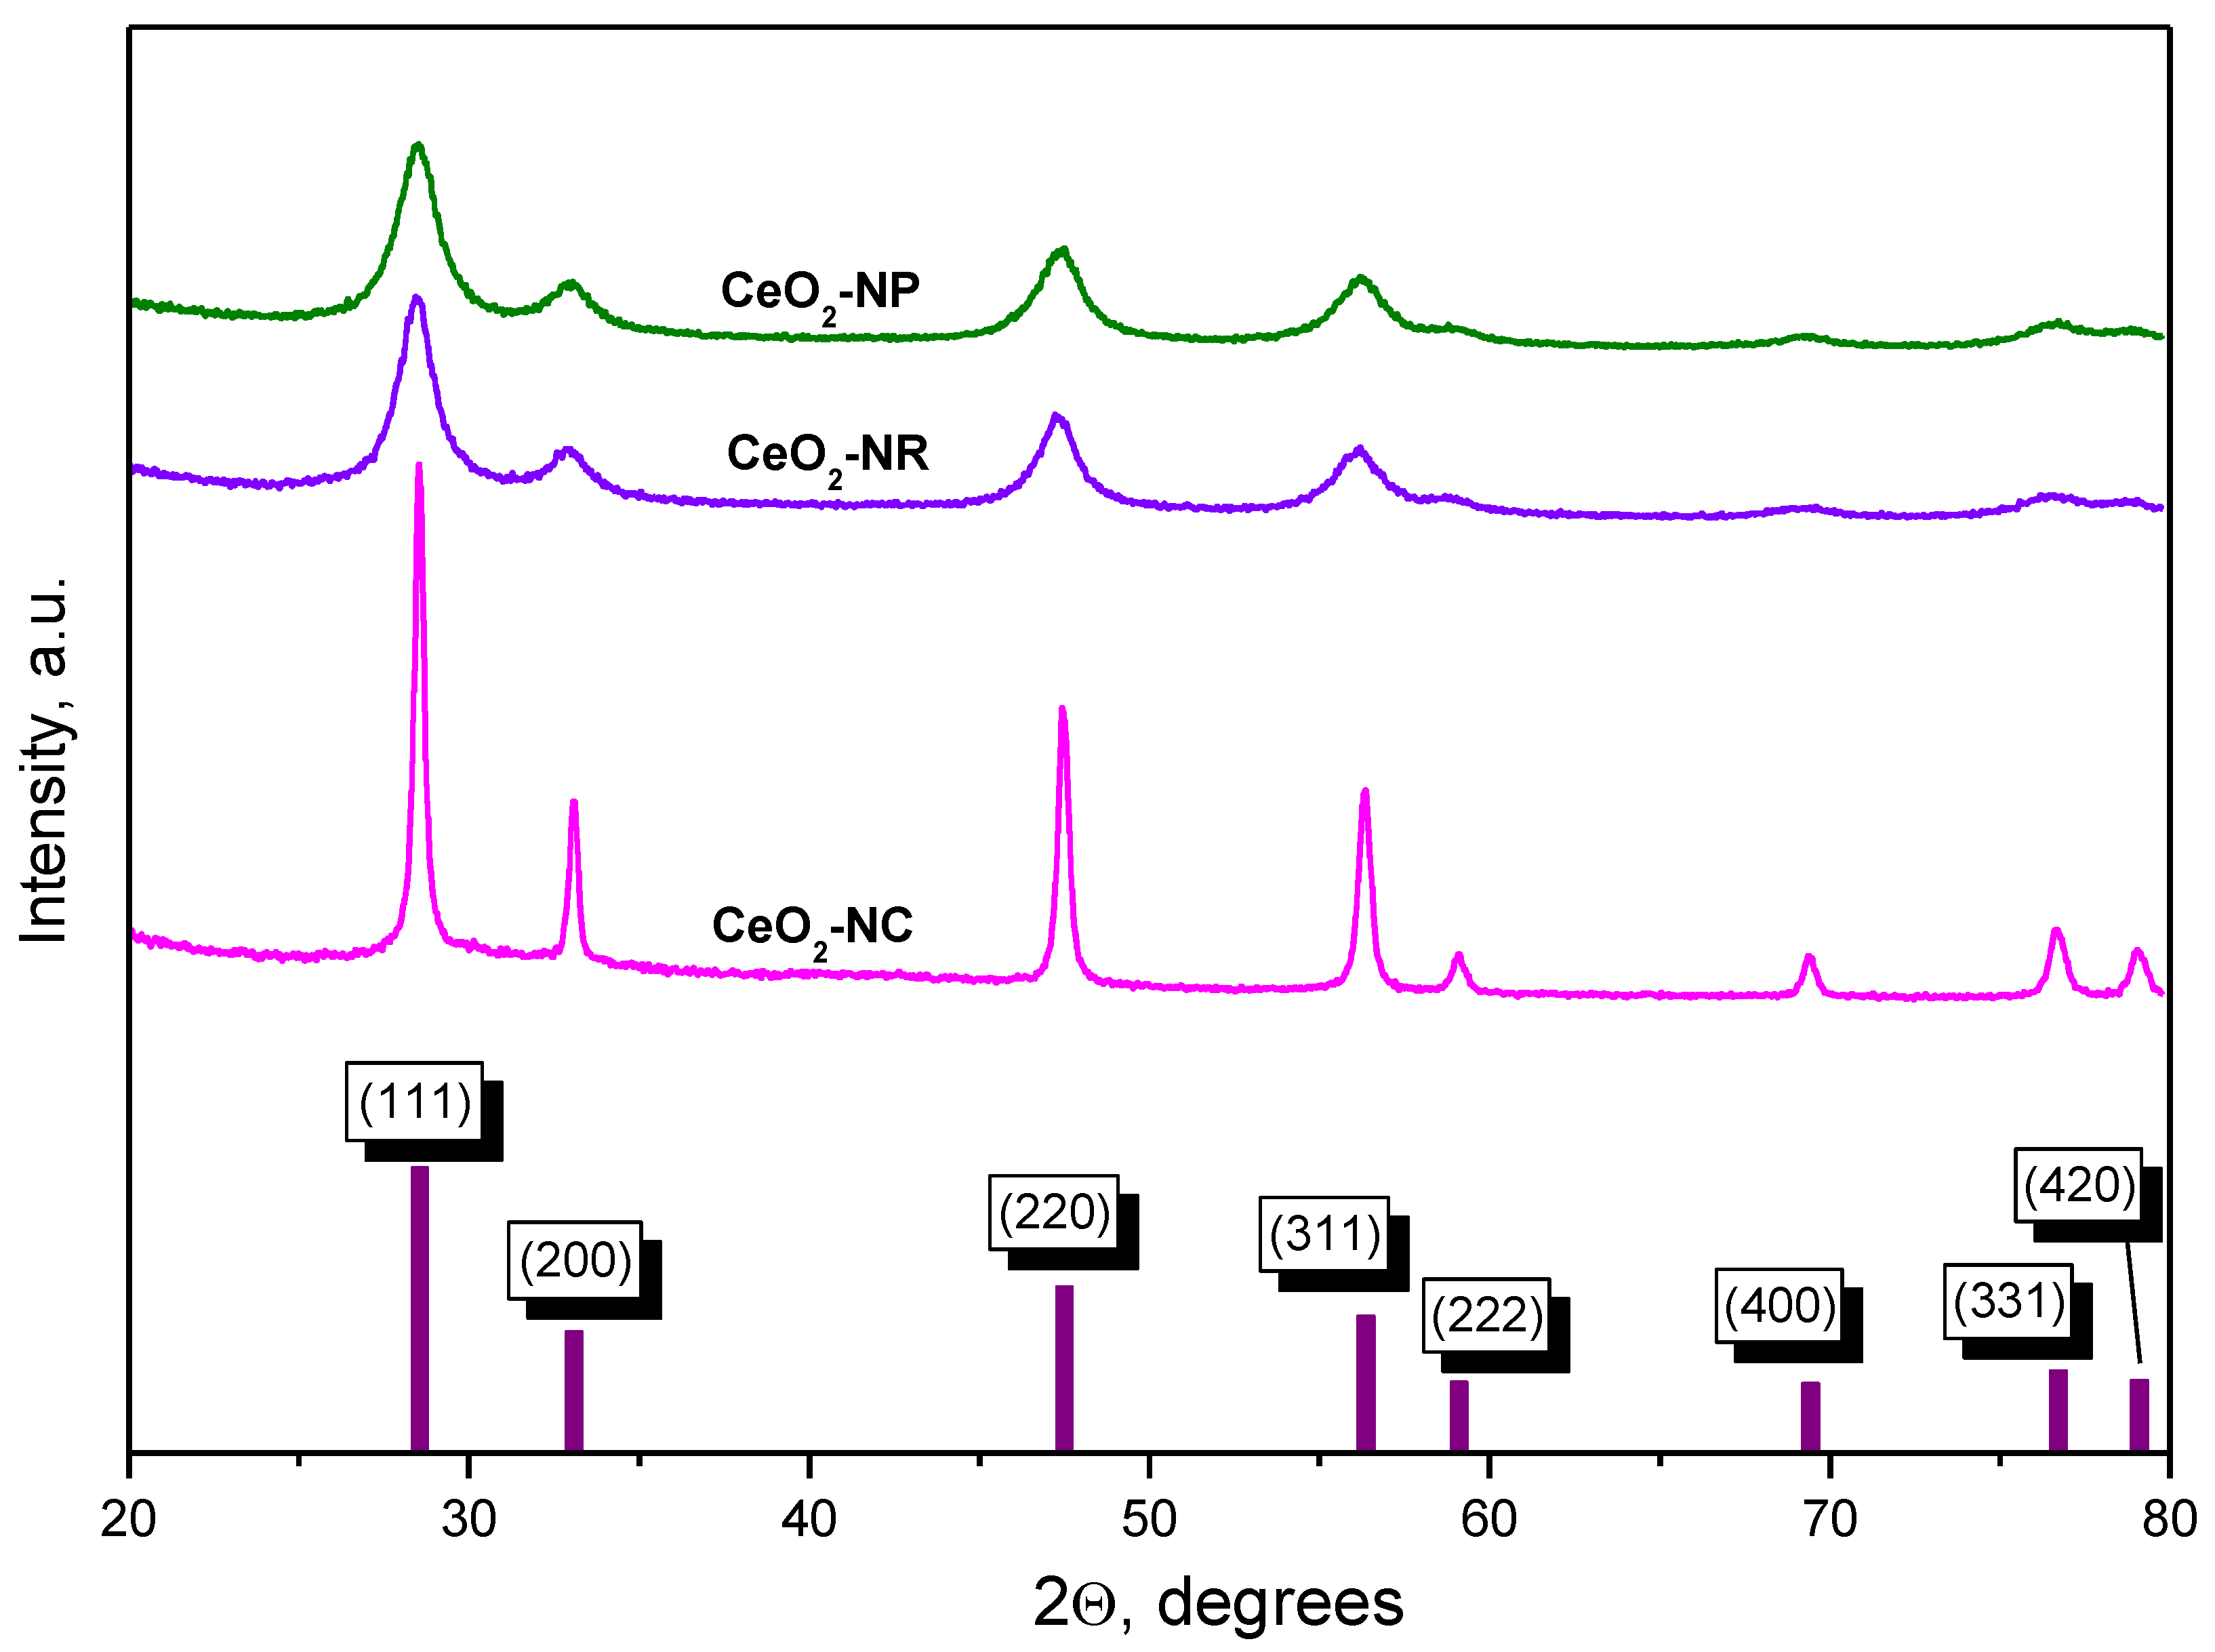
2.1.2. XRD Studies
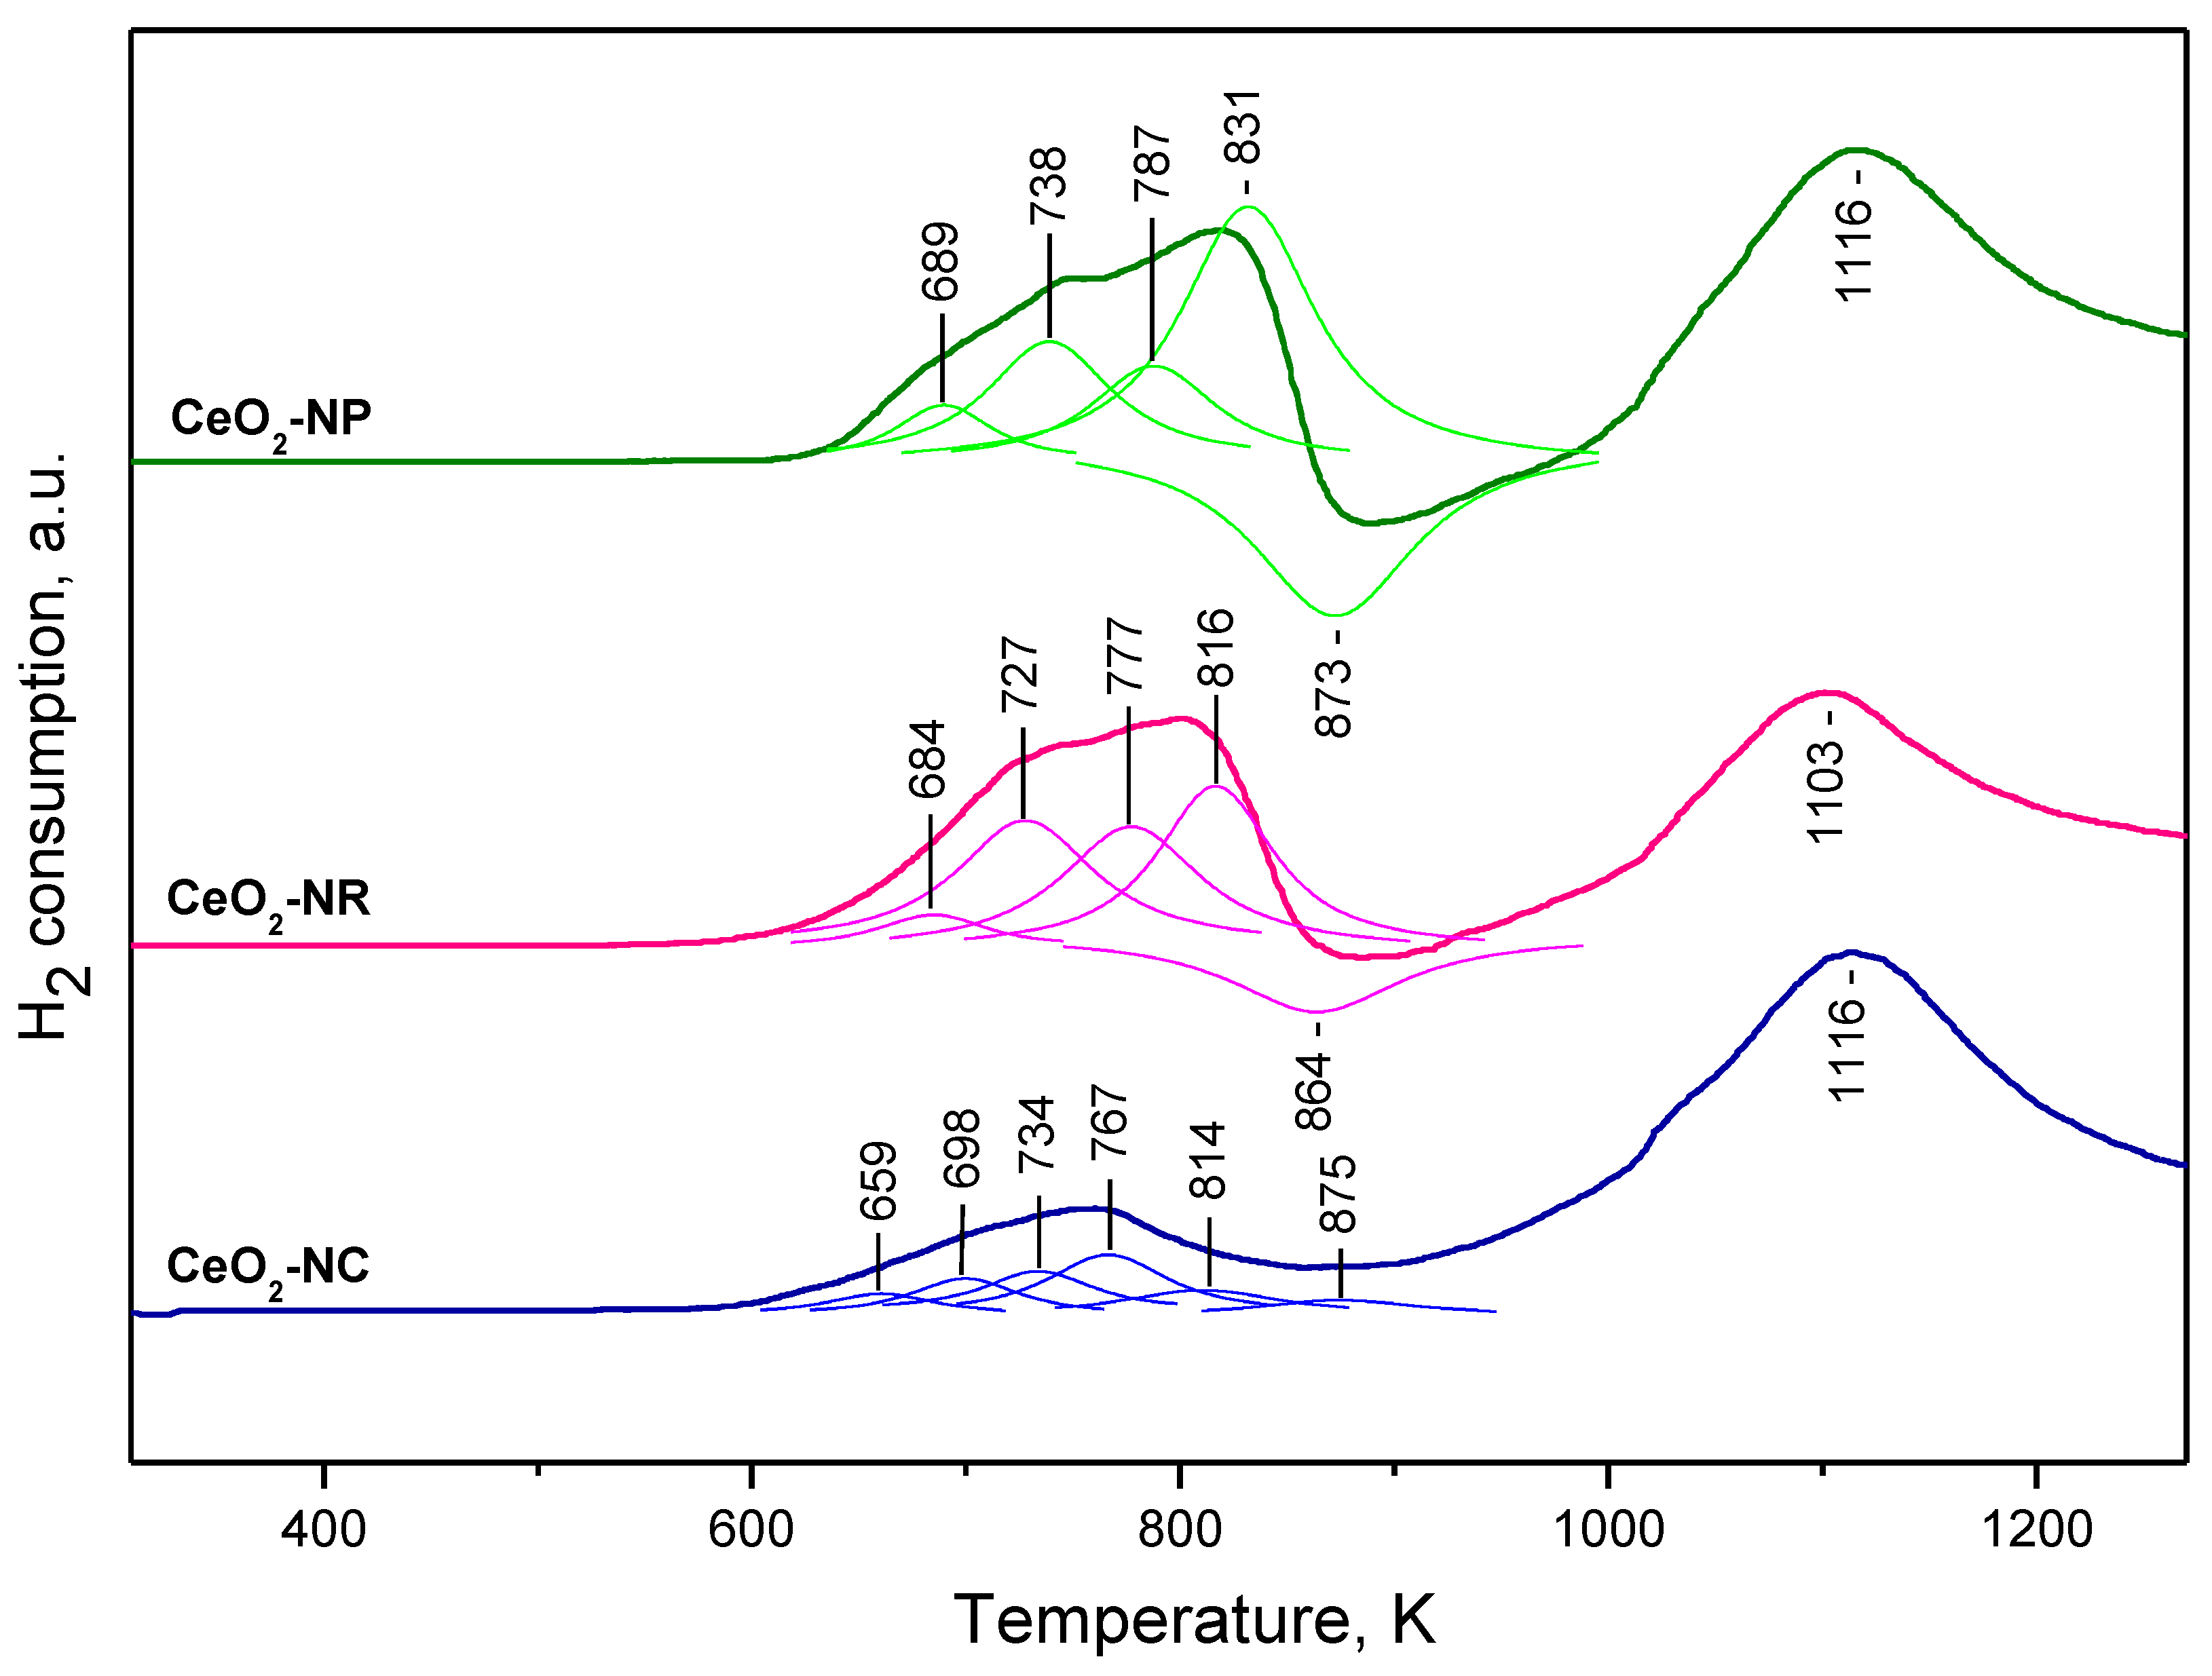
2.1.3. TPR Studies
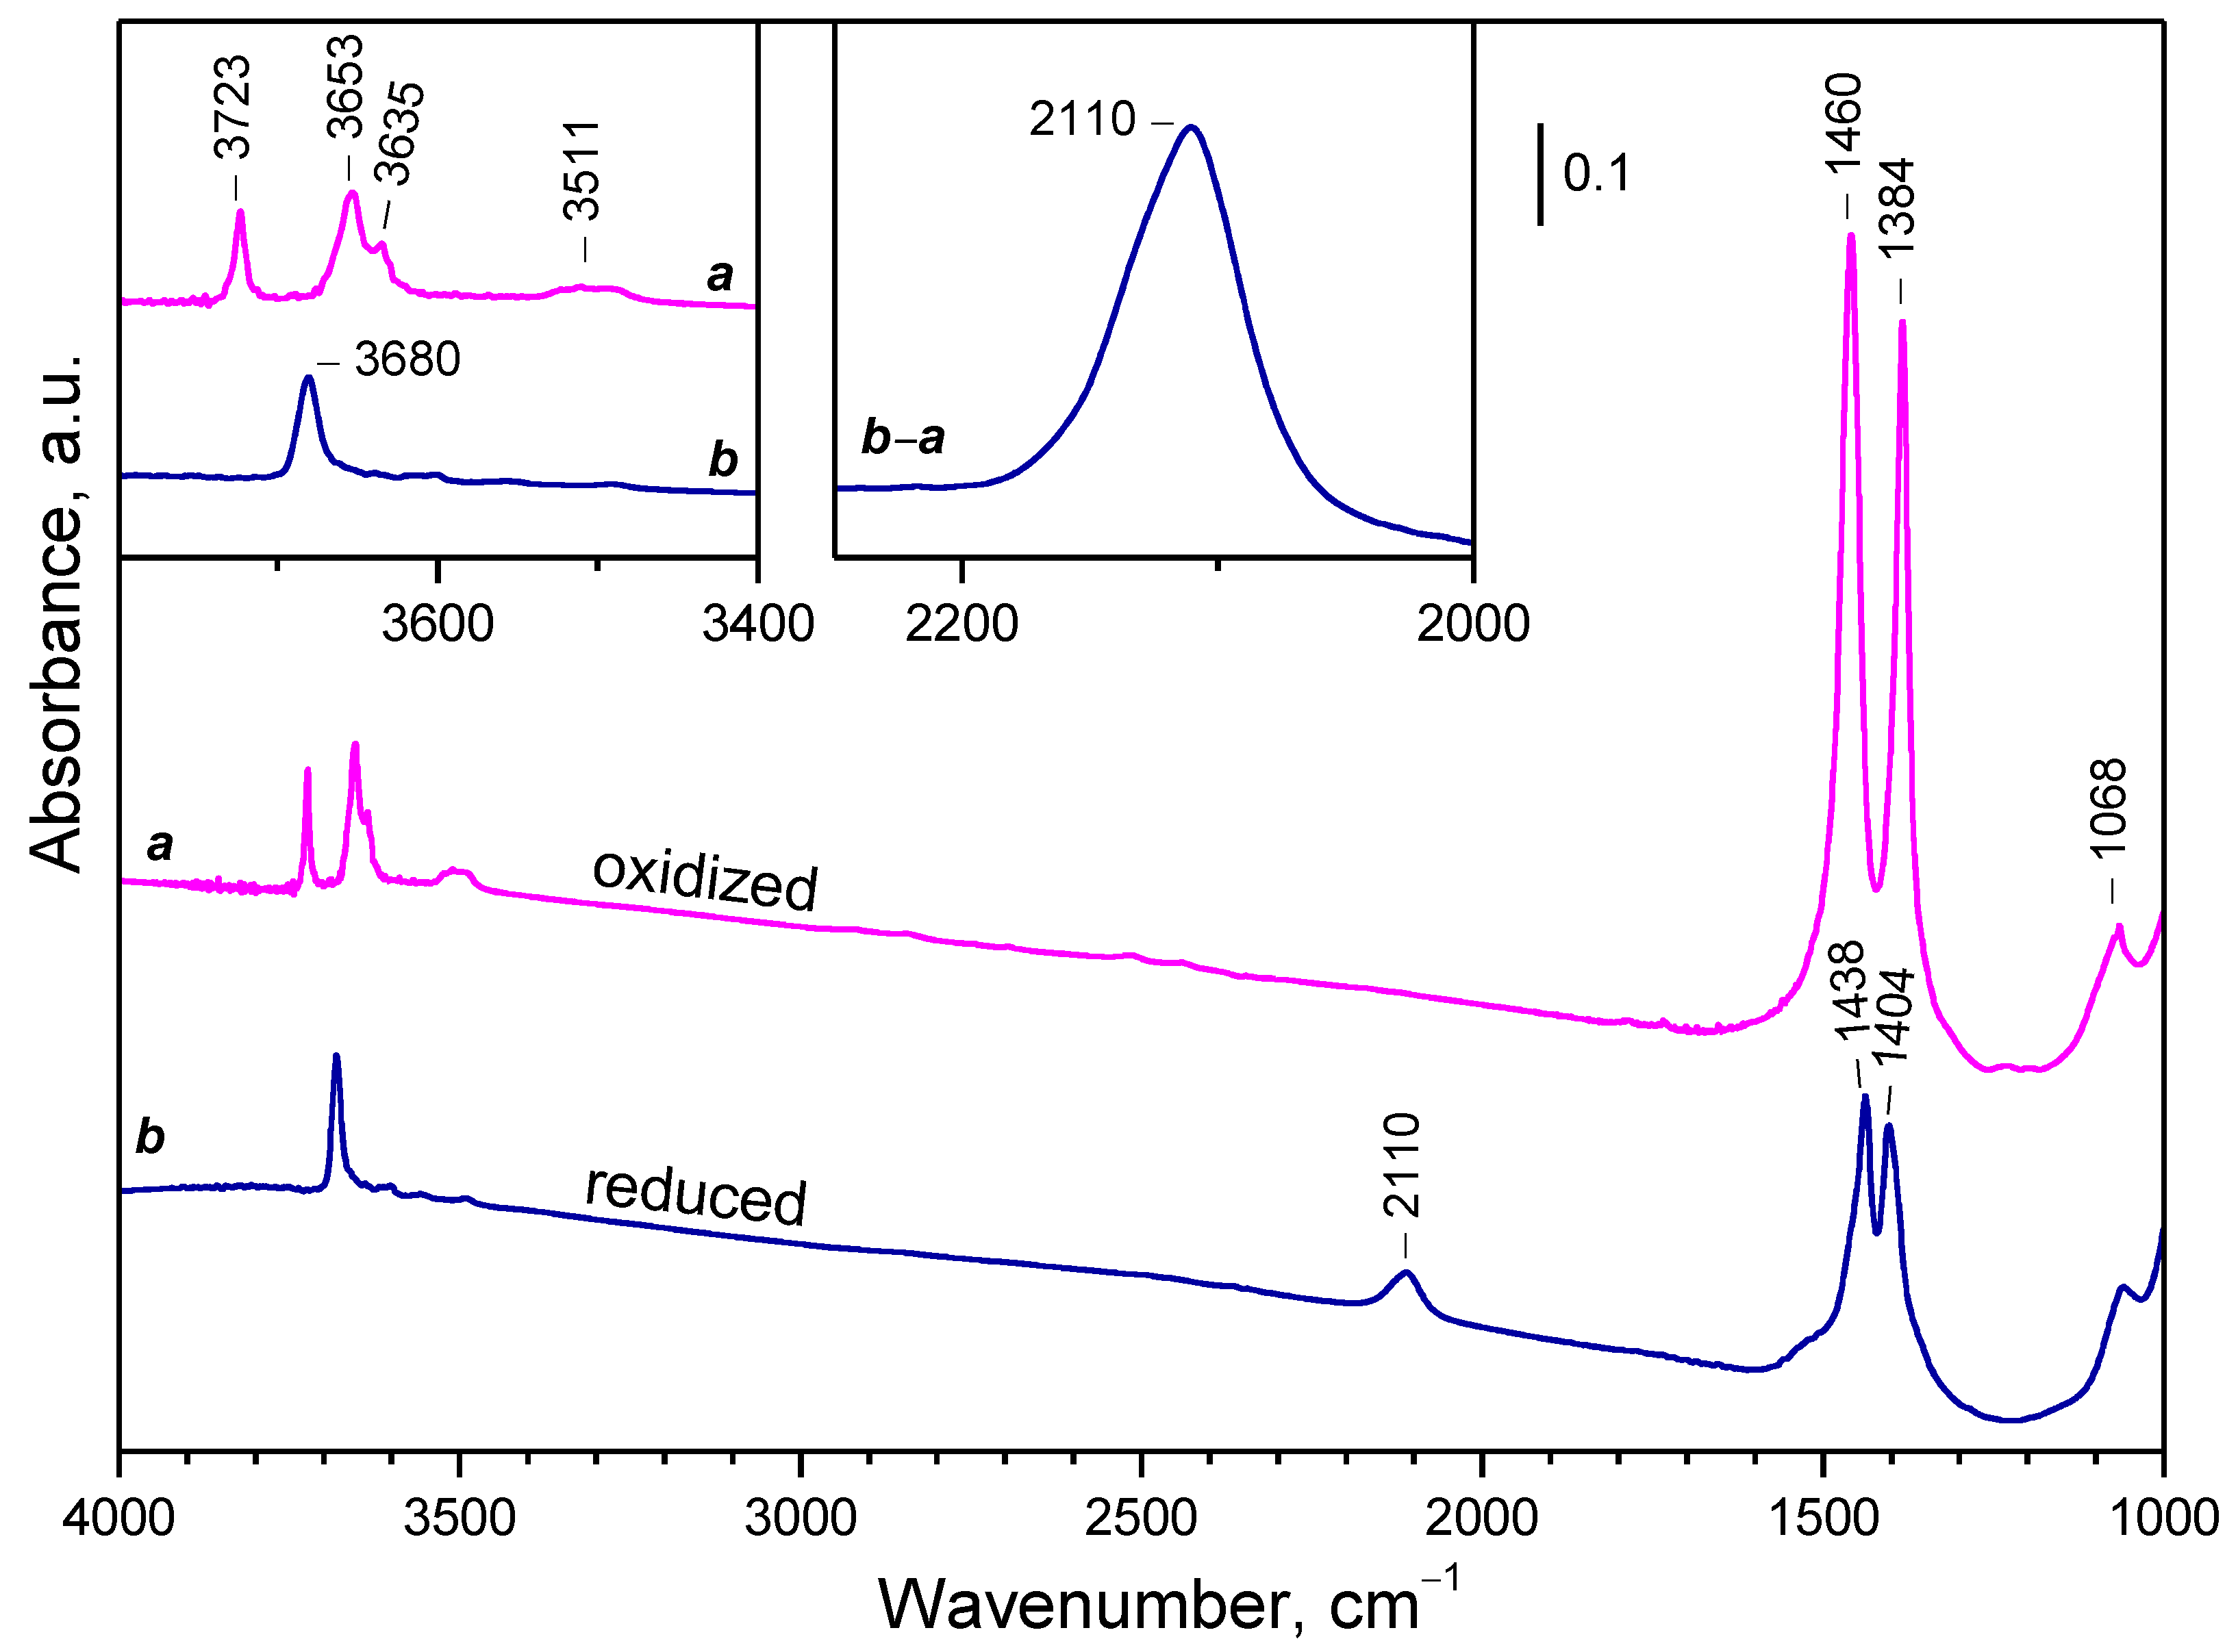
2.2. Background IR Spectra of Oxidized and Reduced Samples
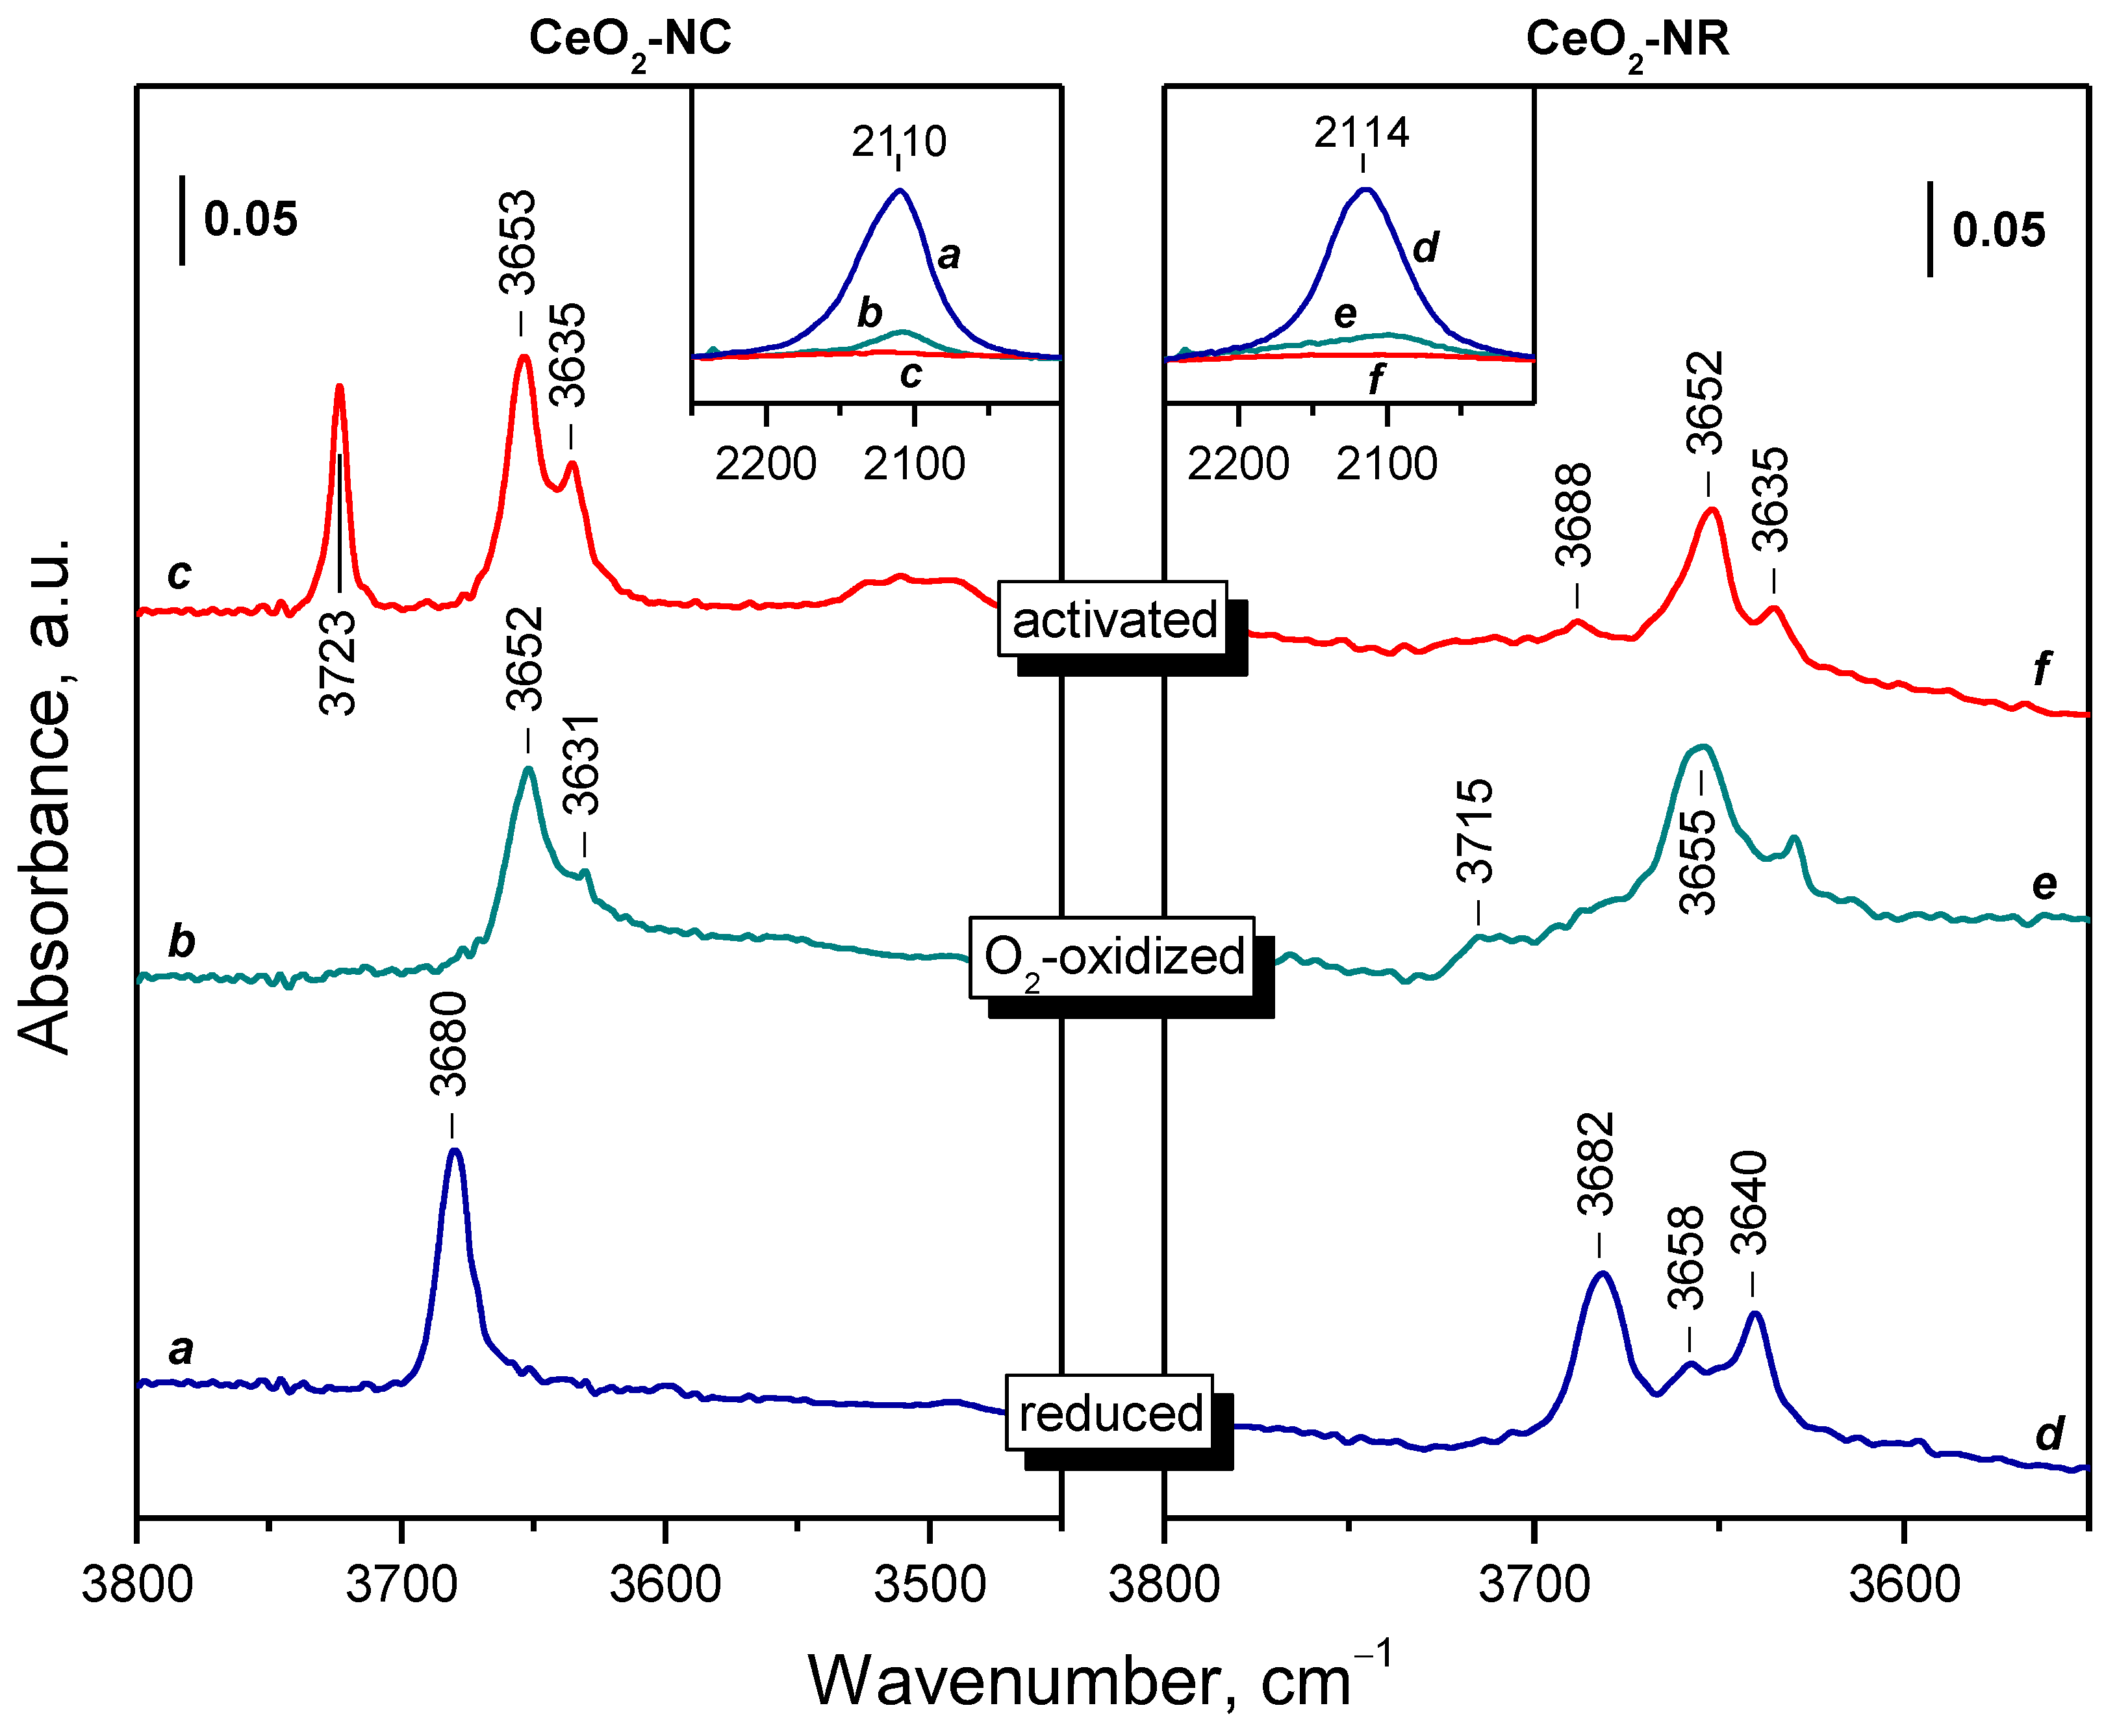
2.2.1. CeO2-NC
2.2.2. CeO2-NR and CeO2-NP
2.2.3. Oxidation of Reduced Ceria by Different Reagents
2.2.4. Temperature Changes of the IR Spectra
2.3. Interaction of Activated Samples with O2 at Variable Temperatures
2.4. Interaction of Reduced CeO2-NC with O2 at Variable Temperature
2.4.1. Interaction with 16O2
2.4.2. Interaction with 18O2
2.4.3. Interaction of Hydroxylated CeO2-NC with 16O2
2.4.4. Interaction of CeO2-NC Reduced at Lower Temperatures with 16O2
2.5. Interaction of Reduced CeO2-NP with O2 at Variable Temperature
2.5.1. Interaction with 16O2
2.5.2. Interaction with 18O2
2.6. Interaction of Reduced CeO2-NR with O2 at Variable Temperature
2.7. Interaction of the Samples with Oxygen at Ambient Temperature
2.7.1. CeO2-NC
2.7.2. CeO2-NR
3. Discussion
3.1. Species Formed during Adsorption of O2 on Oxidized and Reduced Ceria
3.2. Ce3+ Sites Involved in Fast Oxidation
- Ce3+ cations that are fast oxidized at 100 K;
- Ce3+ cations fast oxidized between 100 and 293 K, and
- Ce3+ cations resist oxidation at 293 K but oxidize at slightly higher temperatures, up to 393 K.
3.3. Fine Structure of Ce3+ Band
3.4. Oxidation of Sorbed H2
4. Materials and Methods
4.1. Synthesis of the Samples
4.2. Gases
4.3. Methods
4.3.1. FTIR Spectroscopy
4.3.2. Temperature-Programmed Reduction
4.3.3. Transmission Electron Microscopy
4.3.4. X-ray Diffraction
4.3.5. BET Surface Area
5. Conclusions
- No autoreduction in Ce4+ to Ce3+ occurs during the evacuation of pure ceria nanoparticles at 573–773 K.
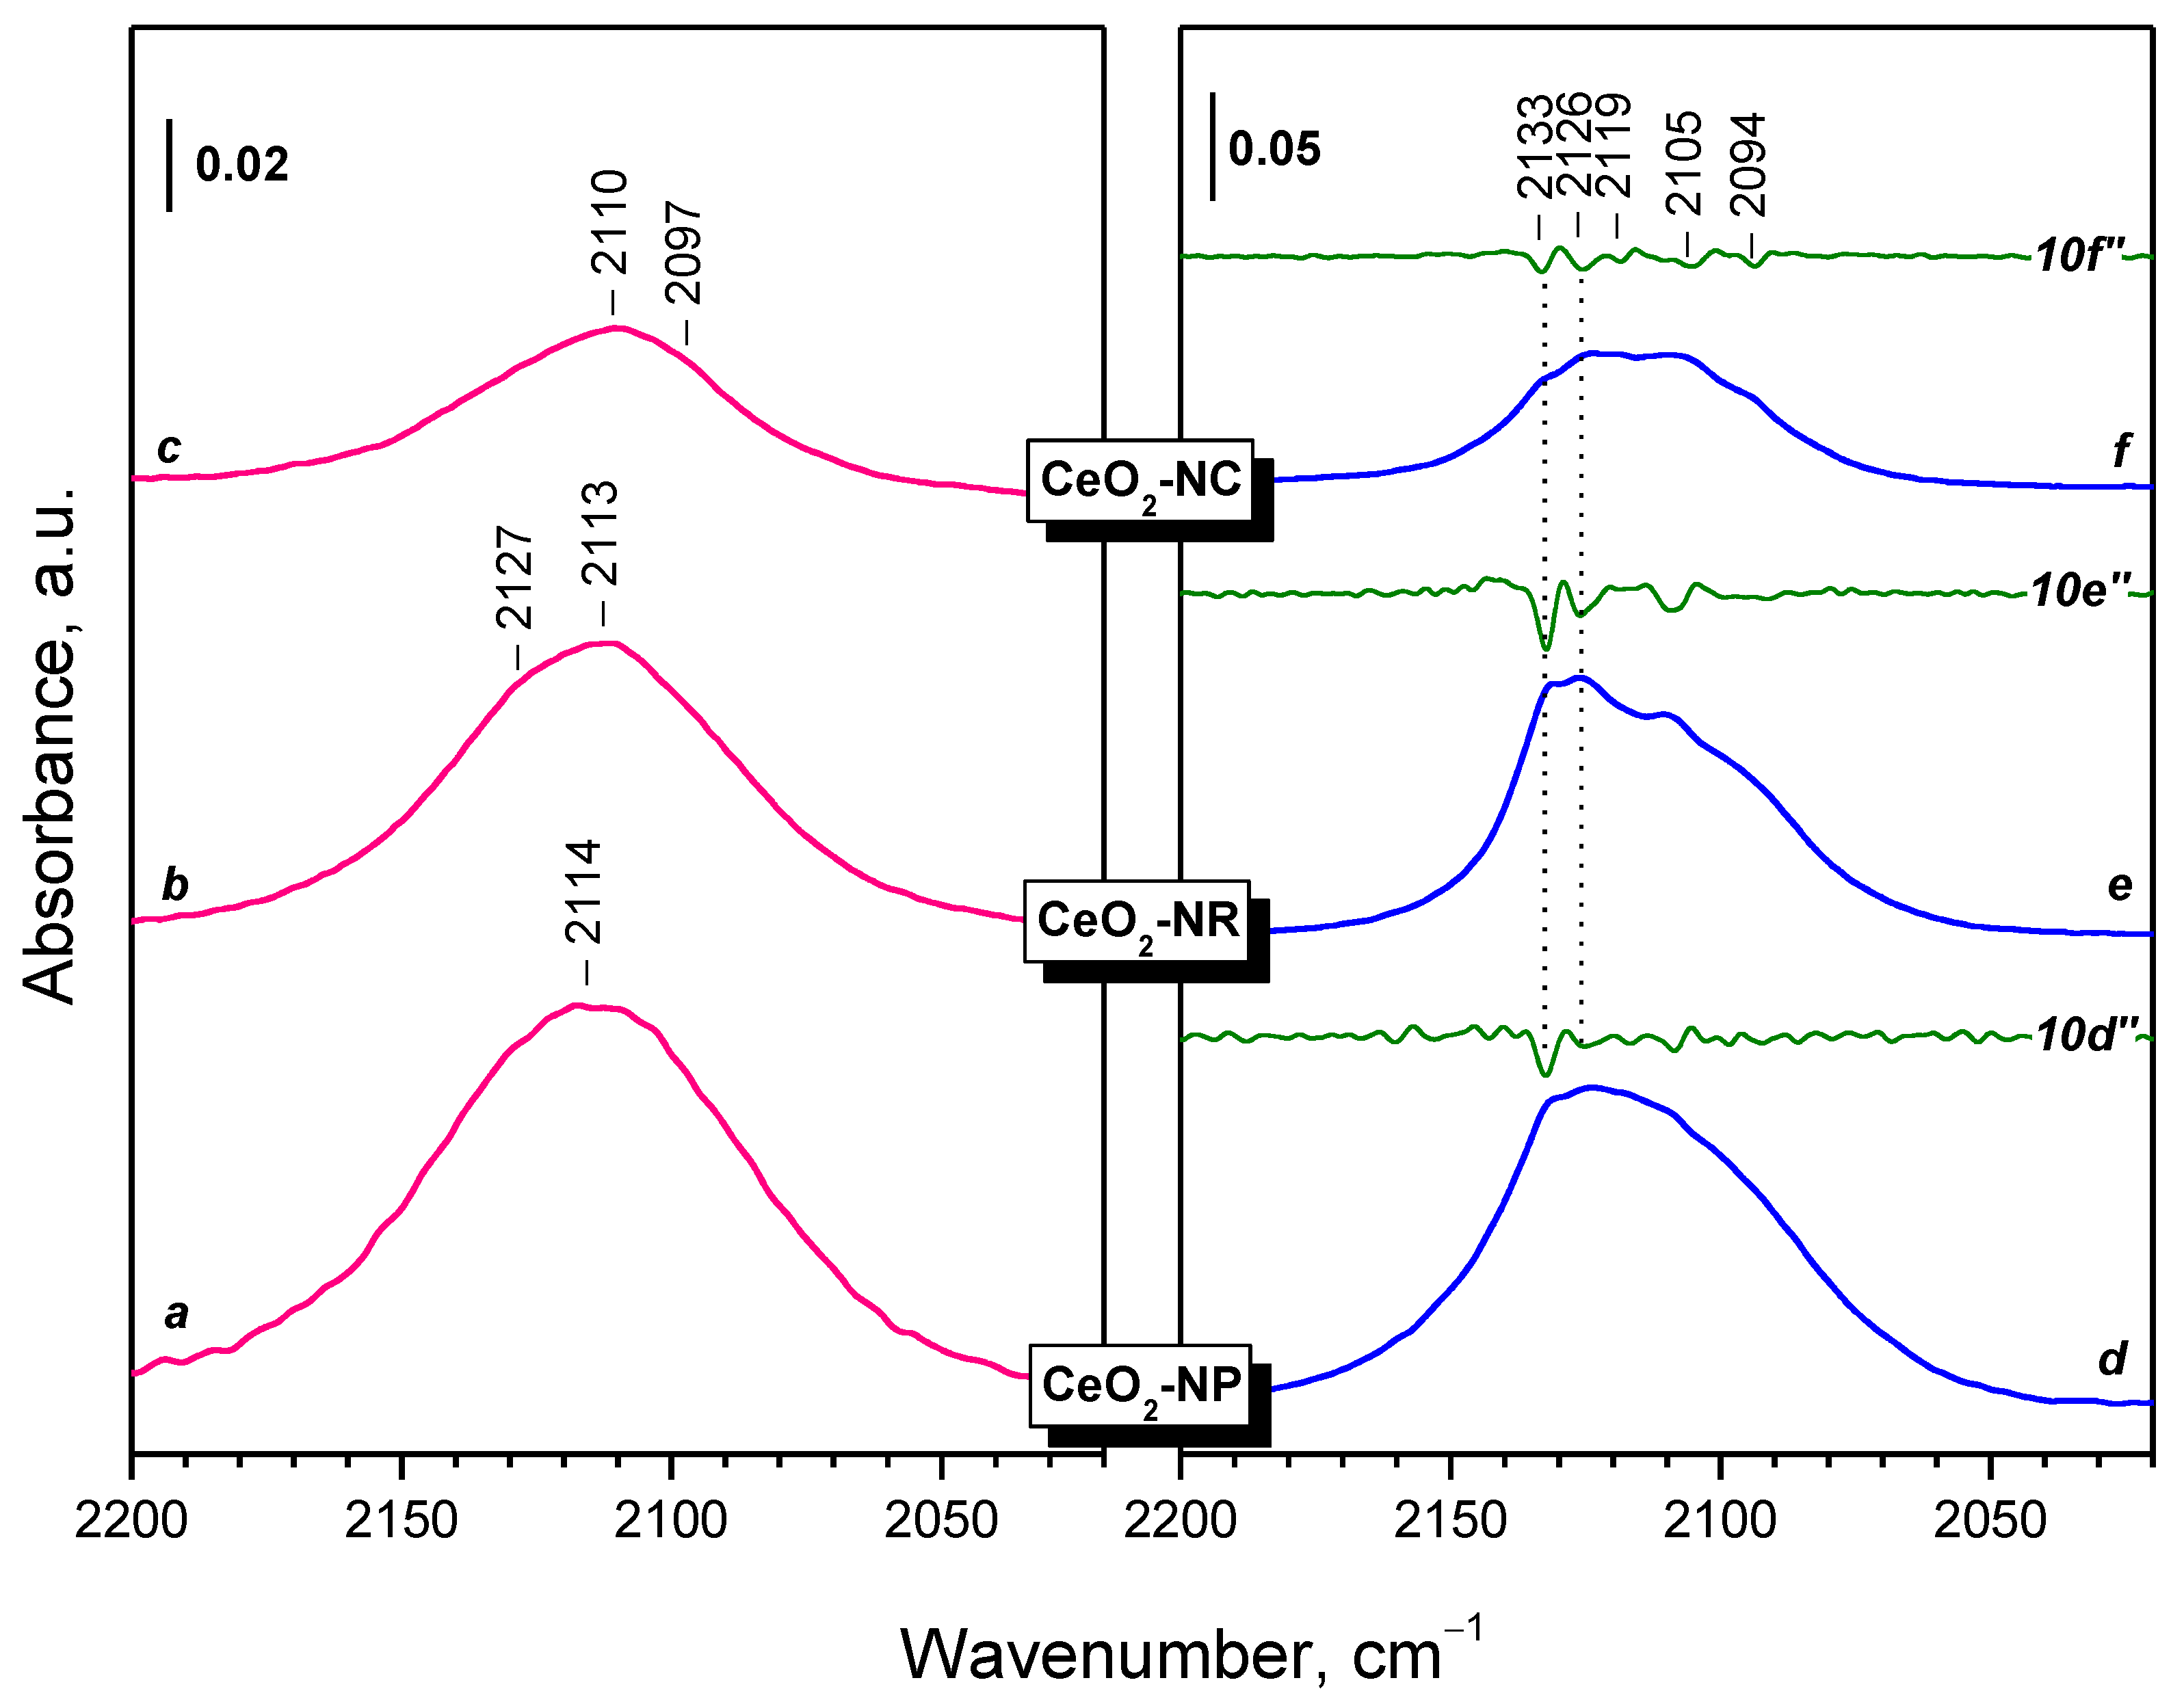
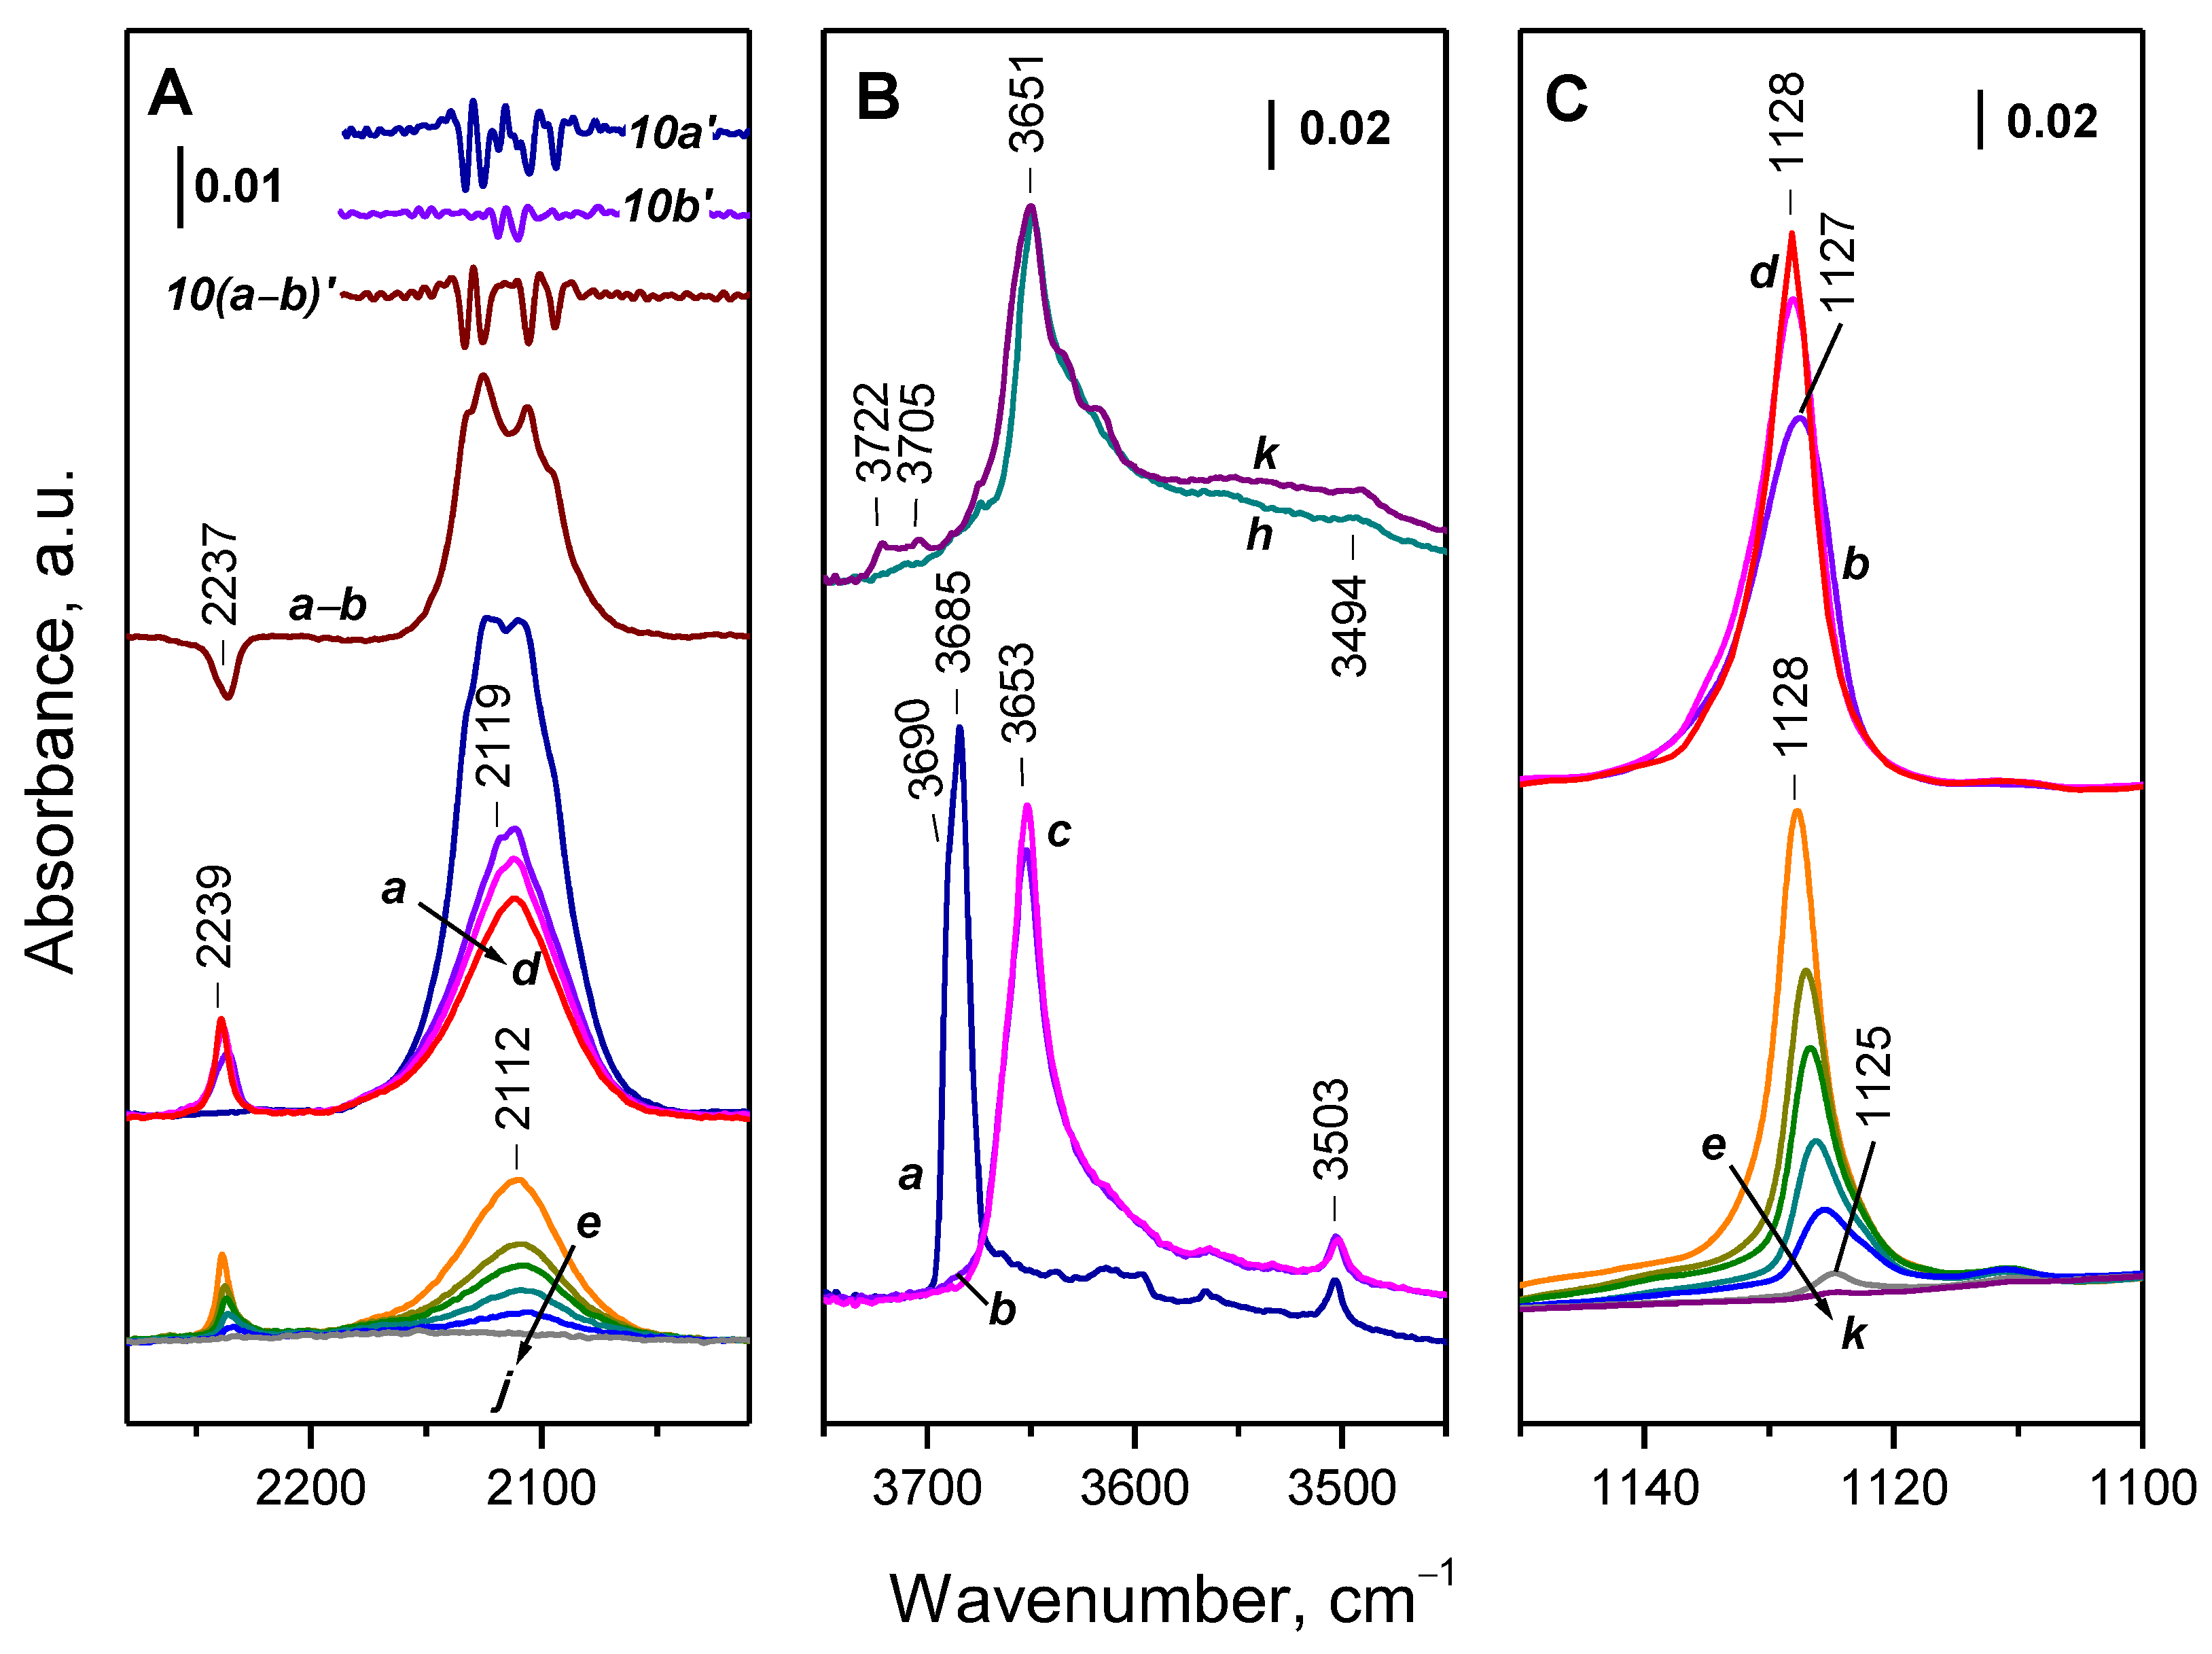
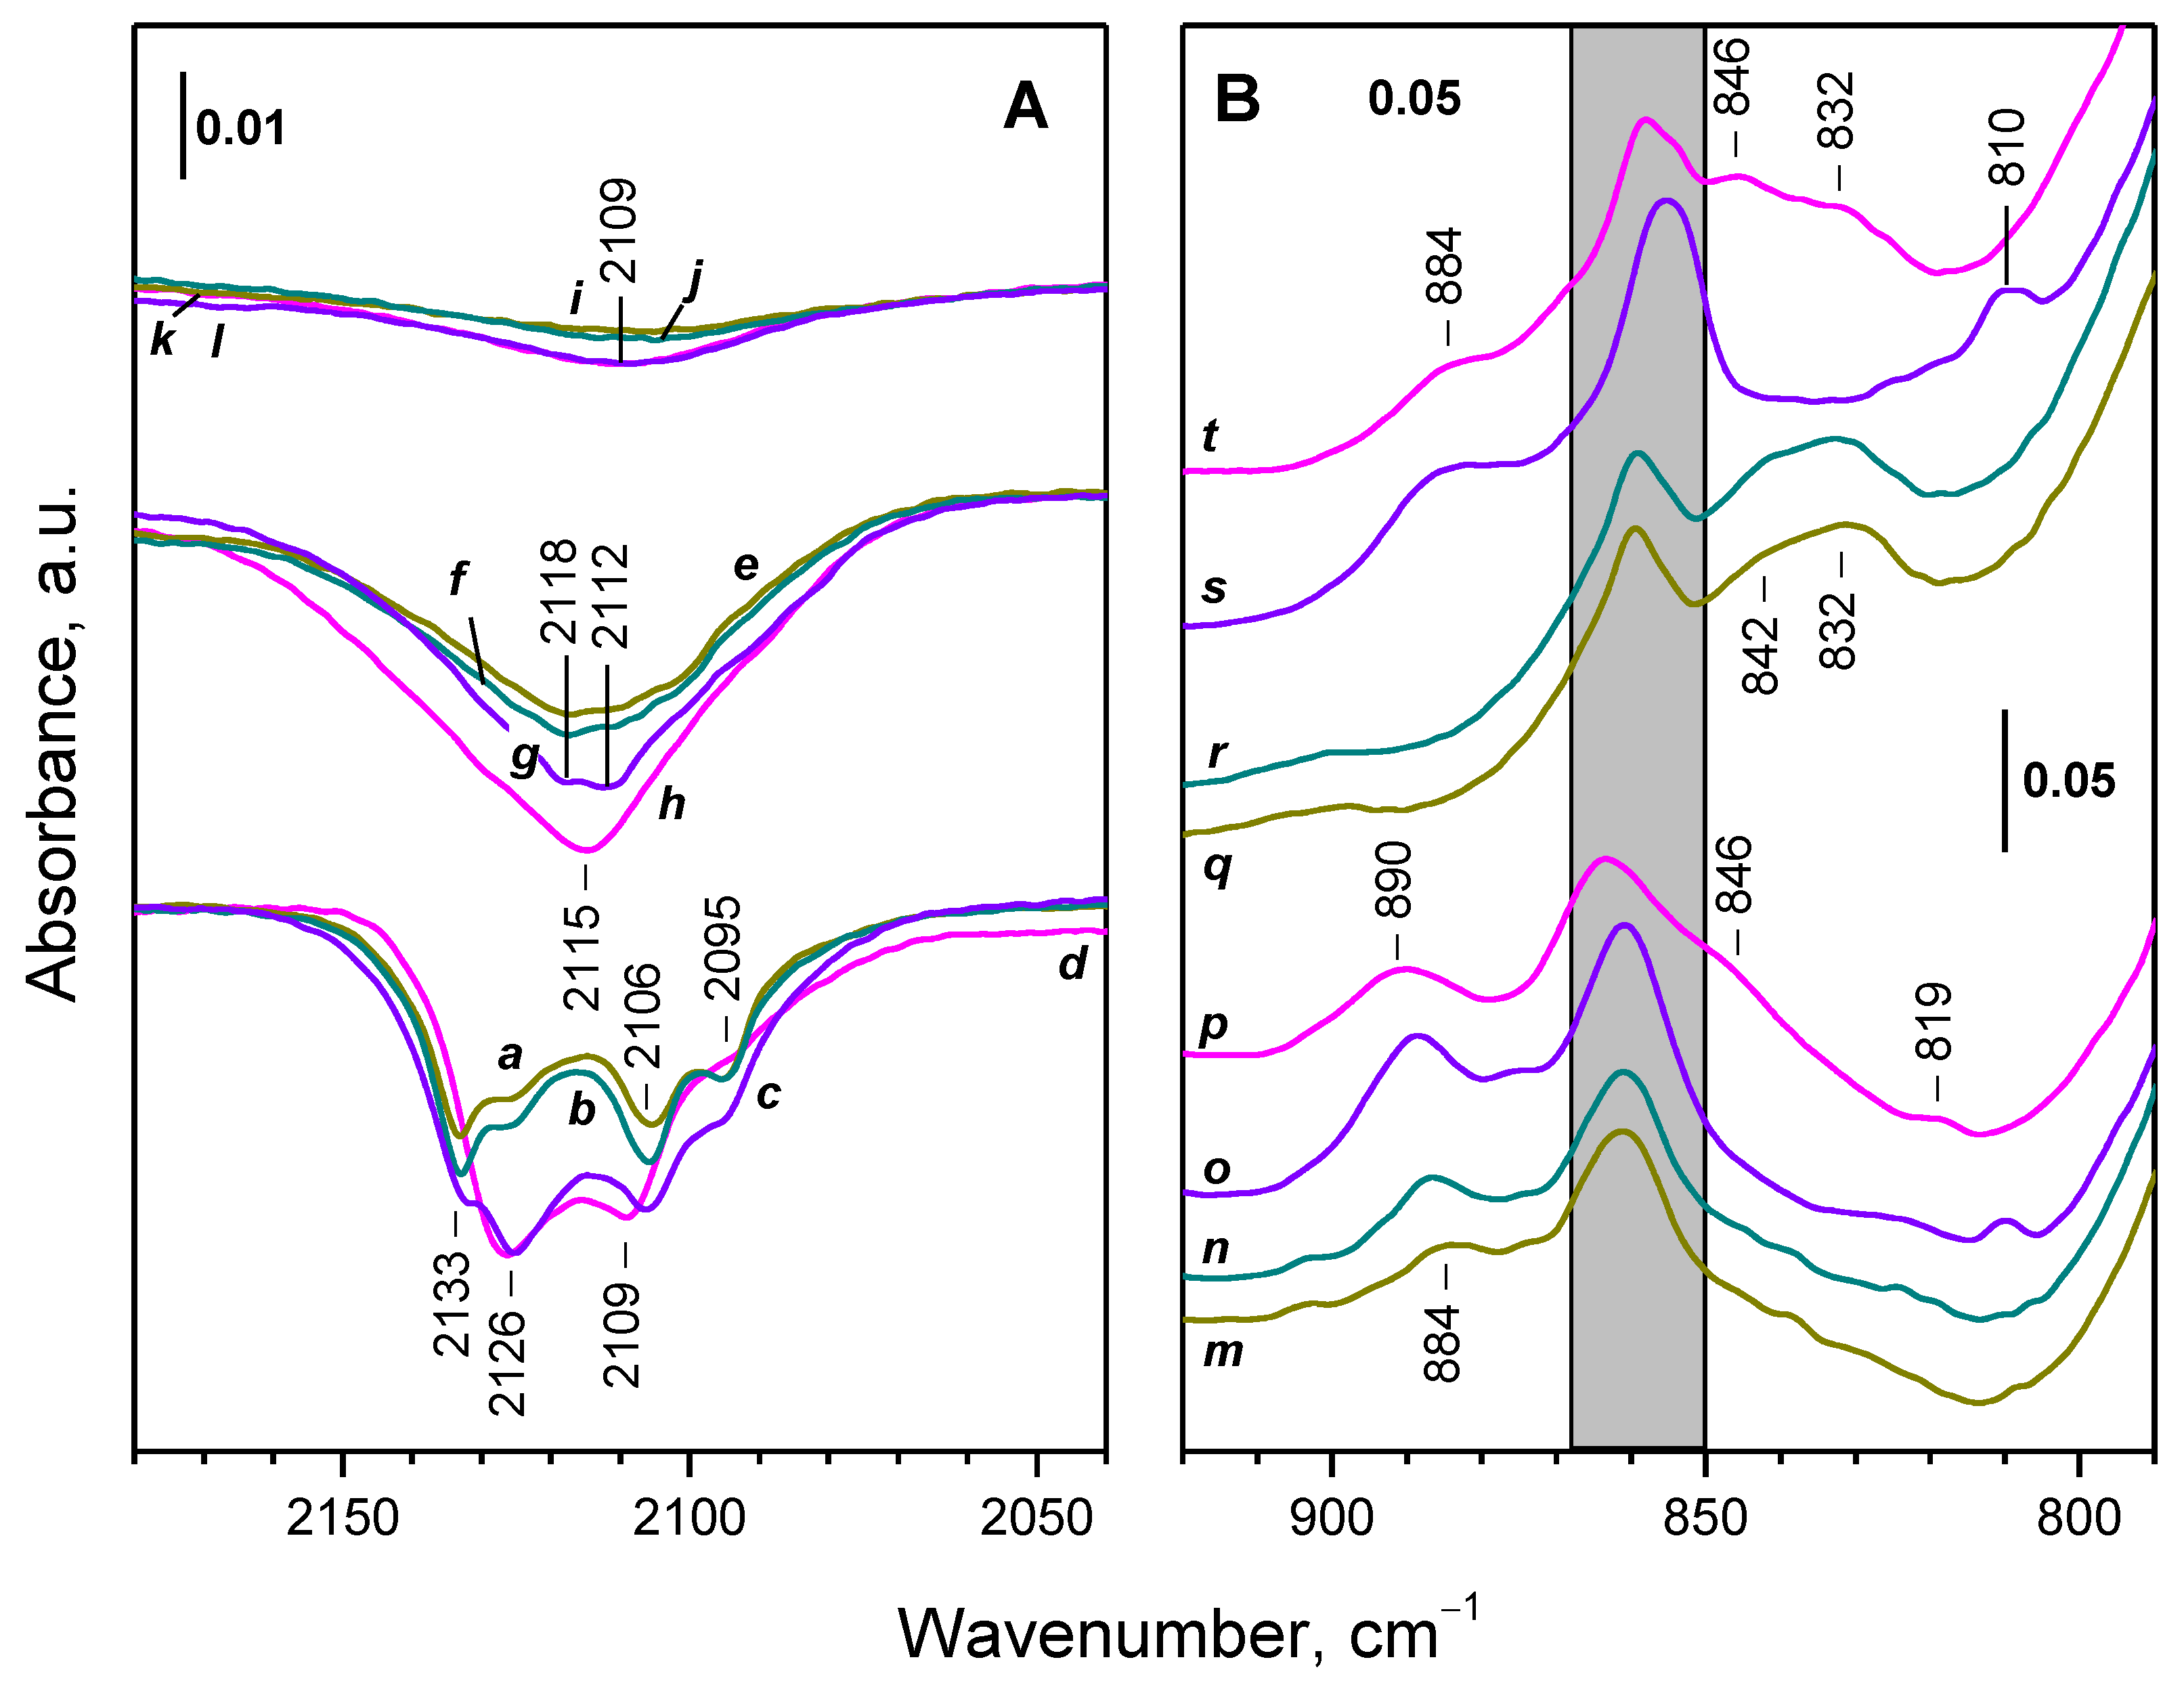
- Reduction in ceria with H2 at 773 K leads to the formation of Ce3+ cations on the surface, which are monitored in the IR spectra by a band at 2133–2094 cm−1. This band possesses a fine structure, well resolved at 100 K. The positions of the individual components depend on the environment of Ce3+, including the presence of nearby OH groups and likely residual carbonates.
- Even at 100 K, part of the Ce3+ sites on reduced ceria are quickly oxidized by O2. These sites are situated on the surface and include all Ce3+ cations bound to OH groups and carbonates.
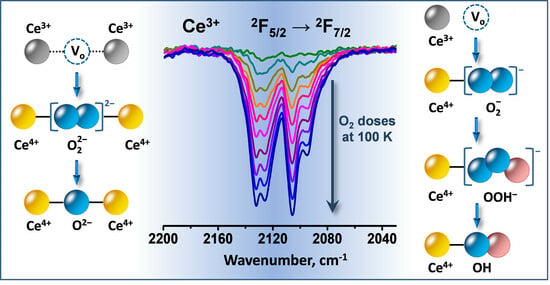
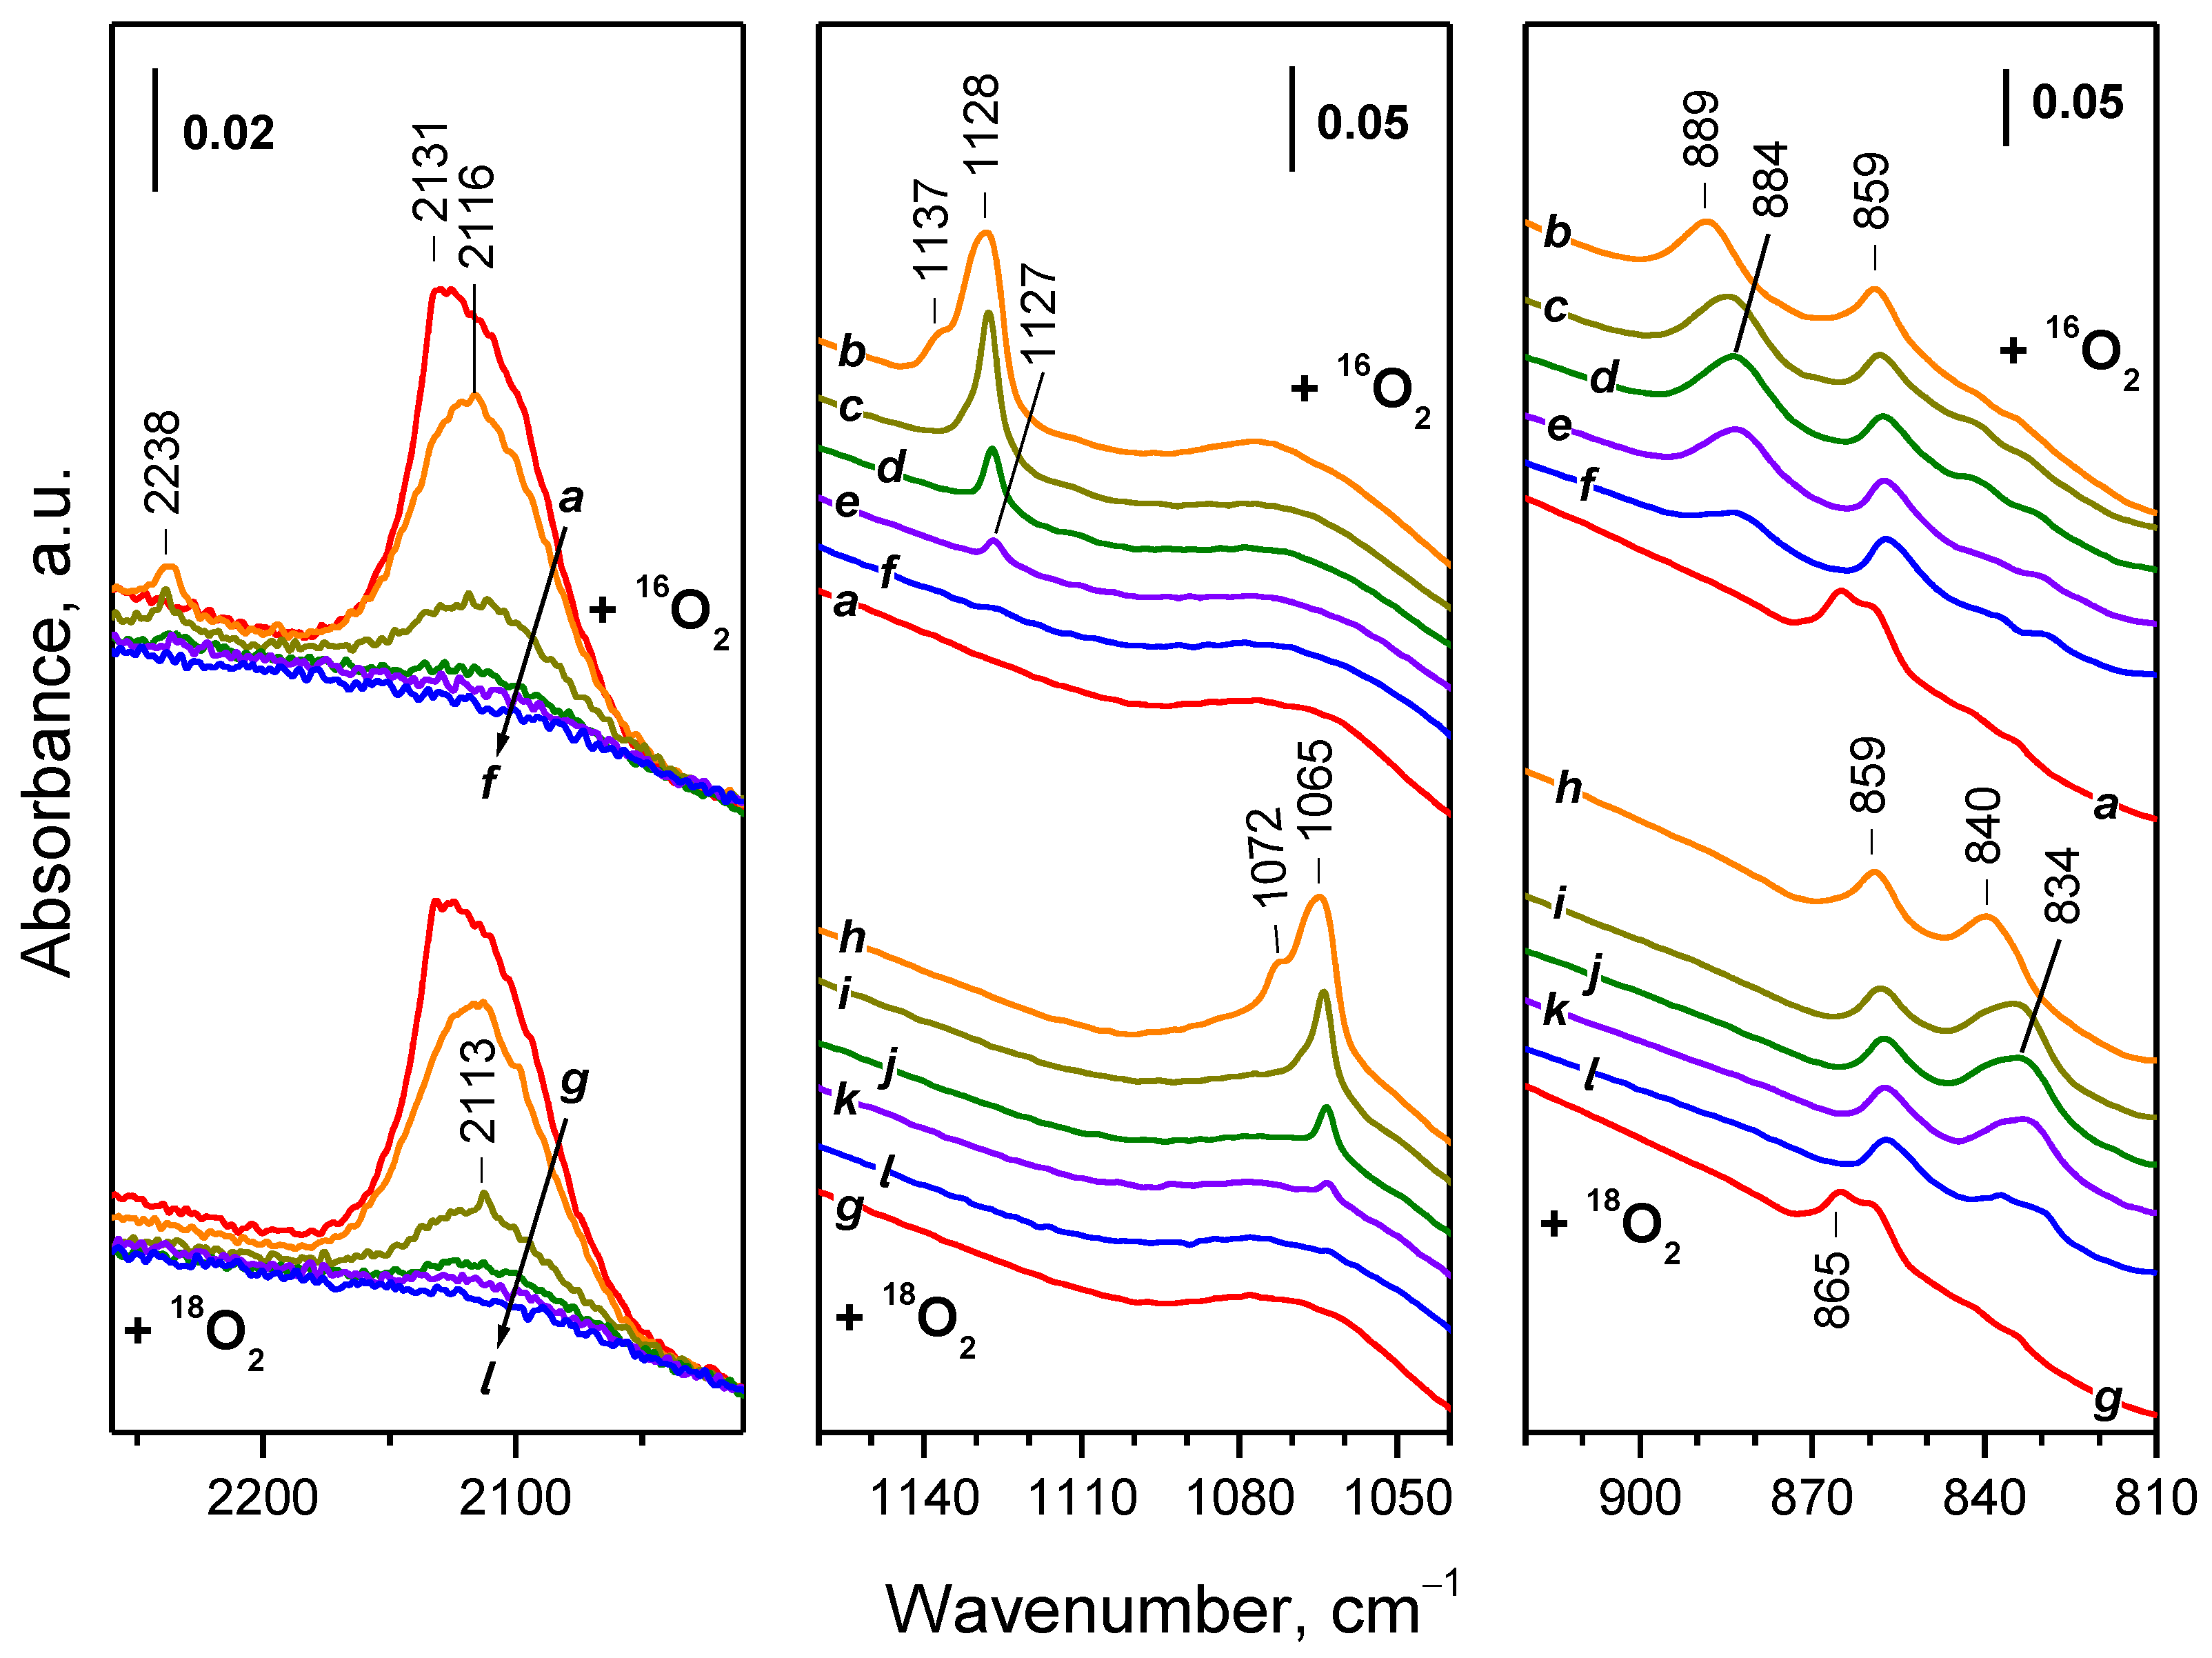
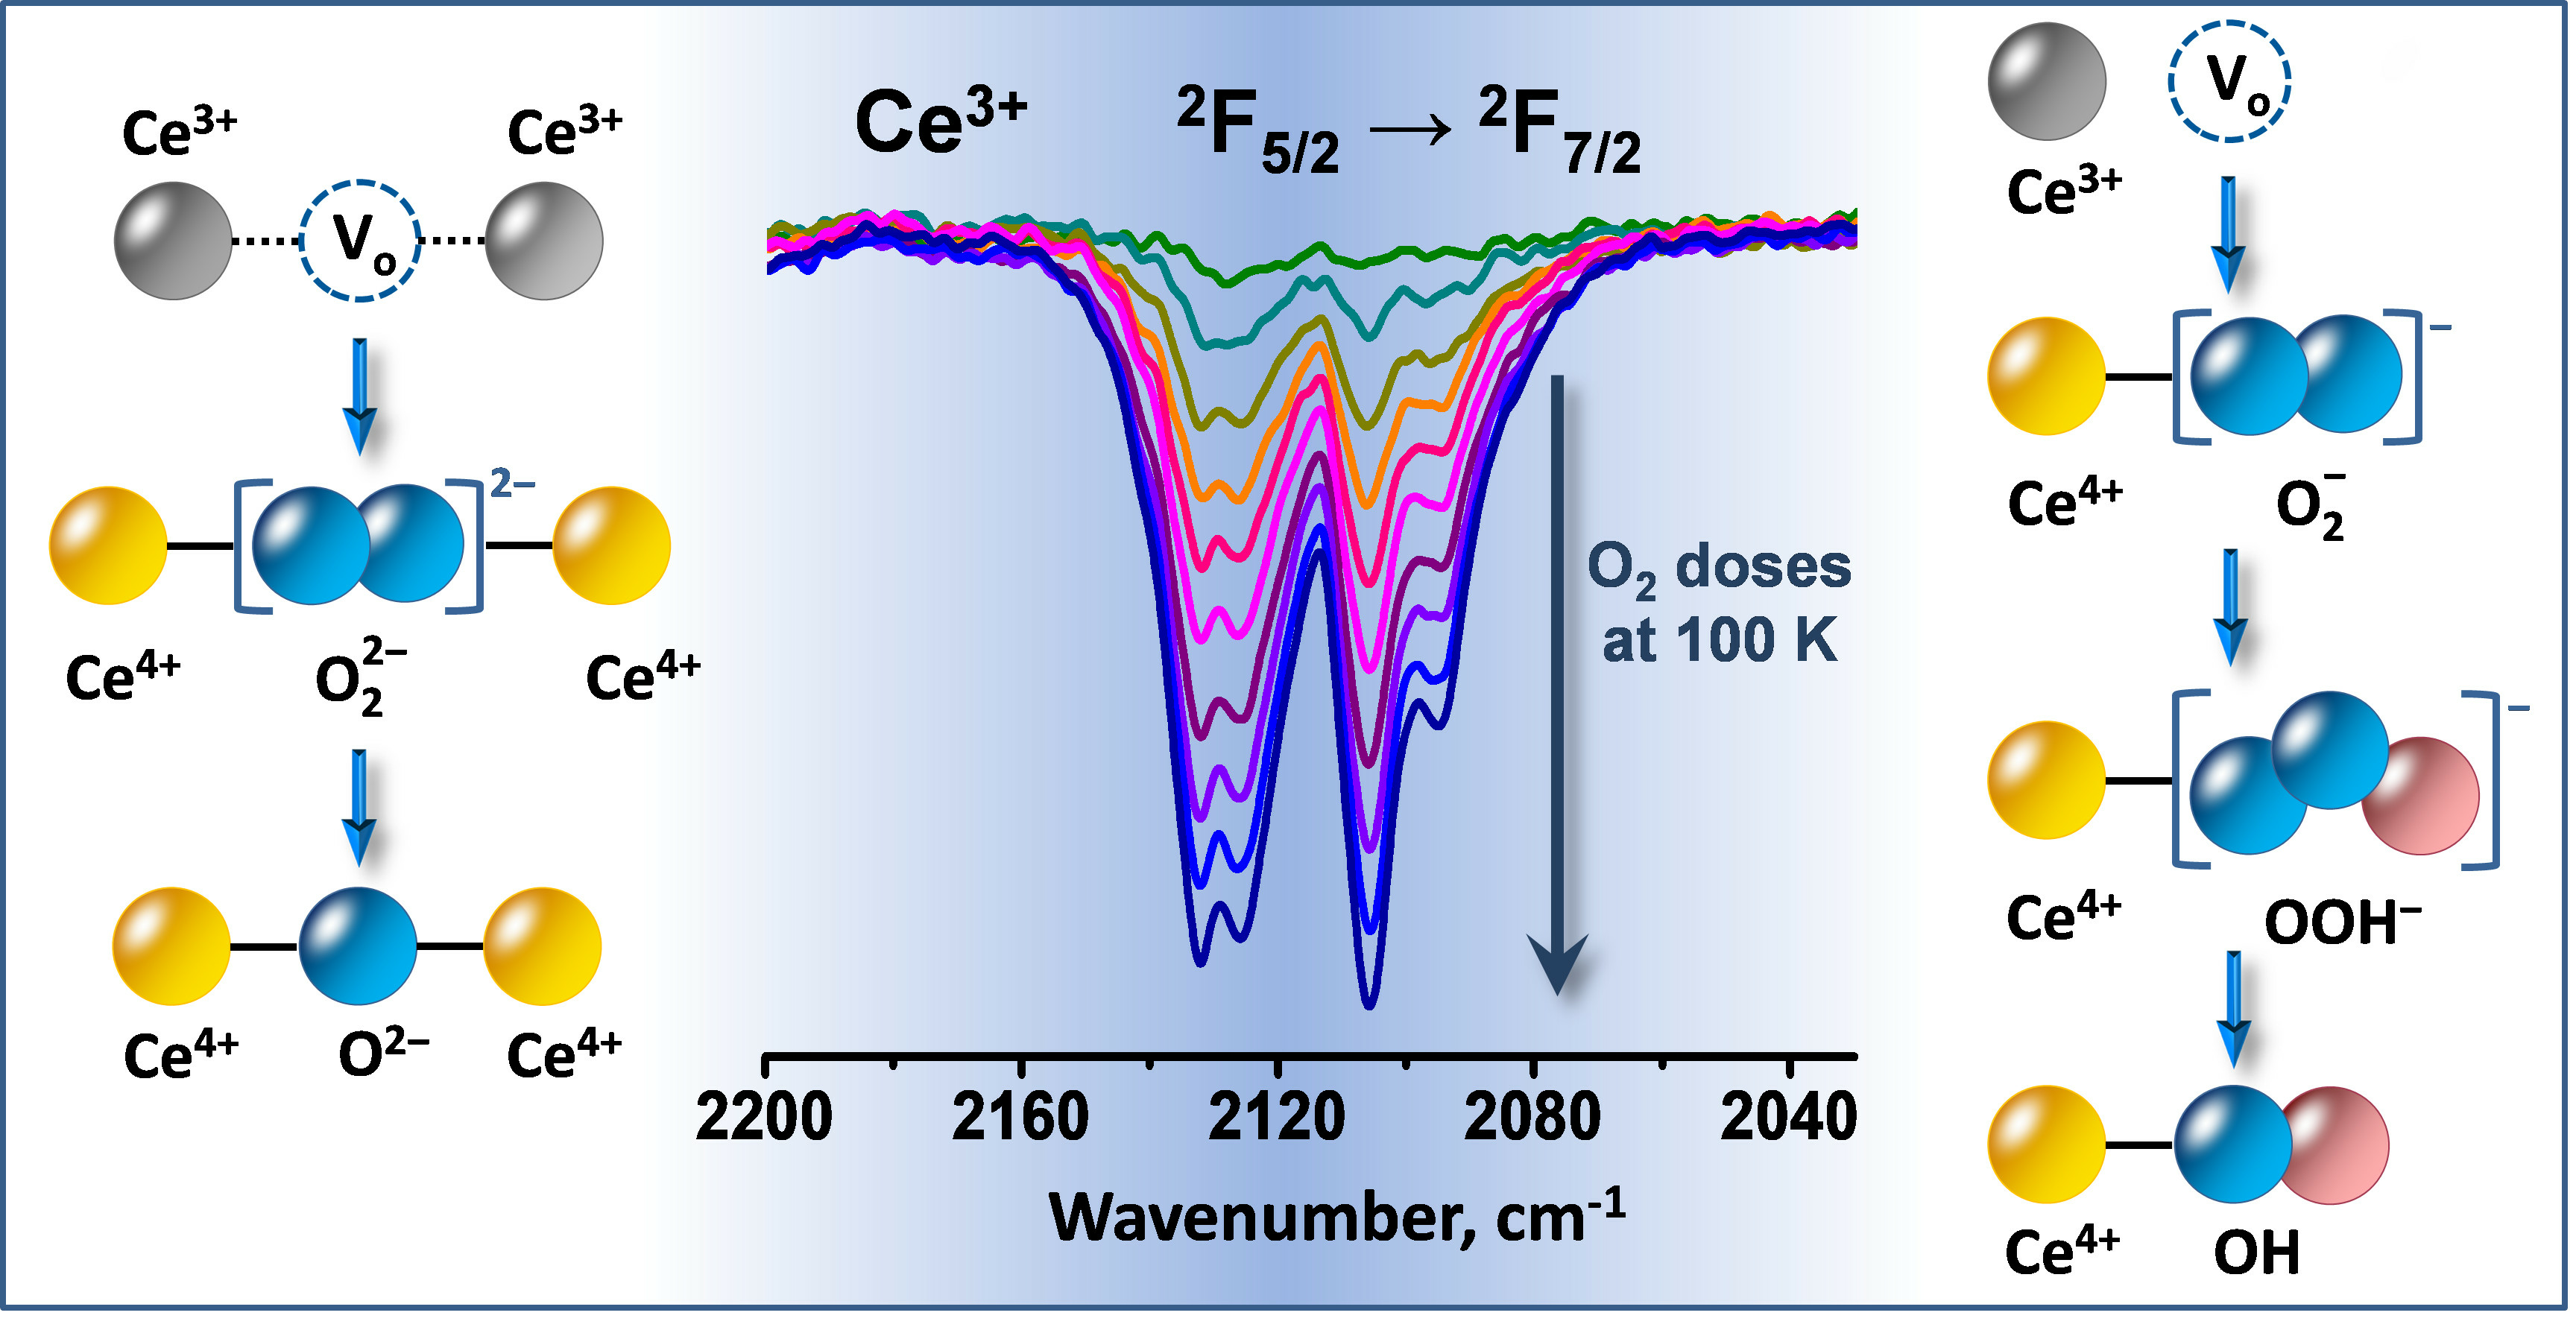
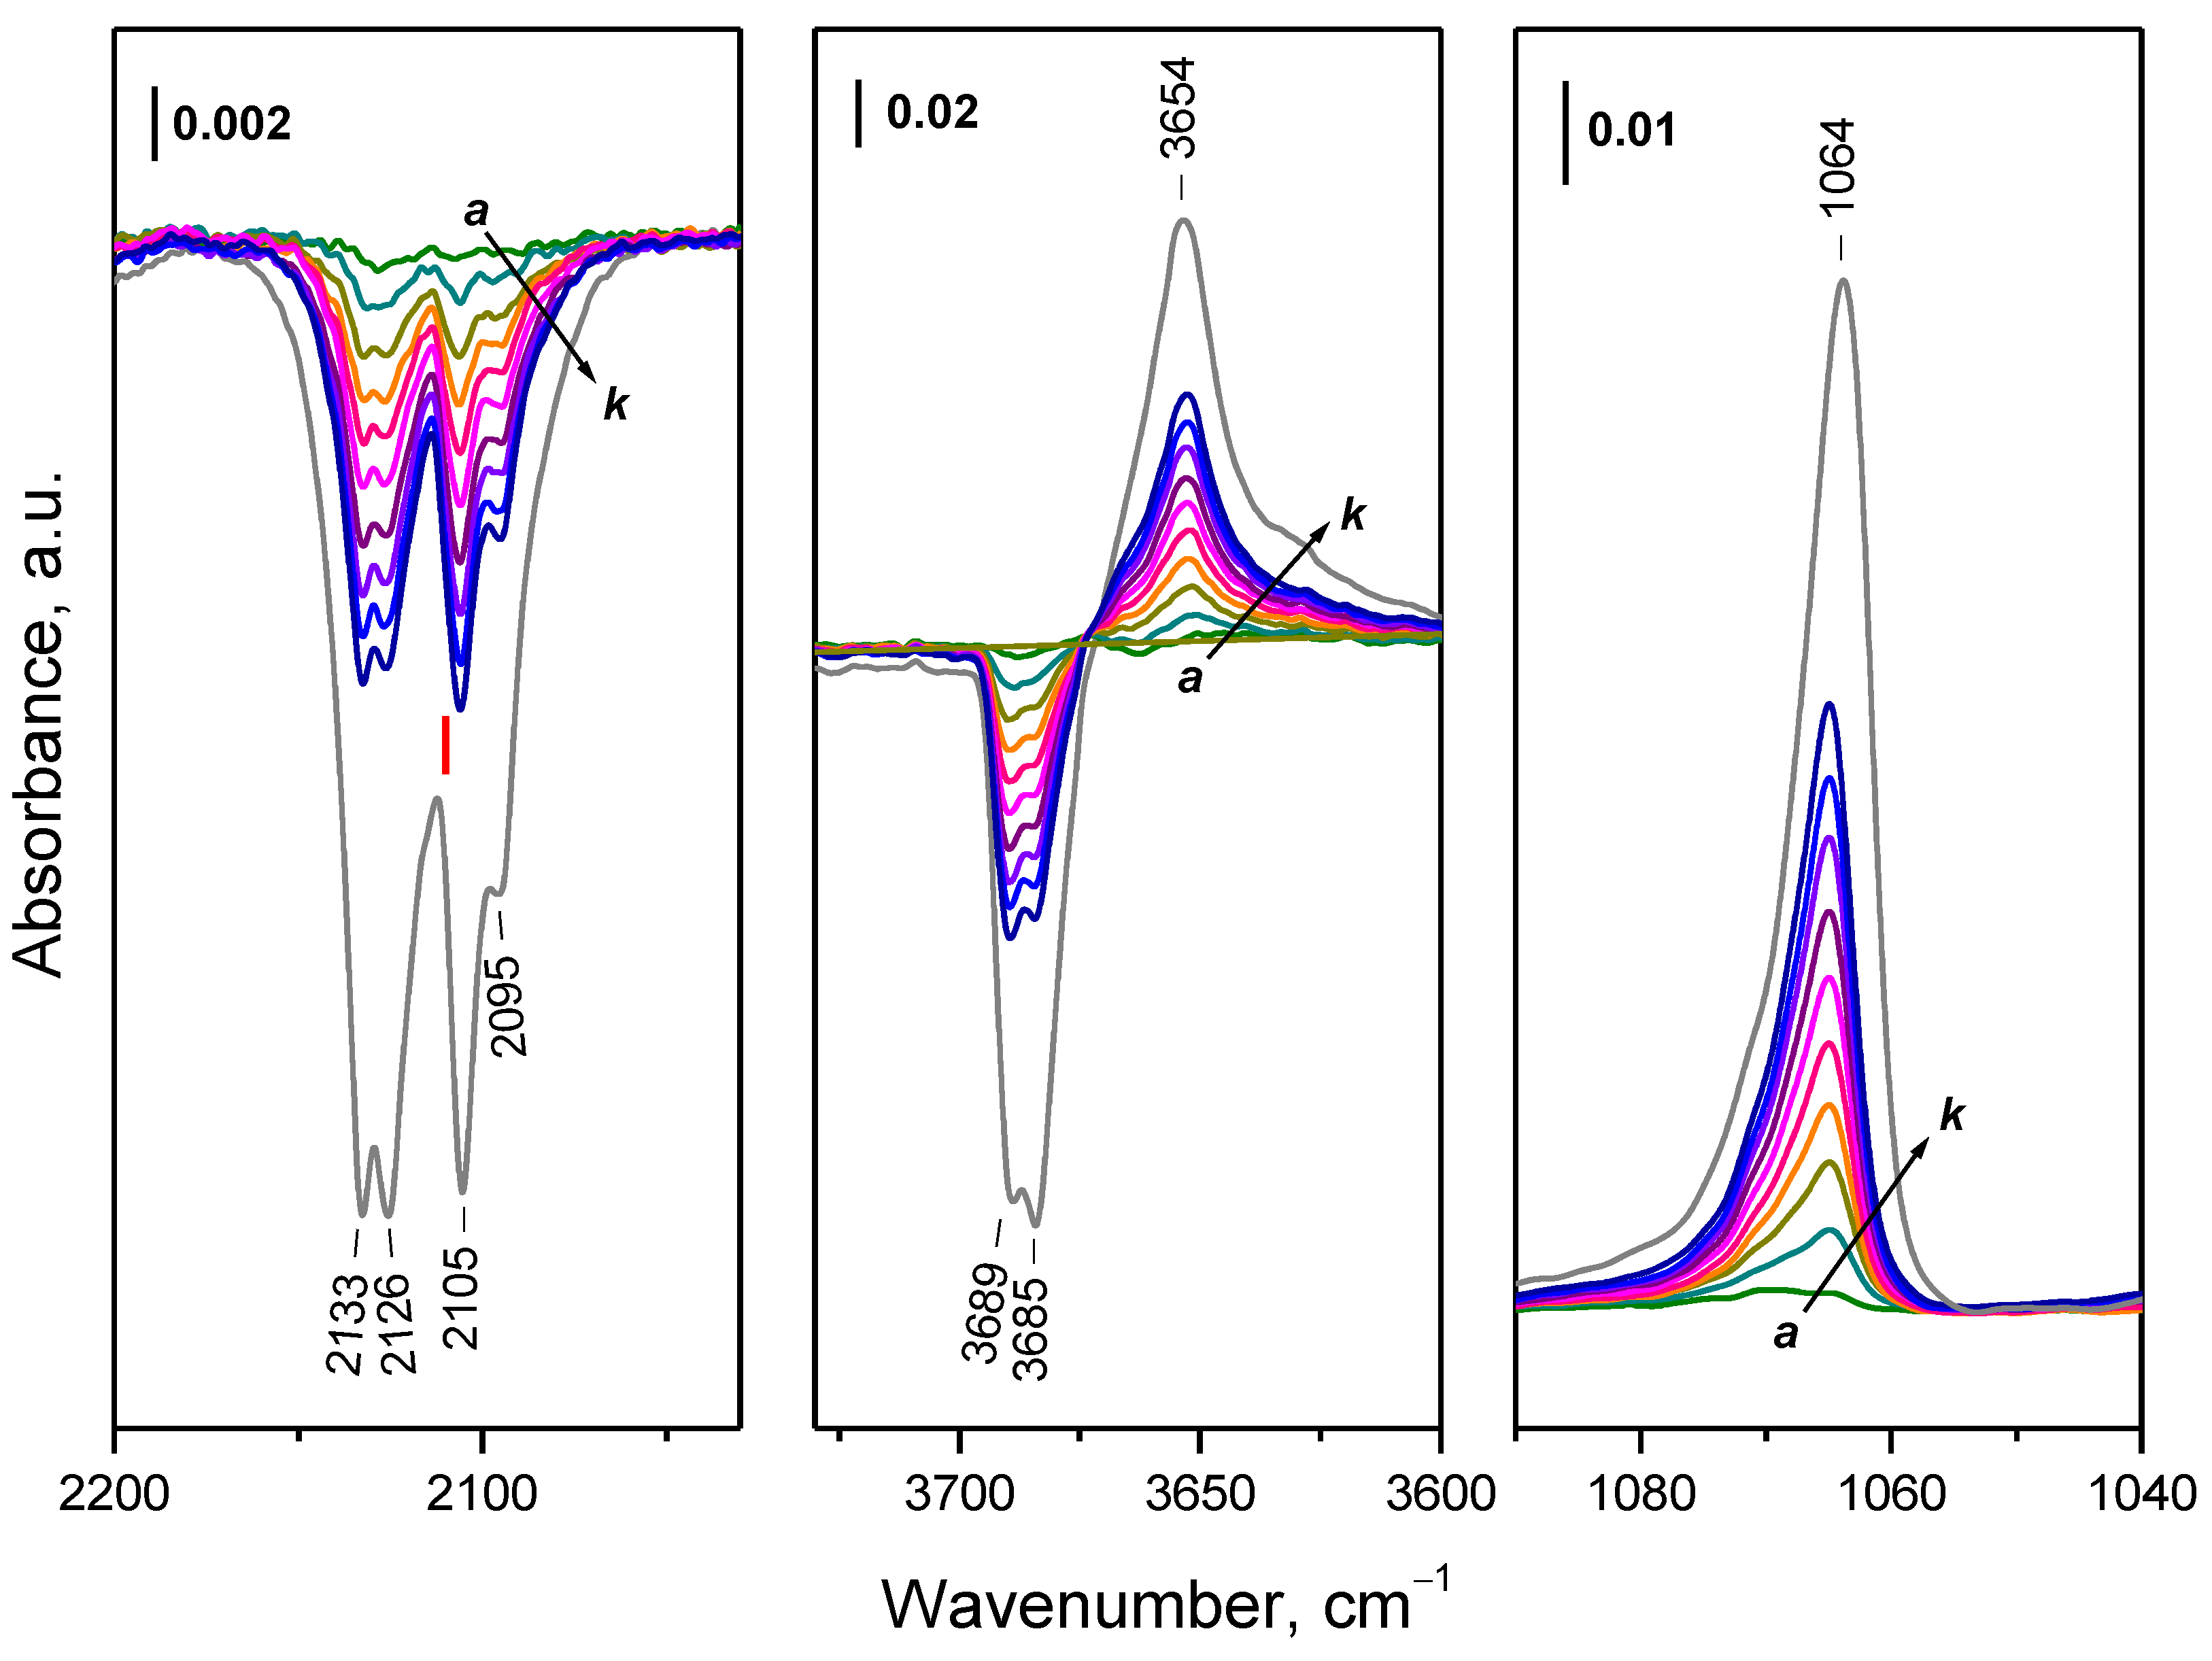
- Depending on the location of the Ce3+ sites, O2− or O22− are produced during the fast oxidation of reduced ceria at 100 K.
- Some Ce3+ sites resist oxidation at 100 K but are oxidized at higher temperatures, between 100–400 K. These sites are also assumed to be surface situated, but a location in subsurface layers is not excluded.
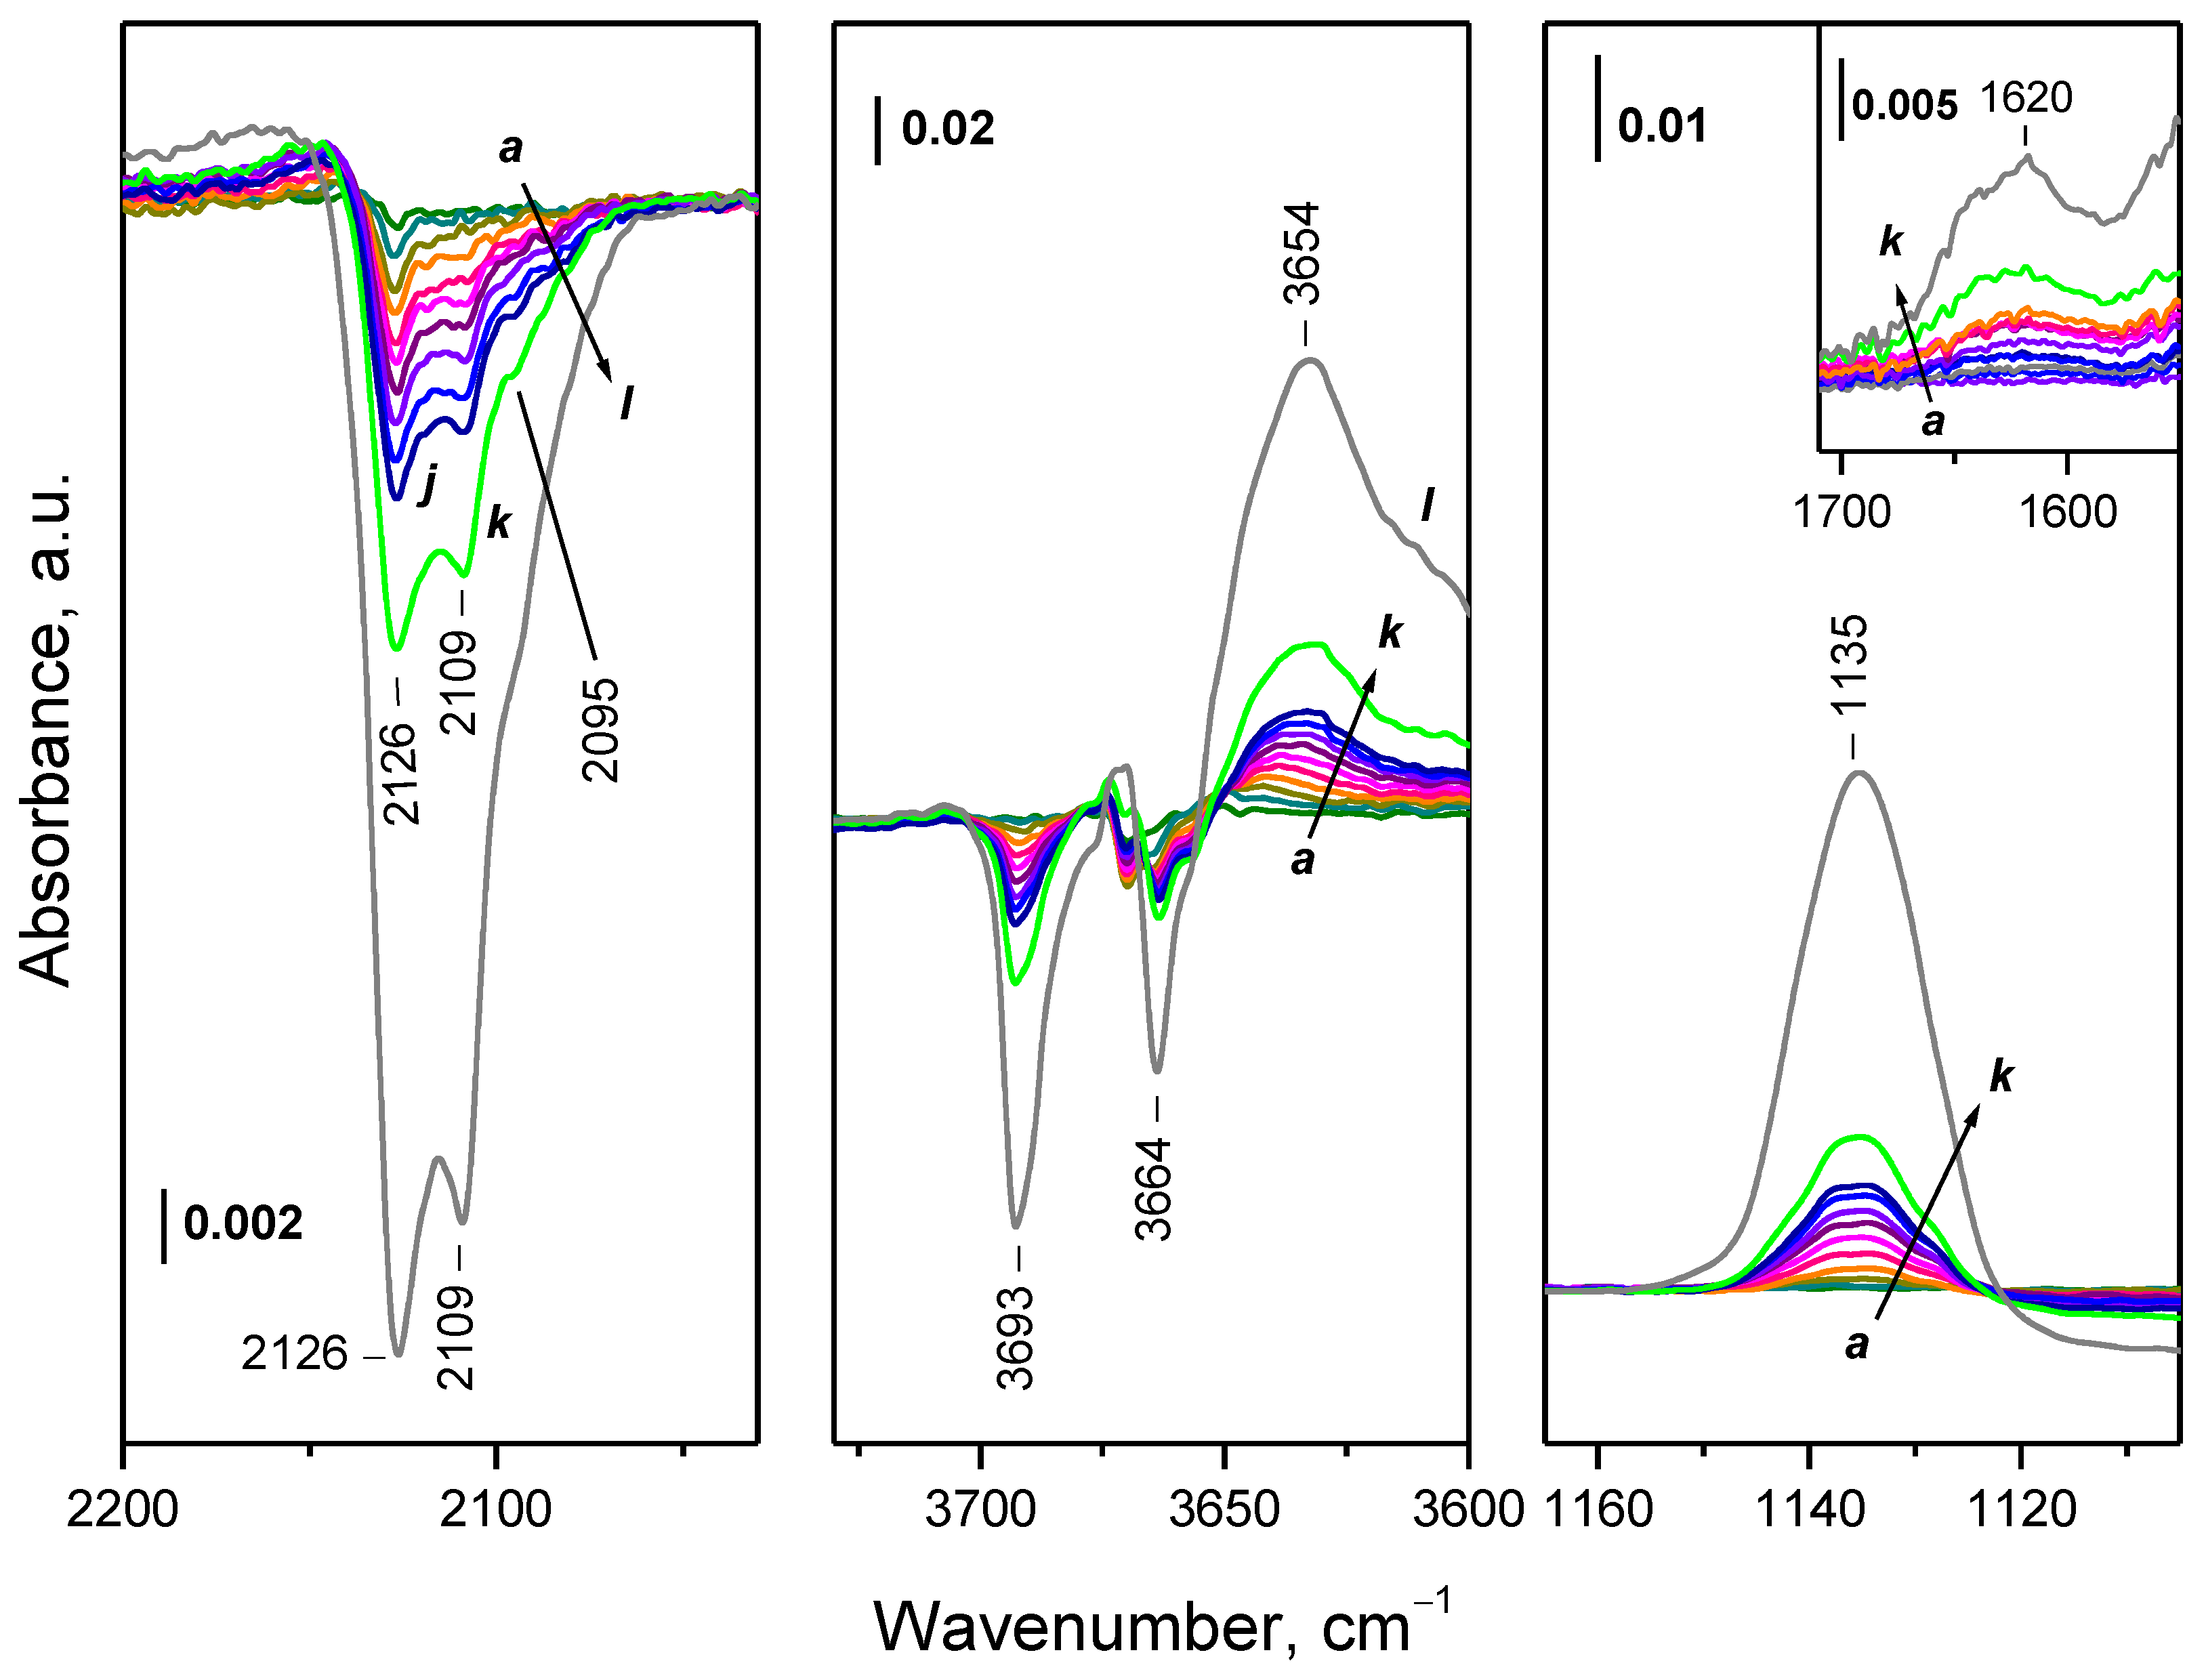
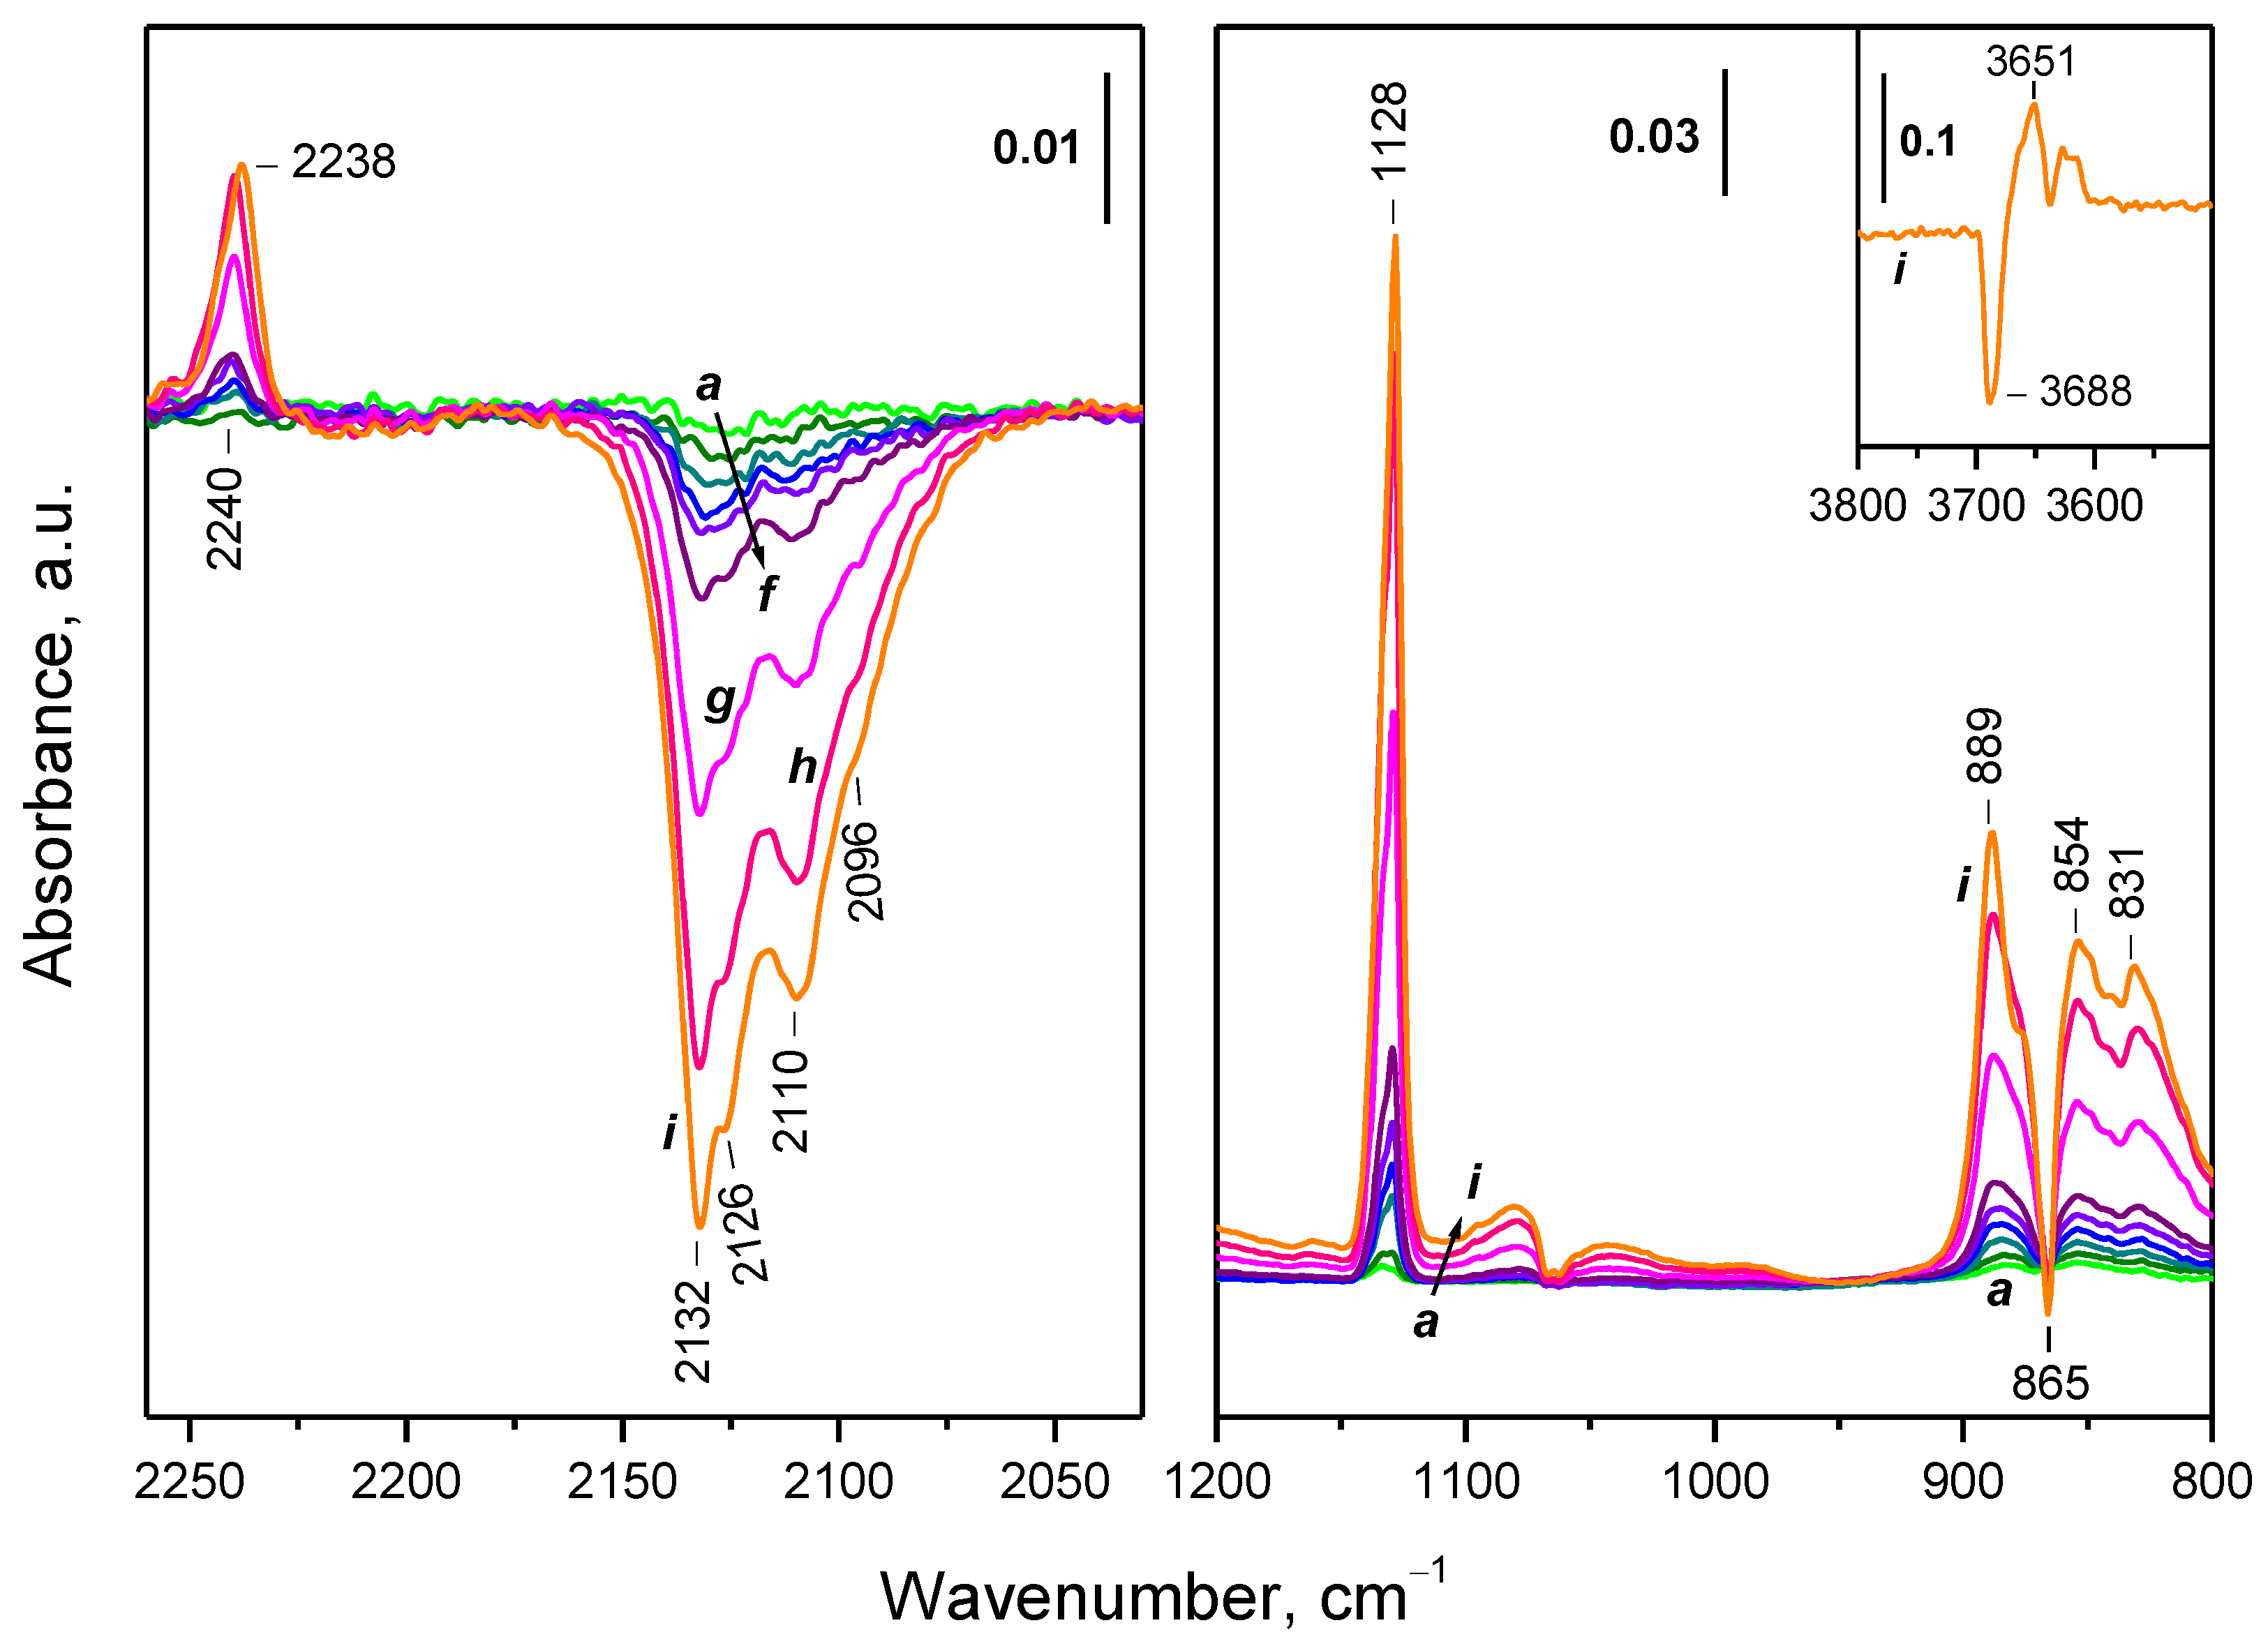
- Peroxide (O22−) species decompose to give lattice oxygen, while superoxides first convert to hydroperoxides (OOH−) and then to terminal OH groups.
- H2 dissolves in reduced ceria and is not completely removed upon evacuation at temperatures <773 K. Part of this hydrogen is also fast oxidized at 100 K, which demonstrates its high reactivity.
Supplementary Materials
Author Contributions
Funding
Data Availability Statement
Acknowledgments
Conflicts of Interest
References
- Trovarelli, A.; de Leitenburg, C.; Boaro, M.; Dolcetti, G. The utilization of ceria in industrial catalysis. Catal. Today 1999, 50, 353–367. [Google Scholar] [CrossRef]
- Chung, C.-H.; Tu, F.-Y.; Chiu, T.-A.; Wu, T.-T.; Yu, W.-Y. Critical roles of surface oxygen vacancy in heterogeneous catalysis over ceria-based materials: A selected review. Chem. Lett. 2021, 50, 856–865. [Google Scholar] [CrossRef]
- Chuen, W.C.; Haile, S.M. A thermochemical study of ceria: Exploiting an old material for new modes of energy conversion and CO2 mitigation. Phil. Trans. R. Soc. A 2010, 368, 3269–3294. [Google Scholar]
- Ganduglia-Pirovano, M.V.; Hofmann, A.; Sauer, J. Oxygen vacancies in transition metal and rare earth oxides: Current state of understanding and remaining challenges. Surf. Sci. Rep. 2007, 62, 219–270. [Google Scholar] [CrossRef]
- Rozhin, P.; Melchionna, M.; Fornasiero, P.; Marchesan, S. Nanostructured ceria: Biomolecular templates and (bio)applications. Nanomaterials 2021, 11, 2259. [Google Scholar] [CrossRef]
- Song, G.; Cheng, N.; Zhang, J.; Huang, H.; Yuan, Y.; He, X.; Luo, Y.; Huang, K. Nanoscale cerium oxide: Synthesis, biocatalytic mechanism, and applications. Catalysts 2021, 11, 1123. [Google Scholar] [CrossRef]
- Putna, E.S.; Vohs, J.M.; Gorte, R.J. Evidence for weakly bound oxygen on ceria films. J. Phys. Chem. 1996, 100, 17862–17865. [Google Scholar] [CrossRef]
- Yao, H.C.; Yao, Y.F.Y. Ceria in automotive exhaust catalysts. I. Oxygen storage. J. Catal. 1984, 86, 254–265. [Google Scholar] [CrossRef]
- Laachir, A.; Perrichon, V.; Badri, A.; Lamotte, J.; Catherine, E.; Lavalley, J.C.; El Fallah, J.; Hilaire, L.; Le Normand, F.; Quéméré, E.; et al. Reduction of CeO2 by hydrogen. Magnetic susceptibility and Fourier-transform infrared, ultraviolet and X-ray photoelectron spectroscopy measurements. J. Chem. Soc. Faraday Trans. 1991, 87, 1601–1609. [Google Scholar] [CrossRef]
- Holgado, J.P.; Munuera, G. XPS/TPR study of the reducibility of M/CeO2 catalysts (M = Pt, Rh): Does junction effect theory apply? In Studies in Surface Science and Catalysis; Frennet, A., Bastin, J.M., Eds.; Elsevier: Amsterdam, The Netherlands, 1995; Volume 96, pp. 109–122. [Google Scholar]
- Rao, G.R. Influence of metal particles on the reduction properties of ceria-based materials studied by TPR. Bull. Mater. Sci. 1999, 22, 89–94. [Google Scholar] [CrossRef]
- Giordano, F.; Trovarelli, A.; Leitenburg, C.; Giona, M. A model for the temperature-programmed reduction of low and high surface area ceria. J. Catal. 2000, 193, 273–282. [Google Scholar] [CrossRef]
- Fally, F.; Perrichon, V.; Vidal, H.; Kaspar, J.; Blanco, G.; Pintado, J.M.; Bernal, S.; Colon, G.; Daturi, M.; Lavalley, J.C. Modification of the oxygen storage capacity of CeO2–ZrO2 mixed oxides after redox cycling aging. Catal. Today 2000, 59, 373–386. [Google Scholar] [CrossRef]
- Ayastuy, J.L.; Gil-Rodríguez, A.; González-Marcos, M.P.; Gutiérrez-Ortiz, M.A. Effect of process variables on Pt/CeO2 catalyst behaviour for the PROX reaction. Int. J. Hydrogen Energy 2006, 31, 2231–2242. [Google Scholar] [CrossRef]
- Lee, J.; Ryou, Y.S.; Chan, X.; Kim, T.J.; Kim, D.H. How Pt interacts with CeO2 under the reducing and oxidizing environments at elevated temperature? The origin of improved thermal stability of Pt/CeO2 compared to CeO2. J. Phys. Chem C 2016, 120, 25870–25879. [Google Scholar] [CrossRef]
- Agarwal, S.; Mojet, L.L.; Lefferts, L.; Datye, A.K. Ceria nanoshapes-structural and catalytic properties. In Catalysis by Materials with Well-Defined Structures; Elsevier: Amsterdam, The Netherlands, 2015; pp. 31–70. [Google Scholar]
- Qiao, Z.-A.; Wu, Z.; Dai, S. Shape-controlled ceria-based nanostructures for catalysis applications. ChemSusChem 2013, 6, 1821–1833. [Google Scholar] [CrossRef]
- Sun, C.; Li, H.; Chen, L. Nanostructured ceria-based materials: Synthesis, properties, and applications. Energy Environ. Sci. 2012, 5, 8475–8505. [Google Scholar] [CrossRef]
- Wu, Z.; Li, M.; Howe, J.; Meyer, H.M.; Overbury, S.H. Probing defect sites on CeO2 nanocrystals with well-defined surface planes by Raman spectroscopy and O2 adsorption. Langmuir 2010, 26, 16595–16606. [Google Scholar] [CrossRef]
- Wu, W.; Savereide, L.M.; Notestein, J.; Weitz, E. In-situ IR spectroscopy as a probe of oxidation/reduction of Ce in nanostructured CeO2. Appl. Surf. Sci. 2018, 445, 548–554. [Google Scholar] [CrossRef]
- Zotin, F.M.Z.; Tournayan, L.; Varloud, J.; Perrichon, V.; Frety, R. Temperature-programmed reduction: Limitation of the technique for determining the extent of reduction of either pure ceria or ceria modified by additives. Appl. Catal. A 1993, 98, 99–114. [Google Scholar] [CrossRef]
- Afrin, S.; Bollini, P. On the utility of Ce3+ spin-orbit transitions in the interpretation of rate data in ceria catalysis: Theory, validation, and application. J. Phys. Chem. C 2023, 127, 234–247. [Google Scholar] [CrossRef]
- Binet, C.; Badri, A.; Lavalley, J.-C. A spectroscopic characterization of the reduction of ceria from electronic transitions of intrinsic point defects. J. Phys. Chem. 1994, 98, 6392–6398. [Google Scholar] [CrossRef]
- Binet, C.; Daturi, M.; Lavalley, J.-C. IR study of polycrystalline ceria properties in oxidised and reduced states. Catal. Today 1999, 50, 207–225. [Google Scholar] [CrossRef]
- Mihaylov, M.Y.; Ivanova, E.Z.; Aleksandrov, H.A.; Petkov, P.S.; Vayssilov, G.N.; Hadjiivanov, K.I. FTIR and density functional study of NO interaction with reduced ceria: Identification of N3− and NO2− as new intermediates in NO conversion. Appl. Catal. B 2015, 176–177, 107–119. [Google Scholar] [CrossRef]
- Mihaylov, M.Y.; Ivanova, E.Z.; Aleksandrov, H.A.; Petkov, P.S.; Vayssilov, G.N.; Hadjiivanov, K.I. Formation of N3− during interaction of NO with reduced ceria. Chem. Commun. 2015, 51, 5668–5671. [Google Scholar] [CrossRef]
- Mihaylov, M.Y.; Ivanova, E.Z.; Vayssilov, G.N.; Hadjiivanov, K.I. Revisiting ceria-NOx interaction: FTIR studies. Catal. Today 2020, 357, 613–620. [Google Scholar] [CrossRef]
- Li, H.; Zhang, P.; Li, G.; Lu, J.; Wu, Q.; Gu, Y. Stress measurement for nonstoichiometric ceria films based on Raman spectroscopy. J. Alloys Compd. 2016, 682, 132–137. [Google Scholar] [CrossRef]
- Bozon-Verduraz, F.; Bensalem, A. IR studies of cerium dioxide: Influence of impurities and defects. J. Chem. Soc. Faraday Trans. 1994, 90, 653–657. [Google Scholar] [CrossRef]
- Chen, L.; Fleming, P.; Morris, V.; Holmes, J.D.; Morris, M.A. Size-related lattice parameter changes and surface defects in ceria nanocrystals. J. Phys. Chem. C 2010, 114, 12909–12919. [Google Scholar] [CrossRef]
- Zhang, B.; Zhang, S.; Liu, B. Effect of oxygen vacancies on ceria catalyst for selective catalytic reduction of NO with NH3. Appl. Surf. Sci. 2020, 529, 147068. [Google Scholar] [CrossRef]
- Descorme, C.; Madier, Y.; Duprez, D. Infrared study of oxygen adsorption and activation on cerium–zirconium mixed oxides. J. Catal. 2000, 196, 167–173. [Google Scholar] [CrossRef]
- Li, C.; Domen, K.; Maruya, K.; Onishi, T. Dioxygen adsorption on well-outgassed and partially reduced cerium oxide studied by FT-IR. J. Am. Chem. Soc. 1989, 111, 7683–7687. [Google Scholar] [CrossRef]
- Li, C.; Domen, K.; Maruya, K.-I.; Onishi, T. Oxygen exchange reactions over cerium oxide: An FT-IR study. J. Catal. 1990, 123, 436–442. [Google Scholar] [CrossRef]
- Pushkarev, V.V.; Kovalchuk, V.I.; d’Itri, J.L. Probing defect sites on the CeO2 surface with dioxygen. J. Phys. Chem. B 2004, 108, 5341–5348. [Google Scholar] [CrossRef]
- Cardenas, L.; Molinet-Chinaglia, C.; Loridant, S. Unraveling Ce3+ detection at the surface of ceria nanopowders by UPS analysis. Phys. Chem. Chem. Phys. 2022, 24, 22815–22822. [Google Scholar] [CrossRef] [PubMed]
- Morgan, D.J. Photoelectron spectroscopy of ceria: Reduction, quantification and the myth of the vacancy peak in XPS analysis. Surf. Interface Anal. 2023, 55, 845–850. [Google Scholar] [CrossRef]
- Xu, Y.; Wang, F.; Liu, X.; Liu, Y.; Luo, M.; Teng, B.; Fan, M.; Liu, X. Resolving a decade-long question of oxygen defects in Raman spectra of ceria-based catalysts at atomic level. J. Phys. Chem. C 2019, 123, 18889–18894. [Google Scholar] [CrossRef]
- Filtschew, A.; Hofmann, K.; Hess, C. Ceria and its defect structure: New insights from a combined spectroscopic approach. J. Phys. Chem. C 2016, 120, 6694–6703. [Google Scholar] [CrossRef]
- Schmitt, R.; Nenning, A.; Kraynis, O.; Korobko, R.; Frenkel, A.I.; Lubomirsky, I.; Haile, S.M.; Rupp, J.L.M. A review of defect structure and chemistry in ceria and its solid solutions. Chem. Soc. Rev. 2020, 49, 554–592. [Google Scholar] [CrossRef]
- Wang, X.; Li, M.; Wu, Z. In situ spectroscopic insights into the redox and acid-base properties of ceria catalysts. Chin. J. Catal. 2021, 42, 2122–2140. [Google Scholar] [CrossRef]
- Loridant, S. Raman spectroscopy as a powerful tool to characterize ceria-based catalysts. Catal. Today 2021, 373, 98–111. [Google Scholar] [CrossRef]
- Bruce, L.A.; Hoang, M.; Hughes, A.E.; Turney, T.W. Surface area control during the synthesis and reduction of high area ceria catalyst supports. Appl. Catal. A 1996, 134, 351–362. [Google Scholar] [CrossRef]
- Badri, A.; Binet, C.; Lavalley, J.-C. An FTIR study of surface ceria hydroxy groups during a redox process with H2. J. Chem. Soc. Faraday Trans. 1996, 92, 4669–4673. [Google Scholar] [CrossRef]
- Tsyganenko, A.A.; Filimonov, V.N. Infrared spectra of surface hydroxyl groups and crystalline structure of oxides. J. Mol. Struct. 1973, 19, 579–589. [Google Scholar] [CrossRef]
- Vayssilov, G.N.; Mihaylov, M.; Petkov, P.S.; Hadjiivanov, K.I.; Neyman, K.M. Reassignment of the vibrational spectra of carbonates, formates, and related surface species on ceria: A combined density functional and infrared spectroscopy investigation. J. Phys. Chem. C 2011, 115, 23435–23454. [Google Scholar] [CrossRef]
- Hadjiivanov, K. Identification and characterization of surface hydroxyl groups by infrared spectroscopy. Adv. Catal. 2014, 47, 99–318. [Google Scholar]
- Otsuka, K.; Hatano, M.; Morikawa, A. Hydrogen from water by reduced cerium oxide. J. Catal. 1983, 79, 493–496. [Google Scholar] [CrossRef]
- Zecchina, A.; Otero Areán, C. Diatomic molecular probes for mid-IR studies of zeolites. Chem. Soc. Rev. 1996, 25, 187–197. [Google Scholar] [CrossRef]
- Nakamoto, K. Infrared and Raman Spectra of Inorganic and Coordination Compounds, Part B, 6th ed.; John Wiley & Sons: Hoboken, NJ, USA, 2009. [Google Scholar]
- Preda, G.; Migani, A.; Neyman, K.M.; Bromley, S.T.; Illas, F.; Pacchioni, G. Formation of superoxide anions on ceria nanoparticles by interaction of molecular oxygen with Ce3+ sites. J. Phys. Chem. C 2011, 115, 5817–5822. [Google Scholar] [CrossRef]
- Bashir, S.M.; Idriss, H. The reaction of propylene to propylene-oxide on CeO2: An FTIR spectroscopy and temperature programmed desorption study. J. Chem. Phys. 2020, 152, 044712. [Google Scholar] [CrossRef]
- Lin, W.Y.; Frei, H. Photochemical and FT-IR probing of the active site of hydrogen peroxide in Ti silicalite sieve. J. Am. Chem. Soc. 2002, 124, 9292–9298. [Google Scholar] [CrossRef]
- Anpo, M.; Costentin, G.; Giamello, E.; Lauron-Pernot, H.; Sojka, J. Characterisation and reactivity of oxygen species at the surface of metal oxides. J. Catal. 2021, 393, 259–280. [Google Scholar] [CrossRef]
- Bernal, S.; Calvino, J.J.; Cifredo, G.A.; Gatica, J.M.; Perez Omil, H.; Pintado, J.M. Hydrogen chemisorption on ceria: Influence of the oxide surface area and degree of reduction. J. Chem. Soc. Faraday Trans. 1993, 89, 3499–3505. [Google Scholar] [CrossRef]
- Kammert, J.; Moon, J.; Wu, Z. A review of the interactions between ceria and H2 and the applications to selective hydrogenation of alkynes. Chin. J. Catal. 2020, 41, 901–914. [Google Scholar] [CrossRef]
- Zabilskiy, M.; Djinović, P.; Tchernychova, E.; Tkachenko, O.P.; Kustov, L.M.; Pintar, A. Nanoshaped CuO/CeO2 materials: Effect of the exposed ceria surfaces on catalytic activity in N2O decomposition reaction. ACS Catal. 2015, 5, 5357–5365. [Google Scholar] [CrossRef]
- Mai, H.-X.; Sun, L.-D.; Zhang, Y.-W.; Si, R.; Feng, W.; Zhang, H.-P.; Liu, H.-C.; Yan, C.-H. Shape-selective synthesis and oxygen storage behavior of ceria nanopolyhedra, nanorods, and nanocubes. J. Phys. Chem. B 2005, 109, 24380–24385. [Google Scholar] [CrossRef]


| Sample | Particle Shape | SBET, m2 g−1 | Mean Crystallite Size, nm 1 |
|---|---|---|---|
| CeO2-NC | cubes | 27 | 30 |
| CeO2-NR | rods | 110 | 7 |
| CeO2-NP | polyhedra | 140 | 7 |
| Sample | Assignment | ν(16O–16O), cm−1 | ν(18O–18O), cm−1 | i 1 |
|---|---|---|---|---|
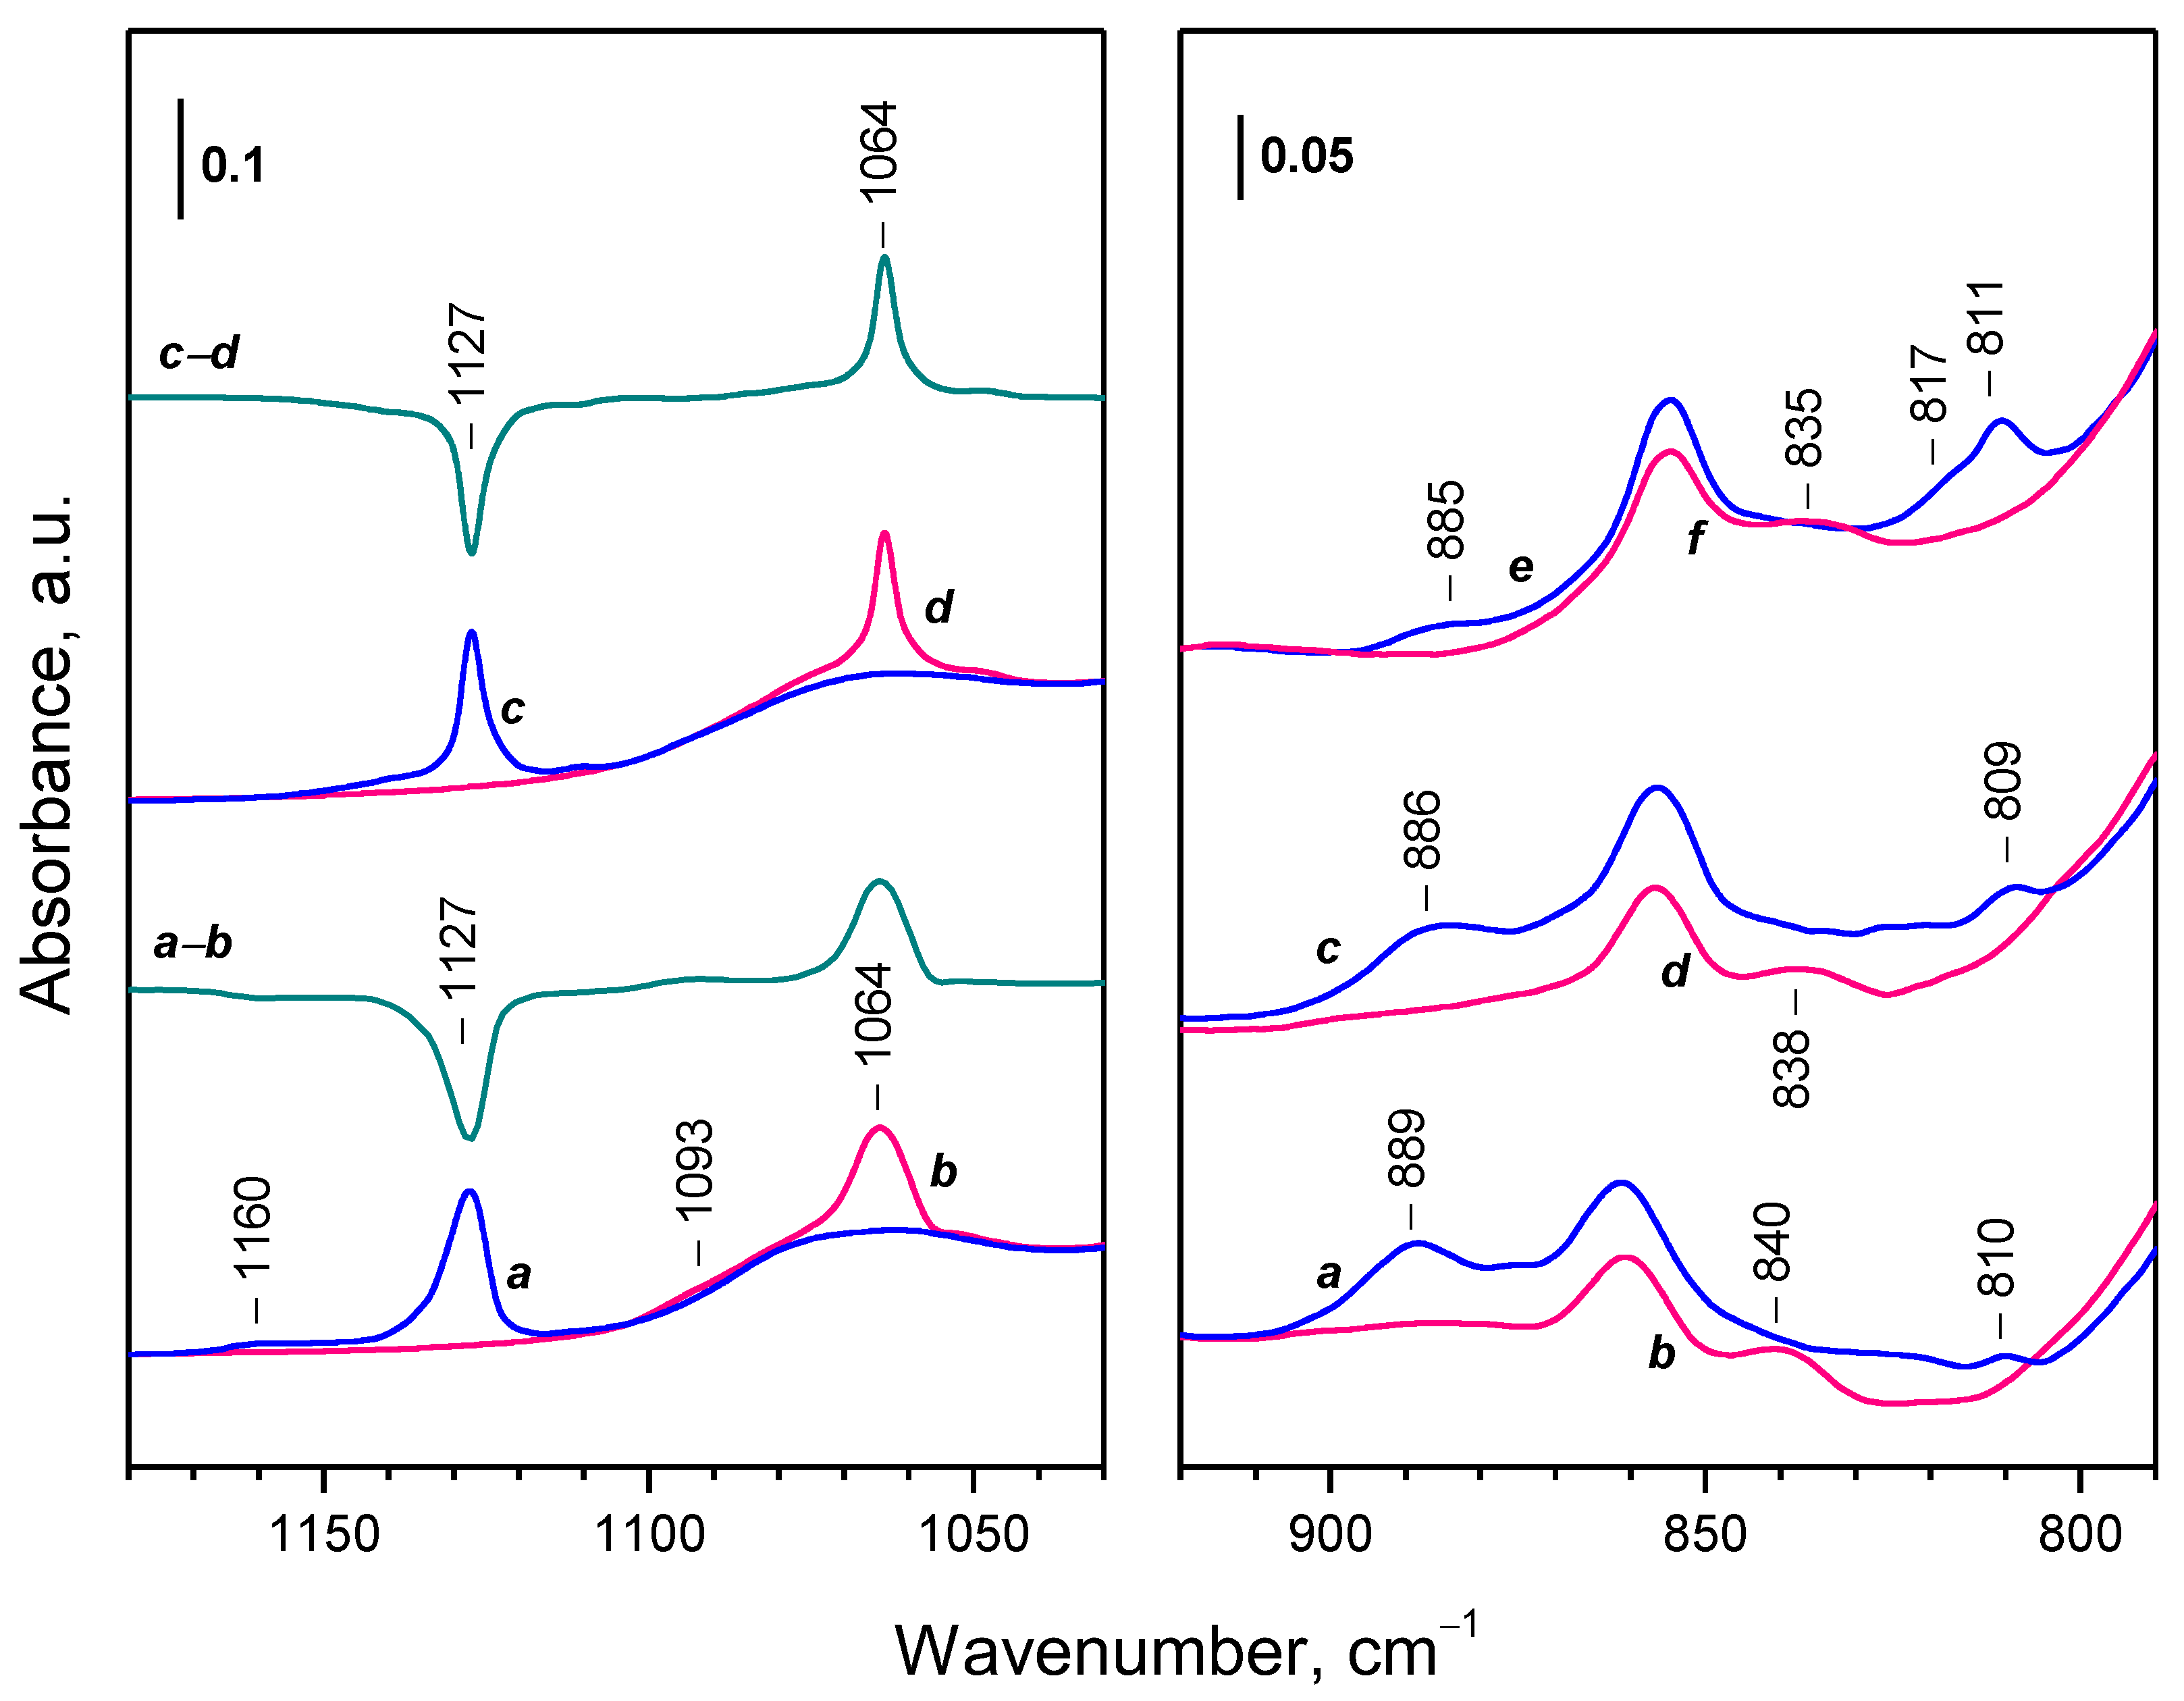
| CeO2-NC | superoxide | 1128 | 1064 | 1060 |
| CeO2-NC | superoxide | 1160 | 1093 | 1061 |
| CeO2-NP | superoxide | 1128 | 1065 | 1059 |
| CeO2-NP | superoxide | 1137 | 1072 | 1061 |
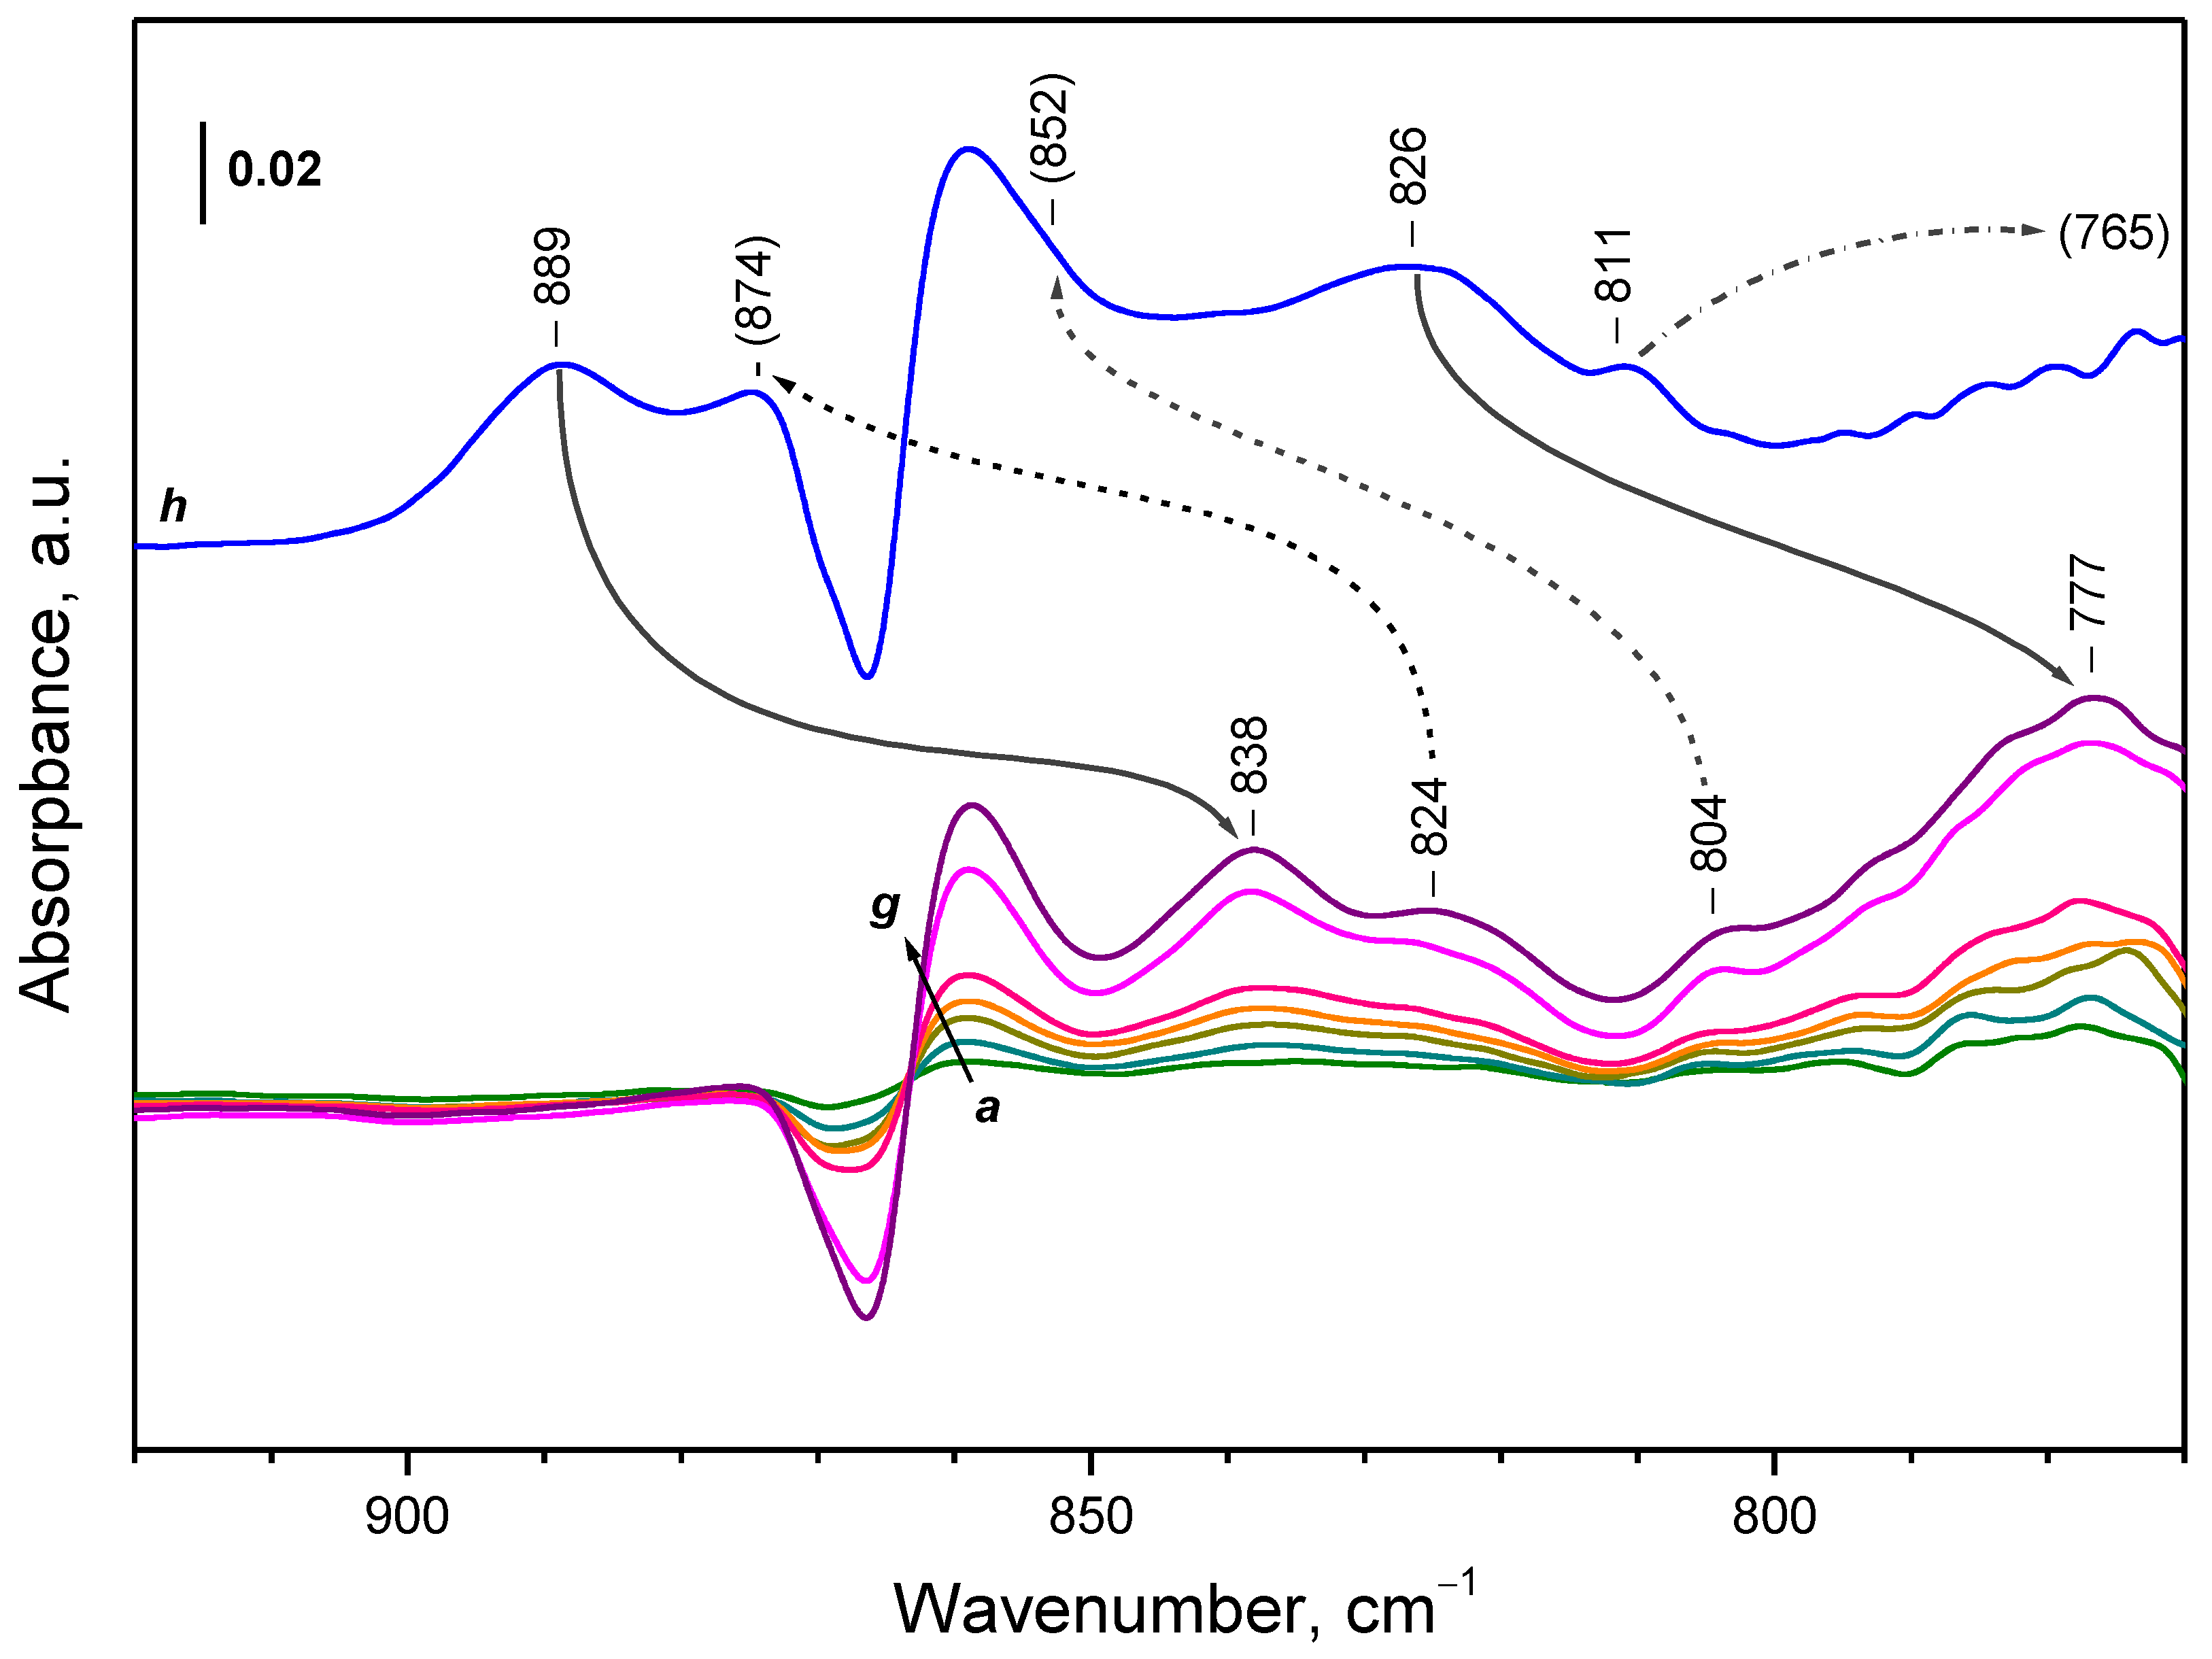
| CeO2-NC | peroxide | 889 | 838 | 1061 |
| CeO2-NC | peroxide | 874 | 824 | 1061 |
| CeO2-NC | peroxide | 852 | 804 | 1060 |
| CeO2-NC | peroxide | 826 | 777 | 1063 |
| CeO2-NC | peroxide | 811 | 765 2 | - |
| CeO2-NP | peroxide | 889 | 840 | 1058 |
Disclaimer/Publisher’s Note: The statements, opinions and data contained in all publications are solely those of the individual author(s) and contributor(s) and not of MDPI and/or the editor(s). MDPI and/or the editor(s) disclaim responsibility for any injury to people or property resulting from any ideas, methods, instructions or products referred to in the content. |
© 2024 by the authors. Licensee MDPI, Basel, Switzerland. This article is an open access article distributed under the terms and conditions of the Creative Commons Attribution (CC BY) license (https://creativecommons.org/licenses/by/4.0/).
Share and Cite
Chakarova, K.; Drenchev, N.; Mihaylov, M.; Hadjiivanov, K. Interaction of O2 with Reduced Ceria Nanoparticles at 100–400 K: Fast Oxidation of Ce3+ Ions and Dissolved H2. Catalysts 2024, 14, 45. https://doi.org/10.3390/catal14010045
Chakarova K, Drenchev N, Mihaylov M, Hadjiivanov K. Interaction of O2 with Reduced Ceria Nanoparticles at 100–400 K: Fast Oxidation of Ce3+ Ions and Dissolved H2. Catalysts. 2024; 14(1):45. https://doi.org/10.3390/catal14010045
Chicago/Turabian StyleChakarova, Kristina, Nikola Drenchev, Mihail Mihaylov, and Konstantin Hadjiivanov. 2024. "Interaction of O2 with Reduced Ceria Nanoparticles at 100–400 K: Fast Oxidation of Ce3+ Ions and Dissolved H2" Catalysts 14, no. 1: 45. https://doi.org/10.3390/catal14010045
APA StyleChakarova, K., Drenchev, N., Mihaylov, M., & Hadjiivanov, K. (2024). Interaction of O2 with Reduced Ceria Nanoparticles at 100–400 K: Fast Oxidation of Ce3+ Ions and Dissolved H2. Catalysts, 14(1), 45. https://doi.org/10.3390/catal14010045