Communication

Photocatalytic Reduction Efficiency of CO2 Depending on ZnO Particle Size

1
Department of Inorganic Chemical Technology and Environment Engineering, Faculty of Chemical Technology and Engineering, West Pomeranian University of Technology in Szczecin, Pułaskiego 10, 70-322 Szczecin, Poland
2
Department of Organic Chemical Technology and Polymer Materials, Faculty of Chemical Technology and Engineering, West Pomeranian University of Technology in Szczecin, Pułaskiego 10, 70-322 Szczecin, Poland
*
Author to whom correspondence should be addressed.
Catalysts 2023, 13(9), 1270; https://doi.org/10.3390/catal13091270
Submission received: 20 July 2023 / Revised: 29 August 2023 / Accepted: 1 September 2023 / Published: 3 September 2023
(This article belongs to the Section Photocatalysis)

Abstract

:
In the face of increasing global carbon dioxide emissions and the urgent need to mitigate climate change, the development of efficient and sustainable strategies for CO2 conversion has gained significant attention. One of the methods of eliminating the harmful effects of CO2 is its photoreduction. In this paper, ZnO was used as an effective photocatalyst for the photoreduction of CO2 in a gas-phase system. The influence of particle size on the process efficiency was investigated. The ZnO materials applied in the studies were characterized using XRD, SEM, and low-temperature nitrogen adsorption (BET) methods. The pore volume distribution was calculated based on the DFT method. The investigation confirmed that it had a significant impact on the formation of the product of photocatalysis carbon dioxide. The main identified product was carbon monoxide. Hydrogen and methane were detected as well. Based on the results, it was found that the process efficiency was enhanced with decreasing ZnO particle size, and the most effective catalyst for the photoreduction of CO2 was the ZnO sample with the smallest particle size (18 nm).

1. Introduction

The increasing levels of carbon dioxide emissions in Earth’s atmosphere have become a pressing global concern due to their detrimental impact in terms of contributing to climate change and challenging environmental sustainability. As such, developing efficient and environmentally friendly methods to mitigate CO2 emissions and convert CO2 into valuable products has emerged as a significant research area in recent years. Among varied approaches, the photocatalytic reduction of CO2 has gathered substantial attention as a promising strategy to convert CO2 into useful chemicals and fuels. Among various photocatalysts explored for this purpose, ZnO stands out as a promising candidate due to its unique characteristics, such as its wide bandgap, strong absorption in the ultraviolet range, high electron mobility, low toxicity, and low cost [1,2,3,4].
The photocatalytic reduction of CO2 with ZnO involves the activation of CO2 molecules by photogenerated charge carriers, leading to the formation of energy-rich intermediates, which subsequently undergo chemical transformations to yield desired products [4]. This occurs via two processes, which are the adsorption of CO2 on the surface of the photocatalyst and the subsequent reaction between the adsorbed molecule and the electron–hole pair generated under the influence of light [5]. Studies have shown that carbonate species, which can easily desorb, can be found on the surface of photocatalysts in addition to CO2 molecules [6]. Since CO2’s adsorption capacity is a crucial parameter that influences the overall efficiency and performance of the reduction process, the photocatalyst should be characterized by a high surface area and also by surface defects. High-surface-area materials, such as ZnO nanoparticles or highly porous structures, provide larger contact areas with CO2 and facilitate higher catalytic activity [7,8,9,10]. Additionally, surface defects and oxygen vacancies in ZnO can serve as active sites for CO2 activation and contribute to an improved catalytic performance [11,12,13,14]. The crystal structure and morphology of ZnO can significantly impact its photocatalytic activity [15]. Different crystal facets exhibit varying reactivity, and the presence of high-energy facets can promote the adsorption and activation of CO2 molecules [16,17]. The morphology of ZnO, such as nanoparticles or hierarchical structures, can provide a high surface area, efficient charge transfer, and improved catalytic performance [18,19,20,21,22,23].
In this work, we investigated the photocatalytic performance of ZnO with various particle sizes. We also discussed the differences in their properties, such as specific surface area, morphology, crystal structure, and pore size distribution. Understanding and optimizing these crucial parameters of ZnO photocatalyst in the CO2 photoreduction process is vital to achieving efficient and selective conversion of CO2 into valuable chemicals and fuels. Fine-tuning these parameters can enhance the catalytic performance, selectivity, and overall efficiency of ZnO-based photocatalytic systems for sustainable carbon utilization.

2. Results and Discussion

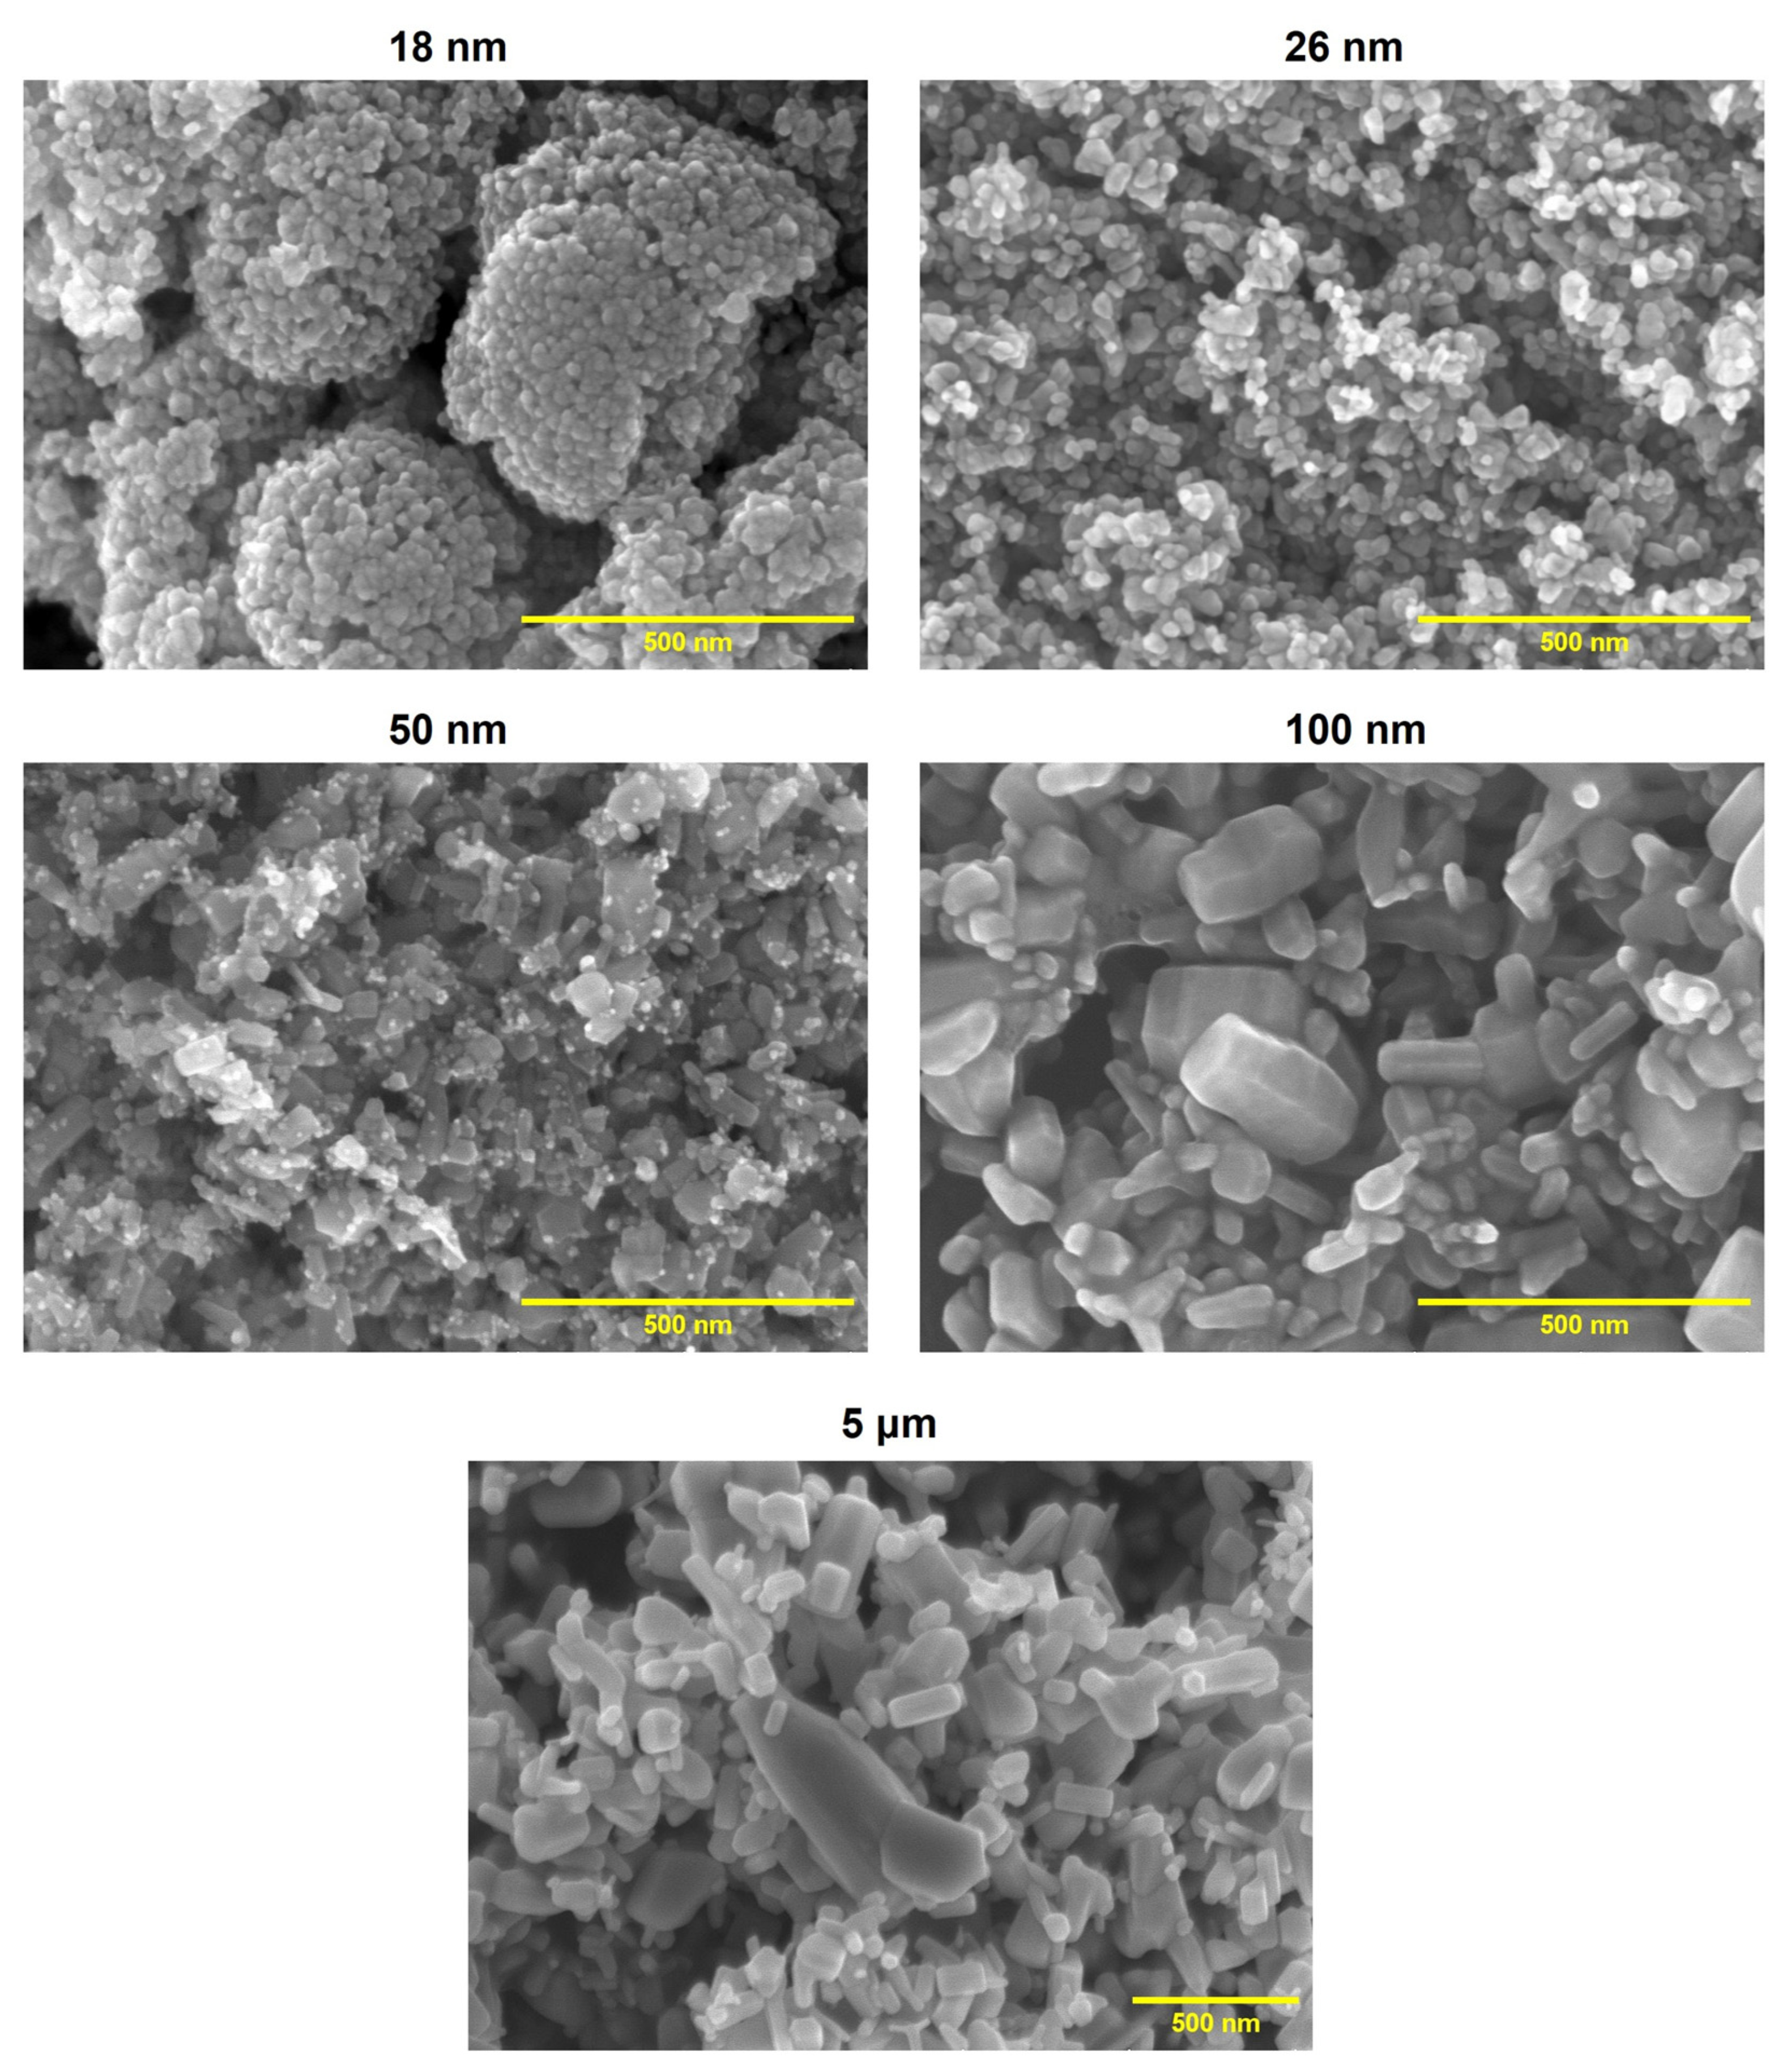
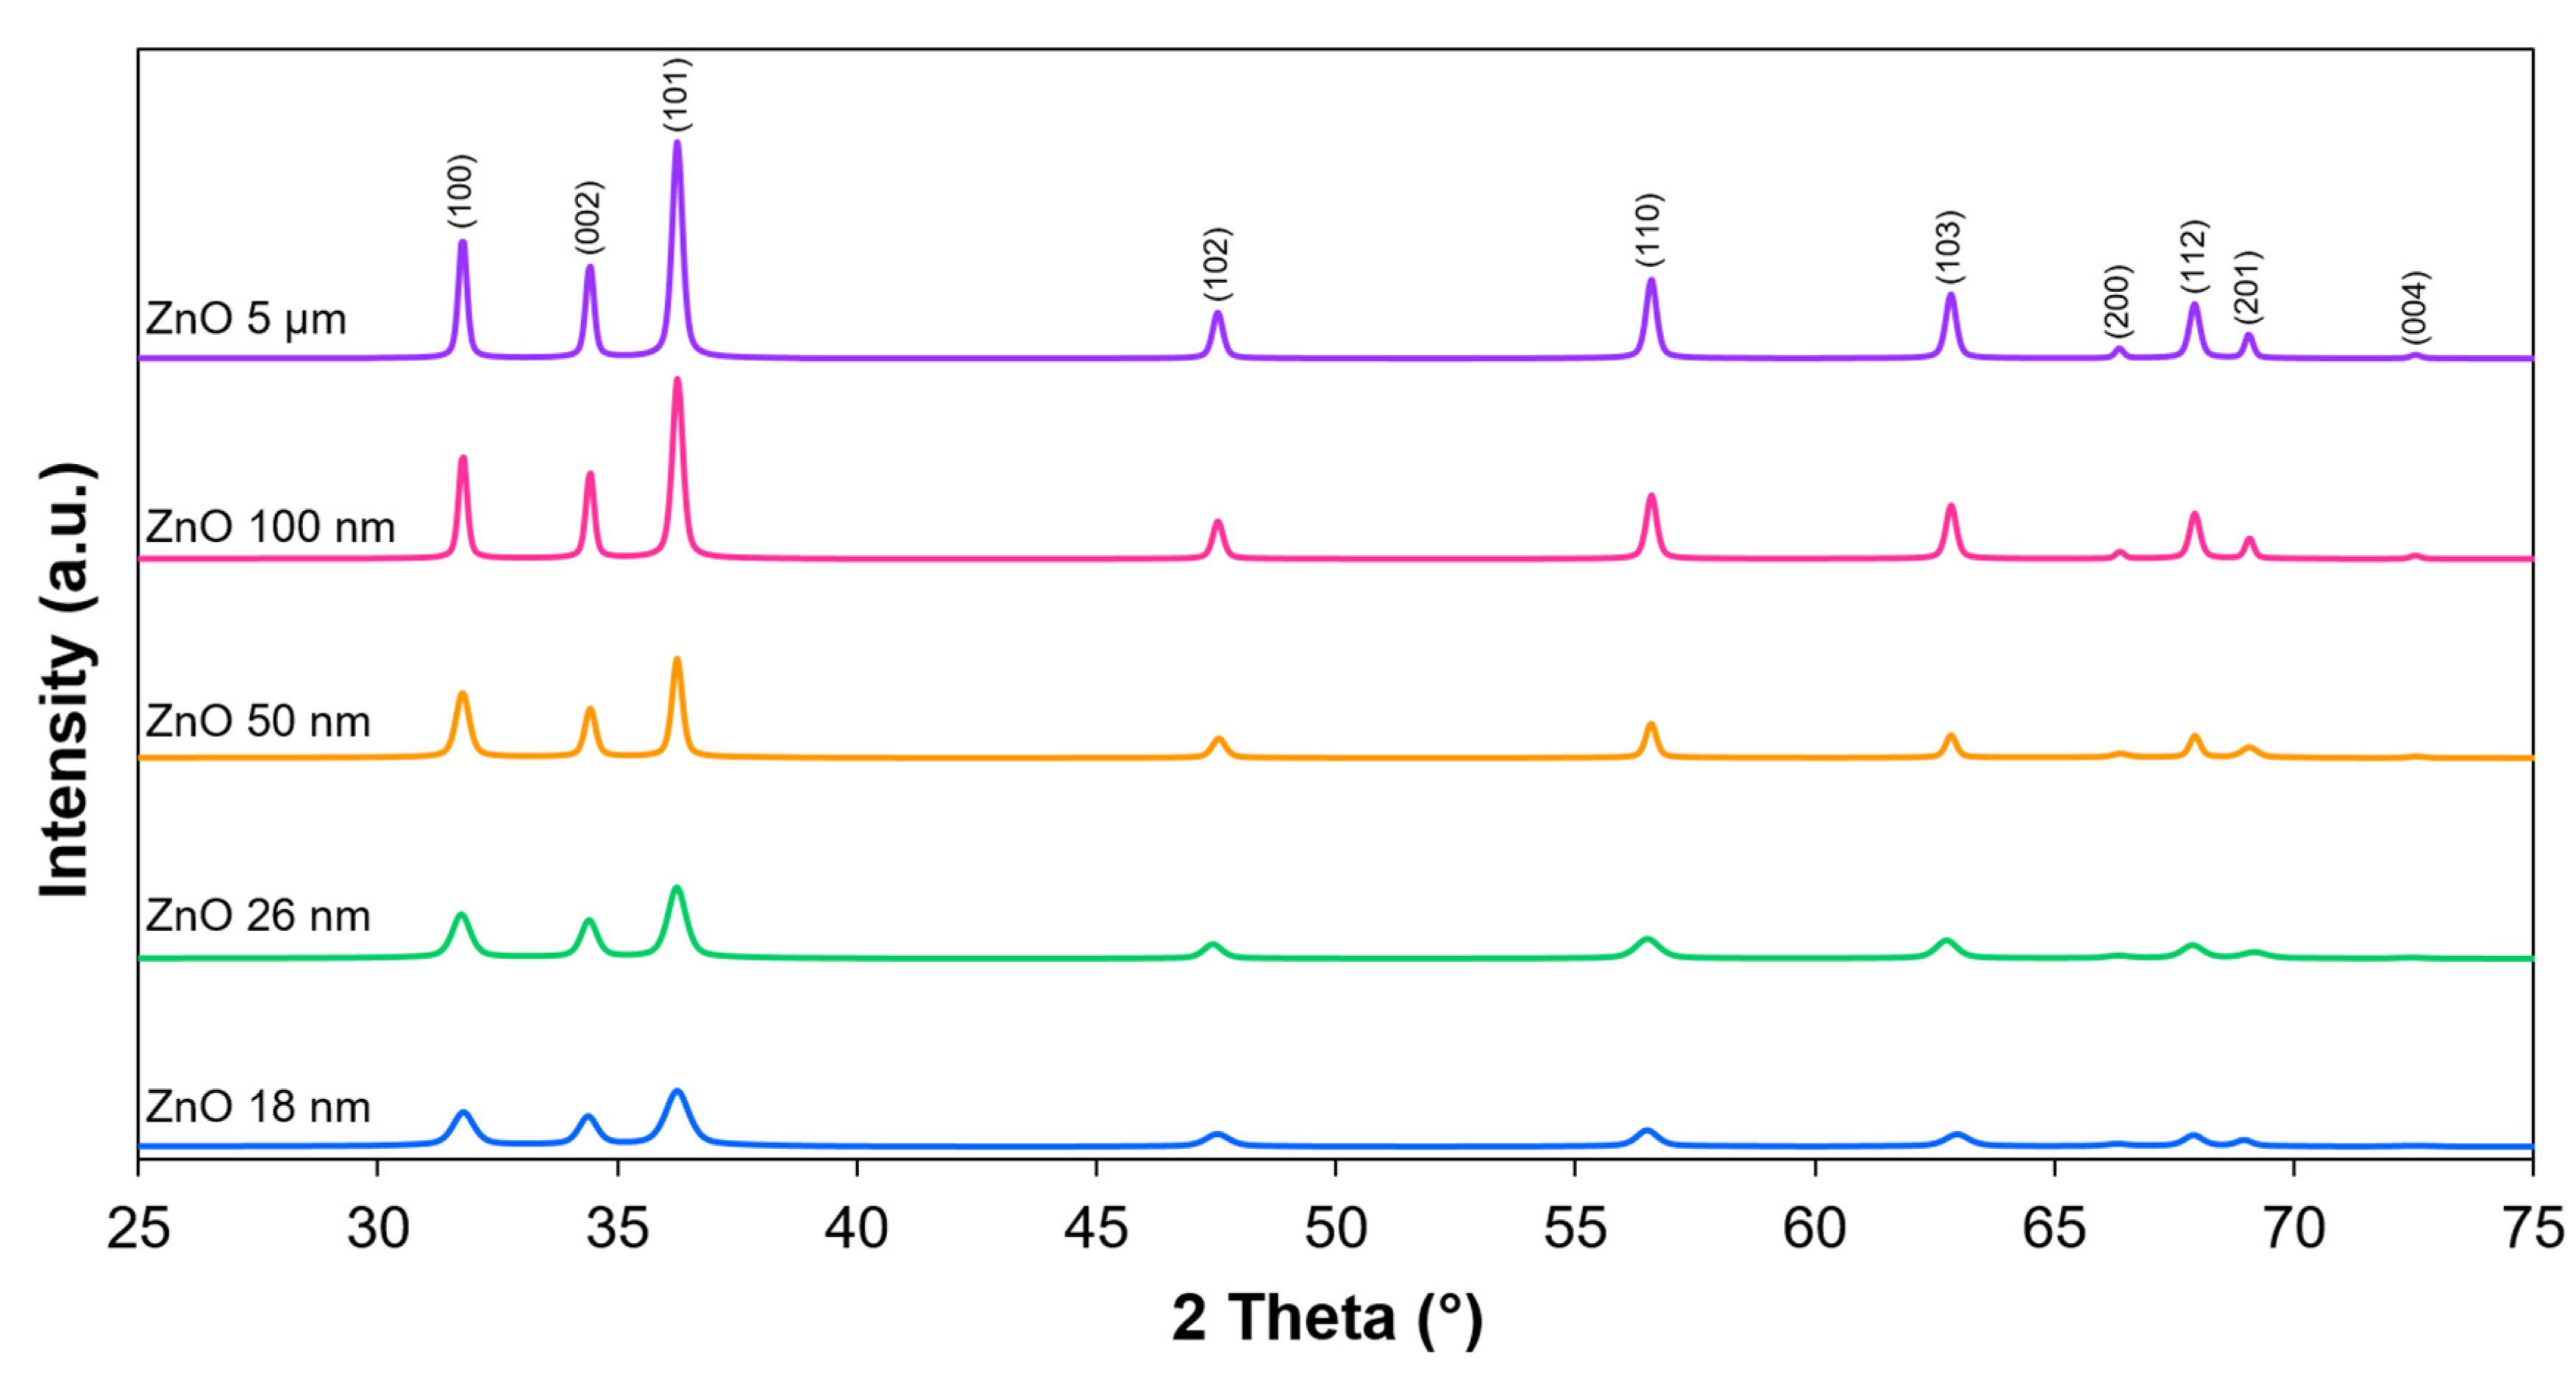
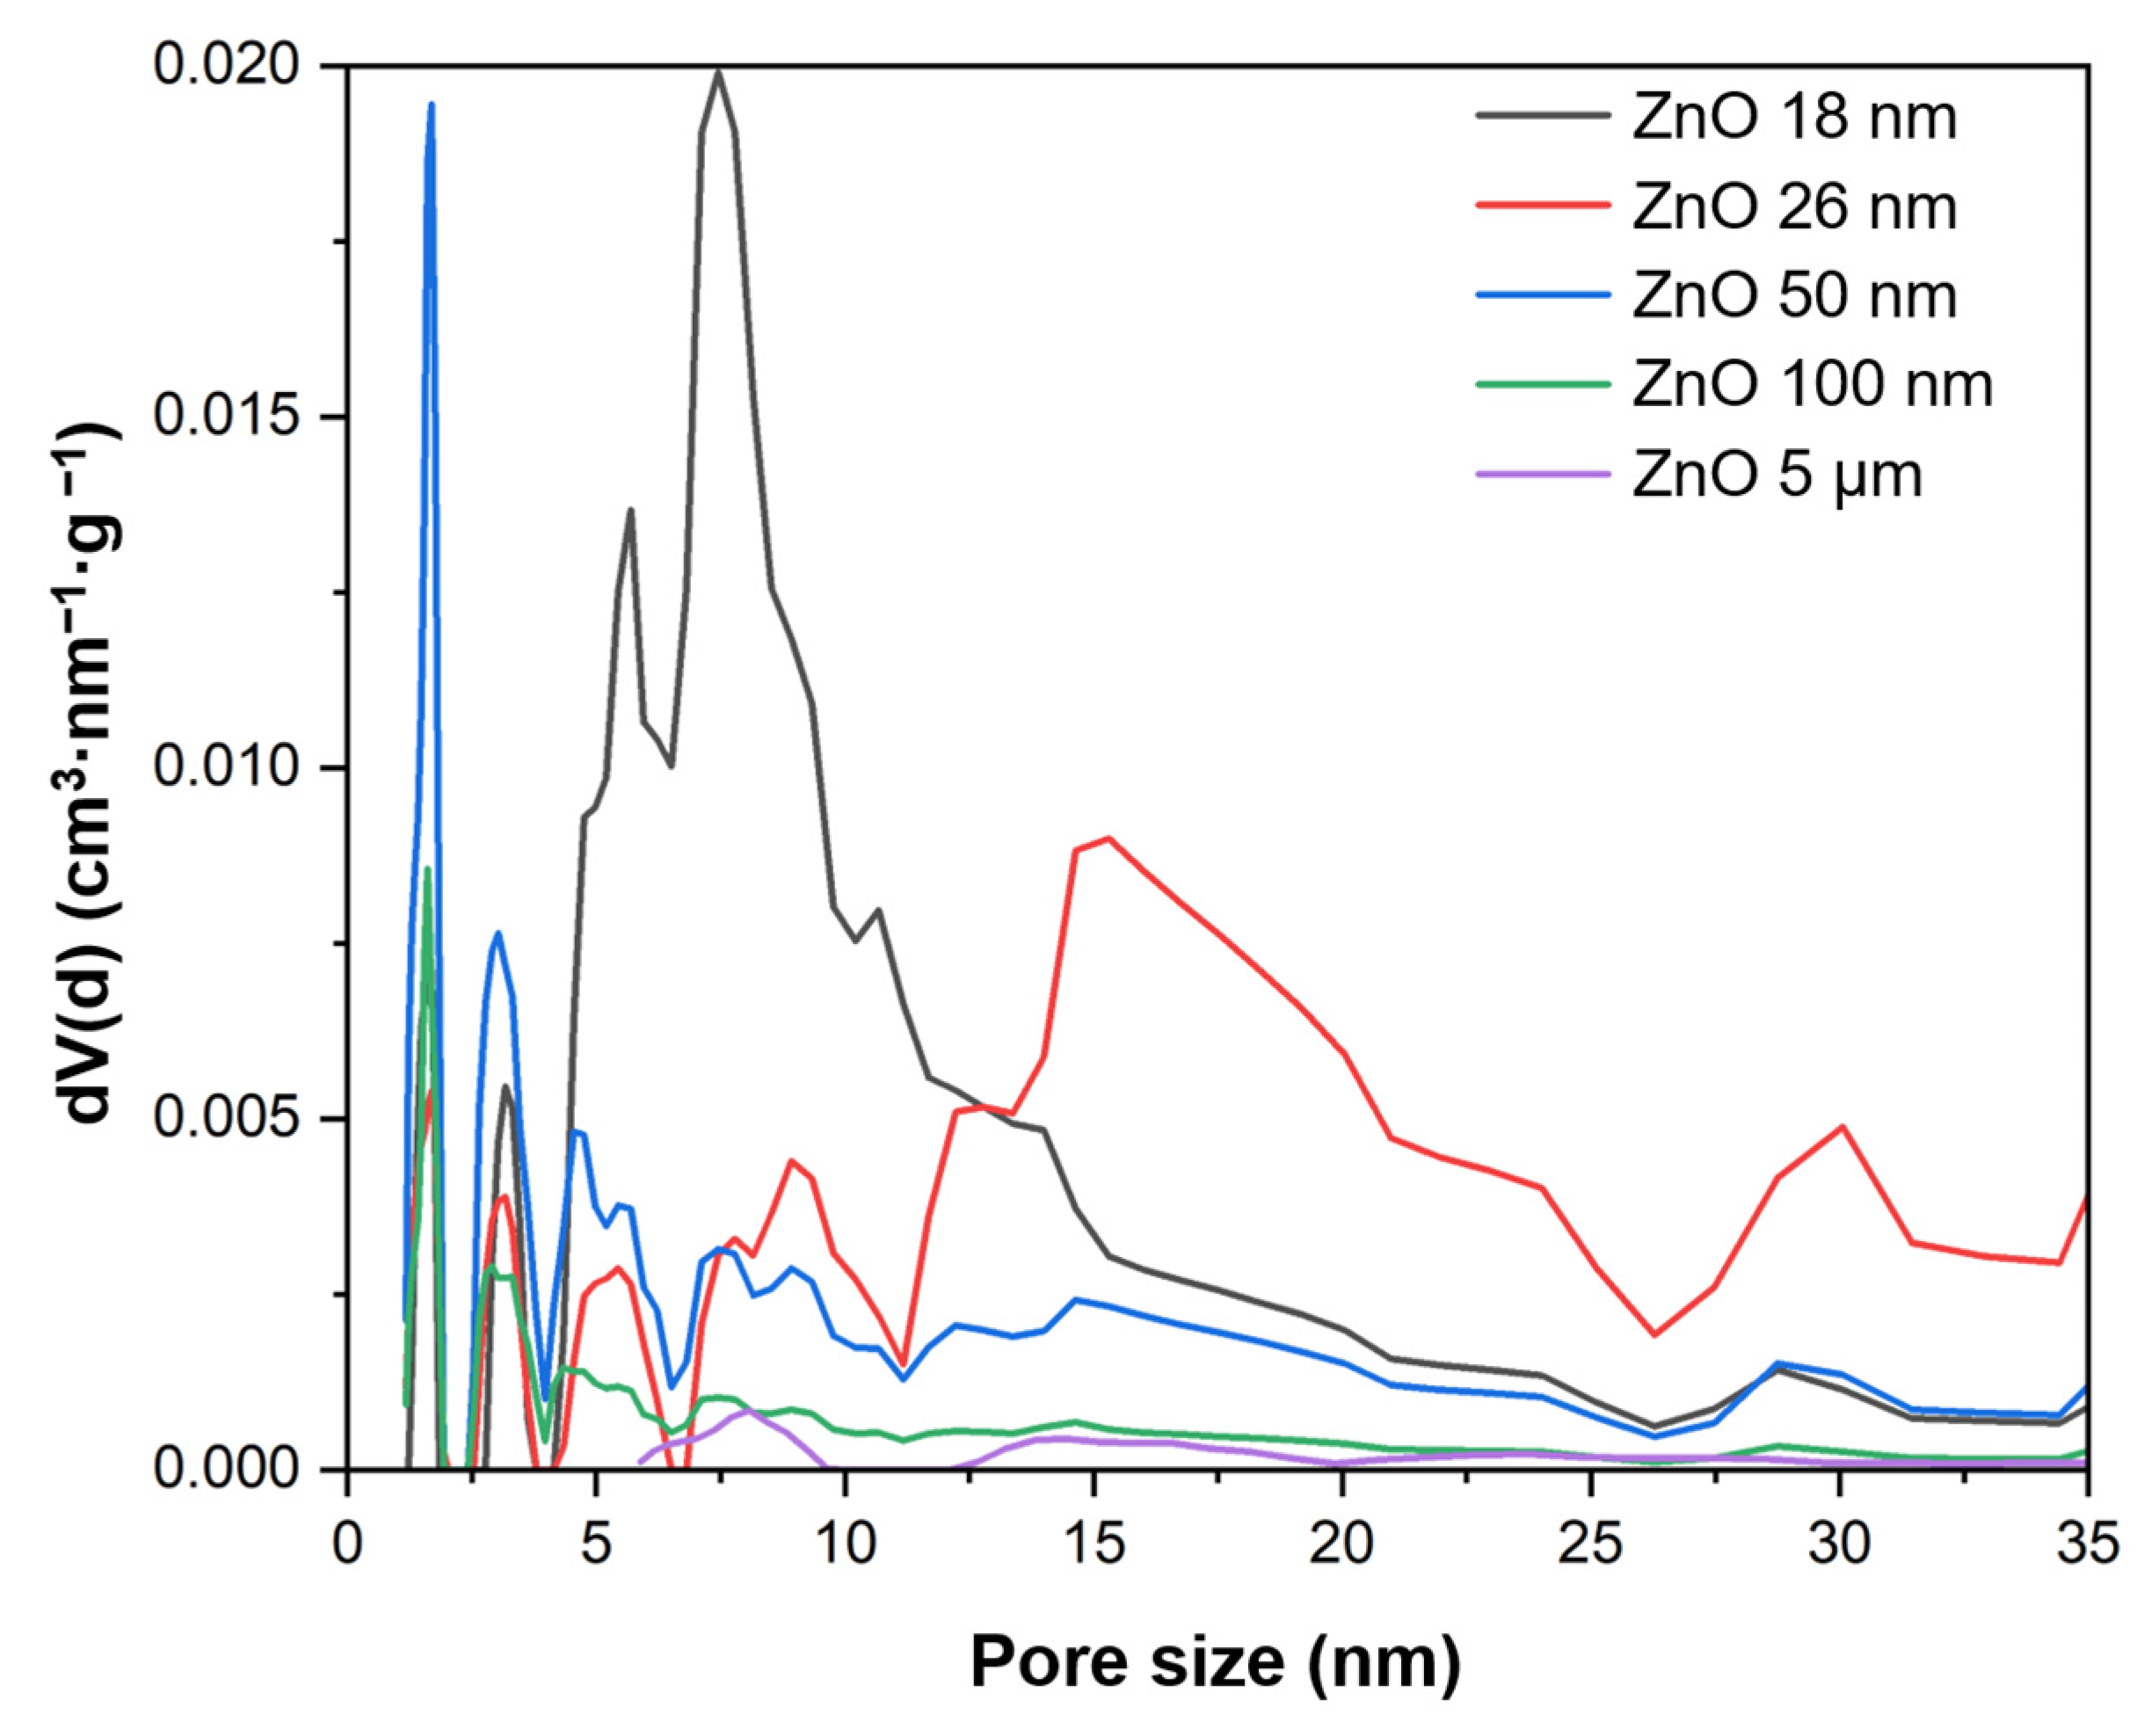
2.1. Material Characterization

The tested materials containing ZnO differed in morphology and physicochemical properties. SEM images are presented in Figure 1. It can be observed that powders with smaller particle sizes (ZnO 18 nm and ZnO 26 nm) formed agglomerates of spherically shaped particles. In turn, the ZnO 50 nm sample was the most non-uniform, and it was a mixture of very tiny spherical particles and a slightly bigger rod-shaped fraction. ZnO 100 nm consisted of nanorods of an irregular size. Similarly, ZnO 5 μm was composed of rod-like particles. It is worth emphasizing that these particles were much smaller than declared by the manufacturer, and the presence of micrometer-sized particles was not observed.
The XRD analyses of the tested materials revealed the presence of a crystalline phase. The X-ray diffraction patterns are shown in Figure 2. All the peaks were assigned to only one phase, which was zinc oxide in the form of hexagonal zincite (ICDD: 00-036-1451). Furthermore, it can be observed that with the increase in the particle size declared by the manufacturers, the reflections became narrower. Based on this, the crystallite size was calculated for each material according to the Scherrer equation. The results are presented in Table 1. As expected, there was a correlation between crystallite size and particle size. The crystallite size was the smallest for the ZnO 18 nm sample (22 nm), and it further increased with particle size. In the case of ZnO 5 μm, it was >100 nm.
The next-investigated parameter was specific surface area (SBET). The highest value was noted for the ZnO 18 nm sample at 40.9 m2/g. It decreased with an increase in particle size, and in the case of ZnO 5 μm, it was only 7.6 m2/g. Since CO2’s adsorption ability is a key factor in the process of the photocatalytic reduction of carbon dioxide, the total pore volume (TPV) was also determined. It ranged from 0.021 cm3/g to 0.205 cm3/g. It was found that the highest value of this parameter was observed for ZnO 26 nm. For ZnO with an even smaller particle size (18 nm), it was 0.157 cm3/g. In the case of subsequent materials, it decreased (Table 1). Pore size distribution is presented in Figure 3. The mesopores constituted the majority of the pore volume of all the tested materials, and they were in the range of 0.019–0.202 cm3/g. In contrast, a small number of micropores were observed (0.002–0.009 cm3/g).

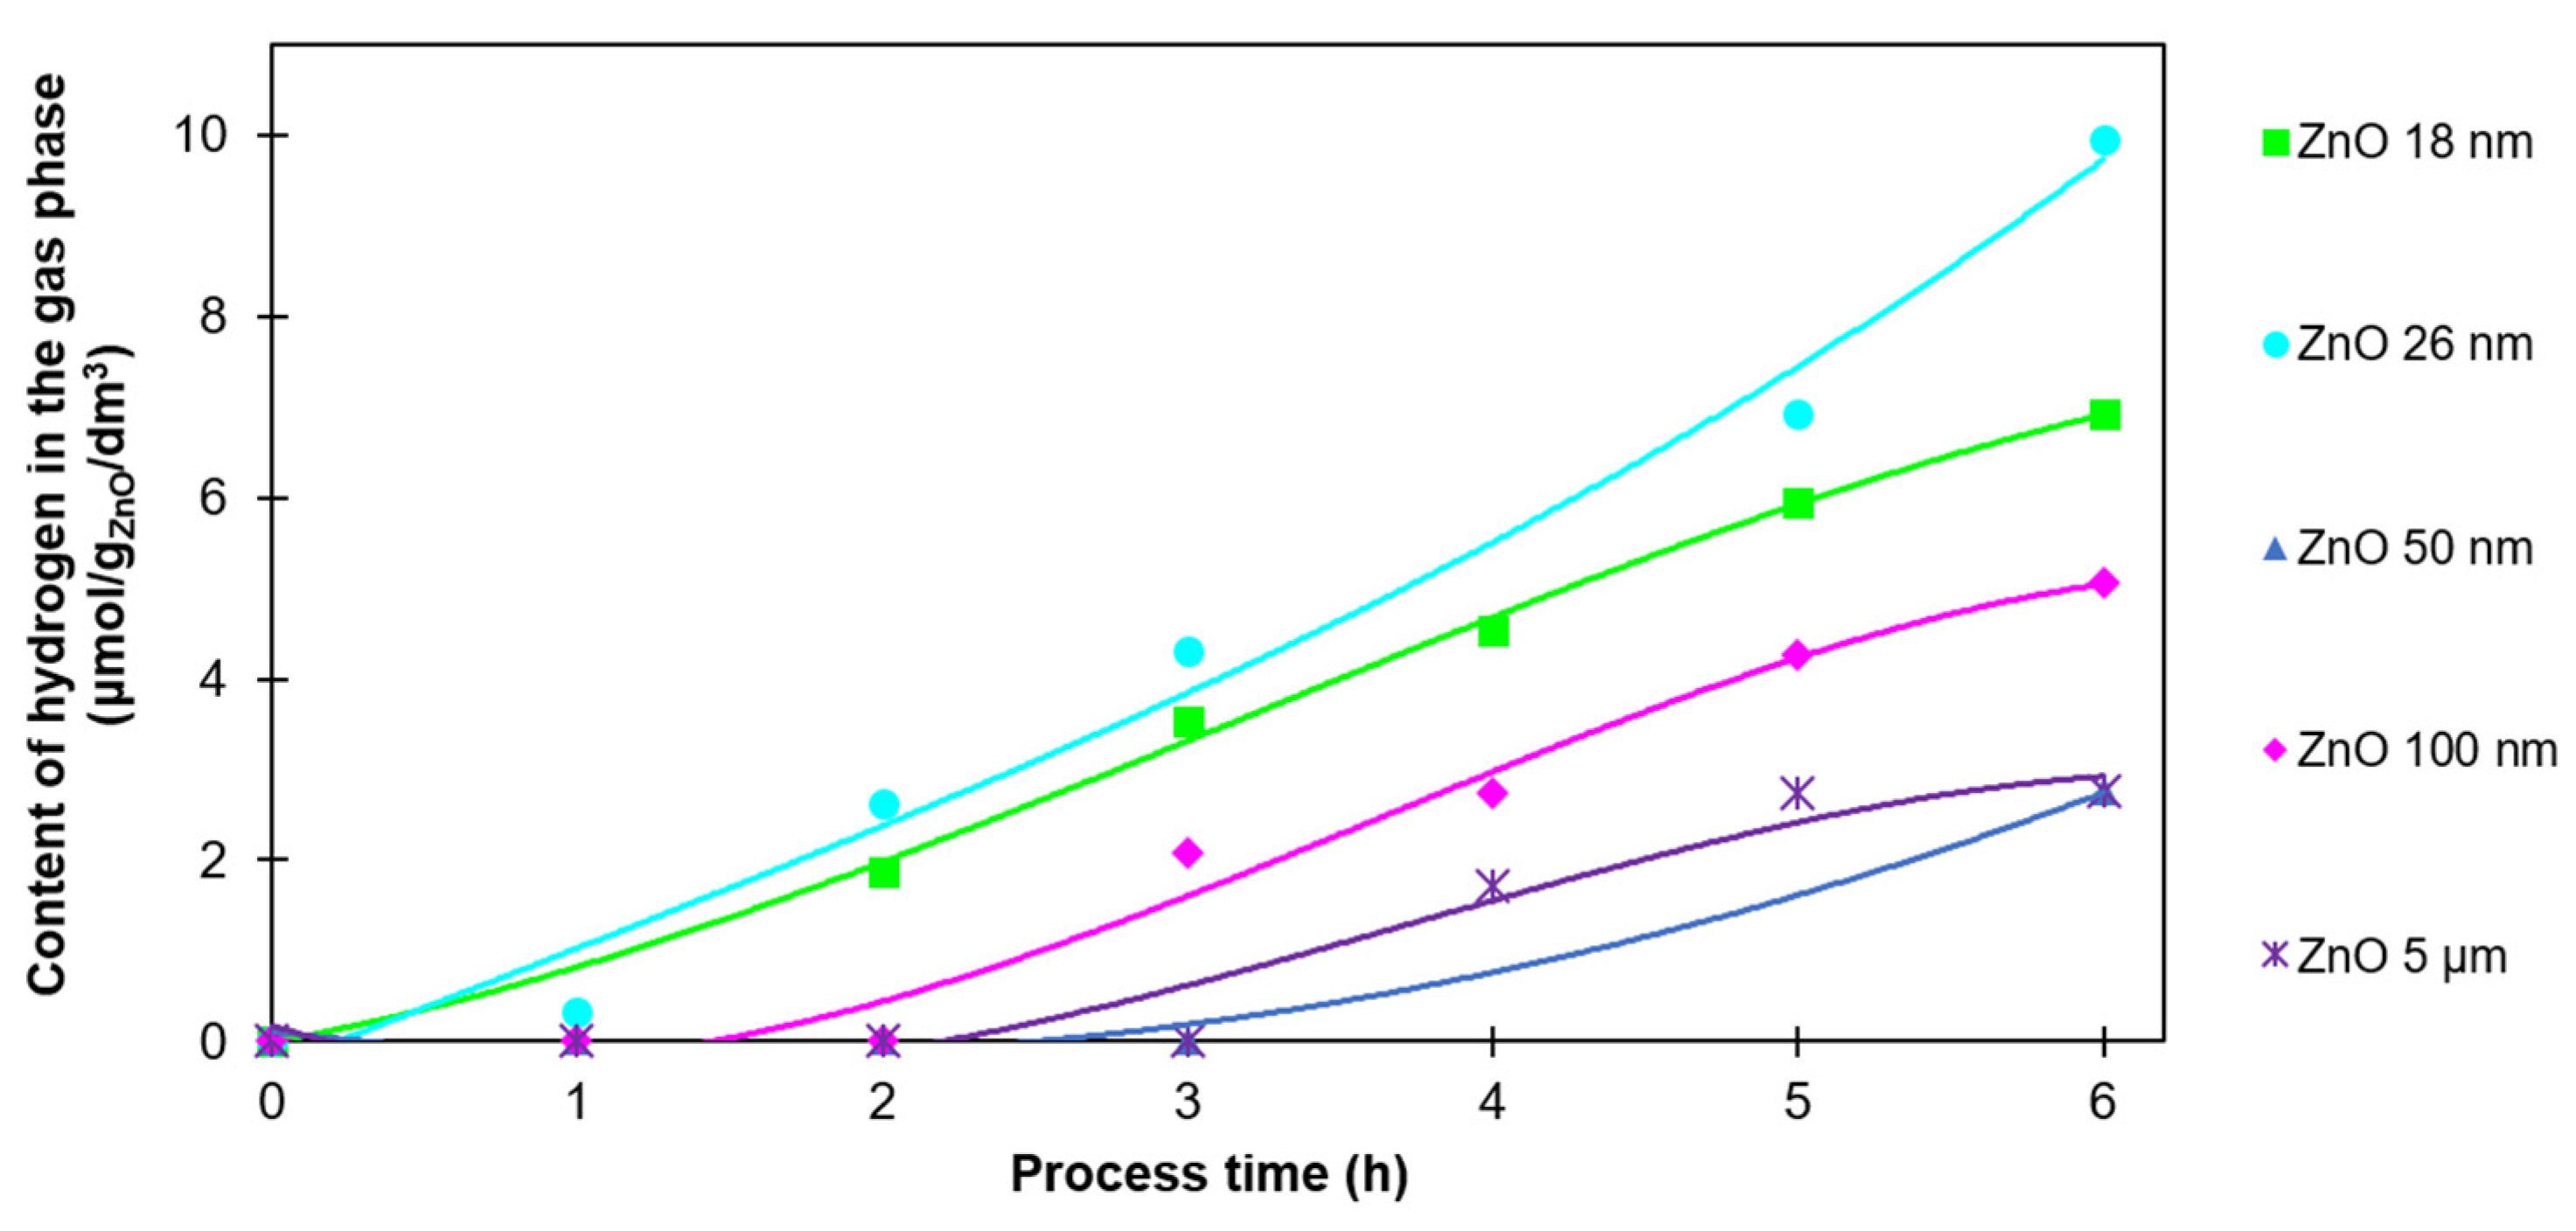
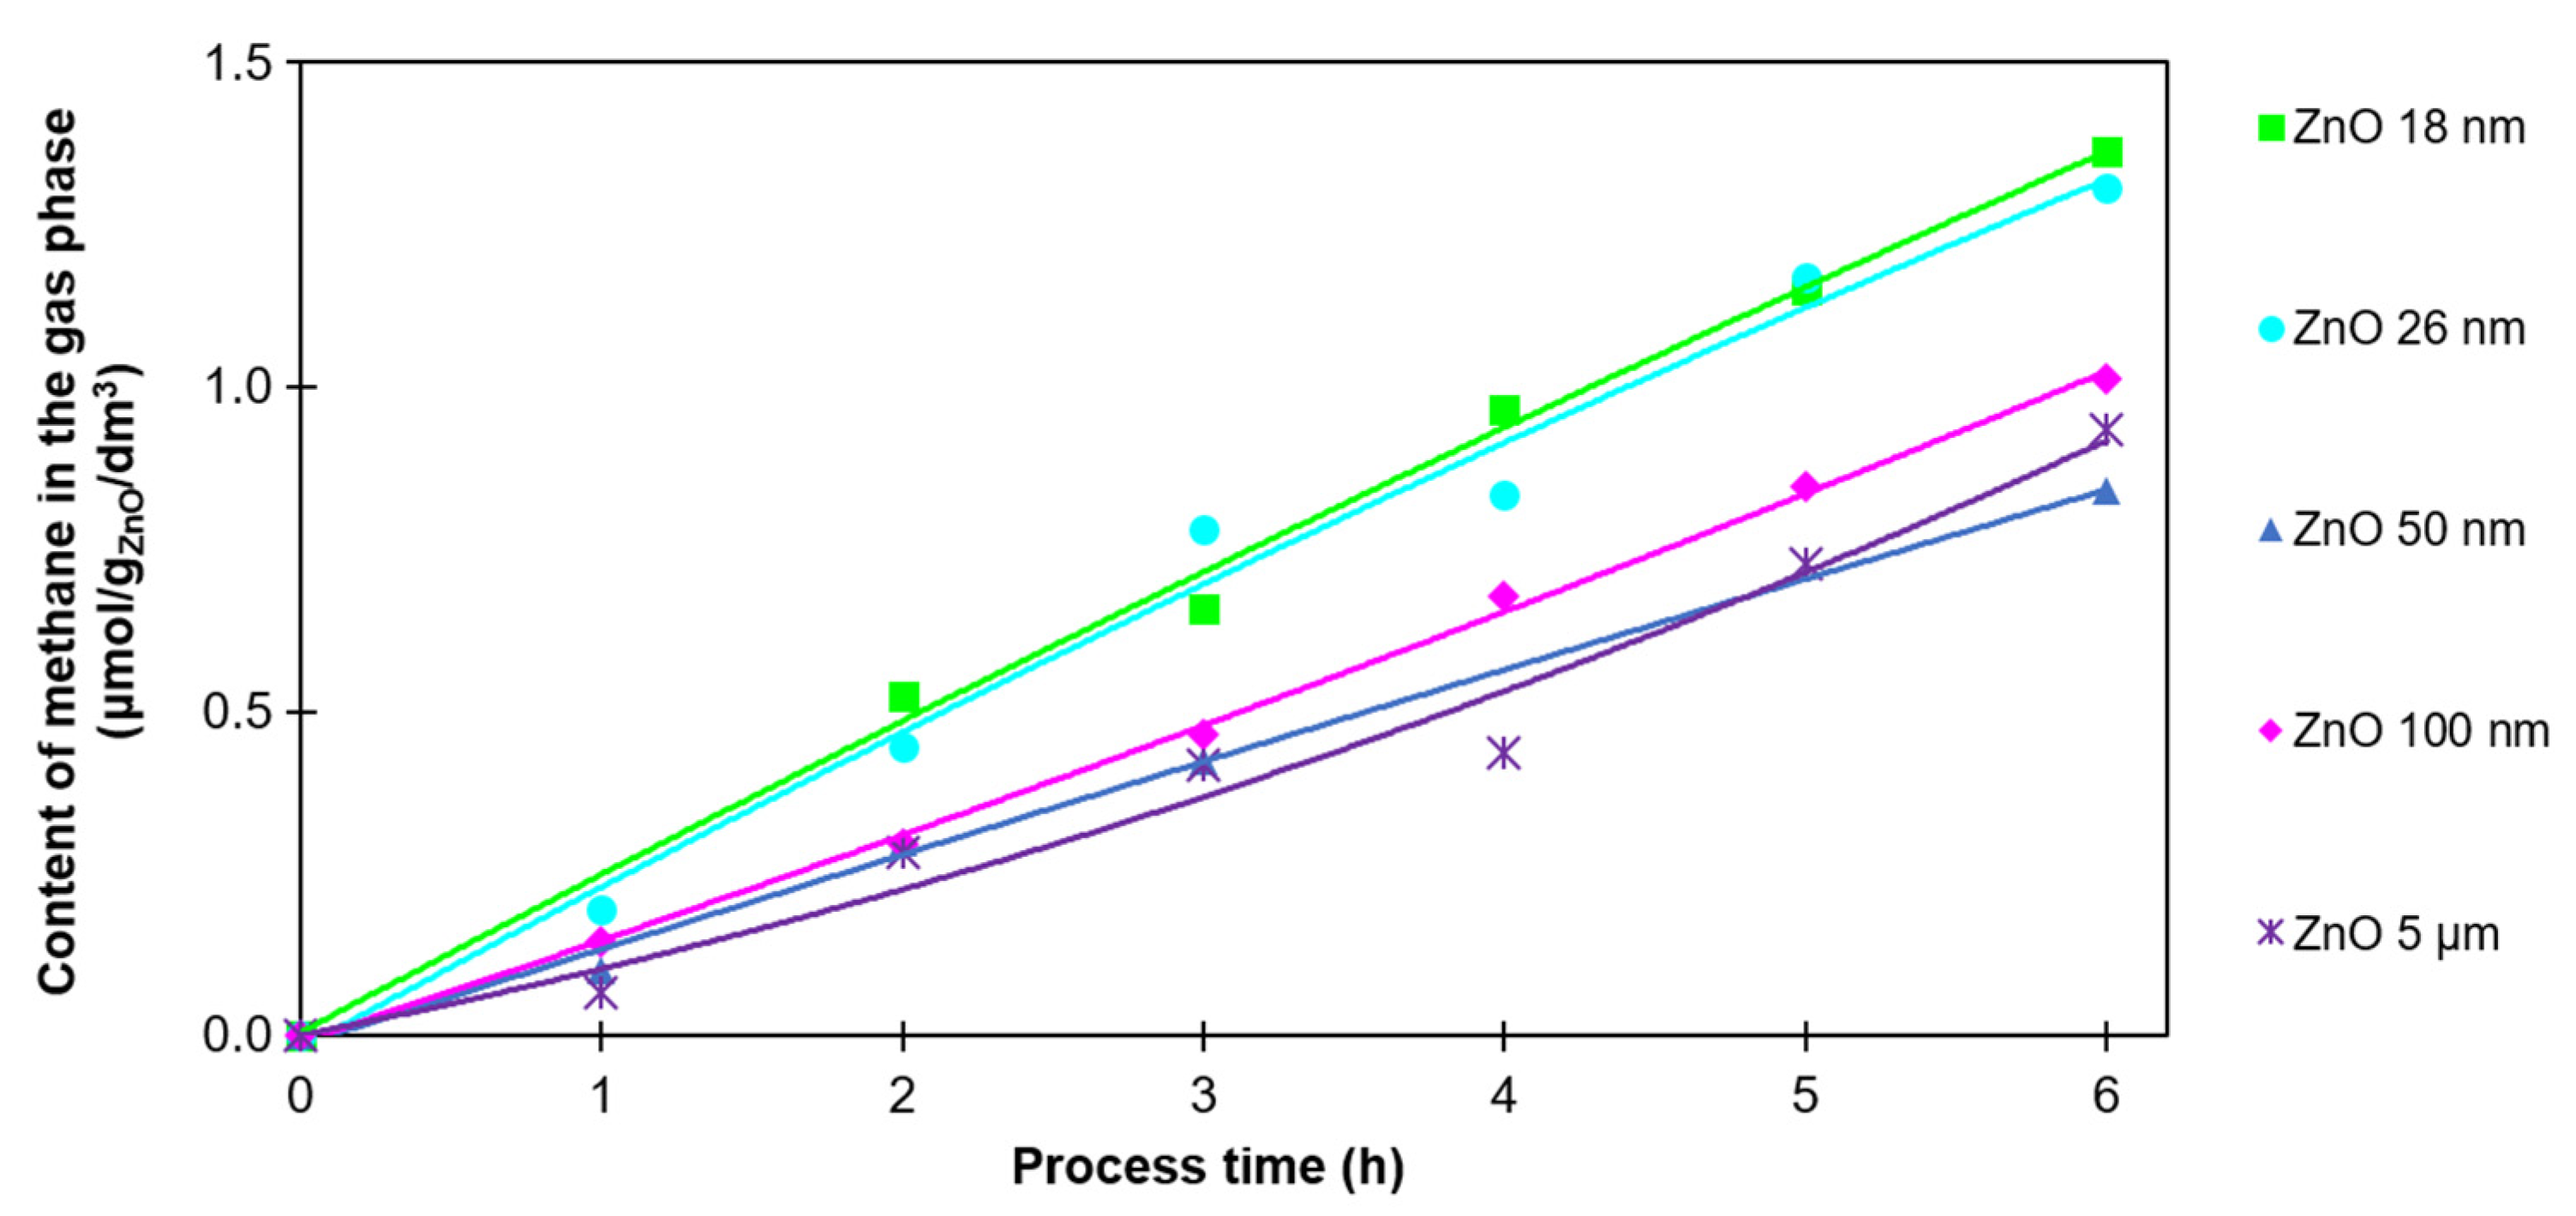
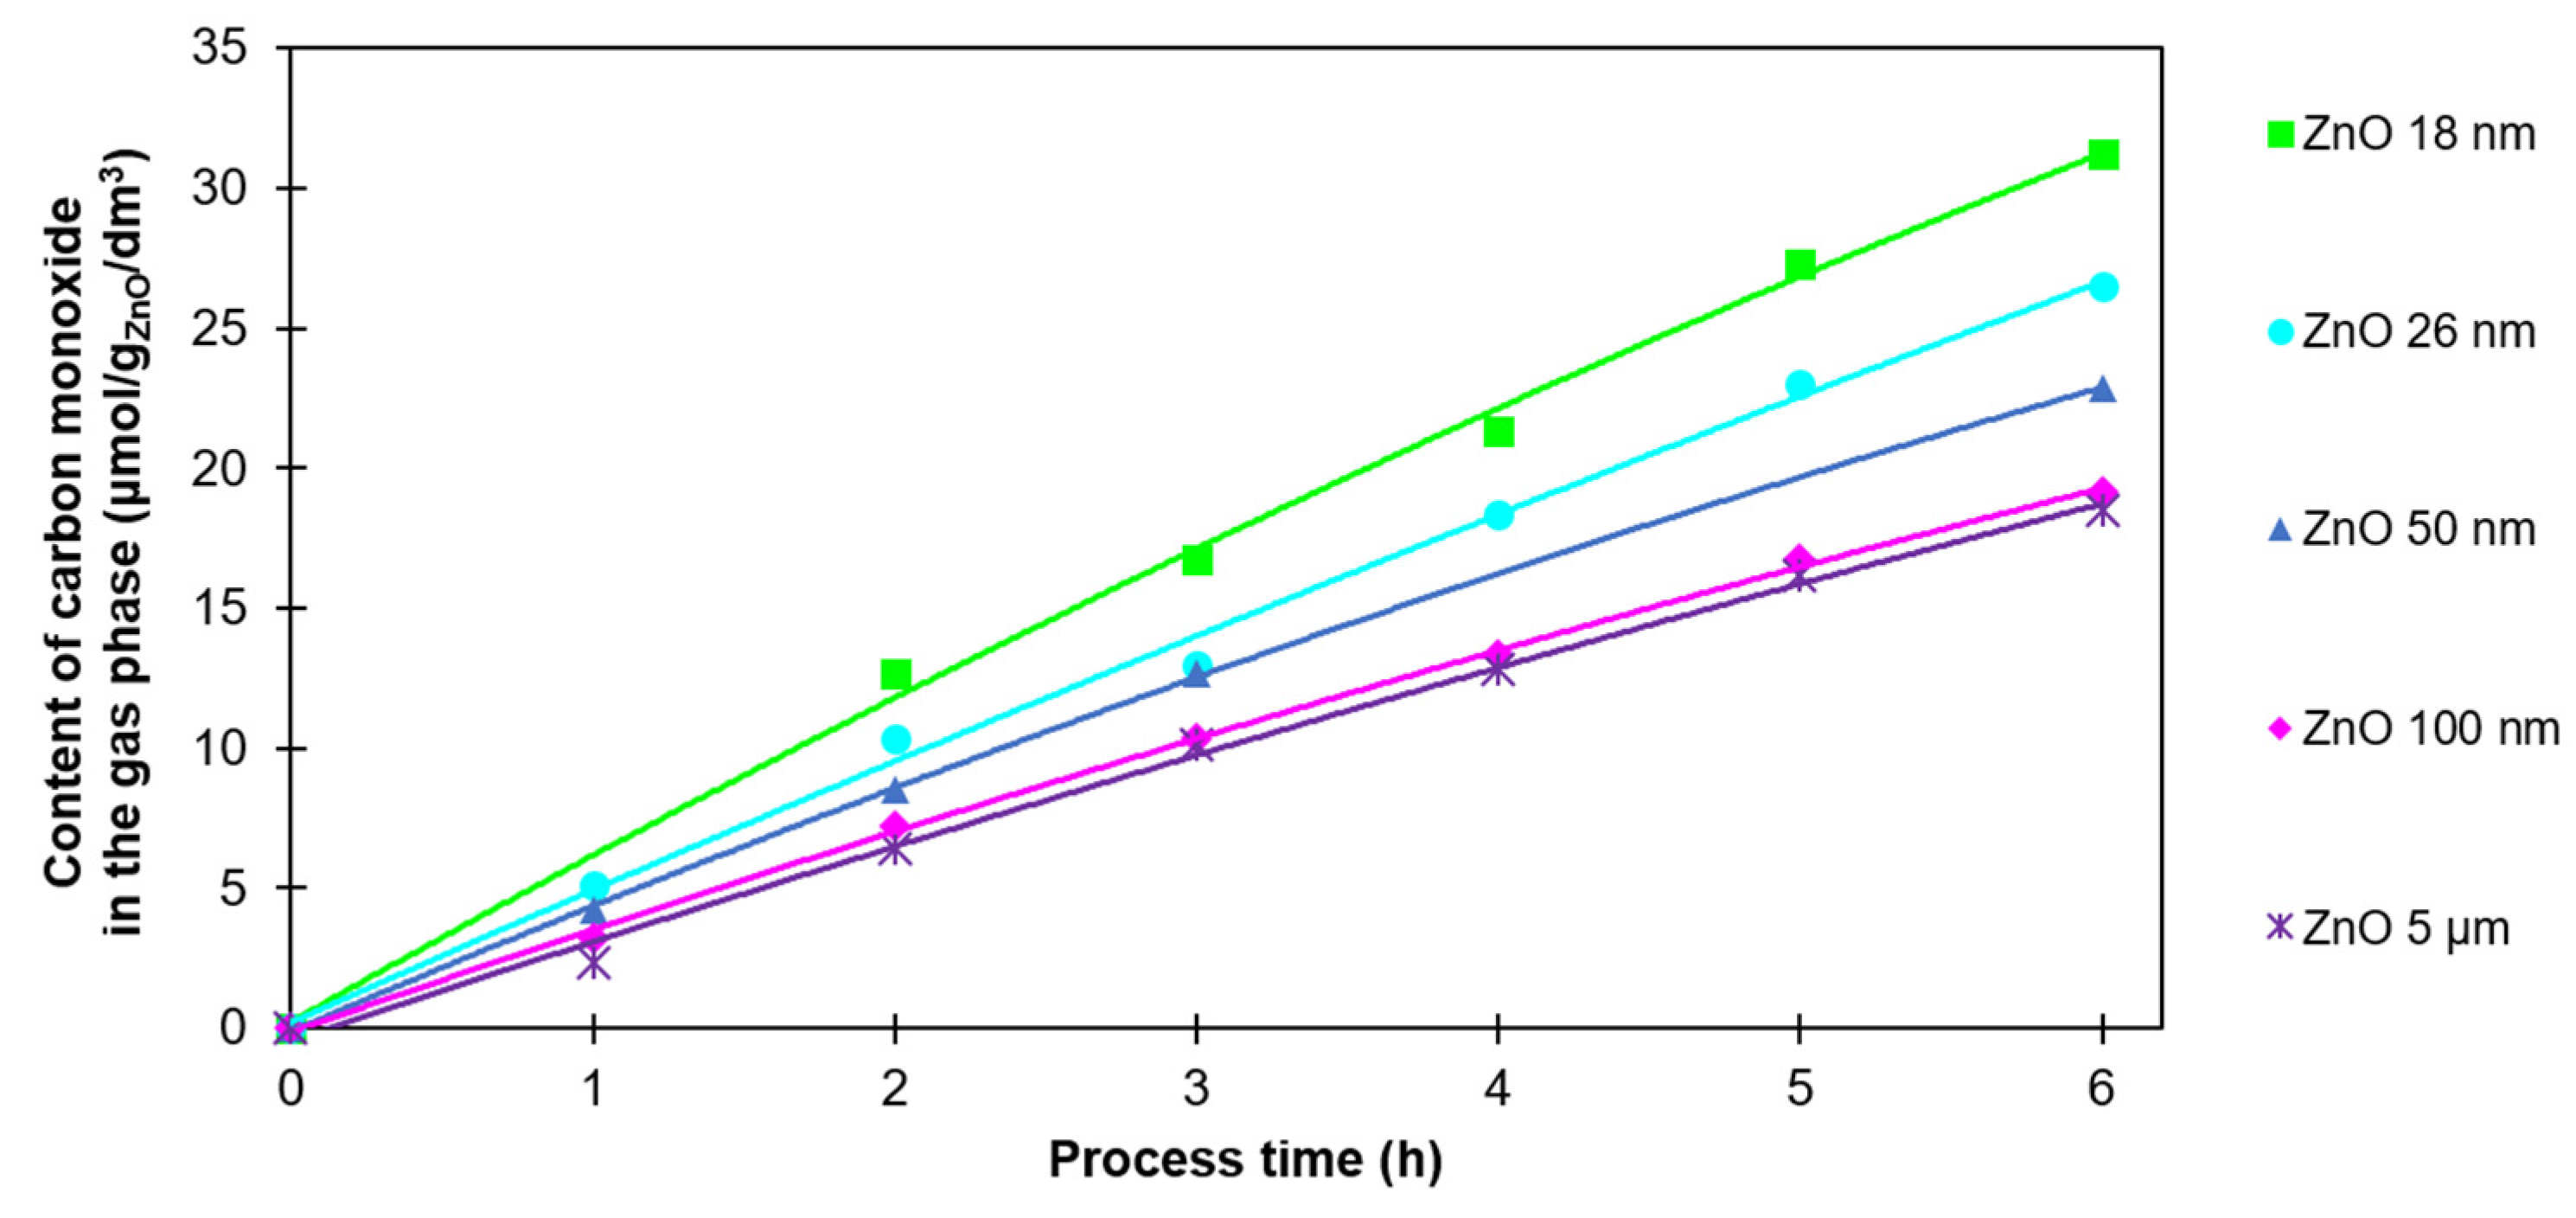
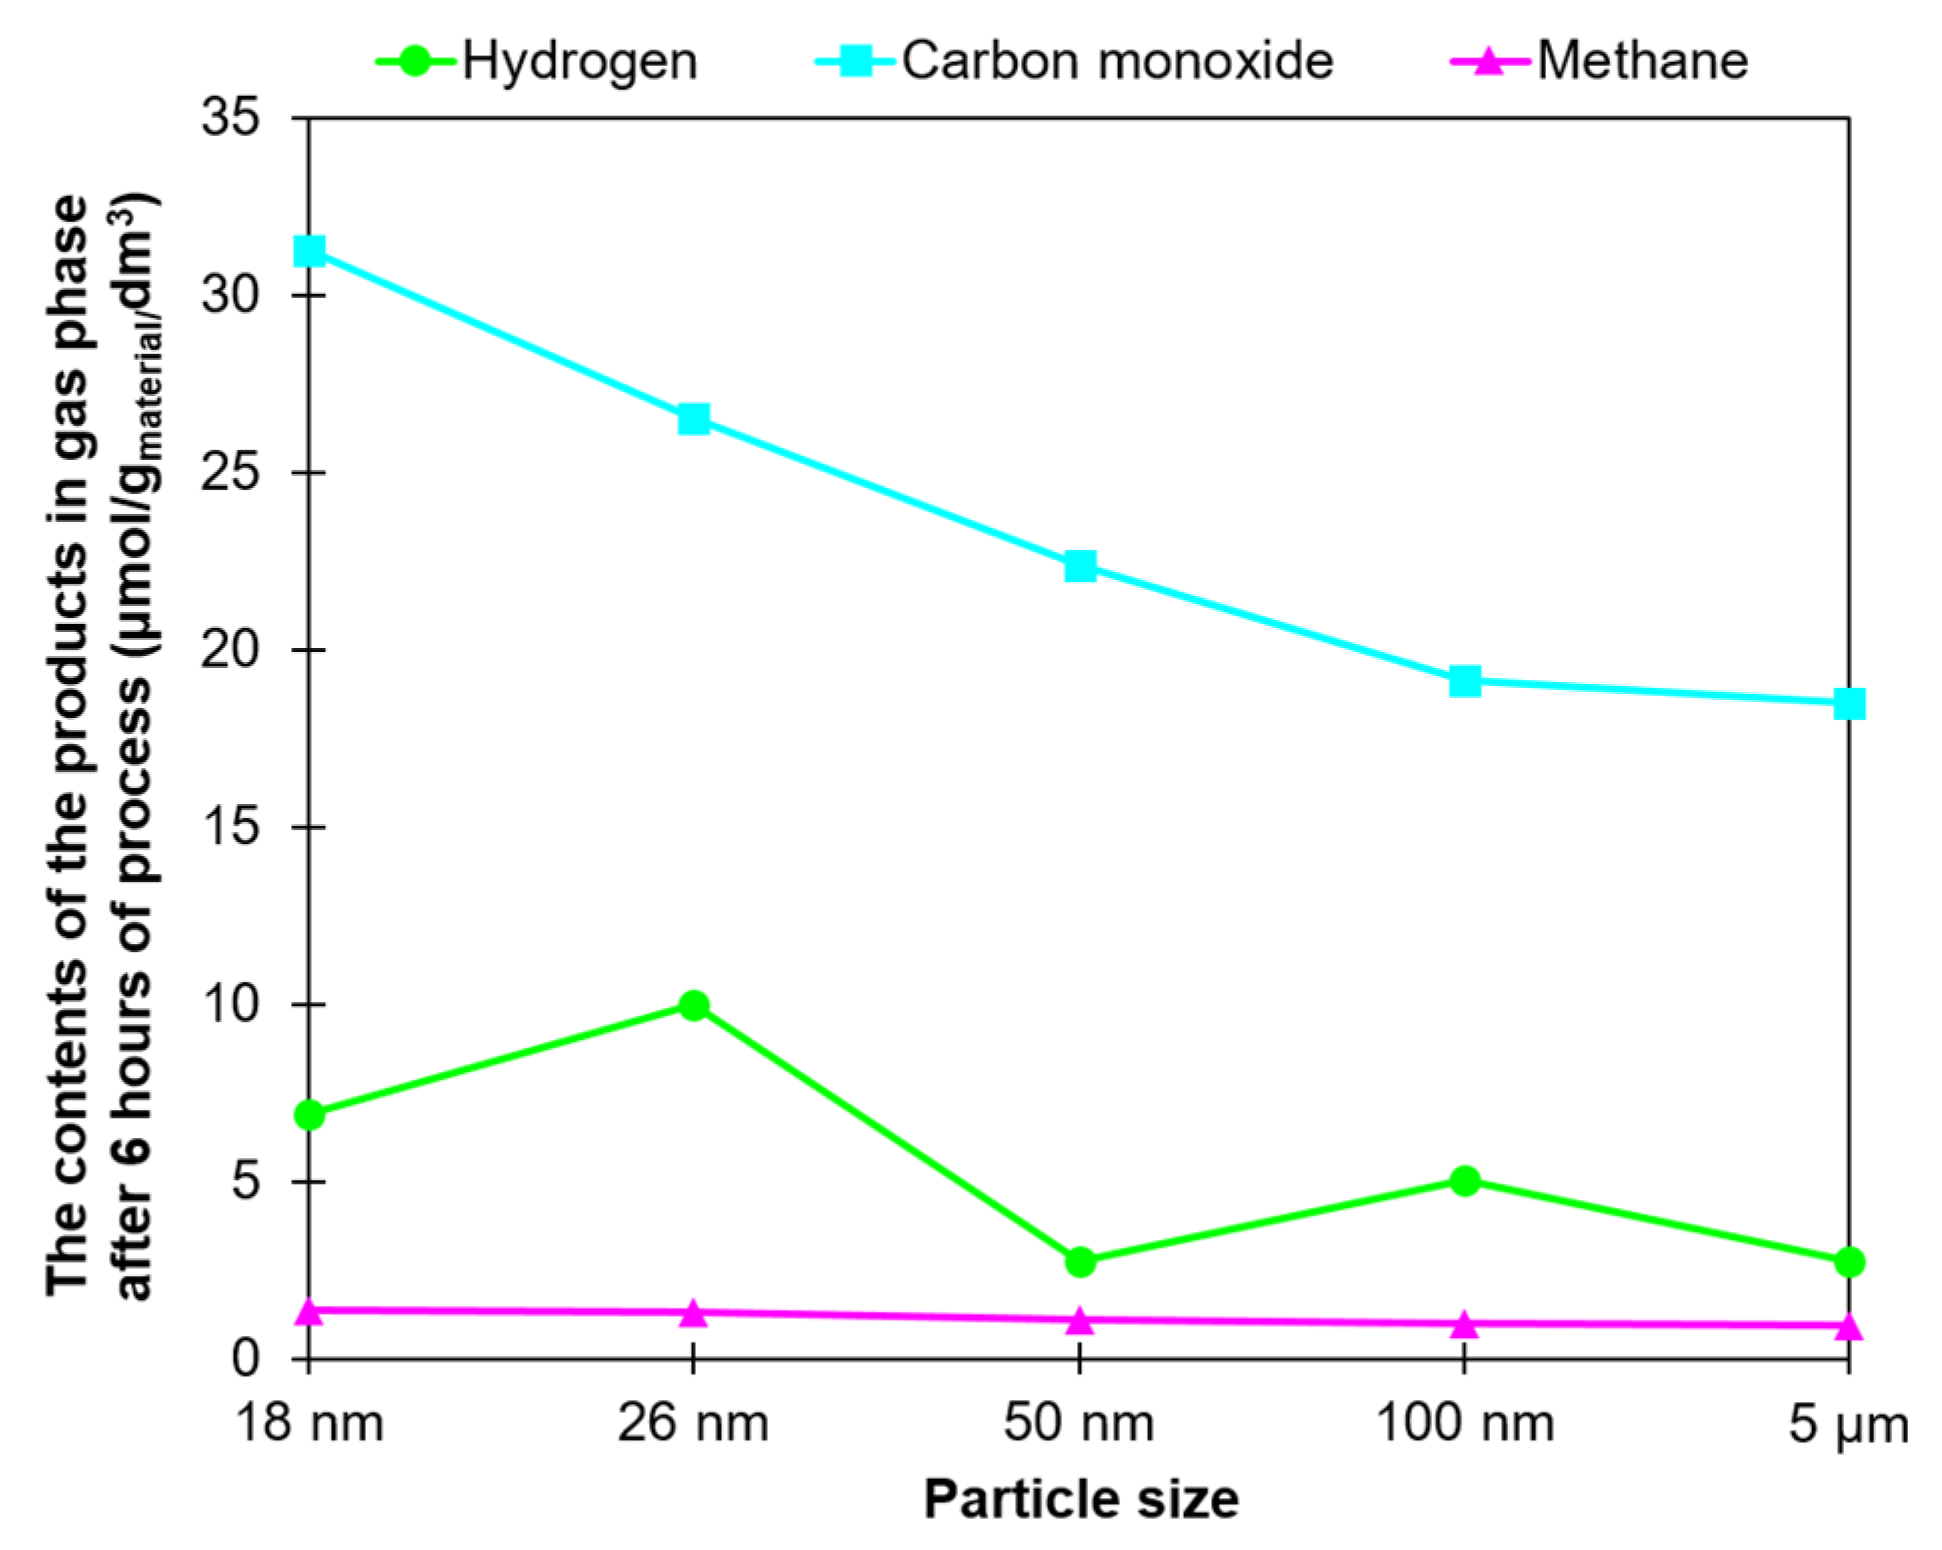
2.2. Photocatalytic Process

The ZnO samples with various particle sizes (from 18 nm to 5 µm) were tested as an efficient catalyst for the photocatalytic reduction of CO2 in the gas phase. The ZnO was applied on the glass fiber strips, as described in Sample Preparation, Section 3.1. The process was performed for 6 h. The products obtained during the photocatalytic conversion of CO2 were H2, CO, and CH4. Their amounts were determined with the use of gas chromatography. They can be formed in the following reactions [24,25,26]:
  • Water splitting, where a two-electron reaction is necessary for CO2 reduction. At this stage, hydrogen is formed:
H 2 O + 2 h + O 2 2 1 + 2 H +
2 H + + 2 e   H 2
  • The two-electron reduction of CO2 in the presence of 2H+ and 2e leads to the formation of carbon monoxide:
CO 2 + 2 H + + 2 e CO + H 2 O
  • The eight-electron reaction occurs, resulting in methane production:
CO 2 + 8 H + + 8 e CH 4 + 2 H 2 O
Hydrogen is generated from the photochemical decomposition of water, and it is necessary for the photoreduction of CO2 into other valuable compounds. Figure 4 shows the amount of hydrogen generated on ZnO as a photocatalyst. It should be emphasized that the amount of hydrogen identified in the reactor was not the total amount of this product obtained during the process. It was excess hydrogen not used in other reactions.
The correlation between the particle size and hydrogen amount was not observed. The amount of hydrogen was in the range of 2.7–10.0 µmol/gZnO/dm3. The highest value was observed for ZnO 26 nm, and the lowest for ZnO 50 nm and 5 µm. In addition, in the case of ZnO 50 nm, ZnO 100 nm, and ZnO 5 µm, hydrogen was not detected in the first 2–3 h of the process. Since it is an intermediate product in a complex CO2 photoreduction process, it was immediately consumed in further reactions with various reaction rates. ZnO characterized by a smaller particle size (18 nm and 26 nm) had a developed surface, and hence, more active centers. Therefore, the production of hydrogen with the use of those materials was more efficient.
One of the products of the photocatalytic reduction of CO2 is carbon monoxide. Under the conditions described in Section 2.2., carbon monoxide can be formed in reaction (3) by the reduction of CO2 in the presence of hydrogen. On the other hand, it can be obtained as a result of methane oxidation under UV radiation [27]:
2 CH 4 + 2 O 2 2 CO + 4 H 2 O
2 CH 4 +   O 2 2 CO + 4 H 2
Carbon monoxide was the main product of the photocatalytic process. The CO content in the gas phase is shown in Figure 5.
For all tested ZnO samples, the volume of CO was in the range from 18.5 to 31.2 µmol/gZnO/cm3 after 6 h of the process. The highest value (31.2 µmol/gZnO/cm3) was noted for ZnO 18 nm and the lowest value was observed (18.5 µmol/gZnO/cm3) for ZnO 5 µm. It is worth noting that the amount of CO in the gas phase increased linearly. Also, the explicit correlation between particle size and carbon monoxide amounts is visible on the graph. In the case of ZnO 100 nm and ZnO 5 µm only, no significant difference was observed. This is probably due to their low SBET and TPV values. Their ability to reduce CO2 is lower in comparison to the samples with smaller particles.
In contrast to hydrogen, carbon monoxide was detected in the gas phase after the very first hour of the process. This fact allows us to conclude that the photocatalytic reduction of CO2 began immediately after the irradiation started.
The last analyzed compound in the photocatalytic reduction of CO2 was methane. This reaction requires eight electrons (Equation (4)); therefore, obtaining CH4 is difficult. The reactions requiring fewer electrons (Equations (1)–(3)) are favored. Furthermore, the CH4 formed can be consumed in the oxidation reaction (Equations (5) and (6)). The amount of methane produced is shown in Figure 6.
Methane was produced in the smallest amounts. The volume of methane after 6 h of process was between 0.9 and 1.4 µmol/gZnO/cm3. As in the case of hydrogen and carbon monoxide, its highest value was obtained in the process using ZnO with the smallest particle size (18 nm). Moreover, CH4, just like CO, was observed from the very beginning of the process. For ZnO with a particle size >50 nm, the amount of methane produced decreased, and no correlation was found between particle size and CH4 production rate.
The summarizing graph showing the relationship between the contents of the products and ZnO particle size is presented in Figure 7.
Concerning all the products detected, it can be said that the amount of CO produced strongly depended on the particle size of the tested ZnO, and it increased with decreases in this parameter. Also, the highest amounts of methane were obtained for the two samples of ZnO characterized by the smallest particle sizes, 18 nm and 26 nm. In the case of hydrogen only, no correlation observed between the amount and size of particles. However, it should be emphasized that hydrogen participates in many reactions of the complex CO2 photoreduction process.

3. Methodology

3.1. Sample Preparation

The following materials were used as a catalyst in the photoreduction of CO2: ZnO with two different particle sizes (18 nm and 26 nm) produced by the Institute of High-Pressure Physics (PAN, Warsaw, Poland) with the use of the solvothermal method [24]. Also, three commercial ZnO powders with varying particle sizes were tested: 50 nm, 100 nm, and 5 μm (Sigma-Aldrich, Saint Louis, Missouri, USA).
The samples were prepared as follows: 200 mg of ZnO was placed in a small beaker, and then 10 cm3 of distilled water was added. The prepared suspension was applied on a weighted glass fiber (20 × 100 mm) using a brush. Then, the prepared catalyst was dried at 120 °C for 1 h. Before and after drying the strips of glass fiber and applying the material, they were weighed and the amount of deposited ZnO was calculated. Finally, it was placed inside the reactor, just above the water.

3.2. Material Characterization

The phase composition of the tested materials was studied via the XRD method using the Empyrean PANalytical diffractometer (25–75° 2θ, Cu Kα, Malvern Panalytical Ltd., Malvern, UK) equipped with the HighScore+ v.4.0 software and the ICDD PDF-4+ database. Also, crystallite size was calculated according to the Scherrer Equation (7) based on obtained X-ray powder diffraction patterns:
D = k · λ β · cos   Θ
where D is the average crystallite size in the direction perpendicular to the hkl reflection plane; k is a constant close to unity, and dependent on the shape of the crystallite; λ is the X-ray wavelength; β is the peak broadening; and θ is the XRD peak position.
The morphology of ZnO was investigated with a scanning electron microscope (SEM Hitachi SU 8020, Tokyo, Japan) with an acceleration voltage of 10.0 kV and magnitude of 100 k. The specific surface area (SBET) of ZnO was determined using N2 adsorption/desorption isotherms performed with the use of a QUADRASORB evoTM Gas Sorption automatic system (Quantachrome Instruments, Boynton Beach, FL, USA) at −196 °C and in the relative pressure range of 0.05–0.3. It was calculated according to the Brunauer–Emmett–Teller equation. The total pore volume, TPV, was calculated from the volume of nitrogen held at the highest relative pressure (p/p0 = 0.99). The volume of micropores, Vmicro, (dimensions less than 2 nm) was calculated by integrating the pore volume distribution function using the DFT method. The mesopore volume, Vmeso (from 2 to 50 nm), was calculated from the difference of the total pore volume (TPV) and the volume of micropores (Vmicro). The pore size distribution of the samples was calculated from CO2 sorption isotherms at 0 °C using the NLDFT model.

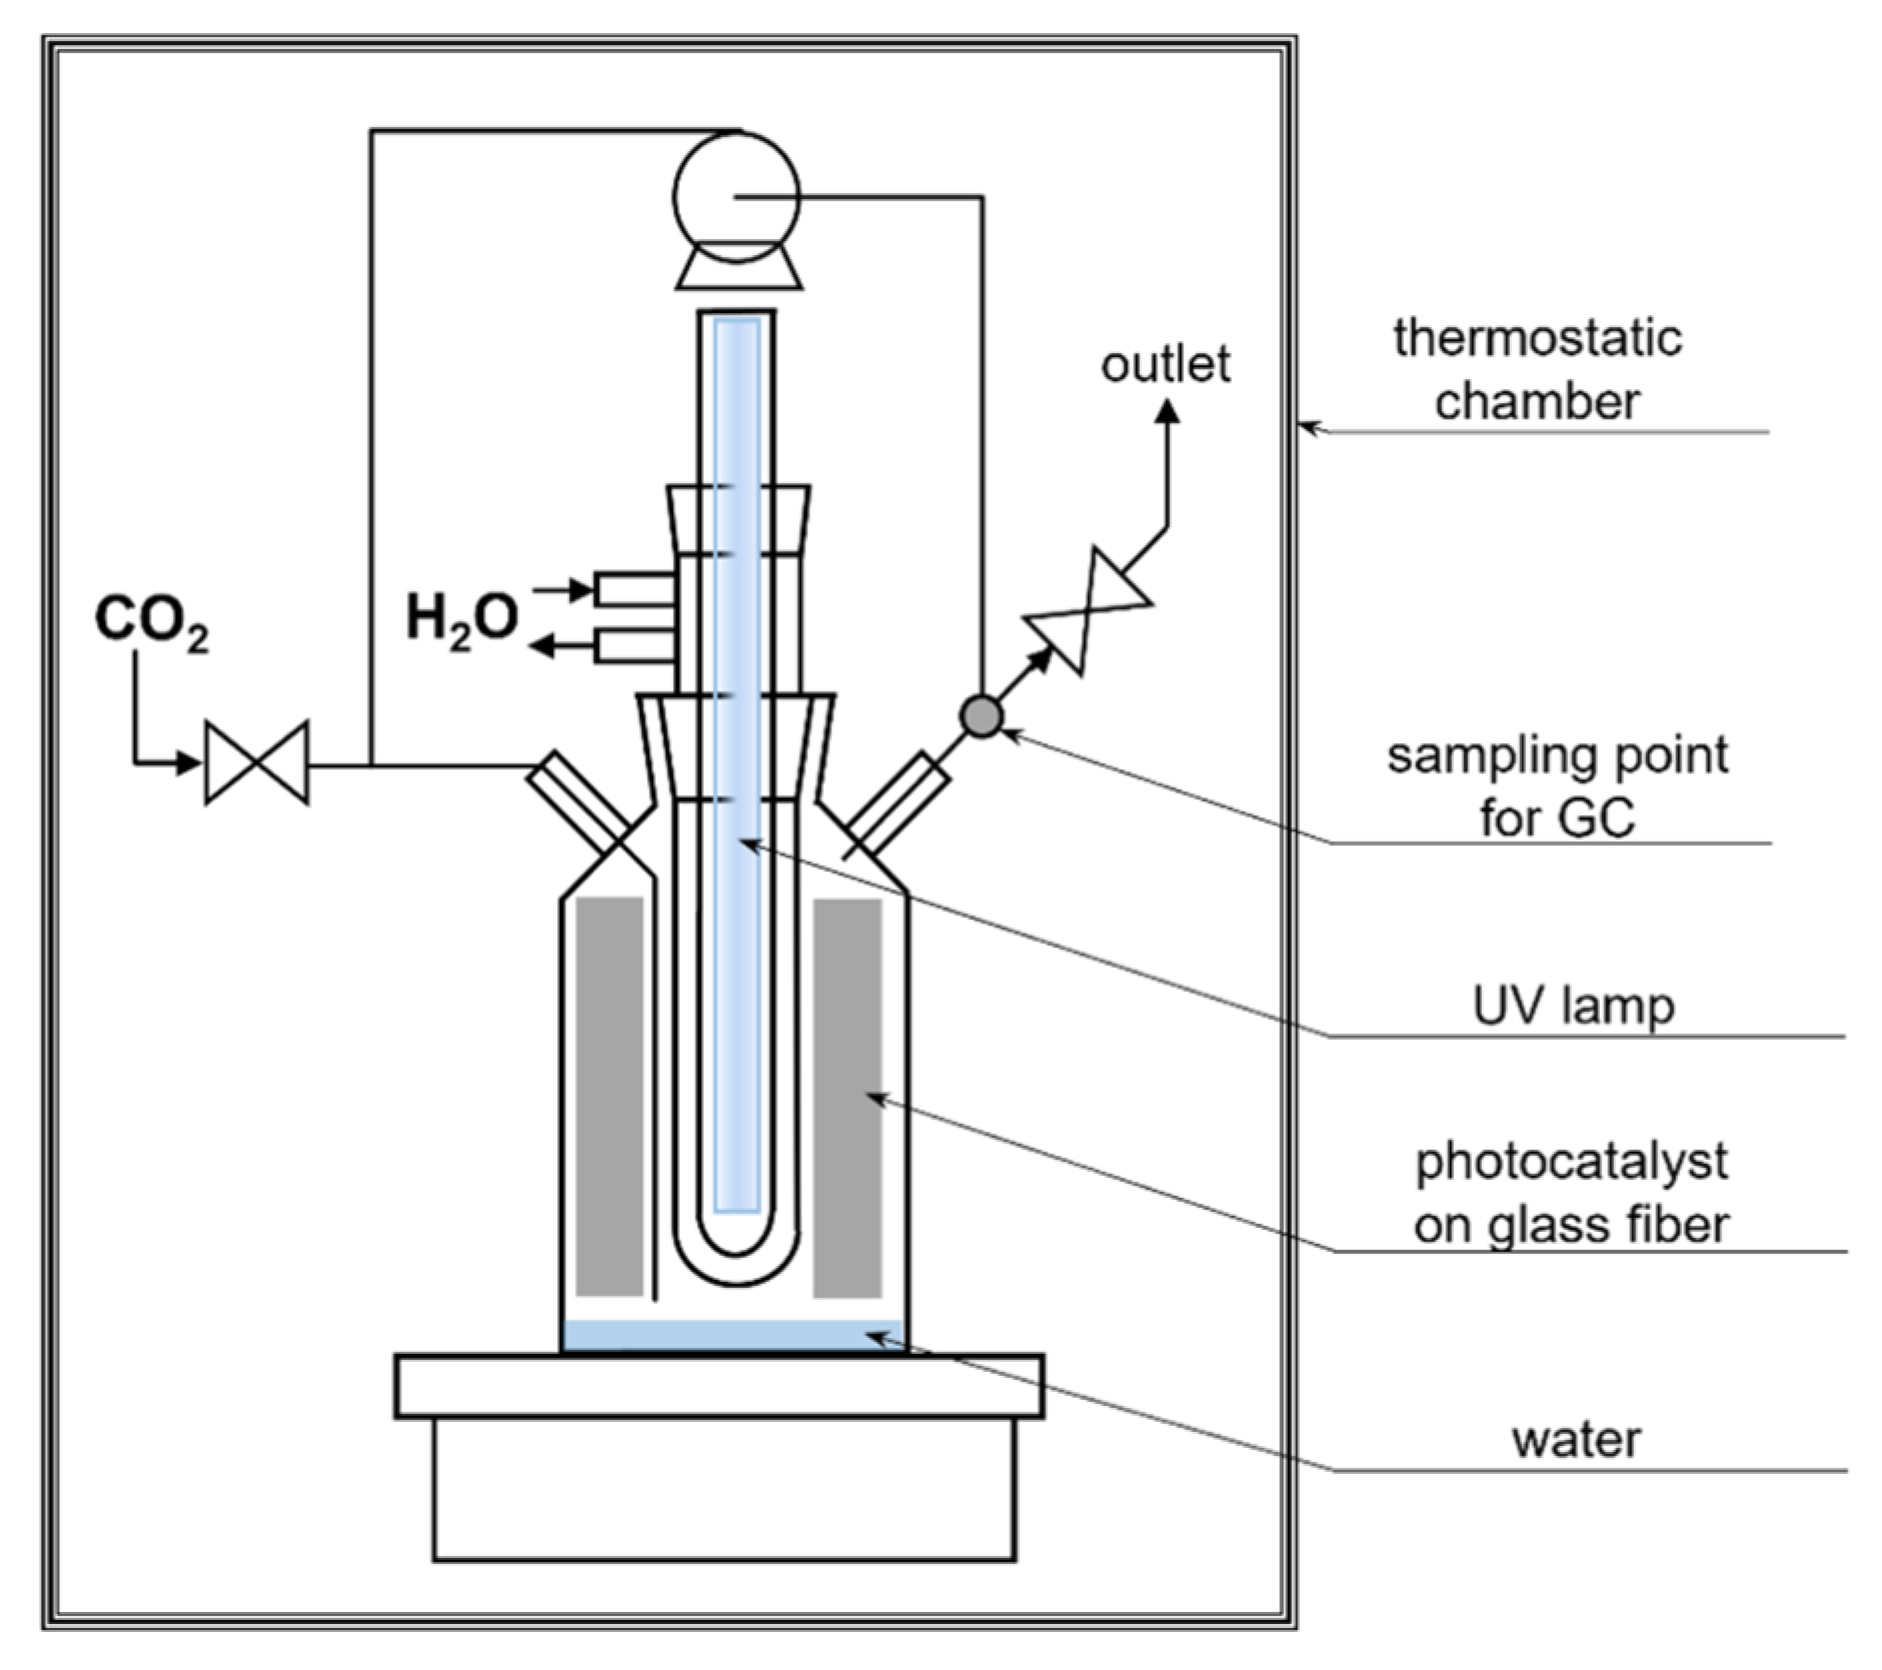
3.3. Photocatalytic Process

The experiments were performed in a gas-phase bottle-shaped reactor made of glass. The working volume of the reactor was 766 cm3. A 150 W medium-pressure mercury lamp TQ150 Z3 (Heraeus, Hanau, Germany) was used in the photocatalytic tests. It was characterized by a range of both UV and visible light of 250–600 nm with a maximum of 365 nm. The lamp was placed in a quartz condenser. It was constantly cooled with water by a chiller equipped with a pump with a controlled temperature of 18 °C (Minichiller 280 OLÉ, Huber, Offenburg, Germany). The reactor was placed in a thermostatic chamber to maintain a stable temperature (20 °C) and exclude any light sources (Figure 8).
An amount of 10 cm3 of distilled water and glass fiber, along with the tested photocatalyst, was placed in the reactor. To eliminate the air, the reactor was purified with pure CO2 (Messer, Chorzów, Poland) for 16 h. During the whole process, the gas in the reactor was constantly mixed with the use of the pump (flow rate of 1.6 dm3/h). The process was performed at 20 °C and tested for 6 h. The gas samples used for analysis were collected every 1 h.

3.4. Gas-Phase Analysis

The gas-phase composition was analyzed using a gas chromatography method. The analysis was performed using a Master GC Chromatograph (DANI Instruments, Milan, Italy) equipped with a micropacked Shincarbon ST 100/120 column and TCD and FID detectors. Between them, a methanizer was placed to catalytically convert CO to methane, which allowed for the determination of a very low amount of gas composition (ppb). Argon was used as a carrier gas. The sample was taken using a gas syringe (1 cm3) and dosed to an injector. In the first step of GC analysis, the hydrogen content was determined with the TCD detector, and in the next step, CO was converted to CH4 and analyzed with the FID detector. Also, the amount of CH4 produced during the process was determined with FID. The amount of hydrogen, carbon monoxide, and methane in the gas phase was calculated based on the calibration curve.

4. Conclusions

The experiments were carried out to evaluate the photocatalytic activity of ZnO with various particle sizes in the photoreduction of CO2. The process was performed in a gas-phase system under UV radiation. The products obtained after 6 h were hydrogen, carbon monoxide, and methane. Hydrogen was produced in a water-splitting process. In processes using ZnO with particle size >50 nm, it was not observed in the first 2–3 h. It was constantly consumed in the reactions of CO2 reduction. The main product of the performed processes was carbon monoxide, whose value grew linearly. Low amounts of methane were also observed in the gas phase.
The experiments show that the particle size of ZnO has a significant influence on the efficiency of the photoreduction of CO2. The highest values of H2, CO, and CH4 were obtained using the smallest sizes of ZnO, i.e., 18 nm and 26 nm. They had a high surface area and more porous structure compared to other samples.

Author Contributions

Conceptualization, A.W.M. and K.Ć.; methodology, A.W.M., E.K.-N. and I.P.; formal analysis, M.G., K.Ć., E.E. and P.S.; investigation, M.G. and K.Ć.; writing—original draft preparation, M.G.; writing—review and editing, A.W.M., K.Ć., E.K.-N. and U.N.; visualization, M.G.; supervision, A.W.M. and U.N.; funding acquisition, U.N. All authors have read and agreed to the published version of the manuscript.

Funding

The research leading to these results received funding from the Norway Grants 2014–2021 via the National Centre for Research and Development under the grant number NOR/POLNORCCS/PhotoRed/0007/2019-00.

Data Availability Statement

Not applicable.

Conflicts of Interest

The authors declare no conflict of interest. The funders had no role in the design of the study; in the collection, analyses, or interpretation of data; in the writing of the manuscript; or in the decision to publish the results.

References

  1. Deng, H.; Xu, F.; Cheng, B.; Yu, J.; Ho, W. Photocatalytic CO2 Reduction of C/ZnO Nanofibers Enhanced by an Ni-NiS Cocatalyst. Nanoscale 2020, 12, 7206–7213. [Google Scholar] [CrossRef]
  2. Hernández, S.; Hidalgo, D.; Sacco, A.; Chiodoni, A.; Lamberti, A.; Cauda, V.; Tresso, E.; Saracco, G. Comparison of Photocatalytic and Transport Properties of TiO2 and ZnO Nanostructures for Solar-Driven Water Splitting. Phys. Chem. Chem. Phys. 2015, 17, 7775–7786. [Google Scholar] [CrossRef] [PubMed]
  3. Sukri, S.N.A.M.; Shameli, K.; Isa, E.D.M.; Ismail, N.A. Green Synthesis of Zinc Oxide-Based Nanomaterials for Photocatalytic Studies: A Mini Review. IOP Conf. Ser. Mater. Sci. Eng. 2021, 1051, 012083. [Google Scholar] [CrossRef]
  4. Xin, C.; Hu, M.; Wang, K.; Wang, X. Significant Enhancement of Photocatalytic Reduction of CO2 with H2O over ZnO by the Formation of Basic Zinc Carbonate. Langmuir 2017, 33, 6667–6676. [Google Scholar] [CrossRef] [PubMed]
  5. Handoko, A.D.; Li, K.; Tang, J. Recent Progress in Artificial Photosynthesis: CO2 Photoreduction to Valuable Chemicals in a Heterogeneous System. Curr. Opin. Chem. Eng. 2013, 2, 200–206. [Google Scholar] [CrossRef]
  6. Liu, L.; Zhao, C.; Pitts, D.; Zhao, H.; Li, Y. CO2 Photoreduction with H2O Vapor by Porous MgO–TiO2 Microspheres: Effects of Surface MgO Dispersion and CO2 Adsorption–Desorption Dynamics. Catal. Sci. Technol. 2014, 4, 1539–1546. [Google Scholar] [CrossRef]
  7. Zhang, L.; Yang, H.; Ma, J.; Li, L.; Wang, X.; Zhang, L.; Tian, S.; Wang, X. Controllable Synthesis and Shape-Dependent Photocatalytic Activity of ZnO Nanorods with a Cone and Different Aspect Ratios and of Short-and-Fat ZnO Microrods by Varying the Reaction Temperature and Time. Appl. Phys. A 2010, 100, 1061–1067. [Google Scholar] [CrossRef]
  8. Becker, J.; Raghupathi, K.R.; St. Pierre, J.; Zhao, D.; Koodali, R.T. Tuning of the Crystallite and Particle Sizes of ZnO Nanocrystalline Materials in Solvothermal Synthesis and Their Photocatalytic Activity for Dye Degradation. J. Phys. Chem. C 2011, 115, 13844–13850. [Google Scholar] [CrossRef]
  9. Wang, L.; Chang, L.; Zhao, B.; Yuan, Z.; Shao, G.; Zheng, W. Systematic Investigation on Morphologies, Forming Mechanism, Photocatalytic and Photoluminescent Properties of ZnO Nanostructures Constructed in Ionic Liquids. Inorg. Chem. 2008, 47, 1443–1452. [Google Scholar] [CrossRef]
  10. Mclaren, A.; Valdes-Solis, T.; Li, G.; Tsang, S.C. Shape and Size Effects of ZnO Nanocrystals on Photocatalytic Activity. J. Am. Chem. Soc. 2009, 131, 12540–12541. [Google Scholar] [CrossRef]
  11. Zhang, X.; Qin, J.; Xue, Y.; Yu, P.; Zhang, B.; Wang, L.; Liu, R. Effect of Aspect Ratio and Surface Defects on the Photocatalytic Activity of ZnO Nanorods. Sci. Rep. 2014, 4, 4596. [Google Scholar] [CrossRef]
  12. Zheng, Y.; Chen, C.; Zhan, Y.; Lin, X.; Zheng, Q.; Wei, K.; Zhu, J.; Zhu, Y. Luminescence and Photocatalytic Activity of ZnO Nanocrystals:  Correlation between Structure and Property. Inorg. Chem. 2007, 46, 6675–6682. [Google Scholar] [CrossRef]
  13. Wang, J.; Liu, P.; Fu, X.; Li, Z.; Han, W.; Wang, X. Relationship between Oxygen Defects and the Photocatalytic Property of ZnO Nanocrystals in Nafion Membranes. Langmuir 2009, 25, 1218–1223. [Google Scholar] [CrossRef]
  14. Hegazy, I.M.; Geioushy, R.A.; El-Sheikh, S.M.; Shawky, A.; El-Sherbiny, S.; Kandil, A.-H.T. Influence of Oxygen Vacancies on the Performance of ZnO Nanoparticles towards CO2 Photoreduction in Different Aqueous Solutions. J. Environ. Chem. Eng. 2020, 8, 103887. [Google Scholar] [CrossRef]
  15. Liu, X.; Ye, L.; Liu, S.; Li, Y.; Ji, X. Photocatalytic Reduction of CO2 by ZnO Micro/Nanomaterials with Different Morphologies and Ratios of {0001} Facets. Sci. Rep. 2016, 6, 38474. [Google Scholar] [CrossRef] [PubMed]
  16. Tian, Z.R.; Voigt, J.A.; Liu, J.; Mckenzie, B.; Mcdermott, M.J.; Rodriguez, M.A.; Konishi, H.; Xu, H. Complex and Oriented ZnO Nanostructures. Nat. Mater. 2003, 2, 821–826. [Google Scholar] [CrossRef] [PubMed]
  17. Jang, E.S.; Won, J.-H.; Hwang, S.-J.; Choy, J.-H. Fine Tuning of the Face Orientation of ZnO Crystals to Optimize Their Photocatalytic Activity. Adv. Mater. 2006, 18, 3309–3312. [Google Scholar] [CrossRef]
  18. Mahmud, R.A.; Ahmed Ali, K.; Putri, L.K.; Morikawa, Y.; Mohamed, A.R. ZnO with Engineered Surface Defects as a Competent Photocatalyst for CO2 Photoreduction into Valuable Fuels under Simulated Solar Light Irradiation. J. Environ. Chem. Eng. 2023, 11, 109637. [Google Scholar] [CrossRef]
  19. Chen, C.; Jin, J.; Chen, S.; Wang, T.; Xiao, J.; Peng, T. In-Situ Growth of Ultrafine ZnO on g-C3N4 Layer for Highly Active and Selective CO2 Photoreduction to CH4 under Visible Light. Mater. Res. Bull. 2021, 137, 111177. [Google Scholar] [CrossRef]
  20. Zhang, S.; Yin, X.; Zheng, Y. Enhanced Photocatalytic Reduction of CO2 to Methanol by ZnO Nanoparticles Deposited on ZnSe Nanosheet. Chem. Phys. Lett. 2018, 693, 170–175. [Google Scholar] [CrossRef]
  21. Iqbal, M.; Wang, Y.; Hu, H.; He, M.; Hassan Shah, A.; Lin, L.; Li, P.; Shao, K.; Reda Woldu, A.; He, T. Cu2O-Tipped ZnO Nanorods with Enhanced Photoelectrochemical Performance for CO2 Photoreduction. Appl. Surf. Sci. 2018, 443, 209–216. [Google Scholar] [CrossRef]
  22. Kim, N.; Park, S.-H.; Park, K.-Y.; Choi, J.-S. Surface Morphological Properties of Micro-arc Oxidation Coating on Al6061 Alloys using Unipolar Pulse. J. Korean Inst. Surf. Eng. 2017, 50, 421–426. [Google Scholar] [CrossRef]
  23. Liao, Y.; Hu, Z.; Gu, Q.; Xue, C. Amine-Functionalized ZnO Nanosheets for Efficient CO2 Capture and Photoreduction. Molecules 2015, 20, 18847–18855. [Google Scholar] [CrossRef]
  24. Wang, Z.; Hong, J.; Ng, S.F.; Liu, W.; Huang, J.; Chen, P.; Ong, W.J. Recent Progress of Perovskite Oxide in Emerging Photocatalysis Landscape: Water Splitting, CO2 Reduction, and N2 Fixation. Acta Phys. Chim. Sin. 2021, 37, 2011033. [Google Scholar] [CrossRef]
  25. Wang, P.; Yin, G.; Bi, Q.; Huang, X.; Du, X.; Zhao, W.; Huang, F. Efficient Photocatalytic Reduction of CO2 Using Carbon-Doped Amorphous Titanium Oxide. ChemCatChem 2018, 10, 3854–3861. [Google Scholar] [CrossRef]
  26. Tasbihi, M.; Kočí, K.; Troppová, I.; Edelmannová, M.; Reli, M.; Čapek, L.; Schomäcker, R. Photocatalytic Reduction of Carbon Dioxide over Cu/TiO2 Photocatalysts. Environ. Sci. Pollut. Res. Int. 2018, 25, 34903–34911. [Google Scholar] [CrossRef] [PubMed]
  27. Zhang, L.; Zhang, L.; Chen, Y.; Zheng, Y.; Guo, J.; Wan, S.; Wang, S.; Ngaw, C.K.; Lin, J.; Wang, Y. CdS/ZnO: A Multipronged Approach for Efficient Reduction of Carbon Dioxide under Visible Light Irradiation. ACS Sustain. Chem. Eng. 2020, 8, 5270–5277. [Google Scholar] [CrossRef]
Figure 1. SEM images of the tested materials containing ZnO with various particle sizes (acceleration voltage: 10.0 kV; magnitude: 100 k).
Catalysts 13 01270 g001
Figure 2. X-ray diffraction patterns of the tested materials.
Catalysts 13 01270 g002
Figure 3. Pore size distribution of the tested materials.
Catalysts 13 01270 g003
Figure 4. The H2 content in the gas phase after 6 h of photocatalysis of CO2 with the use of ZnO with various particle sizes.
Catalysts 13 01270 g004
Figure 5. The CO content in the gas phase after 6 h of photocatalysis of CO2 with the use of ZnO with various particle sizes.
Catalysts 13 01270 g005
Figure 6. The CH4 content in the gas phase after 6 h of photocatalysis of CO2 with the use of ZnO with various particle sizes.
Catalysts 13 01270 g006
Figure 7. The relationship between the contents of the products and particle size of ZnO.
Catalysts 13 01270 g007
Figure 8. The scheme of the reactor for the photocatalytic reduction of CO2.
Catalysts 13 01270 g008
Table 1. The properties of the tested materials.
MaterialParticle Size a
(nm)
Crystallite Size
(nm)
SBET
(m2/g)
TPV (cm3/g)Vmicro b (cm3/g)Vmeso c (cm3/g)
ZnO 18 nm182240.90.1570.0030.154
ZnO 26 nm262528.70.2050.0030.202
ZnO 50 nm<506432.30.0990.0090.090
ZnO 100 nm<1008511.10.0300.0040.026
ZnO 5 μm<5000>1007.60.0210.0020.019
a Declared by the manufacturer; b pores smaller than 2 nm; c pores in the range of 2–50 nm; SBET—specific surface area; TPV—total pore volume.
Disclaimer/Publisher’s Note: The statements, opinions and data contained in all publications are solely those of the individual author(s) and contributor(s) and not of MDPI and/or the editor(s). MDPI and/or the editor(s) disclaim responsibility for any injury to people or property resulting from any ideas, methods, instructions or products referred to in the content.

