Article

Engineering of Substrate Tunnel of P450 CYP116B3 though Machine Learning

1
Beijing Bioprocess Key Laboratory, Beijing University of Chemical Technology, Beijing 100029, China
2
Institute of Biotechnology, RWTH Aachen University, 52074 Aachen, Germany
3
DWI-Leibniz Institute for Interactive Materials, 52074 Aachen, Germany
4
Department of Bioorganic Chemistry, Leibniz Institute of Plant Biochemistry, 06120 Halle, Germany
*
Authors to whom correspondence should be addressed.
These authors contributed equally to this work.
Catalysts 2023, 13(8), 1228; https://doi.org/10.3390/catal13081228
Submission received: 28 June 2023 / Revised: 9 August 2023 / Accepted: 19 August 2023 / Published: 21 August 2023
(This article belongs to the Section Biocatalysis)

Abstract

:
The combinatorial complexity of the protein sequence space presents a significant challenge for recombination experiments targeting beneficial positions. To overcome these difficulties, a machine learning (ML) approach was employed, which was trained on a limited literature dataset and combined with iterative generation and experimental data implementation. The PyPEF method was utilized to identify existing variants and predict recombinant variants targeting the substrate channel of P450 CYP116B3. Through molecular dynamics simulations, eight multiple-substituted improved variants were successfully validated. Specifically, the RMSF of variant A86T/T91H/M108S/A109M/T111P was decreased from 3.06 Å (wild type) to 1.07 Å. Additionally, the average RMSF of the variant A86T/T91P/M108V/A109M/T111P decreased to 1.41 Å, compared to the wild type’s 1.53 Å. Of particular significance was the prediction that the variant A86T/T91H/M108G/A109M/T111P exhibited an activity approximately 15 times higher than that of the wild type. Furthermore, during the selection of the regression model, PLS and MLP regressions were compared. The effect of data size and data relevance on the two regression approaches has been summarized. The aforementioned conclusions provide evidence for the feasibility of the strategy that combines ML with experimental approaches. This integrated strategy proves effective in exploring potential variations within the protein sequence space. Furthermore, this method facilitates a deeper understanding of the substrate channel in P450 CYP116B3.

Graphical Abstract

1. Introduction

Artificial intelligence (AI) and machine learning (ML) technologies have attracted interest in various fields, including protein engineering, as they hold for researchers the promise to speed up protein engineering and reduce experimental work that is often labor- and time-intensive [1,2,3]. Currently, researchers have developed multiple ML methods and frameworks for protein molecular dynamics models, enabling the successful engineering of thousands of proteins using various software tools [4,5]. For instance, Singhal et al. employed a range of supervised ML regression models, such as Bayesian regularization neural network, radial basis function neural network, Gaussian kernel, and support vector machine, to optimize cellulose (CMCase) [6]. This approach led to the identification of 51 potential variants. In addition, experimental verification revealed that the best CMCase variant displayed an activity of 4.7 U/gds, three times higher than that of the wild type. Similarly, Wu et al. utilized a putative nitric oxide dioxygenase from Rhodothermus marinus for multiple rounds of machine learning-guided evolution experiments [7]. Through this approach, they generated a novel variant with an increased enantiomeric excess (ee) of the S enantiomer from 76% to 93%, along with an ee of 79% for the R enantiomer. This study exemplifies the feasibility of machine-learning-assisted directed evolution [7]. These examples collectively illustrate the immense potential of ML in guiding and enhancing protein engineering, offering valuable insights into the design and optimization of proteins for various applications.
At the same time, with the development of multi-point saturation right and random mutagenesis, variant diversity has been greatly changed today. Cui et al. generated 270 variants using a two-gene recombination process (2GenReP) and an in-silico-guided recombination process (InSiReP) [8,9]. In another study, Kevin et al. successfully generated an impressive total of 10,000 variants using epPCR [10]. Despite these achievements, rearranging limited points remains a formidable challenge. The multi-saturation mutation at four sites can recombine 160,000 different variants. The utilization of recombination based on point positions has rendered variant optimization feasible, thus facilitating the inclusion of a greater number of advantageous variants in these recombinant variants [11].
PyPEF can recombine variants after identification without sequence, providing a shortcut for directed evolution experiments and semi-rational design. PyPEF (https://github.com/niklases/PyPEF#hybrid-modeling, accessed on 2 December 2022) is a ML software integrating multiple ML algorithms used for data-driven design of proteins through recombination of mutations without relying on protein structure [11]. Currently, it supports multiple regression methods including PLS, MLP, SVM, etc., and encoding methods such as AAindex, DCA, one-hot etc. [12]. It can learn from single-site saturation substitution and multiple-site substitutions. After learning, it can recombine substitutions at these five sites and predict new variants [11].
Cytochrome P450 was first discovered in 1958 in mouse liver cell microsomes. It has important research significance in biosynthesis and drug metabolism [13,14]. It has oxidation activity towards polycyclic aromatic hydrocarbons. Tao et al. designed P450 CYP116B3 for the selective conversion of naphthalene to 1-naphthol [15]. They performed saturation mutations in SRS1, SRS2, and SRS3. The final 1-naphthol production reached 8.26 mg/L/h, which was 14 times higher than that of the wild type. Our group has optimized CYP116B3 for the dealkylation of 7-ethoxycoumarin and achieved 240-fold improvement [16]. Recently, a simultaneous saturation mutagenesis of five positions (86, 91, 108, 109, and 111) was performed by us. Variants with more than two-fold higher activity than CYP116B3 wild type were sequenced, leading to 165 variants being selected. The above-mentioned variants mainly increase the activity of the P450 substrate tunnel by affecting its flexibility [16], and the optimized variant (A86T/T91L/M108N/A109M/T111A) has a 134-fold increase in activity relative to the wild type [11].
Multi-site saturation mutation of five sites will require 205 variants, making it challenging to experimentally verify each one individually. So, it is feasible to use better variants for ML and find potential relationships between them to obtain more improved variants. To address this gap and reduce the screening effort, ML methods prove to be well-suited, as they utilize existing mutational data to predict protein functions without relying on a detailed physical model, particularly when sequence-level features are employed for modeling [11].
A variant database was constructed using 165 variants. The mutation sites of these variants were concentrated in A86, T91, M108, A109, and T111A. This dataset was used for training, testing, and inferring models for ML guided recombination. The PyPEF method used allowed the prediction of recombinants from the identified substitutions, which were analyzed by reverse engineering to gain molecular understanding. [11]. By sorting their predicted activities, several relatively optimized P450 variants were successfully screened out from more than 40,000 potential variants. To verify its accuracy, the eight predicted results were verified by molecular dynamics. AlphaFold2 was used to model the obtained potentially beneficial variants [17]. Based on its high accuracy, the P450 structure of variants can be predicted with high confidence [17]. YASARA (http://yasara.org/, accessed on 2 March 2023.) is used for molecular dynamics simulations. In this study, the software was mainly used for energy minimization and structure, and further screened the P450 molecular activity obtained by PyPEF. The conclusion showed that some relatively optimized P450 variants were screened out. Among them, two engineering loops have greatly improved the enzyme performance [11,18]. In conclusion, this work proposes a strategy of ML-guided design, offering a promising avenue for protein engineering and optimization.
All abbreviations of this paper are shown in Table S1.

2. Results and Discussion
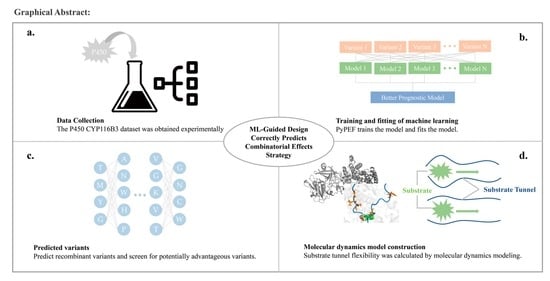
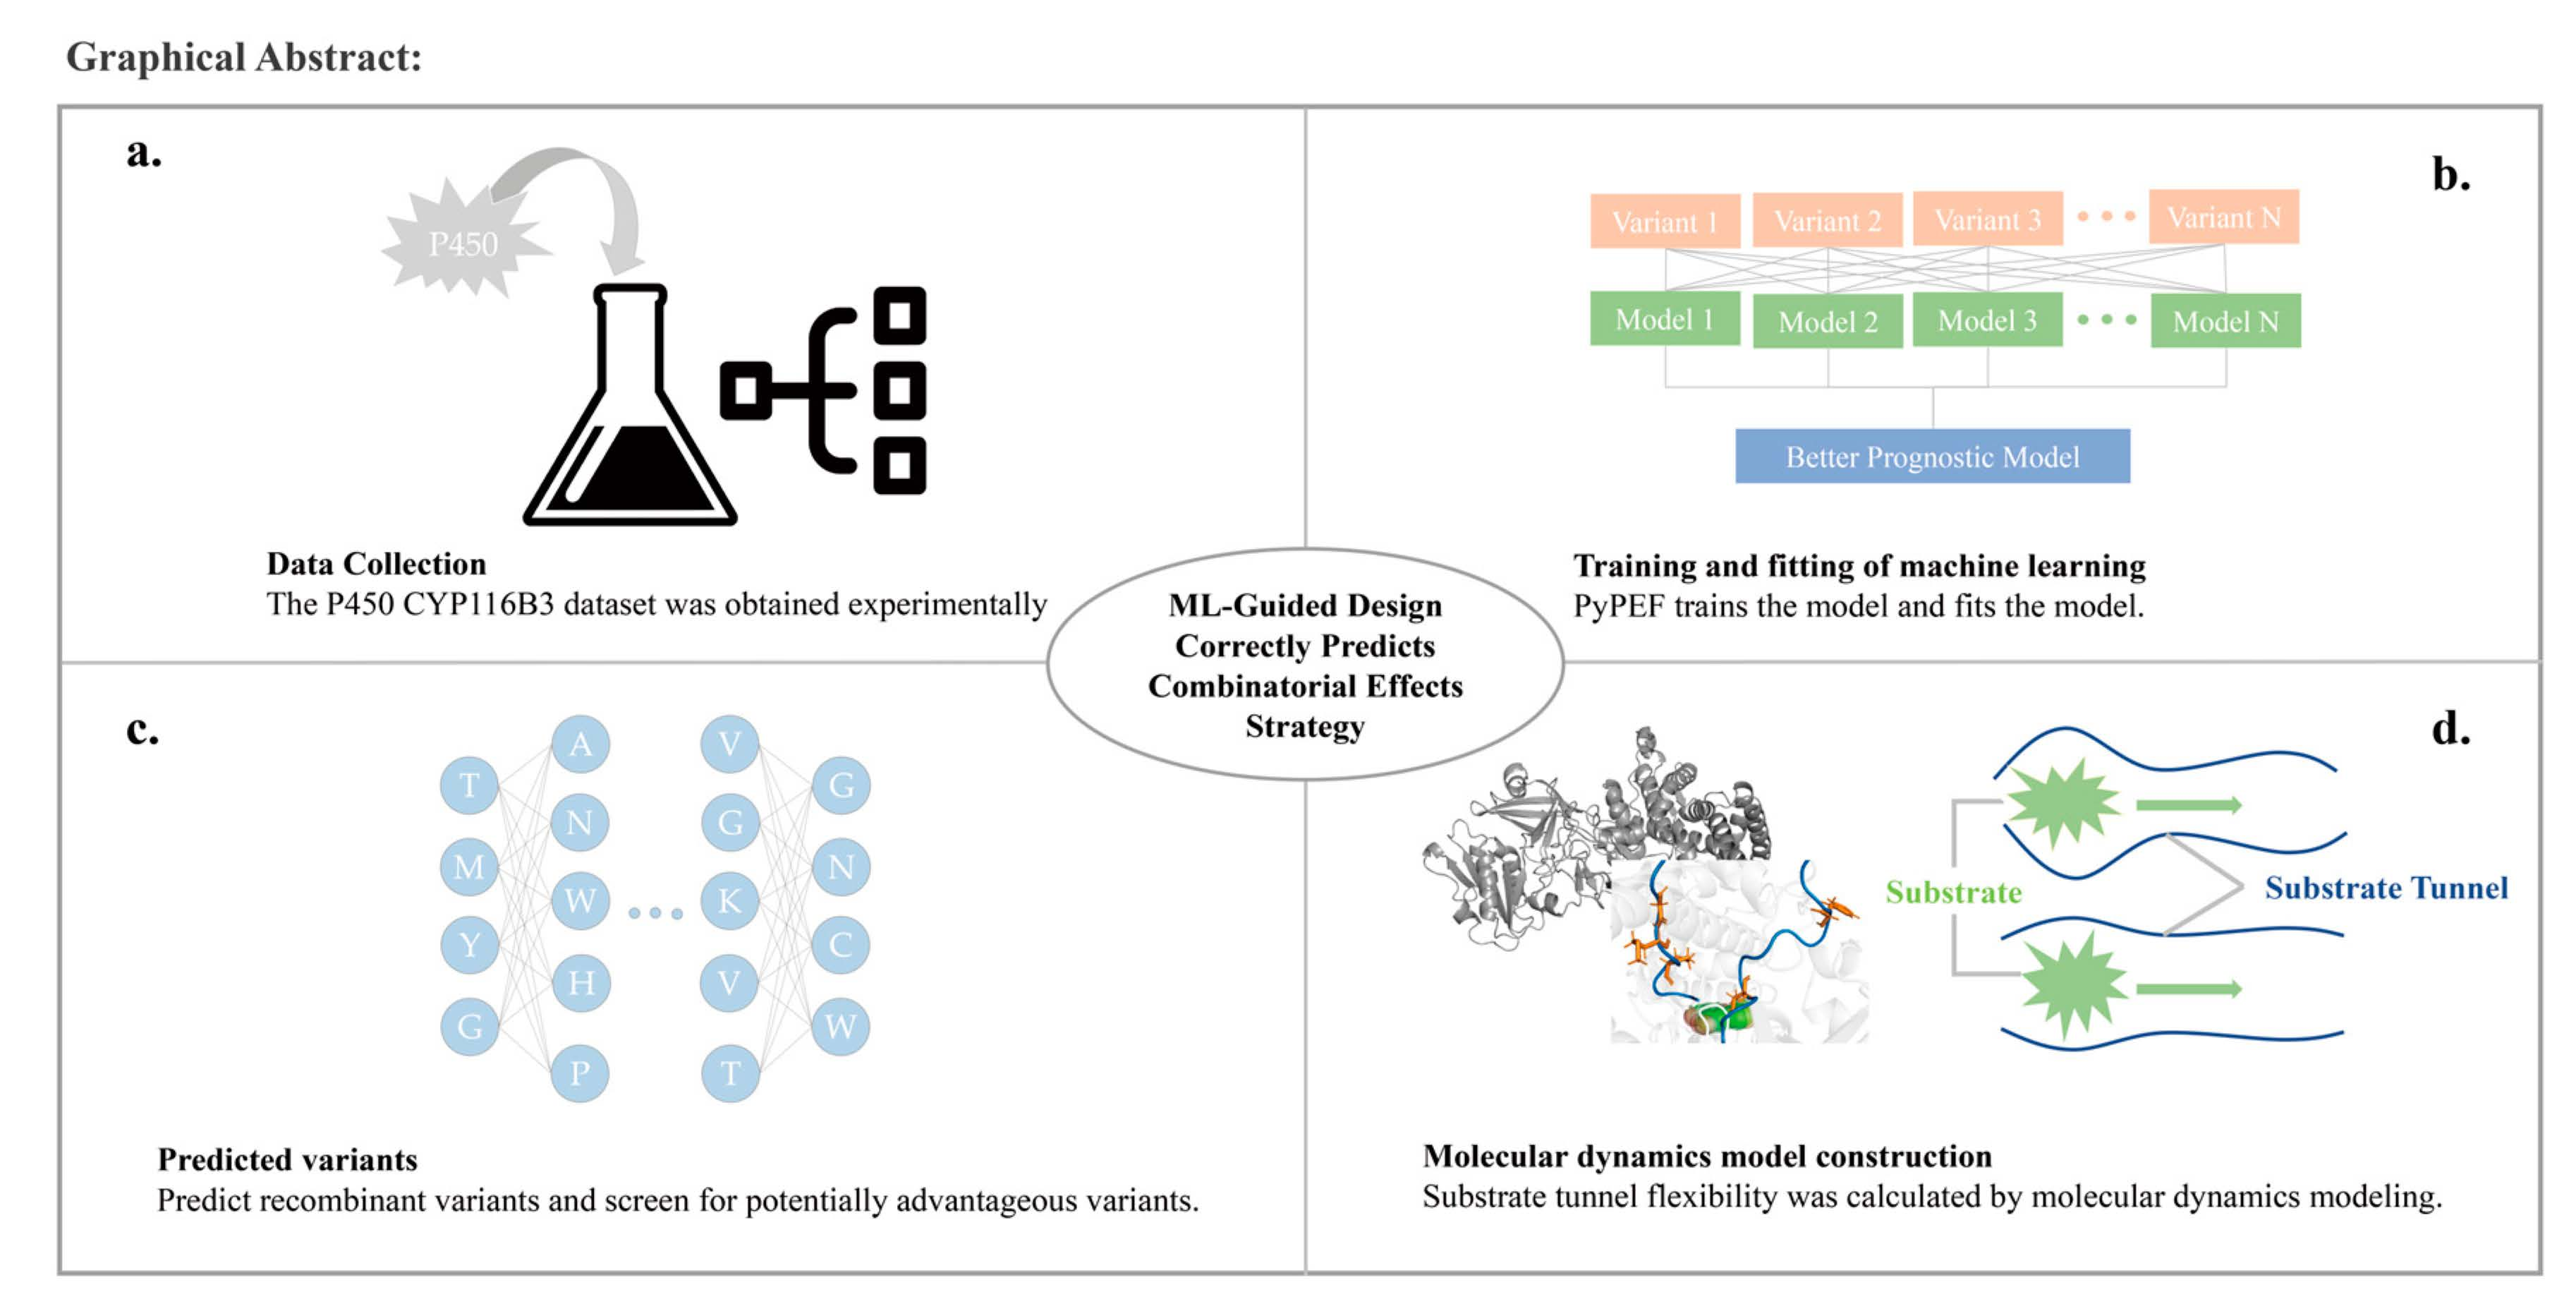
Figure 1 shows the steps of the ML Guided Design Correctly Predicts Combinatorial Effects strategy.
By analyzing the frequency of amino acids of five mutation sites, in total 165 positive variants were generated and sequenced. It can be seen that the selected positive variants showed a certain amino acid preference (Figure 2). Among them, 25 variants with more than a 10-fold increase in enzyme activity showed more obvious amino acid preference and showed obvious regularity.
PyPEF was the primary software employed in this study. The protein sequence is encoded by amino acid index with potential combination with FFT, and the encoding method is relatively simple. Various regression methods, such as FFT combined with PLS, and multi-layer perceptron (MLP), are utilized to achieve more accurate fitting and prediction while minimizing time consumption. Additionally, through model analysis, the internal relationship of each mutation point can be analyzed.

2.1. Dataset

In this study, the PyPEF dataset was automatically generated. The initial pool of 165 variants was randomly divided. The P450 variants library was organized in a ‘.CSV’ file with a random arrangement.
Subsequently, PyPEF performed a random split of the dataset, resulting in a training set containing 114 variants and a validation set containing 56 variants. When the source file is rearranged, the existing dataset is overwritten based on the software’s characteristics.

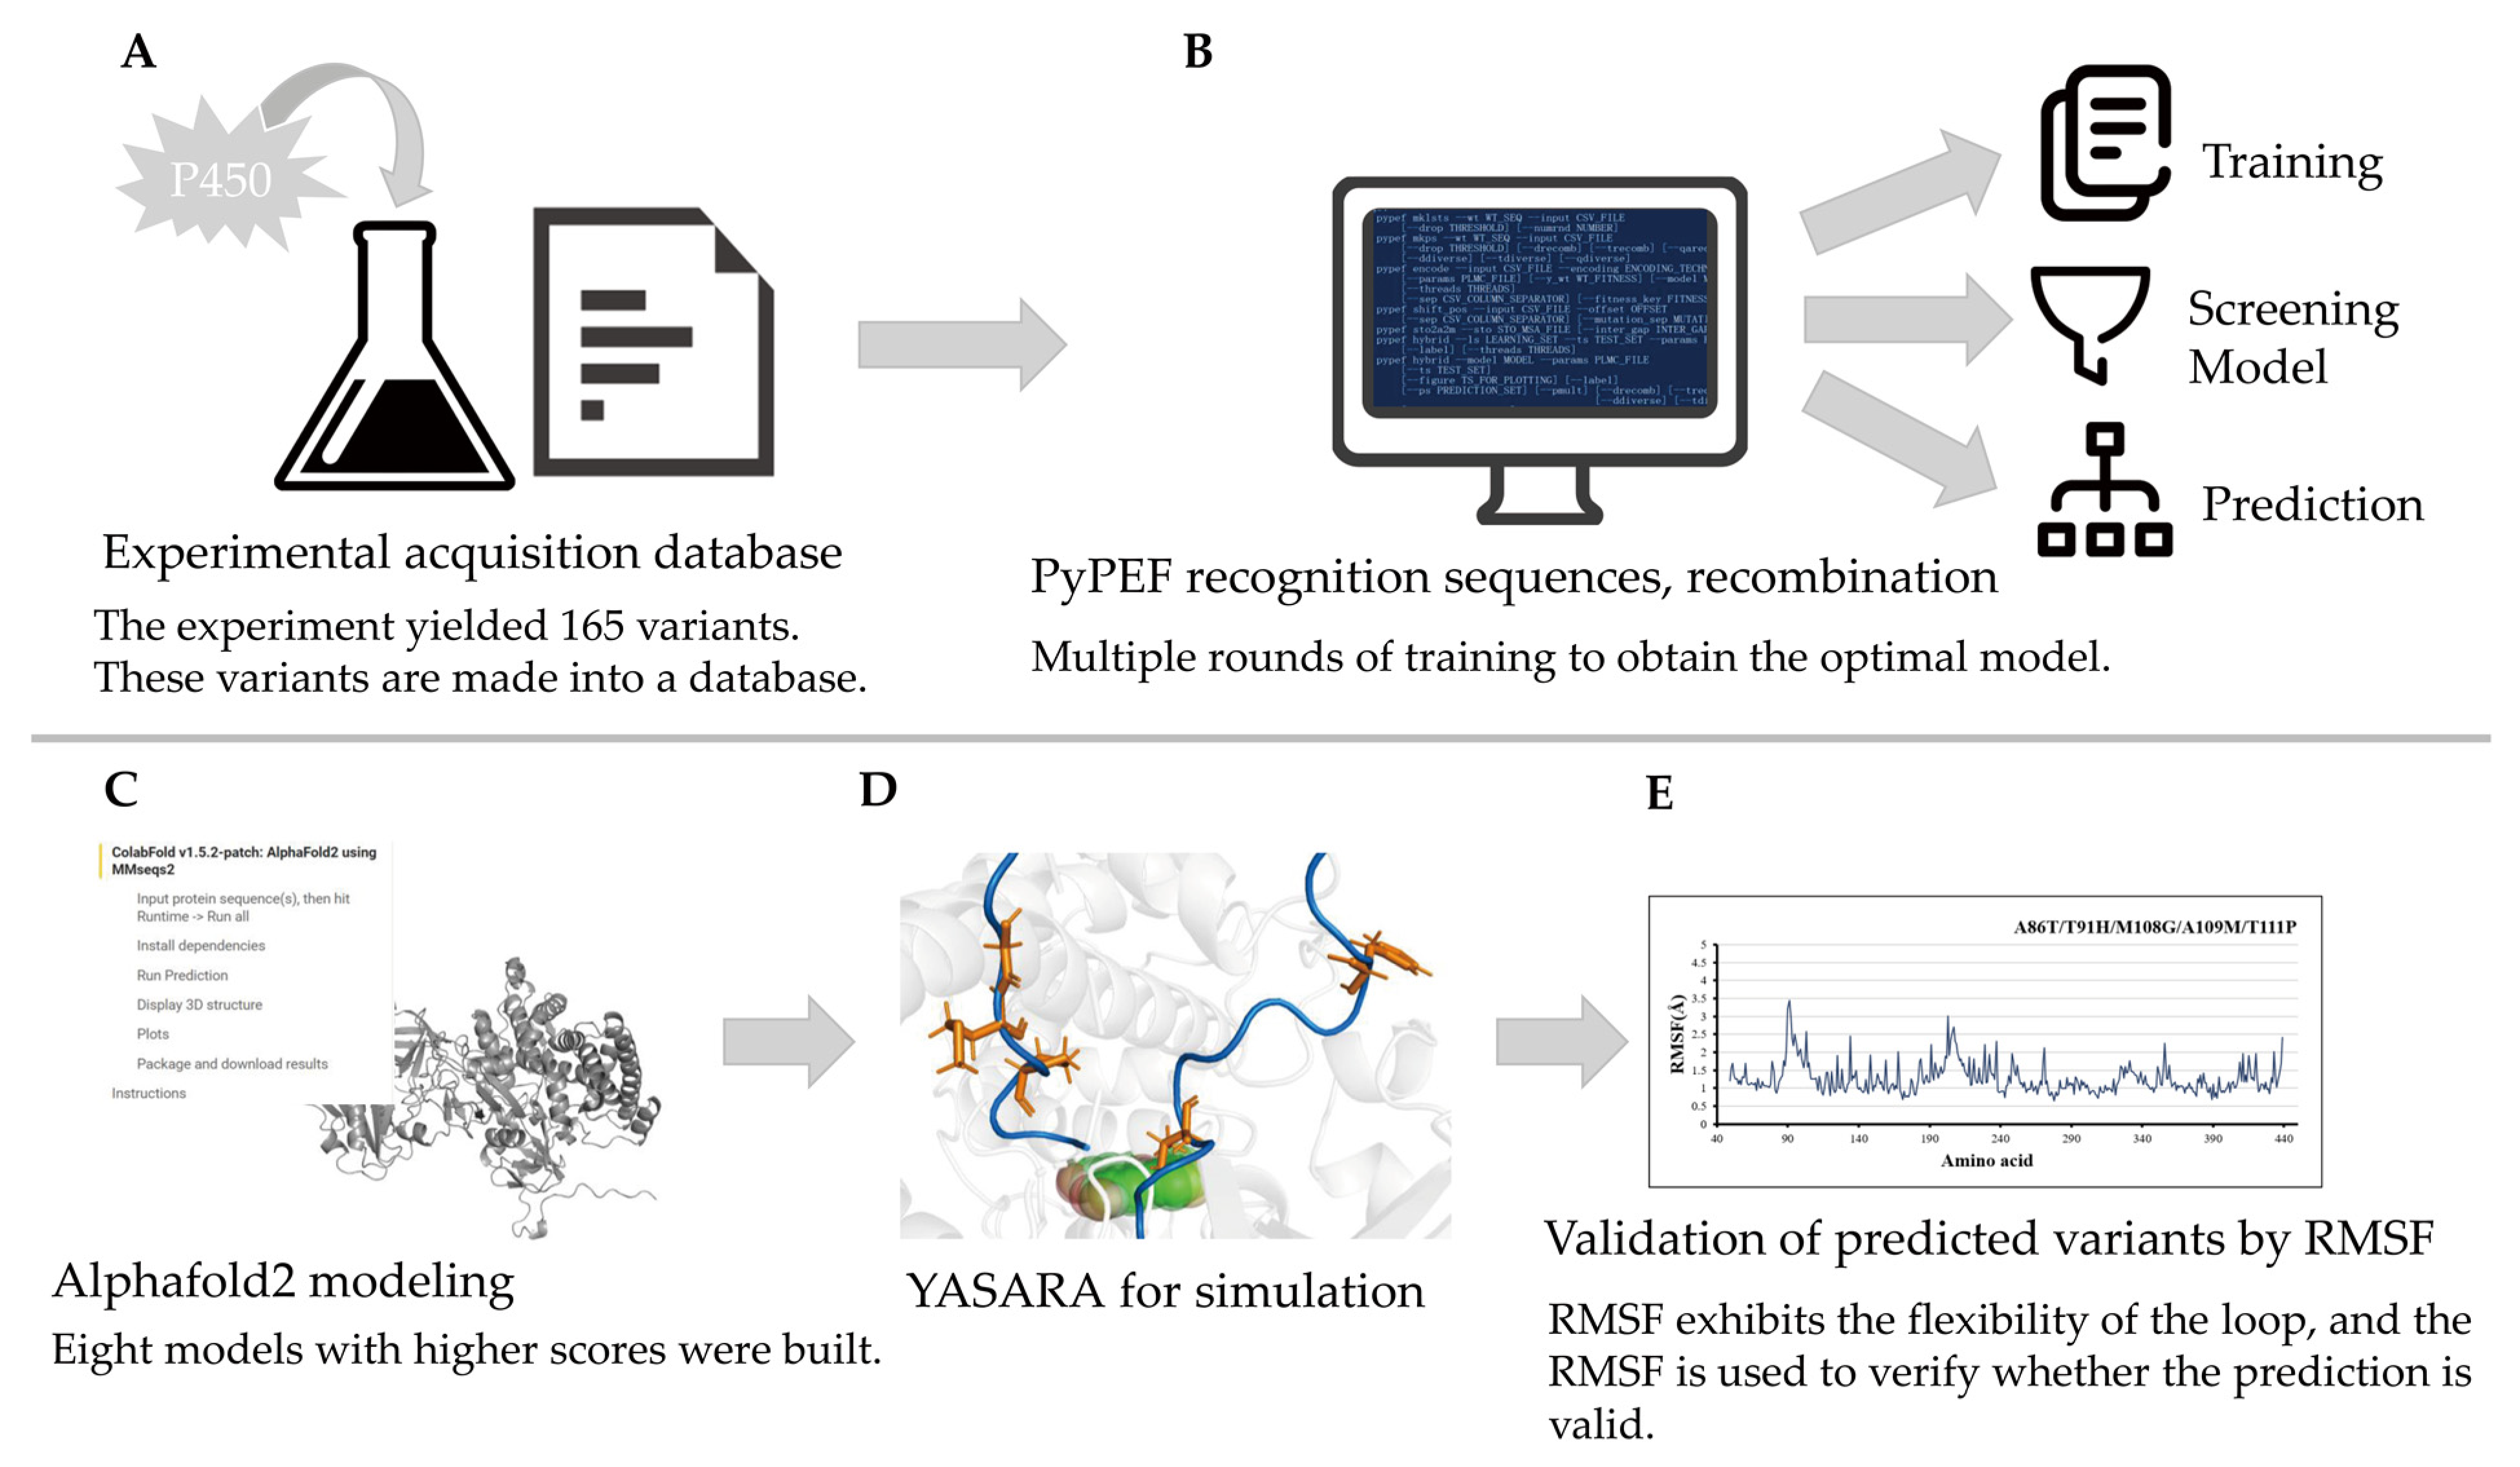
2.2. Training Result

PyPEF supports various regression methods, including Random Forest (RF), Support Vector Regression (SVR), Partial Least Squares (PLS), and Multi-Layer Perceptron (MLP) [11]. According to the benchmark of PyPEF, PLS exhibits fast computation speed and high accuracy [11]. Thus, for this study, PLS and MLP were initially selected as the regression methods. Multiple fittings were conducted using PLS and MLP, and the results of the frequency of occurrence for each AAindex are presented below (Table 1).
Among them, PLS carried out 12 times of regression and MLP carried out seven times of regression. The results are consistent to some extent. Both show that the encoding required by Spearman coefficient is medium correlation(Table 2). However, it was observed that the performance of R2 was less satisfactory compared to the Spearman coefficient, especially when dealing with a large number of variables. R2 exhibited instability, as evidenced by fluctuations in TANS770102 from 0.41 to 0.17. The instability of R2 can be attributed to the presence of data noise in the dataset and a mismatch between the regression model and the data size [19]. The R2 value is known to provide a good fit for data with linear relationships and is accurate when dealing with continuous values. However, it may yield poor results when the data exhibit non-linear relationships. In our prediction model, the data involve discrete values, and the presence of a clear linear relationship in the database is not evident. Consequently, R squared (R2) is not an appropriate measure for this study [19]. Instead, it is essential to establish the existence of a monotonic relationship in this prediction. For this purpose, the Spearman coefficient is more suitable as an evaluation metric in this context. The Spearman coefficient takes into account the rank order of data, making it a robust measure for assessing the correlation between variables, even when the data exhibit non-linear associations. Compared with other extension studies used by PyPEF, when R2 data do not have a strong correlation model, Spearman coefficient is also used as the basis for model screening [14,20,21]. So, the Spearman coefficient is used as the evaluation criterion further in this study. Moreover, the comparison of PLS and MLP regression scores indicated that PLS generally outperformed MLP in terms of accuracy. In this study, PLS regression iteration is used to determine whether to stop based on the number of iterations. This method definitely reduces the calculation time, and has some deficiencies in accuracy [20]. For MLP, higher training times and parameter optimization may be needed to obtain more results [22]. MLP uses 12 hidden layers. Compared with the two, PLS takes fewer big strides compared with MLP and shows a certain degree of unity with MLP in the selection of AAindex. This view is consistent with that of Siedhoff et al. on the relevant PyPEF performance tests [14].
After random rearrangement of the data, both fitting and regression accuracy decreased. This decline can be attributed to the impact of the number of iterations and the limited number of hidden layers in MLP. For PLS, it is limited by the number of FFT iterations, so the parametric model with consistent accuracy can no longer be obtained in limited iterations. For MLP, it is mainly limited to the number of hidden layers. However, MLP is limited by the increase in hidden layers of data, which will lead to a sharp increase in computation, so it is difficult to solve this problem effectively [23,24]. PLS can try to solve this problem by adding FFT iterations.
Through comparing the relevant scores, it was observed that the Spearman score of PLS was slightly higher than that of MLP within a certain range. Furthermore, PLS exhibited advantages in cases involving a smaller amount of data and unclear data correlation [1,20]. When there is a small amount of data in MLP, it is difficult to determine the correlation between hidden layer and data in limited coding mode. Considering that this dataset contains only 165 variants, which is relatively small, PLS regression is more advantageous for this particular dataset [25,26,27].
According to the above characteristics, the two attributes of the data can be used as a standard to divide the data into four cases to train and verify all kinds of data. The data are judged based on the amount of data and the correlation of data:
  • A small amount of data with poor correlation.
The training and validation method of PLS and FFT is suitable for the regression method with a small amount of data and poor correlation. Among them, PLS is characterized to find out the potential characteristics when the quantity is small and the data are not very correlated.
2.
Large amount of data with strong correlation.
MLP is suitable for cases where the data are correlated, and the number of data are large. In addition, MLP can classify, compare, and regress the data by assigning multiple hidden layer features to obtain relatively high-accuracy fitting results.
3.
A small amount of data with strong correlation.
When the dataset is small but has strong correlation, it is recommended to use PLS mainly for verification. MLP can also be used for validation. The MLP is used to check whether the results are homogeneous based on the training regression of FFT and PLS.
4.
A large amount of data with poor correlation.
When the dataset is large and the correlation is poor, the mixed regression of PLS and MLP can be used. The convergence of the two is used as the basis for determination in this model. Their pre-fit may be low. Using the fitting results of the two to verify each other, we can obtain the amino acid coding method with relatively high accuracy.
The features of this group of data belong to fewer data and lower relevance. To maintain computational efficiency, direct regression with PLS can be employed. To balance the amount of tuning data and operation time, the number of iterations can be adjusted. In the case of a large amount of data and certain characteristics, MLP can be used to reduce the number of hidden layers in order to reduce the amount of computation. It needs many times to fit and verify each other, and the unity of the coding mode to determine the optimal coding mode [11,23,28]. The picture shows the general conclusion of our team based on the prediction conclusion of ML combined with the characteristics of the data. In order to analyze whether there is a certain monotonic trend, we choose to use the Spearman coefficient as the evaluation standard. In the predictive regression of ML, when the Spearman coefficient is greater than 0.4, it can be judged that the correlation model has moderate correlation. Therefore, some AAindexes are suitable for training data [11]. The three models, TANS770102, RICJ030105, and PRAM820103, can be selected to fit and verify.

2.3. Fitting of Databases

According to the final training results, the prediction set of TANS770102, PRAM820103, and RICJ030105 is established, because of the higher Spearman coefficient. The models predict the existing 165 recombination variants and the results are as follows (Figure 3):
According to the chart (Figure 4), it is concluded that the trend of its activity is consistent with the experimental value to some extent under the coding of AAindex. In order to determine the accuracy of the comparison between the predicted values of the model and the experimental values in the process of fitting verification, it is necessary to establish an evaluation method for the accuracy of the model. Based on the experimental data, the prediction accuracy is determined by averaging the relative error. Establish the following equation.
Σ1 − |x − y|/y = p × n
x is the predicted value and y is the experimental value. p is the precision and n is the total amount of source data. According to the evaluation method of the above model, the prediction accuracy of the three indexes selected is determined. The accuracy of TANS770102 is higher than that of the other two coding methods (Table 3).
Figure 4. The linear fitting situation of TANS770102. The yellow dotted line is the corresponding trend of the experimental value. The blue dashed line is the trend corresponding to the predicted values. According to the trend line, the two are consistent. Other model fits are in Supplementary Information. Other model fitting plots are shown in Figure S2.
Catalysts 13 01228 g004

2.4. Prediction of P450 CYP116B3

Because the prediction accuracy and activity intensity of TANS770102 are higher, the fitting degree is closer. The TANS770102 model was selected to predict the molecule. The excerpts are shown in the Table 4.

2.5. MD Simulation Setup and Prepration

Using the AlphaFold2, the structures of eight predicted variants with the highest degree of fit were generated. Tryptophan has been determined to have some adverse effects in preliminary work because of the large volume and molecular weight. In the predicted results, a large amount of tryptophan appeared after the ninth variant. Therefore, the first nine amino acids were selected for modeling. During the modeling process, AlphaFold2 indicated that the second variant structure was unstable, so the modeling of the eight models was ultimately completed (Figure 5).

2.6. MD Simulation

MD simulations were performed on eight predicted variants. Through the comparison of the mutant type to the wild type RSMF, the loop B-B′ and loop B′-C regional flexibility of each model is higher than that of the wild type. Among the variants, A86T/T91H/M108S/A109M/T111P showed a remarkable reduction in the maximum RMSF value from 3.06 to 1.07 Å (Table S2). The variants A86T/T91P/M108V/A109M/T111P and A86T/T91P/M108N/A109M/T111P were significantly improved. These two variants did not appear in 165 variants (Table S1). These two variants may greatly improve the substrate transportability of the region with the corresponding position of Loop B′-C.
According to the analysis of all the prediction models, it was found that A86T appeared more frequently. It also occurs more frequently in the range of high activity of experimental data. This situation is more in line with the experimental situation. Therefore, it is suggested that A86T has an effect on the activity of P450. Since the variants obtained in the study align with the predicted outcomes, the molecular dynamics simulation serves to validate the credibility of optimizing cytochrome P450. This validation confirms that the entire process can be utilized as a viable strategy for PyPEF, and even for related machine learning (ML) and verification methods.

2.7. Machine Learning Strategy

Protein engineering plays a crucial role in fine-tuning the properties of enzymes using DE and rational design approaches. However, achieving all recombination multi-point saturation mutations through experiments targeting multiple key positions to obtain P450 variants presents challenges due to the vast protein sequence space to explore. In this work, multiple rounds of mutagenesis were carried out targeting five key points (A86/T91/M108/A109/T111) in the substrate channel region of P450 CYP116B3. The 165 variants generated by the group’s previous experiments were initially used as a database to train the ML model. After multiple rounds of learning, the most suitable model was determined and the variant with improved substrate channel flexibility was obtained through prediction. Importantly, our ML study focused on known positions, validating and reinforcing existing mechanistic proposals.
Combined with the overall process of this study, the ML-Guided Design Correctly Predicts Combinatorial Effects strategy is proposed. This strategy consists of the following steps:
  • Obtain an amount of data by experiment. Sort and group the data according to mutation position and mutation situation. Based on the effect of mutation on activity, select the relevant sequences suitable for recombination to create a mutation library. The library should be created according to the mutation code and relative parameters according to the PyPEF engineering framework, and the wild type data should be stored in “*.Fasta” format.
  • The library needs to be learned several times by machine learning, and after a certain number of learning cycles, the coding method is counted and the prediction model is selected.
  • The original data are used to fit the prediction model and determine the accuracy of the model.
  • The appropriate prediction model is used to reorganize the mutation.
  • Model building and validation of variants by AI. The number of models is determined according to the model accuracy to ensure that the best variants are obtained.
This strategy predicts target molecules in a comprehensive numerical manner. PyPEF makes predictions based on sequential columns, which can greatly reduce the time and materials for screening positive variants. It can guide the experimental synthesis with a certain precision.
In summary, the PyPEF-based recombination strategy considering the amino acids positions A86, T91, M108, A109, and T111 in P450 CYP116B3 yielded after screening of only 165 recombinants P450 CYP116B3 variants that were improved by modifying the flexibility of the substrate tunnel. The substrate can pass through the loop more easily. The obtained results prove that the optimized strategy is an excellent strategy for improving the catalytic performance of P450 CYP116B3 by targeting positions that modulate the translocation efficiency of substrates and products through the substrate channel of P450 CYP116B3.

3. Materials and Methods

3.1. Identification and Prediction Methods PyPEF

PyPEF uses the AAindex database for encoding conversion during training and prediction. It uses iterations to guarantee model accuracy. In this process, a set of 566 physicochemical property descriptions will be utilized to describe variants with high reliability and high adaptability. This iterative procedure aims to optimize the choice of amino acid index for encoding sequences based on the predictions made on the entries of the test set, ensuring reliable model generalization. The framework performs model training, validation, and prediction functions for variant recombination. It can use fast Fourier transform or use its own sequence as input for changing faces. The predicted model can use a variety of scoring methods, including determination (R2), Pearson’s correlation (r), Spearman’s rank correlation coefficient (ρ), and root-mean-square error (RMSE) [11].

3.2. Data Format

The data format of the ML part is stored in accordance with the required format of PyPEF. Mutation data is stored in CSV format. All data adopt the arrangement of “mutation code-activity”.
The modeling of AlphaFold2 is stored in PBH format. The file is also used for MD simulation in YASARA.

3.3. Learning Set and Validation Set

The 165 variants used in the training set and wild type were sequenced and their activities were determined by Li Z. et al. [14]. The command “PyPEF mklsts” directive is used to perform automatic randomization of the data. This function does not disrupt the amino acid sequence input [11]. After a simple experiment, it is found that the order has a certain influence on the training and verification results. One hundred and sixty-five variants were rearranged. Each rearrangement creates a corresponding learning set and validation set to reduce the impact of the order of data arrangement on the evaluation accuracy.

3.4. Regression Mode Selection

In this study, the regression methods are MLP and PLS. The two regression methods were tested many times. The conclusions of each assessment are collected to select the best prediction model. The “PyPEF ml --e aaidx -l -t --regressor” command is used to select regression mode [11]. Finally, R2 and Spearman parameters are used to evaluate the regression.

3.5. Selection of Model

The software features of PyPEF will retain the top five models with the highest scores for each training. Spearman coefficient is used as the standard to determine the fitting degree of the model. After nearly 20 learning sessions, 44 models were preserved. The models with the highest frequency will be verified. By comparing the verification results, the final model for prediction is determined.

3.6. Prediction

According to 165 variants, all single point mutations are summarized. Seventy-four single point mutations (excluding cysteine) were distributed at five sites. All single point variants were recombined with five mutations. This step uses the “PyPEF mkps” command to establish a prediction set [11]. Finally, a total of 489,902 recombinant variants were completed. The variants were predicted by PyPEF. In addition, the prediction conclusion is verified by MD simulations.

3.7. MD Simulations

According to the prediction results, the first ten variants are obtained for verification. The molecular dynamics model was used to verify it. The steps are shown below:
  • The molecular dynamics model was established by AlphaFold2. Although there are no related proteins in Alphafold2’s library, online structure prediction can be used. This method requires only the use of sequences. After the establishment of models, choose the optimal model according to the prompt of AlphaFold2.
  • Use YASARA to minimize the energy of these variants in YAMBER3 force field. The YAMBER3 force field is an improvement made by the YASARA team based on the AMBER force field.
  • Use supercomputing platform to predict the motion of the model in 20 ns. After the simulation of 20 ns, the protein configuration tends to be stable, so the experimental simulation simulates the motion state of P450 in 20 ns. The method and procedure of md have been described in the previous article, and the method is the same as the previous study (Flexibility Regulation of Loops Surrounding the Tunnel Entrance in Cytochrome P450 Enhanced Substrate Access Substantially) [14].
  • Confirm the binding degree of the mutation site by RMSF [14].

4. Conclusions

In this study, a promising variant was obtained by optimizing the cytochrome P450 CYP116B3 by ML. Impressively, 480,000 multi-point saturation mutations of A86/T91/M108/A109/T111 were predicated by the ML method. These variants were screened to obtain eight potential variants. Molecular dynamics simulations were performed on these variants. The position with the highest RMSF decreased to 34.97% (from 3.07 to 1.07 Å), which indicated that the entrance region of the loop of the corresponding strain was more stable and conductive to substrate transport. Combined with the previous experimental research, the increased openness of this tunnel has a beneficial effect to improve the activity of P450 CYP116B3. These results have a certain guiding significance for practical experiments. Through the optimization of P450 CYP116B3, it is verified that PyPEF is based on the sequence, and combined with molecular dynamics models and other methods it can form a design strategy that is instructive for the experiment, reduces experimental workloads, and speeds up enzyme engineering.

Supplementary Materials

The following supporting information can be downloaded at: https://www.mdpi.com/article/10.3390/catal13081228/s1. Figure S1: Model fit. Figure S2: Model accuracy verification. Figure S3: RMSF change chart of different molecular dynamics models. Table S1: Abbreviation comparison table. Table S2: RMSF values of different molecular dynamics models in Loop. Distribution calculation results and prediction data package.

Author Contributions

Conceptualization, L.L. and U.S.; Data curation, Z.L. and Y.L.; Formal analysis, Z.L, Y.L. and C.C.; Funding acquisition, L.L.; Methodology, Y.L. and Z.L.; Project administration, L.L., H.X. and Y.J.; Resources, Z.L. and M.D.D.; Software, M.D.D., X.Z., Z.L. and Y.L.; Supervision, L.L., Y.J., S.M. and M.D.D.; Validation, Y.J. and S.M.; Writing—original draft, Y.L.; Writing—review and editing, L.L., Y.J., S.M., Z.L. and M.D.D. All authors have read and agreed to the published version of the manuscript.

Funding

This study was funded by the National Key Research and Development Program of China (grant number 2021YFC2101000) and by the National Natural Science Foundation of China (grant numbers 52073022). Shuaiqi Meng was supported by a Ph.D. scholarship from the China Scholarship Council (CSC No. 201906880011).

Data Availability Statement

All the relevant data used in this study have been provided in the form of figures and tables in the published article, and all data provided in the present manuscript are available to whom they may concern.

Conflicts of Interest

The authors declare no conflict of interest.

References

  1. Wang, X.; Wang, B.; Wang, Z.; Chen, T.; Zhao, X. Advances in the Research of Protein Directed Evolution. Prog. Biochem. Biophys. 2015, 42, 123–131. [Google Scholar]
  2. Misiura, M.; Shroff, R.; Thyer, R.; Kolomeisky, A.B. DLPacker: Deep learning for prediction of amino acid side chain conformations in proteins. Proteins 2022, 90, 1278–1290. [Google Scholar] [CrossRef] [PubMed]
  3. Shen, J.; Zhang, J.; Luo, X.; Zhu, W.; Yu, K.; Chen, K.; Li, Y.; Jiang, H. Predicting protein-protein interactions based only on sequences information. Proc. Natl. Acad. Sci. USA 2007, 104, 4337–4341. [Google Scholar] [CrossRef] [PubMed]
  4. Zhao, X.; Qin, W.; Qian, X. Application of deep learning method in biological mass spectrometry and proteomics. Prog. Biochem. Biophys. 2018, 45, 1214–1223. [Google Scholar]
  5. Siedhoff, N.E.; Schwaneberg, U.; Davari, M.D. Machine learning-assisted enzyme engineering. Methods Enzym. 2020, 643, 281–315. [Google Scholar]
  6. Singhal, A.; Kumari, N.; Ghosh, P.; Singh, Y.; Garg, S.; Shah, M.P.; Jha, P.K.; Chauhan, D. Optimizing cellulase production from Aspergillus flavus using response surface methodology and machine learning models. Environ. Technol. Innov. 2022, 27, 102805. [Google Scholar] [CrossRef]
  7. Wu, Z.; Kan, S.B.J.; Lewis, R.D.; Wittmann, B.J.; Arnold, F.H. Machine learning-assisted directed protein evolution with combinatorial libraries. Proc. Natl. Acad. Sci. USA 2019, 116, 8852–8858. [Google Scholar] [CrossRef]
  8. Cui, H.; Cao, H.; Cai, H.; Jaeger, K.; Davari, M.D.; Schwaneberg, U. Computer-Assisted Recombination (CompassR) Teaches us How to Recombine Beneficial Substitutions from Directed Evolution Campaigns. Chemistry 2020, 26, 643–649. [Google Scholar] [CrossRef]
  9. Cui, H.; Jaeger, K.E.; Davari, M.D.; Schwaneberg, U. CompassR Yields Highly Organic-Solvent-Tolerant Enzymes through Recombination of Compatible Substitutions. Chemistry 2021, 27, 2789–2797. [Google Scholar] [CrossRef]
  10. Herrmann, K.R.; Brethauer, C.; Siedhoff, N.E.; Hofmann, I.; Eyll, J.; Davari, M.D.; Schwaneberg, U.; Ruff, A.J. Evolution of E. coli Phytase Toward Improved Hydrolysis of Inositol Tetraphosphate. Front. Chem. Eng. 2022, 4, 838056. [Google Scholar] [CrossRef]
  11. Siedhoff, N.E.; Illig, A.M.; Schwaneberg, U.; Davari, M.D. PyPEF-An Integrated Framework for Data-Driven Protein Engineering. J. Chem. Inf. Model. 2021, 61, 3463–3476. [Google Scholar] [CrossRef]
  12. Illig, A.M.; Siedhoff, N.E.; Schwaneberg, U.; Davari, M.D. A hybrid model combining evolutionary probability and machine learning leverages data-driven protein engineering. bioRxiv 2022. [Google Scholar] [CrossRef]
  13. Liu, L.; Schmid, R.D.; Urlacher, V.B. Cloning, expression, and characterization of a self-sufficient cytochrome P450 monooxygenase from Rhodococcus ruber DSM 44319. Appl. Microbiol. Biotechnol. 2006, 72, 876–882. [Google Scholar] [CrossRef]
  14. Li, Z.; Meng, S.; Nie, K.; Schwaneberg, U.; Davari, M.D.; Xu, H.; Ji, Y.; Liu, L. Flexibility Regulation of Loops Surrounding the Tunnel Entrance in Cytochrome P450 Enhanced Substrate Access Substantially. ACS Catal. 2022, 12, 12800–12808. [Google Scholar] [CrossRef]
  15. Tao, S.; Gao, Y.; Li, K.; Lu, Q.; Qiu, C.; Wang, X.; Chen, K.; Ouyang, P. Engineering substrate recognition sites of cytochrome P450 monooxygenase CYP116B3 from Rhodococcus ruber for enhanced regiospecific naphthalene hydroxylation. Mol. Catal. 2020, 493, 111089. [Google Scholar] [CrossRef]
  16. Liu, L.; Schmid, R.D.; Urlacher, V.B. Engineering cytochrome P450 monooxygenase CYP 116B3 for high dealkylation activity. Biotechnol. Lett. 2010, 32, 841–845. [Google Scholar] [CrossRef]
  17. Jumper, J.; Evans, R.; Pritzel, A.; Green, T.; Figurnov, M.; Ronneberger, O.; Tunyasuvunakool, K.; Bates, R.; Žídek, A.; Potapenko, A.; et al. Highly accurate protein structure prediction with AlphaFold. Nature 2021, 596, 583–589. [Google Scholar] [CrossRef]
  18. Kreß, N.; Halder, J.M.; Rapp, L.R.; Hauer, B. Unlocked potential of dynamic elements in protein structures: Channels and loops. Curr. Opin. Chem. Biol. 2018, 47, 109–116. [Google Scholar] [CrossRef]
  19. Hastie, T.; Tibshirani, R.; Friedman, J. The Elements of Statistical Learning: Data Mining, Inference, and Prediction, 2nd ed.; Springer: Berlin/Heidelberg, Germany, 2009. [Google Scholar]
  20. Thapa, N.; Chaudhari, M.; McManus, S.; Roy, K.; Newman, R.H.; Saigo, H.; Kc, D.B. Correction: DeepSuccinylSite: A deep learning based approach for protein succinylation site prediction. BMC Bioinform. 2022, 23, 349. [Google Scholar] [CrossRef]
  21. Hie, B.L.; Yang, K.K. Adaptive machine learning for protein engineering. Curr. Opin. Struct. Biol. 2022, 72, 145–152. [Google Scholar] [CrossRef]
  22. Oh, S.-H. Protein Disorder Prediction Using Multilayer Perceptrons. Int. J. Contents 2013, 9, 11–15. [Google Scholar] [CrossRef]
  23. Crampon, K.; Giorkallos, A.; Deldossi, M.; Baud, S.; Steffenel, L.A. Machine-learning methods for ligand-protein molecular docking. Drug Discov. Today 2022, 27, 151–164. [Google Scholar] [CrossRef] [PubMed]
  24. He, J. Research and Application of Machine Learning Algorithm Based on Gaussian Process Model. Ph.D. Thesis, Dalian University of Technology, Dalian, China, 2012; pp. 130–131. [Google Scholar]
  25. Wittmund, M.; Cadet, F.; Davari, M.D. Learning Epistasis and Residue Coevolution Patterns: Current Trends and Future Perspectives for Advancing Enzyme Engineering. ACS Catal. 2022, 12, 14243–14263. [Google Scholar] [CrossRef]
  26. Carkli Yavuz, B.; Yurtay, N.; Ozkan, O. Prediction of Protein Secondary Structure with Clonal Selection Algorithm and Multilayer Perceptron. IEEE Access 2018, 6, 45256–45261. [Google Scholar] [CrossRef]
  27. Xiong, W.; Liu, B.; Shen, Y.; Jing, K.; Savage, T.R. Protein engineering design from directed evolution to de novo synthesis. Biochem. Eng. J. 2021, 174, 108096. [Google Scholar] [CrossRef]
  28. Diaz, D.J.; Kulikova, A.V.; Ellington, A.D.; Wilke, C.O. Using machine learning to predict the effects and consequences of mutations in proteins. Curr. Opin. Struct. Biol. 2023, 78, 102518. [Google Scholar] [CrossRef] [PubMed]
Figure 1. Illustration of the ML-assisted protein engineering strategy.
Catalysts 13 01228 g001
Figure 2. Sequence logo representation of mutation sites selected for recombination. (a) the amino acid frequencies of 5 mutation sites in 165 sequenced mutants, (b) the amino acid frequencies of these 5 mutation sites in 29 mutants with a 10 fold or more increase in activity. The height of a letter is proportional to its frequency of occurrence at that site, that is, the higher the letter, the higher the frequency of the amino acid it represents at that site in the mutation library. For easy to recognize different amino acids, these amino acids are labeled in different.
Catalysts 13 01228 g002
Figure 3. The regression of the model for the prediction of activity of P450 CYP116B3 after training the model by PyPEF. The Spearman coefficient of TANS770102 is 0.418, which proves that the evaluation of the five points using this model has a certain correlation. Other regression results are shown in Figure S1.
Catalysts 13 01228 g003
Figure 5. Visualization of variant A86T. Orange: five mutation sites. Blue: part of Loop. Other variant models are shown in Figure S3.
Catalysts 13 01228 g005
Table 1. (a) The frequency of the optimal model after multiple rounds of training under MLP regression. (b) The frequency of the optimal model after multiple rounds of training under PLS regression.
IndexTimesIndexTimes
(a)
TANS7701026RICJ8801021
QIAN8801263RACS8201021
QIAN8801022KARS1601111
CHAM8301072ISOY8001081
PALJ8101072RICJ8801101
WILM9501022CHAM8301061
GEOR0301052KRIW7901021
WERD7801012FAUJ8801041
HUTJ7001012GEOR0301061
QIAN8801251GEOR0301011
RICJ8801011
(b)
TANS7701028OOBM8501051
PRAM8201037VASM8301021
AURR9801206AURR9801021
KARS1601205QIAN8801291
RICJ8801084MONM9901011
GEOR0301052SNEP6601041
CHOC7601042GEOR0301021
QIAN8801132PRAM8201011
QIAN8801252ISOY800108 1
QIAN8801232RACS820112 1
RICJ8801021PALJ8101071
FINA7701011QIAN8801011
CHAM8301081QIAN8801381
HUTJ7001011RICJ880101 1
CIDH9201011RACS8201011
It can be observed that TANS770102 appears multiple times in both regression methods, and the two regression models have consistency.
Table 2. The final model fitting results. TANS770102 has the best fitting performance under the ranking of Spearman coefficients. Affected by the arrangement, each series in different batches has different fluctuations. See the Supplementary Materials for other results.
IndexSpearman’sR2RMSENRMSEPearson’s r
TANS7701020.420.175.520.900.41
PRAM8201030.400.235.330.870.450
GEOR0301050.380.175.510.900.42
RICJ8801080.360.155.580.910.39
CHOC7601040.320.155.550.910.40
Table 3. Based on the above equation. Calculated regression accuracy of the three models in this study. TANS770102 has the highest accuracy.
ModelPrecision
TANS7701020.1933
PRAM820130.1790
RICJ8801080.1526
Table 4. Variant with higher activity predicted. The data on the left represent the variant, and the data on the right represent the predicted activity.
VariantActivity
A86T/T91H/M108G/A109M/T111P15.37
A86T/T91H/M108V/A109M/T111P15.32
A86T/T91H/M108N/A109M/T111P15.29
A86W/T91H/M108G/A109M/T111P15.28
A86T/T91P/M108G/A109M/T111P15.26
A86T/T91P/M108V/A109M/T111P15.21
A86T/T91H/M108S/A109M/T111P15.20
A86W/T91H/M108V/A109M/T111P15.19
A86T/T91P/M108N/A109M/T111P15.18
A86W/T91H/M108N/A109M/T111P15.17
A86W/T91P/M108G/A109M/T111P15.14
A86W/T91P/M108V/A109M/T111P15.12
A86T/T91P/M108S/A109M/T111P15.09
A86W/T91H/M108S/A109M/T111P15.08
A86W/T91P/M108N/A109M/T111P15.06
A86T/T91W/M108G/A109M/T111P15.03
Disclaimer/Publisher’s Note: The statements, opinions and data contained in all publications are solely those of the individual author(s) and contributor(s) and not of MDPI and/or the editor(s). MDPI and/or the editor(s) disclaim responsibility for any injury to people or property resulting from any ideas, methods, instructions or products referred to in the content.

